
Crypto World
XRP Price Analysis Reveals Why the 30% Bounce Failed
The XRP price rebounded more than 30% after bouncing from its early February low near $1.12. The move revived hopes of a recovery and briefly pushed the token toward the $1.50 zone. On the surface, the rally looked constructive. Momentum indicators improved. A breakout pattern began to form. Traders started discussing a possible trend reversal.
But blockchain data tells a different story. Instead of showing strong accumulation, on-chain metrics suggest that many holders used the rebound to exit losing positions. Selling at a loss remains dominant. Several groups are still reducing exposure. This raises a key question: was the bounce genuine demand, or simply exit liquidity for trapped sellers?
Technical Setup Shows Bounce Potential, But It Needs Confirmation
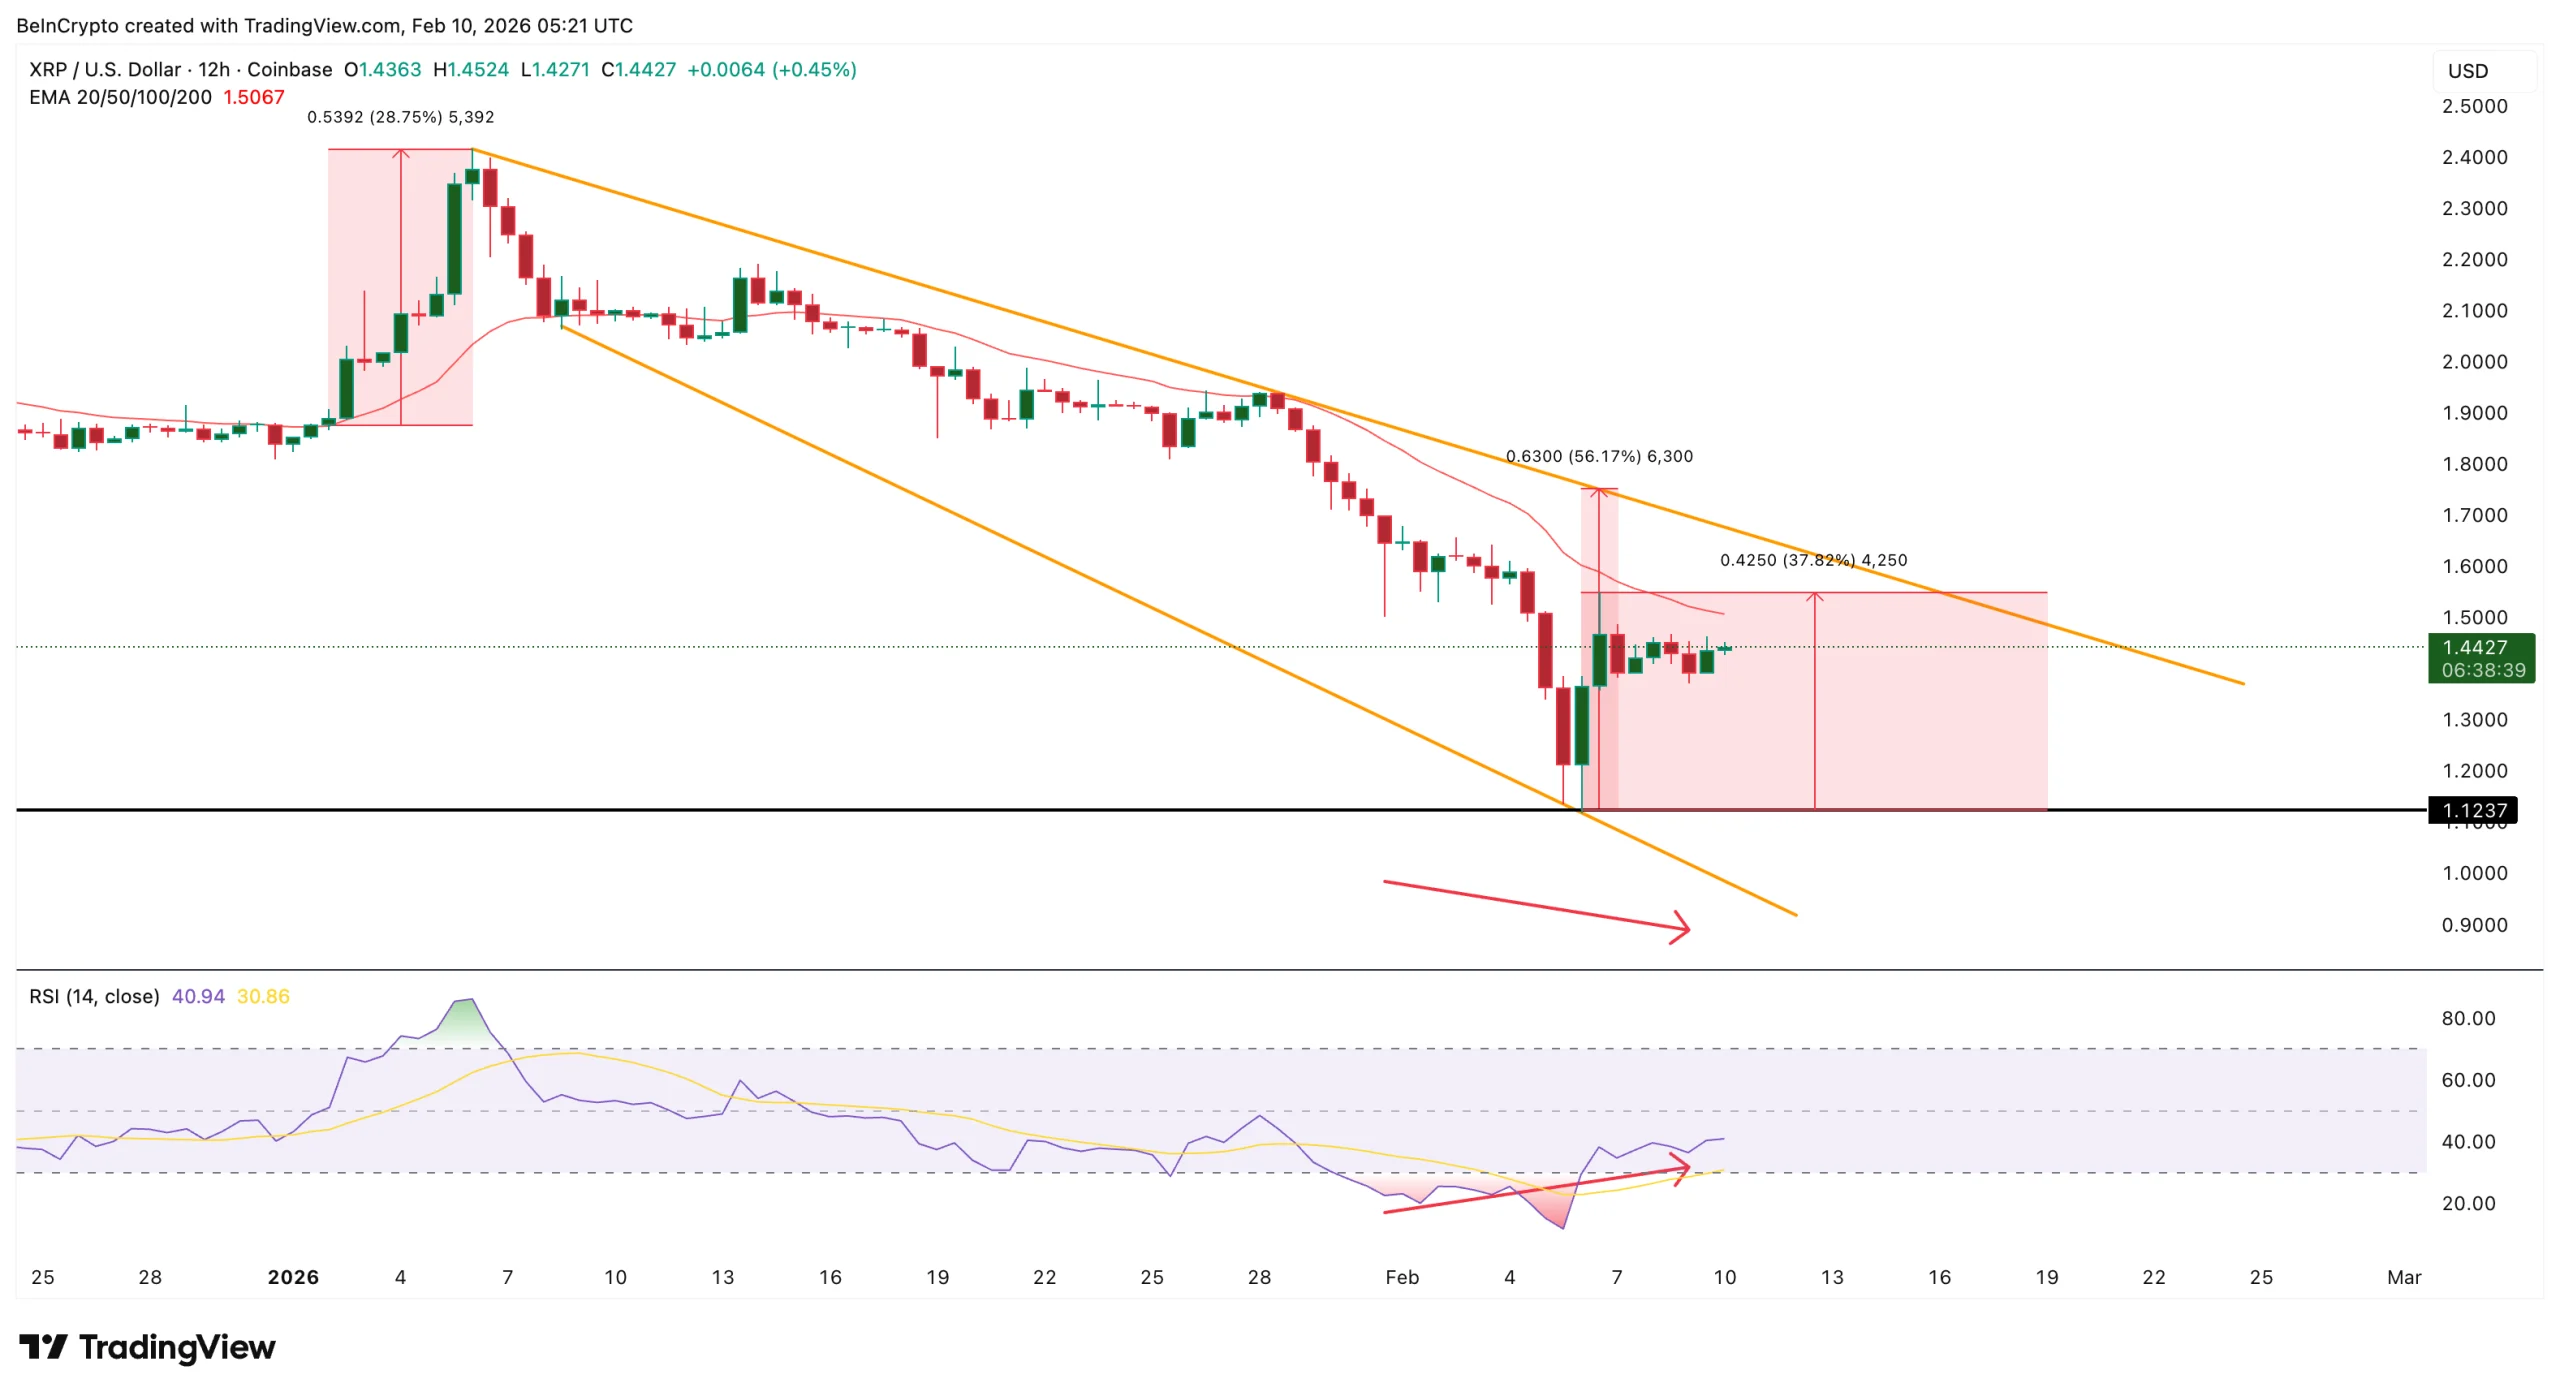
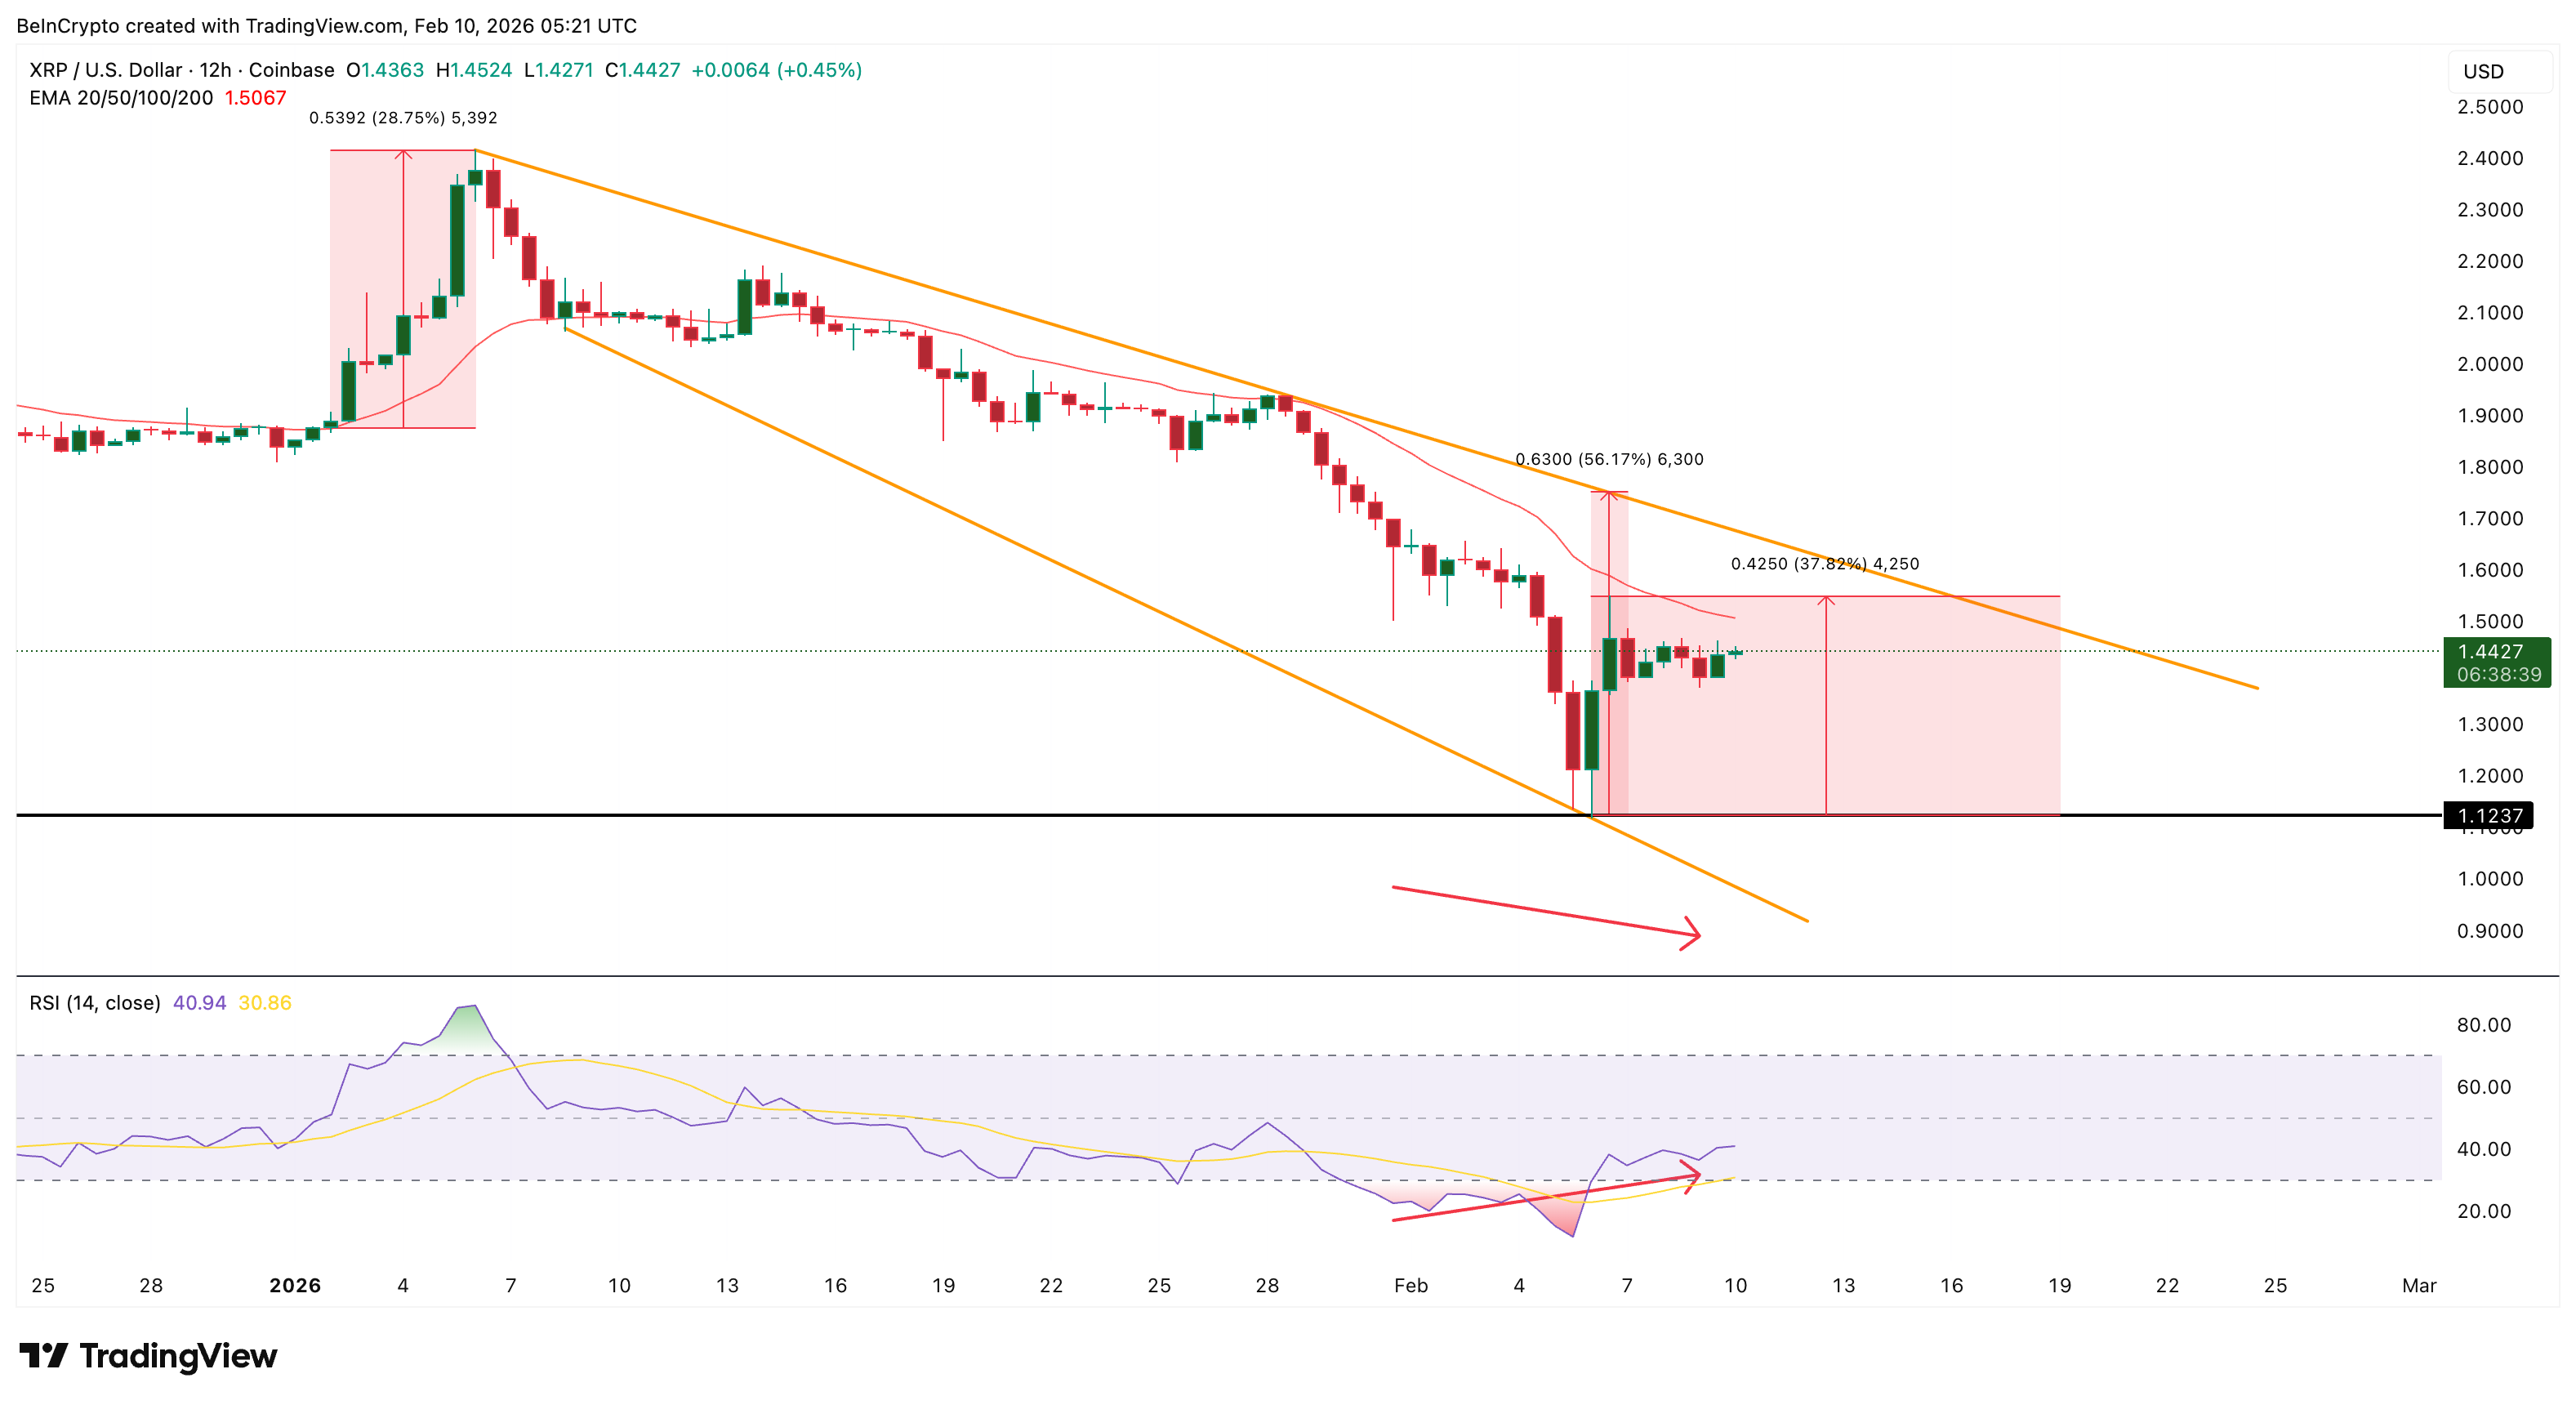
On the 12-hour chart, XRP is trading inside a falling wedge pattern, with a 56% breakout potential above the upper trendline.
Sponsored
Sponsored
For this pattern to activate, XRP needs to first reclaim its short-term moving average, the 20-period exponential moving average (EMA), which gives more weight to recent prices. This level acts as dynamic resistance in downtrends. In early January, a clean break above this EMA triggered a rally of nearly 30%.
Momentum is also showing early improvement.
Between January 31 and February 9, XRP printed a lower low in price. At the same time, the Relative Strength Index (RSI), a momentum indicator that measures buying and selling pressure, formed a higher low. This bullish divergence suggests that sellers are losing strength.
Want more token insights like this? Sign up for Editor Harsh Notariya’s Daily Crypto Newsletter here.
On its own, this setup points to a possible bounce.
But technical patterns only work when holders are willing to stay invested. To understand whether this bounce has real support, we need to look at how investors are behaving on-chain.
SOPR Shows Holders Are Still Selling at Losses Despite the Bounce
One of the clearest warning signals comes from the Spent Output Profit Ratio, or SOPR. SOPR measures whether coins being moved on-chain are sold in profit or at a loss. When it stays above 1, it shows profit-taking. When it remains below 1, it shows loss-selling.
Since late January, XRP’s SOPR has remained below 1 for more than ten consecutive days.
Sponsored
Sponsored
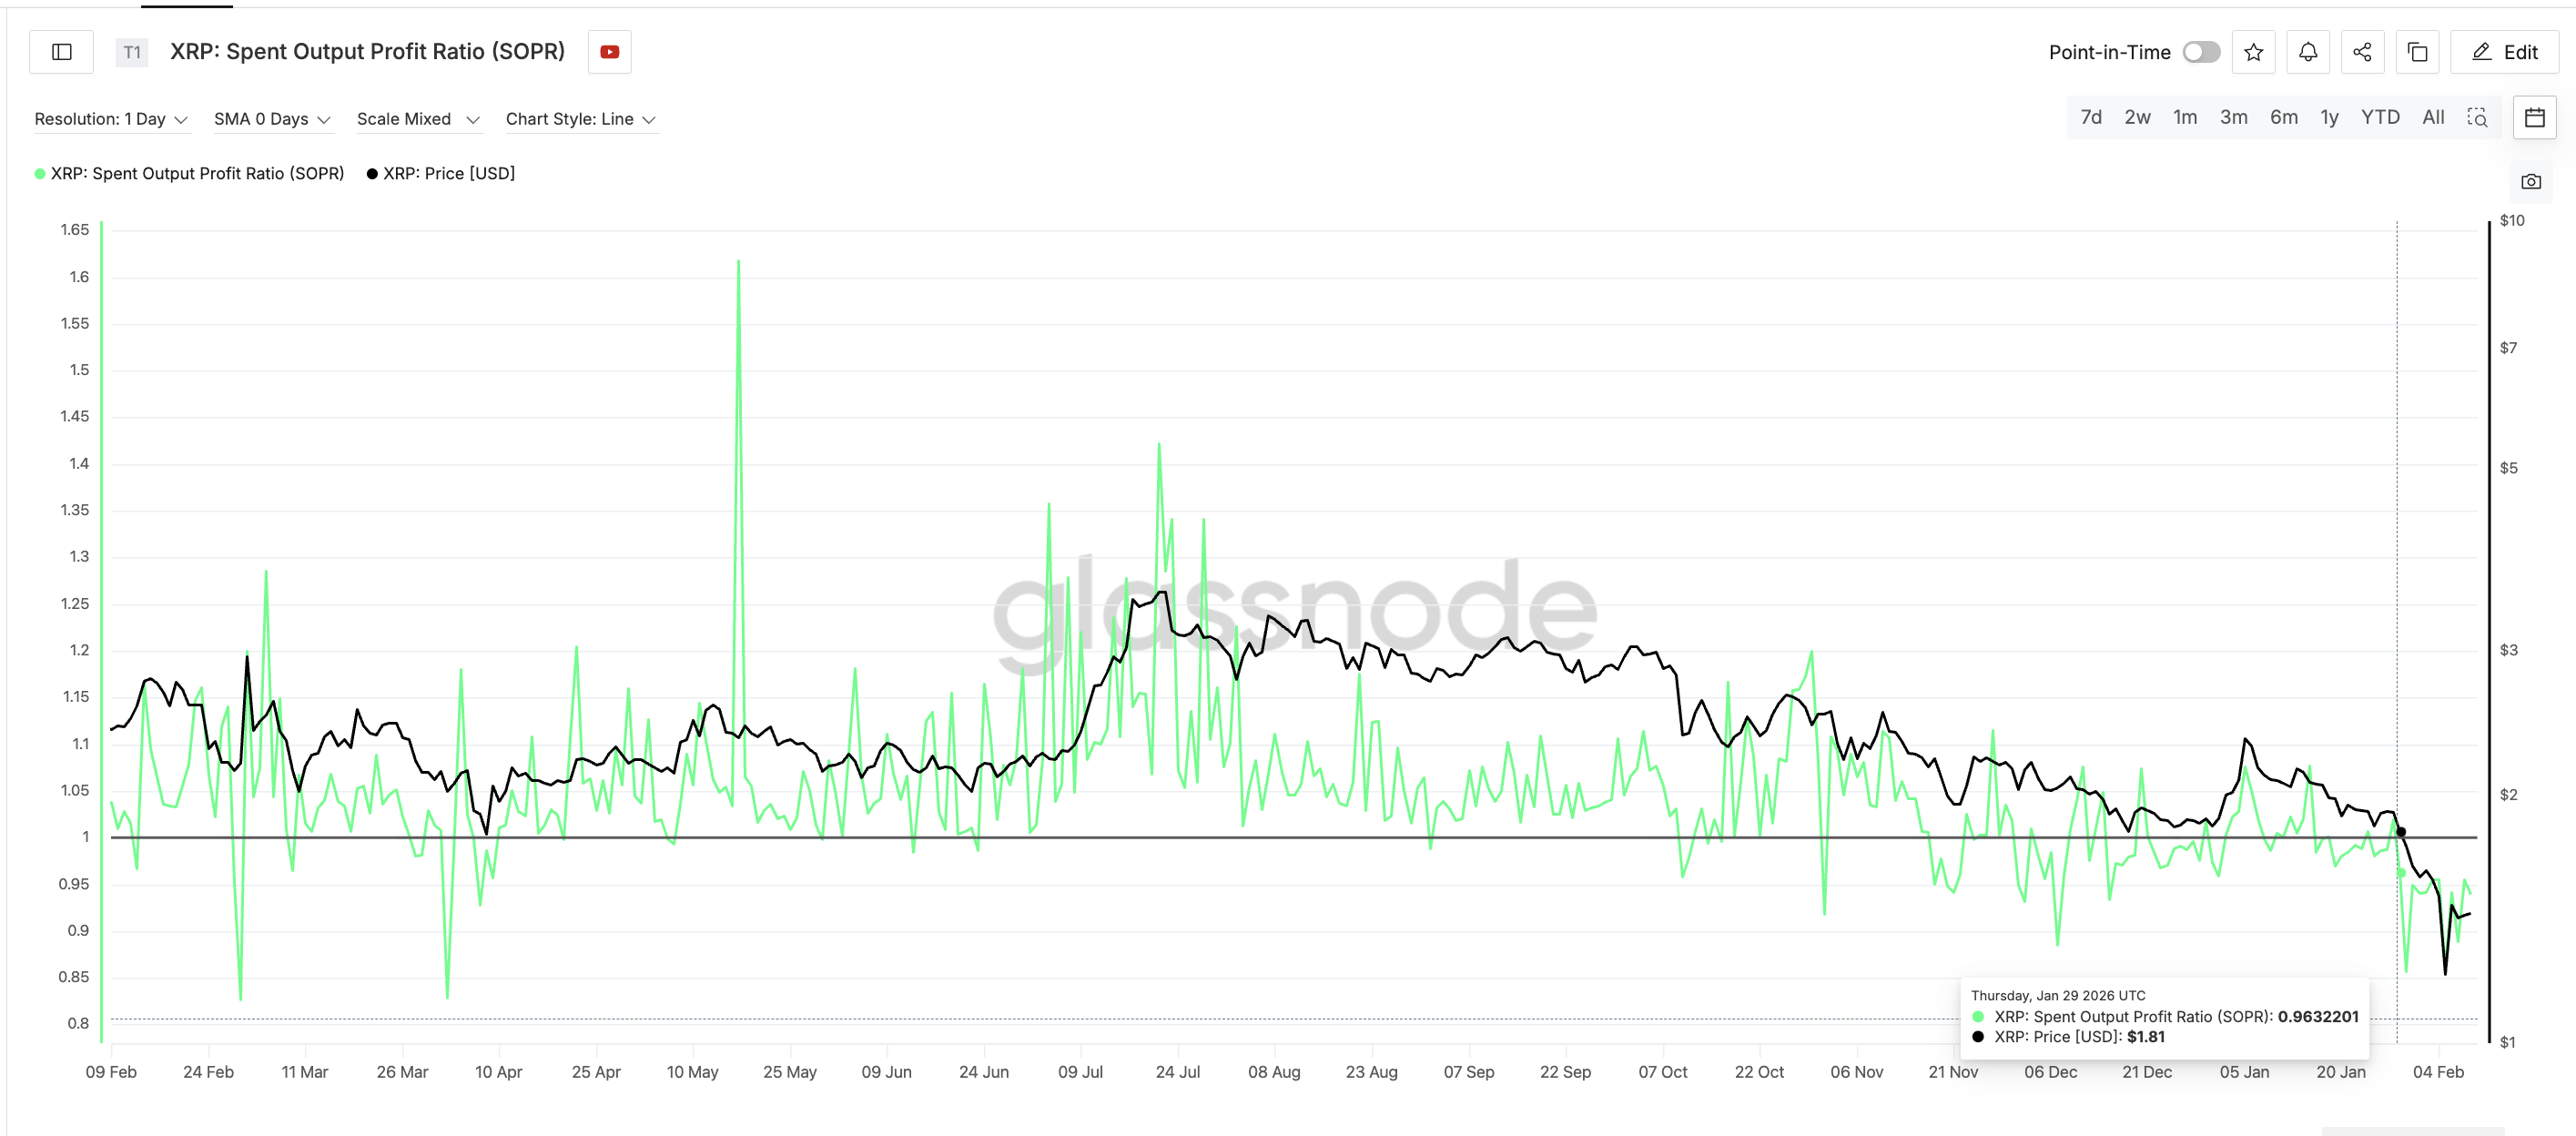
This is unusual. After a 30%+ rebound, short-term traders are normally sitting in profit. That usually pushes SOPR higher. But in XRP’s case, profitability never returned. Loss selling continued even as the price recovered. This means many holders are still exiting underwater positions.
In simple terms, the market is not seeing confident profit-taking. It is seeing stress-driven exits. To understand who is responsible, we need to look at holder cohorts.
Holder Data Confirms the XRP Bounce Is Being Used to Exit, Not Accumulate
HODL Waves group XRP wallets based on how long they have held their coins. This helps identify which investor groups are buying or selling.
The most striking shift appeared in the 24-hour holder cohort.
On February 6, this group controlled about 1% of XRP’s circulating supply. Within days, that share collapsed to roughly 0.09%. That represents a decline of more than 90%.
Sponsored
Sponsored
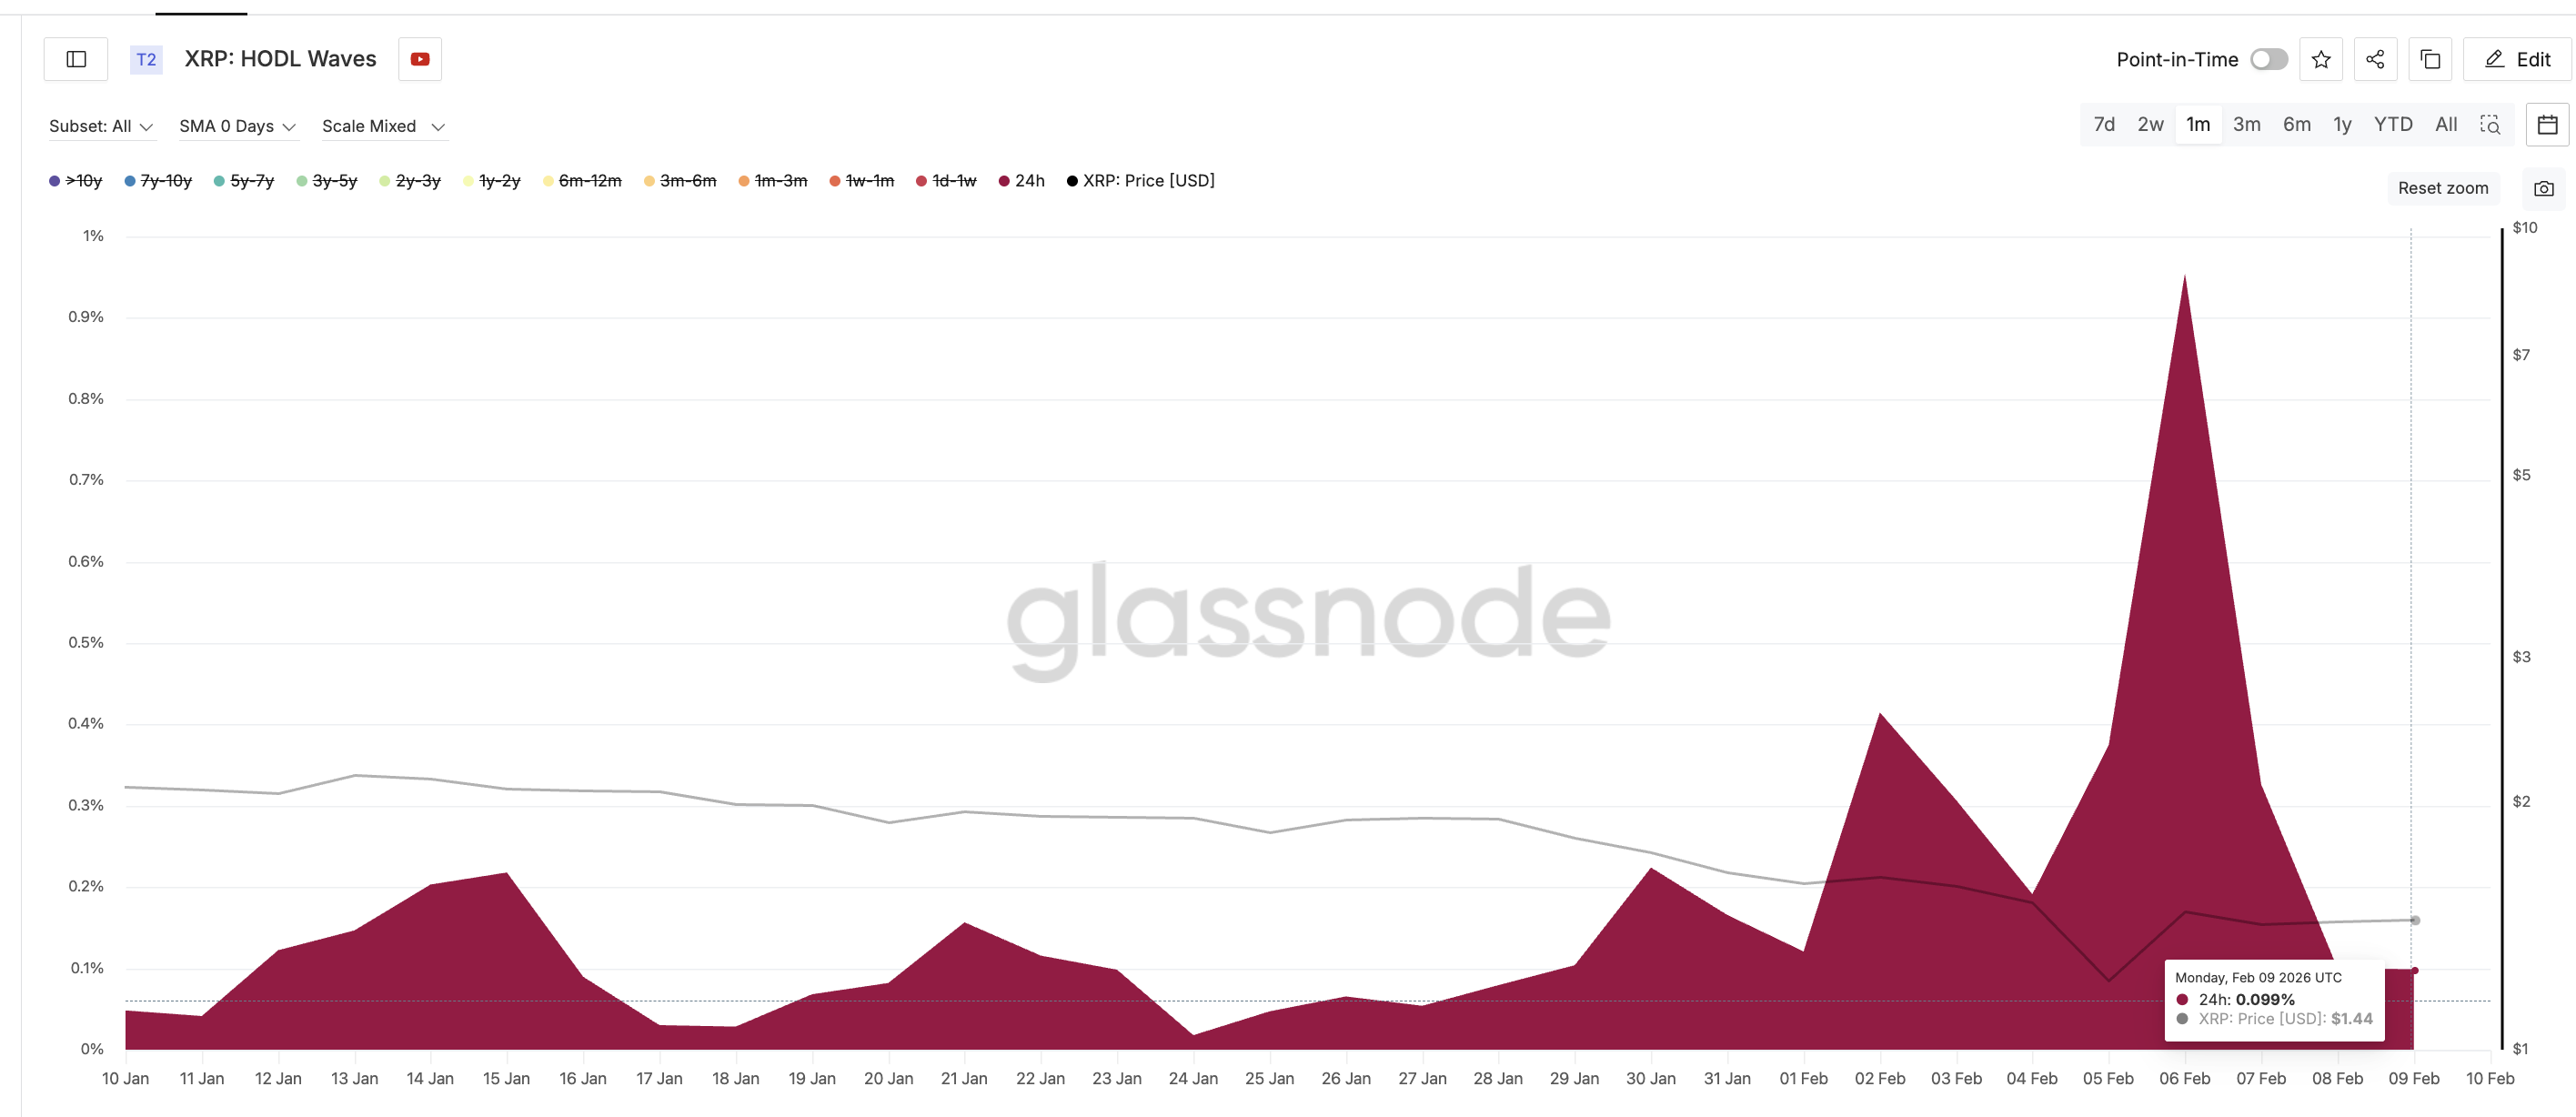
These were highly reactive traders who entered during volatility and rushed to exit during the rebound.
Selling was not limited to this group.
The 1-month to 3-month cohort, which accumulated heavily in January when XRP traded near $2.07, has also been reducing exposure. Their share of supply fell from around 14.48% in mid-January to about 9.48% recently. That is a decline of roughly 35%.
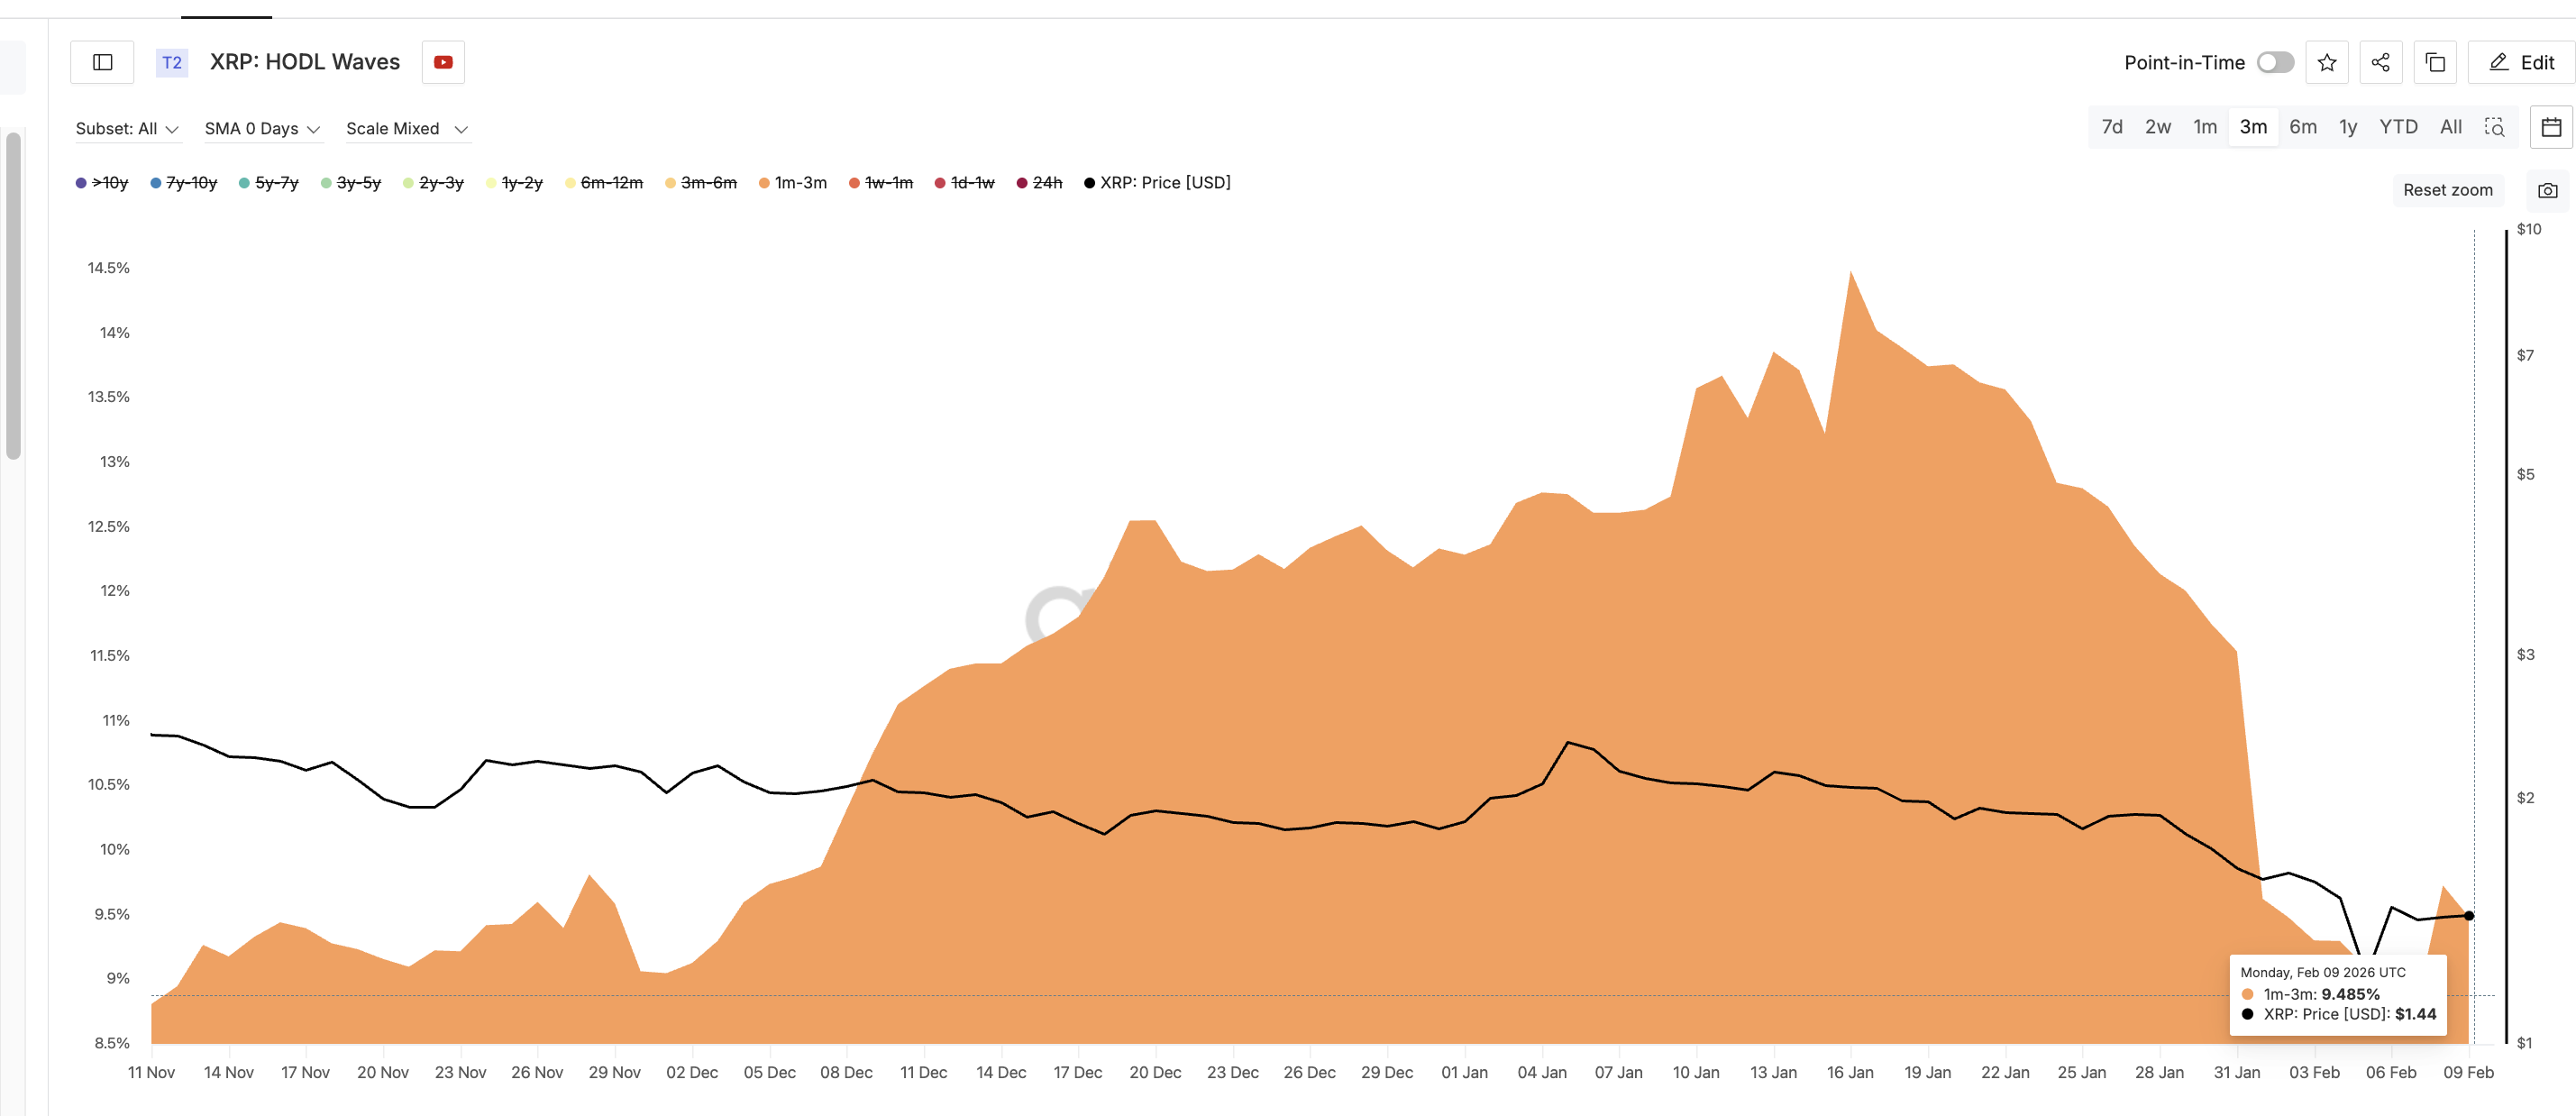
These holders remain underwater. Instead of waiting for a full recovery, they are using rallies to minimize losses. Together, these two cohorts explain why SOPR has remained depressed for a long time now.
Short-term traders are exiting failed trades. Medium-term holders are cutting losing positions.
This behavior is typical of distribution phases, not early bull markets. And it directly impacts price structure.
Sponsored
Sponsored
Cost Basis Data Shows Why $1.44–$1.54 Is a Wall for the XRP Price
Cost basis heat maps show where large groups of investors bought their coins. These zones often become resistance when the price returns to them.
For XRP, the strongest near-term cluster sits between $1.42 and $1.44. More than 660 million XRP were accumulated in this range. This creates a powerful sell zone.
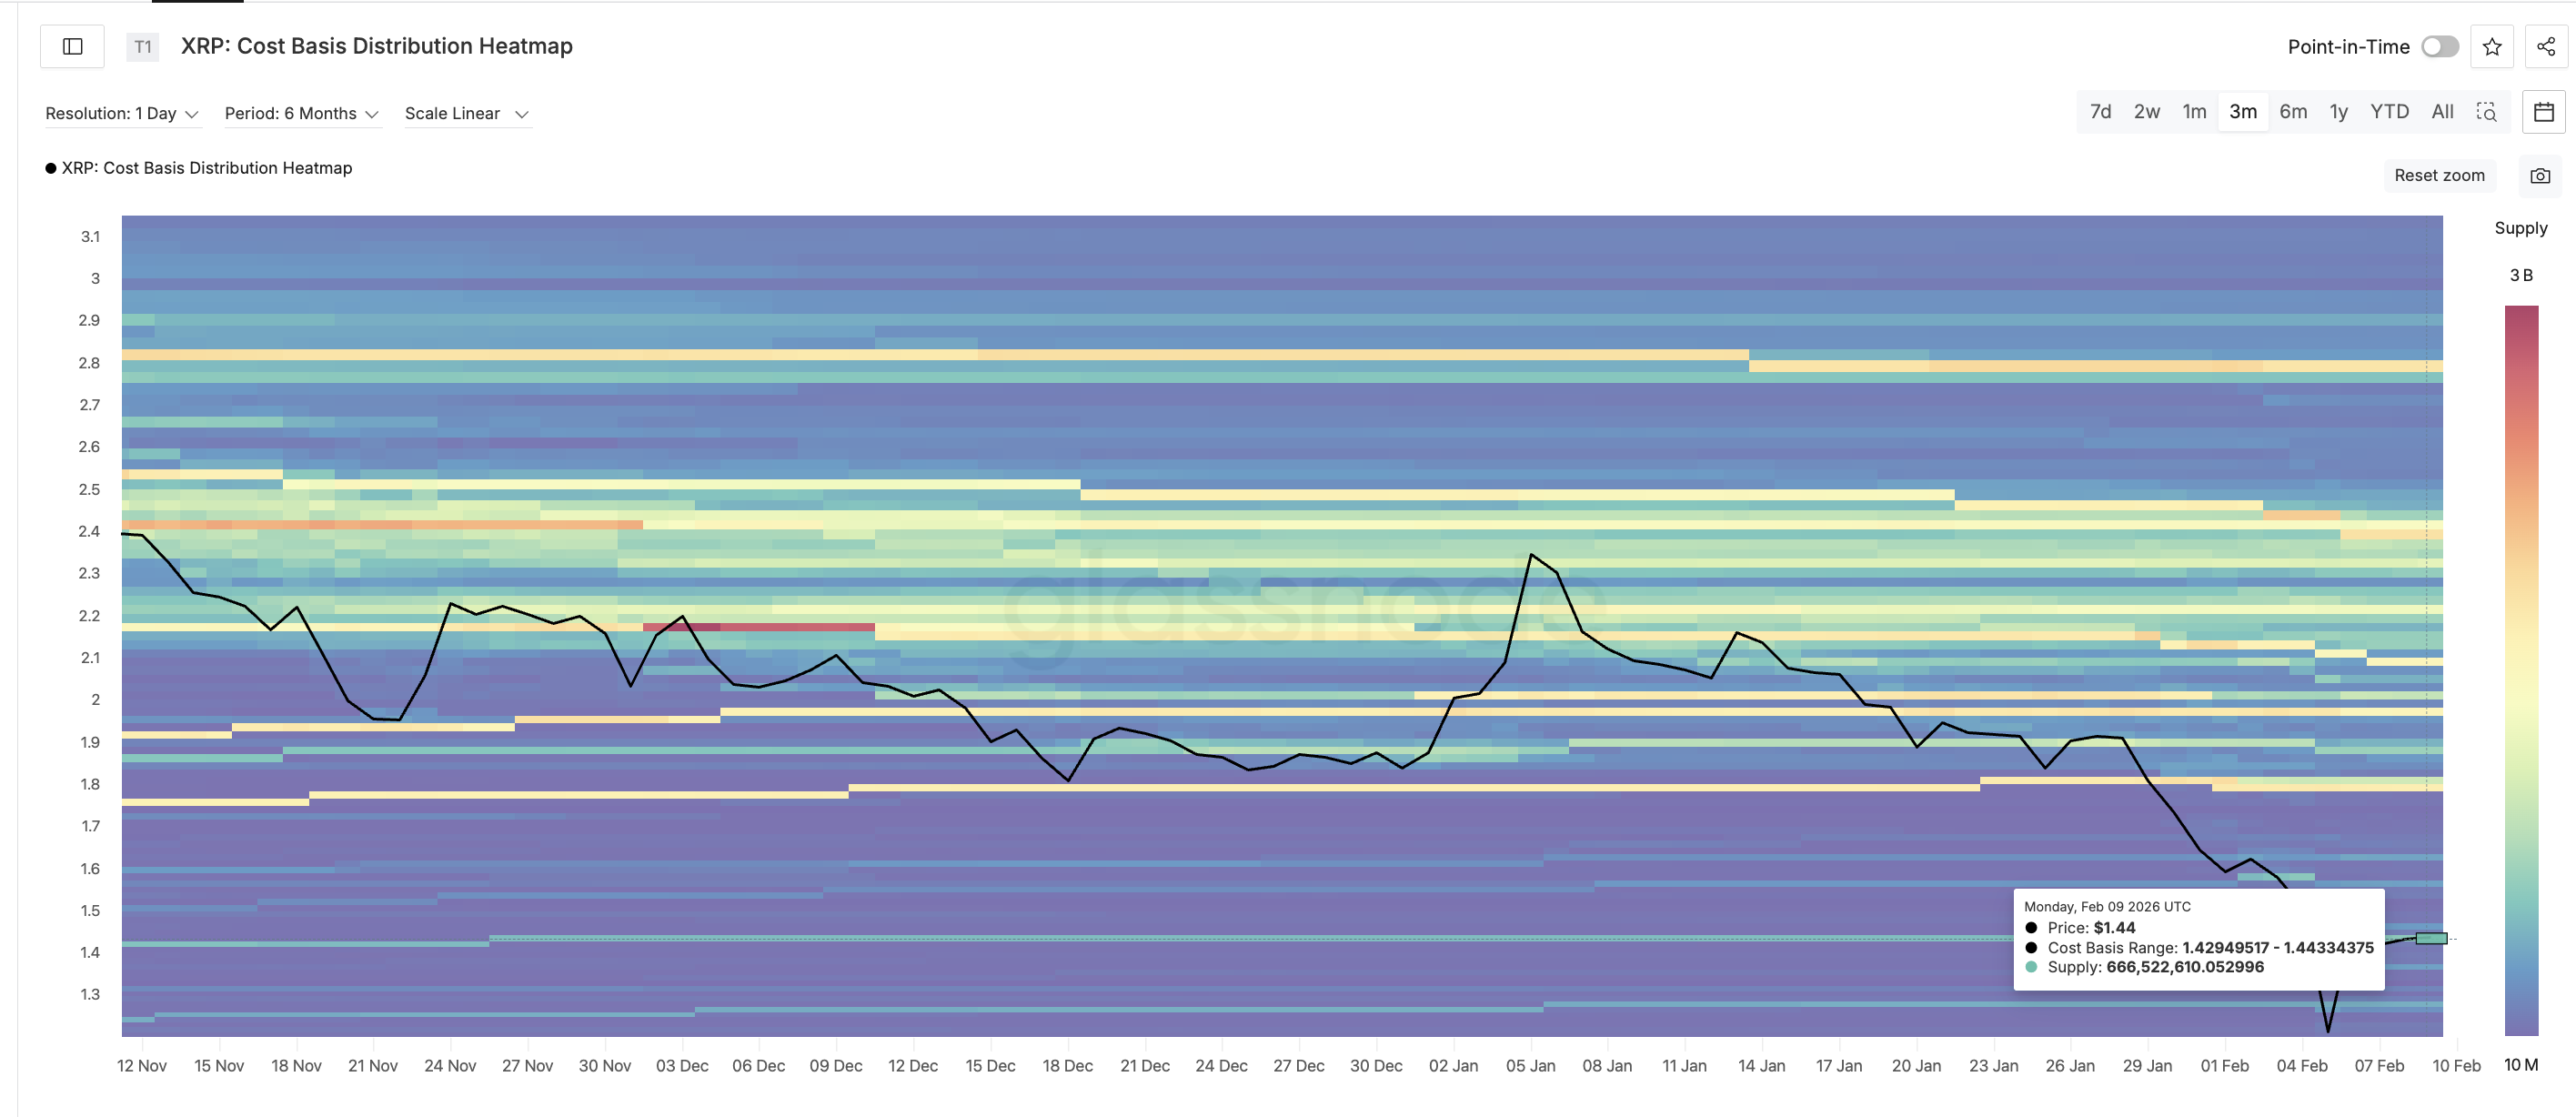
When the price approaches this area, many holders reach break-even. After weeks of losses, they chose to exit.
Above this cluster lies the $1.54 level, which aligns with EMA resistance. Together, these zones form a barrier that XRP has repeatedly failed to clear. Each time the XRP price rallies into this region, selling intensifies. This is consistent with the distribution seen in SOPR and HODL Waves.
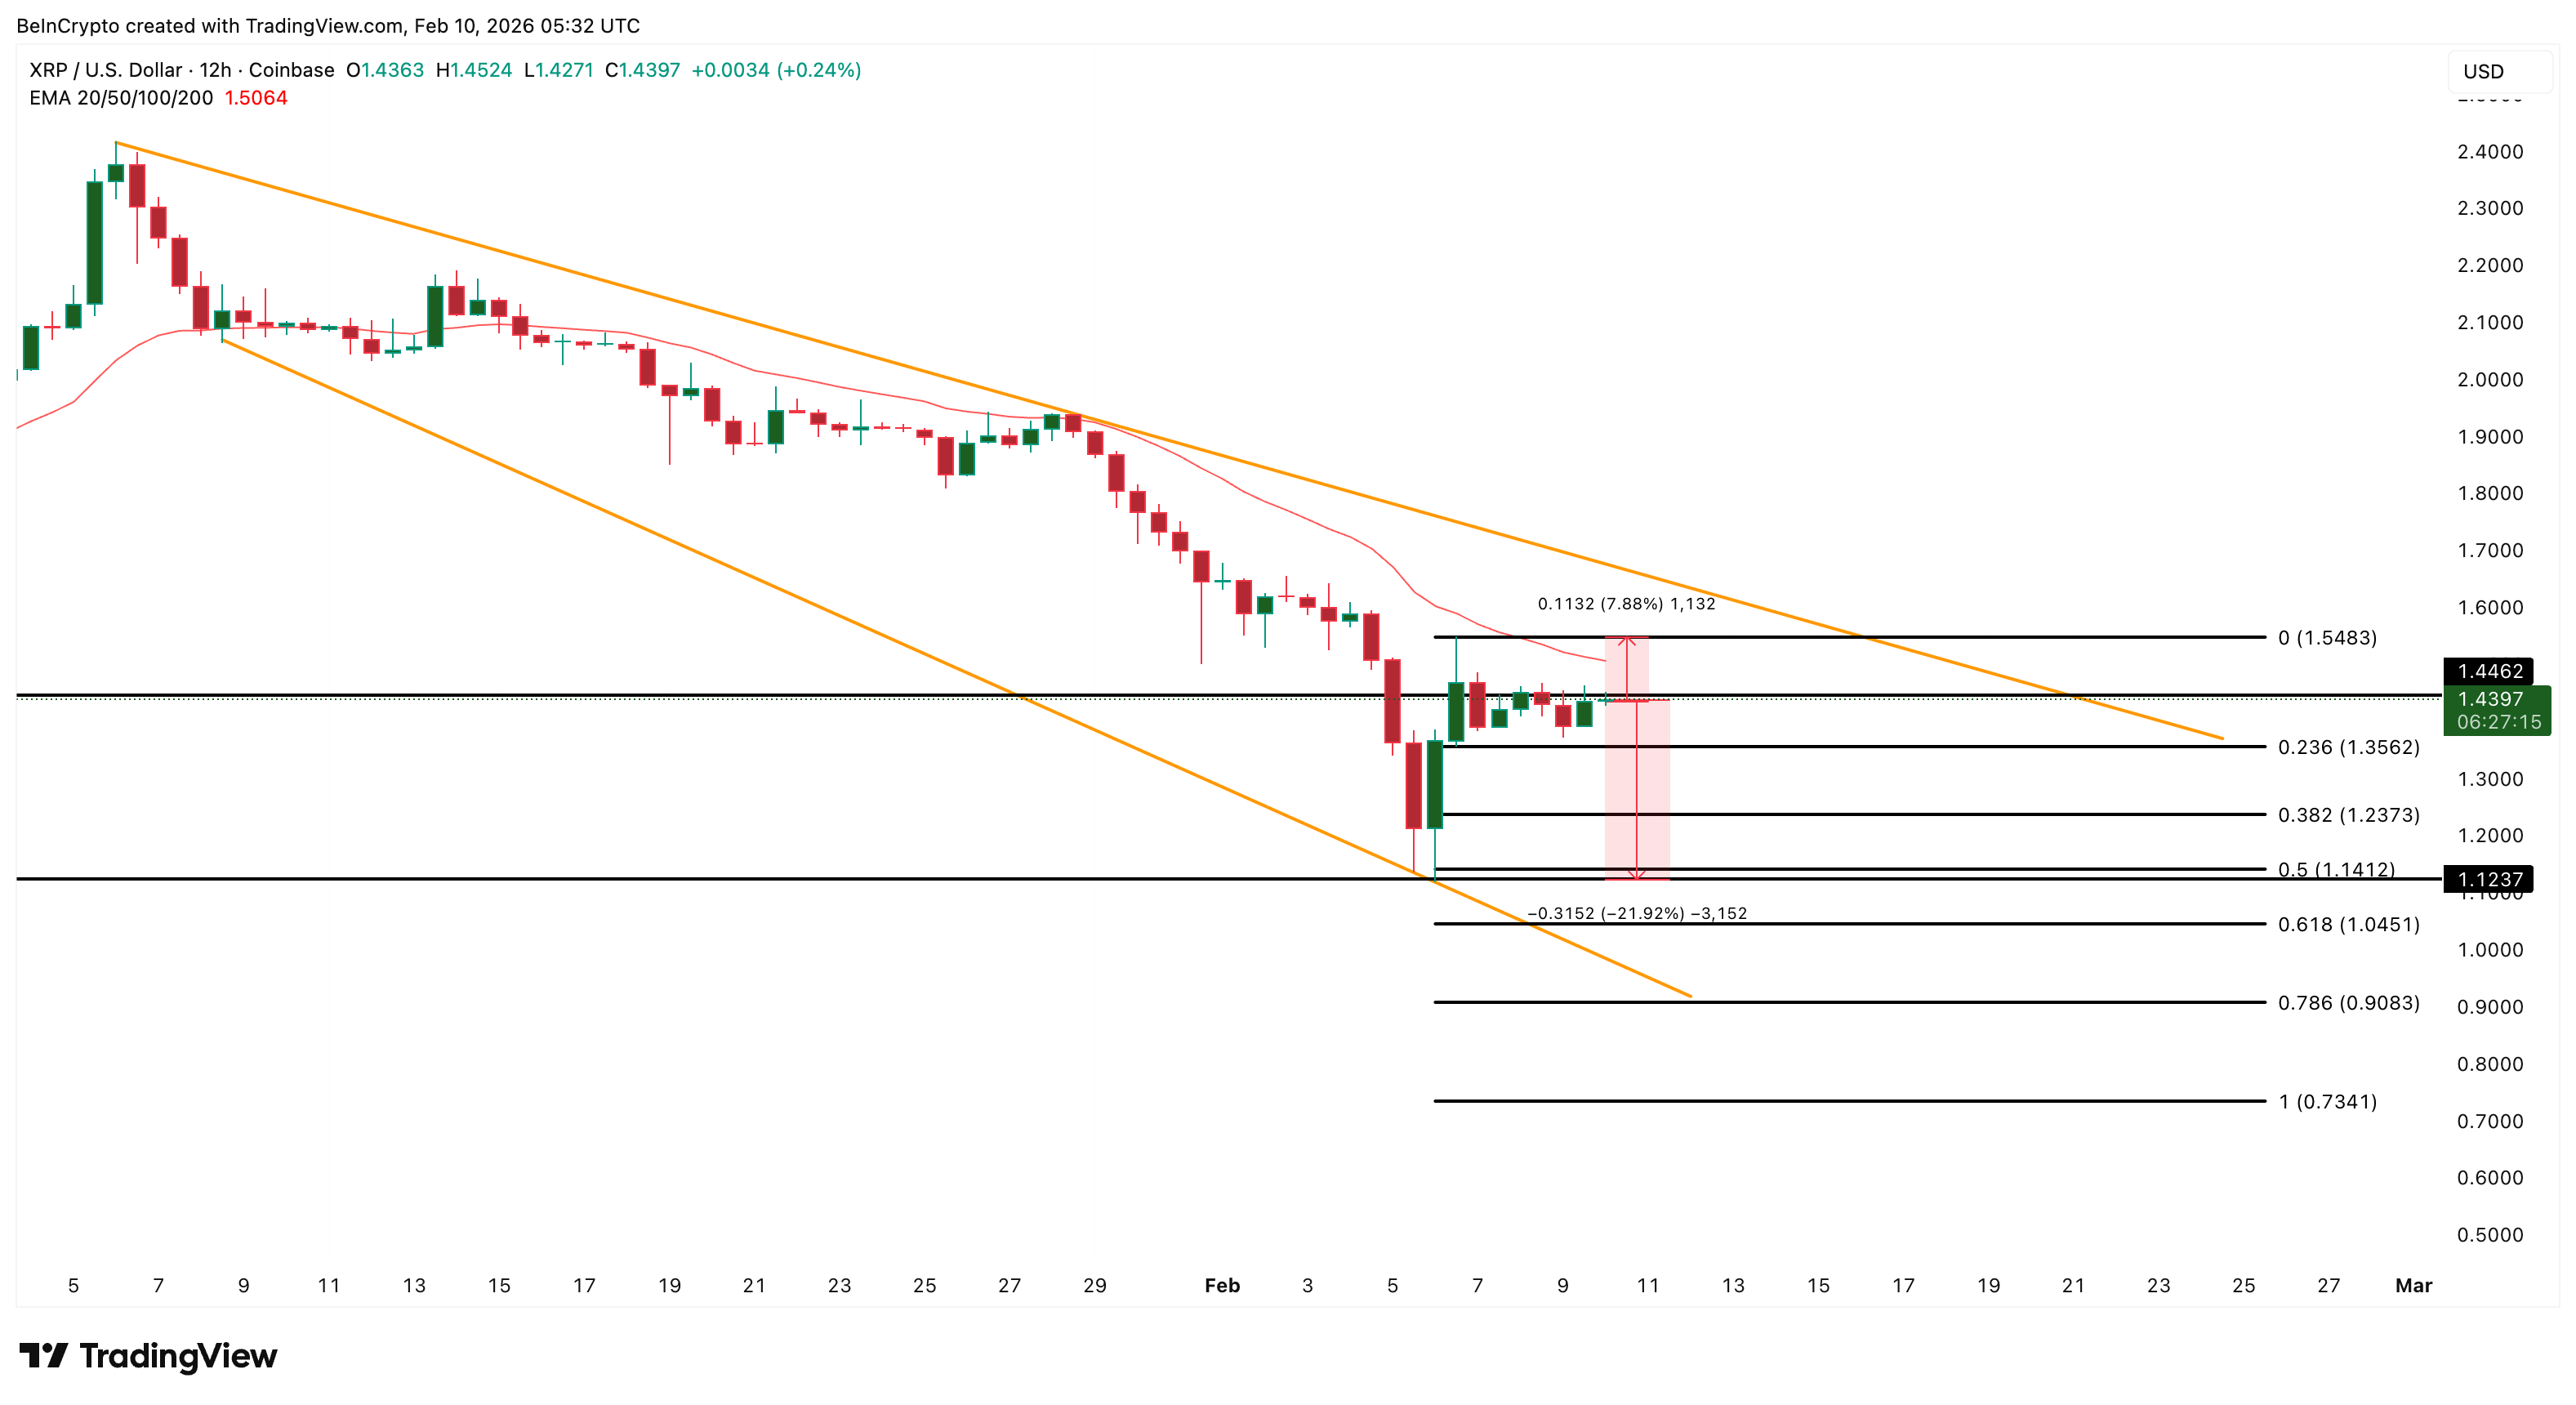
If XRP fails again near $1.44, downside risk increases. A rejection could send the price back toward $1.23 and possibly $1.12, the recent low. That would represent a decline of more than 20% from current levels.
Only a sustained break above $1.54, supported by improving profitability and reduced selling, would change this XRP price structure.

Key Takeaways
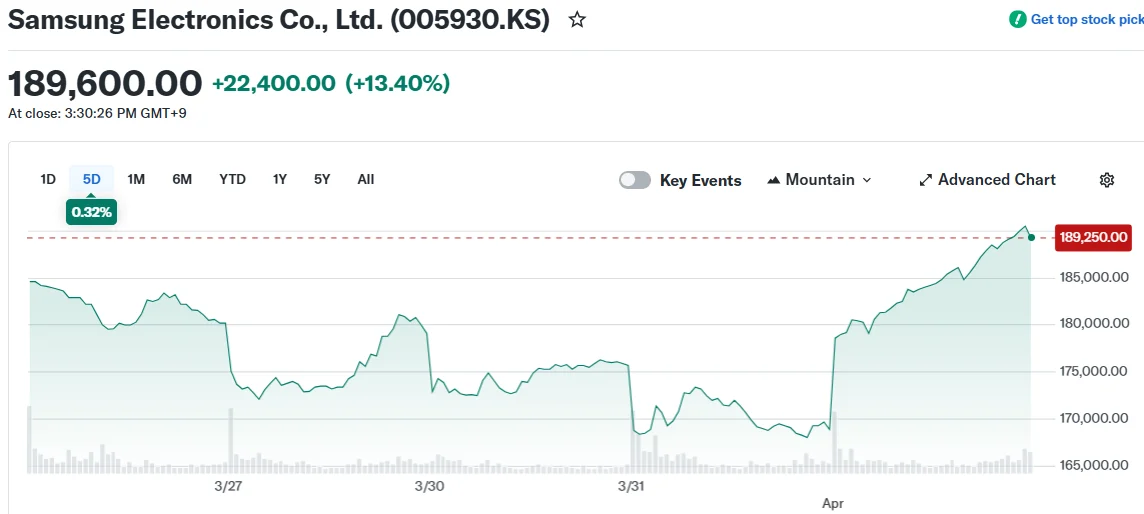
- Samsung and SK Hynix shares surged 10–13% Wednesday following significant March declines
- South Korea’s KOSPI index rallied more than 8%, bouncing back from a 19%+ monthly decline
- Optimism around a potential Middle East conflict resolution improved market sentiment
- The semiconductor giants had plunged 23–24% in March amid geopolitical concerns and AI memory chip demand uncertainty
- Overnight gains on Wall Street, spurred by President Trump’s Iran statements, provided momentum
Shares of Samsung Electronics surged 13% to reach 189,600 won during Wednesday’s trading session, while SK Hynix climbed approximately 11% to 893,000 won. The dramatic recovery followed a punishing March for both semiconductor manufacturers.

South Korea’s benchmark KOSPI index jumped 8.4% to close at 5,478.70, with the semiconductor sector rebound providing substantial support. The index had tumbled more than 19% during March.
The two technology giants each lost approximately 23–24% of their value last month. Investor anxiety centered on the escalating Middle East situation, which threatened to increase manufacturing expenses and disrupt global supply networks.
Additional pressure emerged from questions surrounding sustained demand for memory semiconductors utilized in artificial intelligence applications. Google‘s introduction of an algorithm reportedly capable of reducing AI memory needs added to sector headwinds.
Speculation intensified that memory chip pricing could weaken after OpenAI implemented cost-cutting measures. The artificial intelligence company discontinued its video generation platform, Sora, as part of broader budget reductions.
Strategic OpenAI Partnership Under Spotlight
Toward the end of 2025, OpenAI entered into an agreement with Samsung and SK Hynix for the procurement of 900,000 DRAM wafers from the Korean manufacturers. This partnership had previously fueled investor enthusiasm for both companies.
Both semiconductor producers had enjoyed rising memory chip valuations throughout late 2025, supported by expectations that AI-driven demand would exceed available supply. March’s correction erased portions of those earlier advances.
Kiwoom Securities analyst Han Ji-young attributed Wednesday’s rally to value-oriented purchasing, noting that blue-chip stocks had declined sufficiently to entice investors back into the market.
“The stock market is highly likely to enter a recovery phase rather than experience further decline,” Han stated in client communications.
Peace Prospects in Middle East Boost Market Confidence
Market sentiment strengthened following President Trump’s Tuesday statement indicating the United States would withdraw from Iran within a two to three-week timeframe. The President delivered these remarks during a White House press availability.
Iranian President Masoud Pezeshkian indicated Tehran’s willingness to conclude hostilities, though he requested certain unspecified assurances.
These diplomatic developments triggered an overnight rally across U.S. markets, with the positive momentum extending into Asian trading sessions Wednesday.
Samsung shares concluded trading at 189,600 won, approximately $125.83 in U.S. dollar terms. SK Hynix finished at 893,000 won.
The KOSPI index settled at 5,478.70, representing an 8.4% single-day advance.
Despite Wednesday’s gains, both Samsung and SK Hynix continue trading substantially below their pre-March levels.

Crypto World
Uniswap Foundation Reports $85.8M in Total Assets for FY2025, Runway Extends to January 2027

TLDR:
- The Uniswap Foundation held $49.9M in cash and stablecoins alongside 15.1M UNI tokens at year-end 2025.
- A total of $106.2M was allocated toward grants and incentives, covering both new and prior commitments.
- The Foundation committed $26M in new grants throughout FY2025 and disbursed $11M from prior commitments.
- The UNIfication governance proposal, approved December 26, 2025, will reshape financial projections in Q1 2026.
The Uniswap Foundation published its unaudited financial summary for fiscal year 2025 on March 31. The report covers the organization’s financial position through December 31, 2025.
It projects an operational runway through January 2027. Total assets stood at $85.8 million at year-end market prices.
This includes $49.9 million in cash and stablecoins, 15.1 million UNI tokens, and 240 ETH. The report also precedes structural changes tied to the UNIfication governance proposal, approved on December 26, 2025.
Asset Holdings and Fund Allocation
The Foundation held three categories of assets as of year-end 2025. Cash and stablecoins totaled $49.9 million, while 15.1 million UNI tokens and 240 ETH were also on hand. Together, these assets represented $85.8 million in total market value at closing rates.
Of the total earmarked funds, $106.2 million was allocated toward grants and incentives. This breaks down into $87.5 million for new grant commitments in the future. An additional $18.7 million was reserved for previously committed grants still awaiting disbursement.
Beyond grants, $26.3 million was set aside for operating expenses and employee token awards. These two budget lines cover the Foundation’s staffing, administration, and token compensation. They reflect planned spending across its core operational functions.
The fiat and stablecoin reserves were designated primarily for grantmaking and day-to-day operations. UNI token reserves, however, were held to support future runway needs. This approach allowed the Uniswap Foundation to retain upside exposure to UNI’s market performance over time.
The projected spend figures are set to be updated in the Q1 2026 financial report. That update will reflect changes following the UNification proposal’s approval on December 26, 2025. Organizational shifts post-passage are expected to revise the foundation’s financial outlook going forward.
FY2025 Grant Activity and Ecosystem Milestones
Throughout FY2025, the Uniswap Foundation committed $26 million in new grants to ecosystem projects. It also disbursed $11 million from previously committed grants across the year. In Q4 2025 alone, $5.8 million in new grants were committed.
Q4 2025 disbursements reached $2.1 million from prior commitments. These funds went toward builders and developers operating across the broader ecosystem. Grant activity remained steady throughout all four quarters of the year.
On the operational side, the Foundation accrued $9.7 million in operating expenses for FY2025. Employee token awards of 0.45 million UNI were excluded from that figure. Interest revenue on fiat holdings contributed an additional $1.7 million to the organization’s income.
The Foundation also received 20.3 million UNI tokens from the Uniswap Treasury via the Uniswap Unleashed Proposal. At year-end prices, this transfer equaled approximately $114 million in market value. This inflow added materially to the Foundation’s overall reserve position during 2025.
Key milestones in 2025 included the launch of Uniswap v4 and Unichain. More than 1,500 builders onboarded to v4 during the calendar year.
These developments supported the organization’s ongoing commitment to expanding decentralized finance infrastructure.
Crypto is pseudonymous – a halfway house between anonymous and public.
While you don’t need to expose your identity to open a crypto wallet, public blockchains leave a visible record of your activity for all to see.
A single withdrawal from a KYC exchange can link your real name to a wallet, and once that wallet is tied to your identity, anyone can trace the rest of your on-chain activity.
This is why, as on-chain analysis tools become more widely used, many users are paying closer attention to what financial privacy actually means in crypto.
Mixero was built around this issue. The platform focuses on helping users protect their transaction history while remaining in a decentralized environment.
Public Blockchains Make Wallet Activity Easy to Follow
At the center of Mixero’s service is CoinJoin, a method used to combine transactions in a way which makes blockchain analysis far more difficult.
Rather than sending funds through a direct and easily traceable path, CoinJoin helps obscure the relationship between sender and recipient. This is Mixero’s core solution for Bitcoin users who want stronger privacy without stepping outside the asset itself.
The company argues that privacy has become an important part of using crypto in a mature way. On public ledgers, transaction histories can reveal far more than a single payment. They can expose balances, spending patterns, wallet links, and long-term activity. This can become a serious concern for users who value financial discretion.
Mixero’s platform is designed to keep the process simple. Users can enter one or several destination BTC addresses, adjust settings, receive a signed Letter of Guarantee, and track the order through a status page.
The service is also available through Tor, while Mixero says it keeps no logs of user activity.
Advanced Mode Uses Monero for Deeper Privacy
For users who want a higher level of protection, Mixero offers Advanced Mode. This feature routes transactions through Monero before returning them to Bitcoin. The process works through an XMR bridge and automatically generated wallets, giving users access to the strongest privacy option Mixero offers.
Monero uses built-in privacy technologies such as stealth addresses, ring signatures, and RingCT to conceal transaction details. These tools are designed to hide the sender, receiver, and amount involved in a transfer, which makes Monero one of the most privacy-focused networks in the market.
By routing Bitcoin through Monero and back again, Mixero gives users a way to get stronger privacy without leaving BTC behind at the end. It is aimed at people who want more cover than
About Mixero
Mixero is a privacy-focused crypto service built for users who want stronger transaction privacy on public blockchains. The platform offers CoinJoin-based Bitcoin mixing, Tor access, signed Letters of Guarantee, and an Advanced Mode which routes transactions through Monero for deeper anonymity. Designed for users who value discretion in an increasingly transparent on-chain environment, Mixero aims to make privacy tools more accessible without sacrificing ease of use. Its service is focused on helping users reduce the visibility of their transaction history while staying within the crypto ecosystem.
The post Mixero Pushes for Real Privacy on Public Blockchains appeared first on BeInCrypto.

Solana is holding its breath, trading at the $84 price level, it is barely moving with just 1% gain in the last 24 hours, as opposed to BTC 2.4% gain and ETH 4.5%, even with bullish catalysts that bring a good prediction. Institutional heavyweights Interactive Brokers and Galaxy Digital signal a deepening commitment to the network, and could force a directional move soon.
— Solana Daily (@solana_daily) March 31, 2026
 Interactive Brokers (@IBKR), one of the world's largest brokers, launches crypto trading for 450M people across Europe, including $SOL. pic.twitter.com/mOvB1kVSxd
Institutional pressure is building on both sides of the trade. Galaxy’s continued positioning in SOL infrastructure and Interactive Brokers’ expanded support for the asset add credibility to the bull thesis, even as the broader market sits in near-extreme fear.
The macro headwinds are real. But so is the on-chain growth underpinning SOL’s longer-term case. ETF inflows into Solana products remain a live catalyst that institutional desks are watching closely.
Discover: The best crypto to diversify your portfolio with
Solana Price Prediction: $95 or $75 Next?
SOL has been compressing in a tightening range under $90, a setup that can resolved with a sharp move in either direction. At $84 with a 1.5% single-day decline, the immediate picture looks defensive, but RSI sits at 46, a technical buy signal that suggests sellers haven’t fully taken control yet.
Resistance is stacked. Immediate ceiling at $88, then the $90.50–$91 zone, with $95 acting as the breakout trigger that unlocks the bull case. Above that level, we can safely target $115–$125.
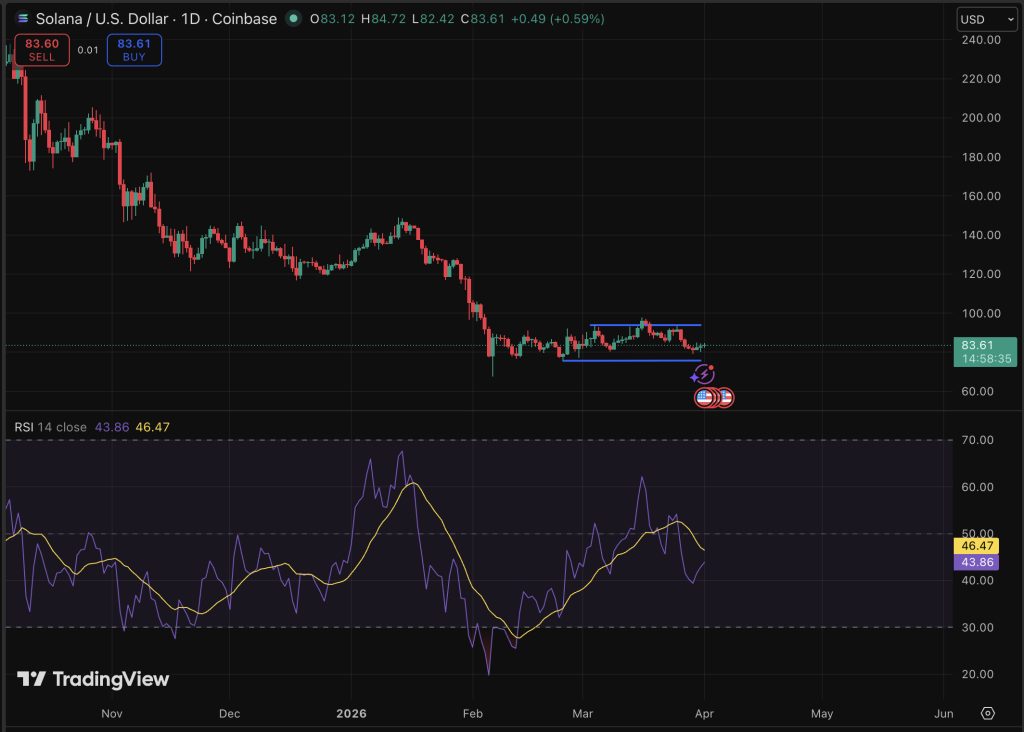
But a breakdown below the $75 support zone opens the door to deeper downside. The setup is binary. Position sizing accordingly.
Discover: The best pre-launch token sales
Maxi Doge Targets Early Mover Upside as Solana Tests Key Levels
SOL at $84 with a $95 breakout requirement means most of the easy money on this trade has already been made. For traders calculating risk-reward on a market-cap-weighted basis, the upside from here demands patience and assumes macro conditions cooperate. That’s where early-stage positioning starts looking different on a spreadsheet.
Maxi Doge ($MAXI) is an Ethereum-based meme token built around a 240-lb canine juggernaut and a 1000x leverage trading mentality, genuinely unhinged energy, deliberately so.
The project has raised more than $4,7 million at a current price of $0.00028, with 66% staking APY bonus available for holders. Features include holder-only trading competitions with leaderboard rewards, a Maxi Fund treasury for liquidity and partnerships, and meme-first marketing built on viral gym-bro humor.
Research Maxi Doge and join the army.
This article is for informational purposes only and does not constitute financial advice. Crypto assets are highly volatile. Always do your own research before investing.
The post Solana Price Prediction: Interactive Brokers Supports SOL, Galaxy Doubles Down appeared first on Cryptonews.

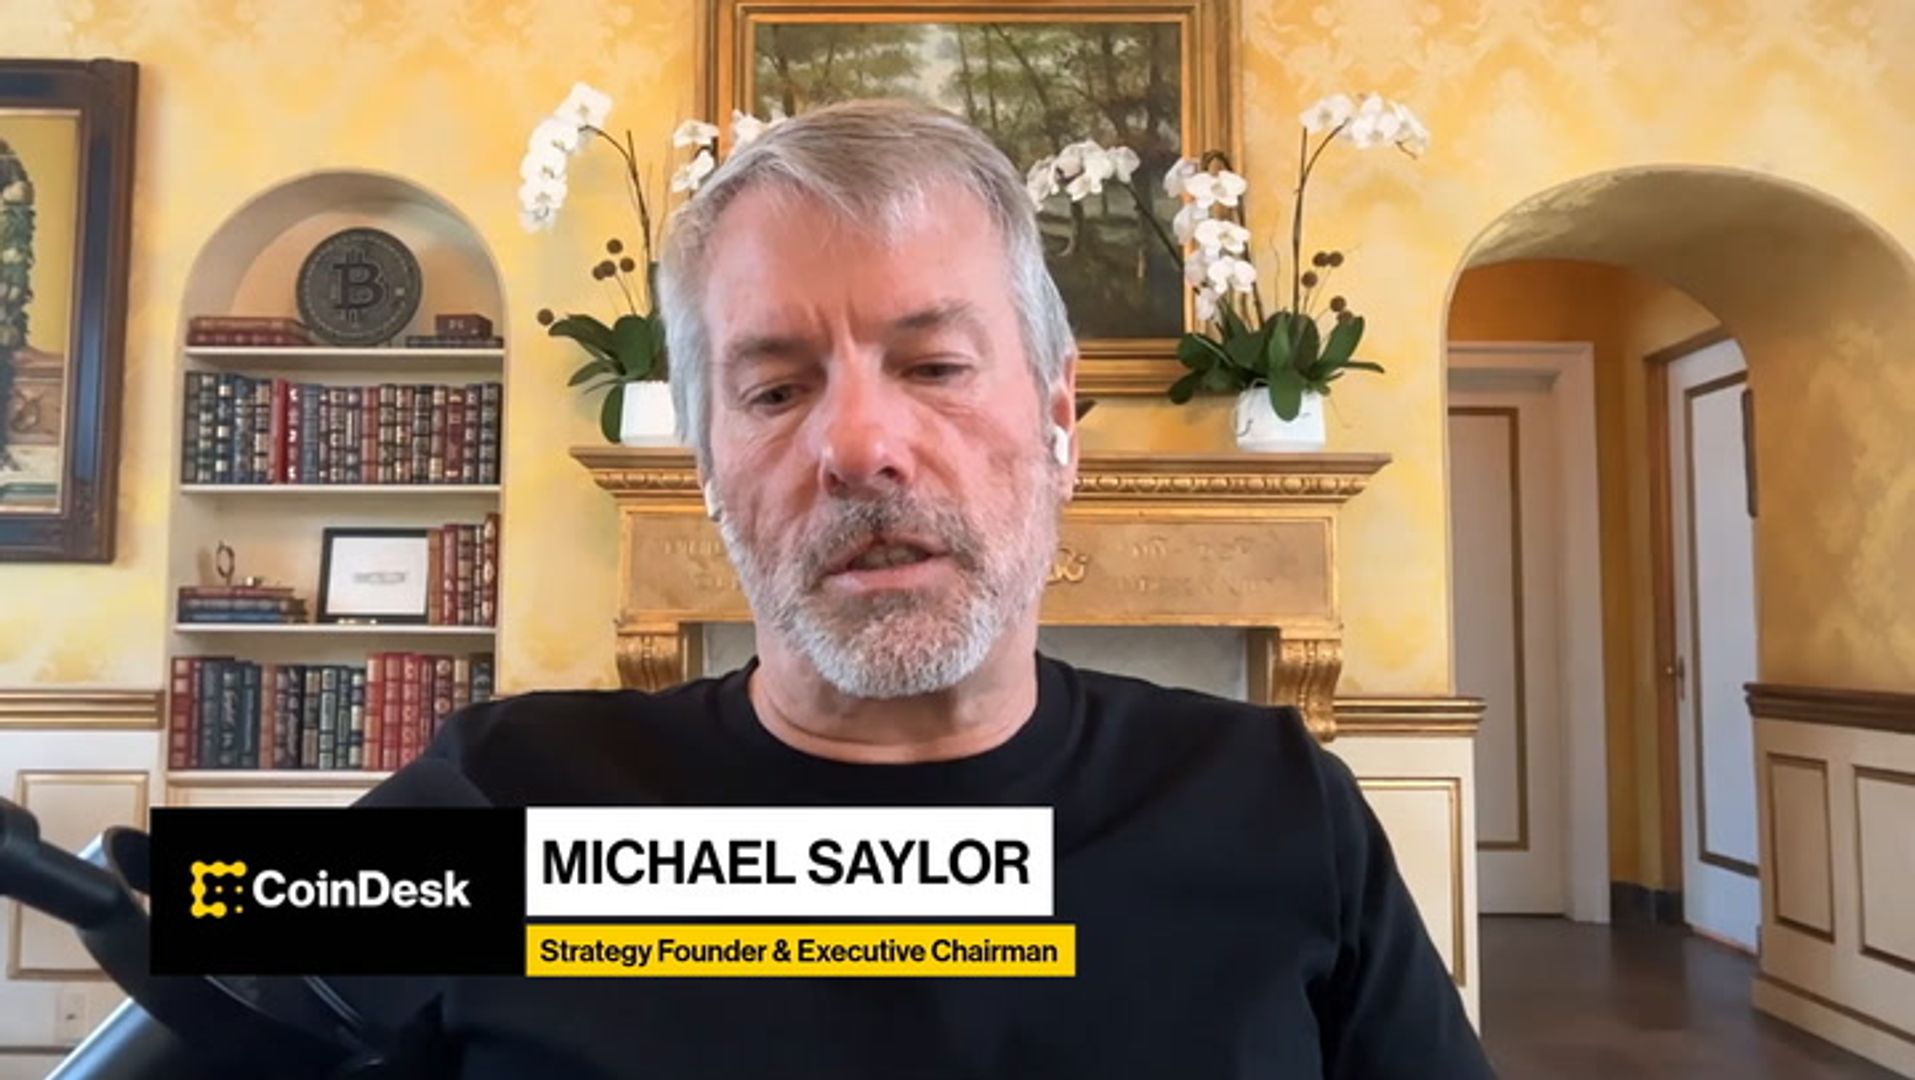
Strategy, the world’s largest publicly traded Bitcoin holder, has held the 11.5% dividend rate on its perpetual preferred stock, Stretch (STRC). This marks the first time the product has not seen a dividend increase since the product launched in July 2025.
STRC debuted in July 2025 with a 9% dividend and has since undergone seven dividend increases. The company was able to maintain the current rate after the volume weighted average price (VWAP) for the month reached $99.95, keeping the shares close enough to their $100 par value.
Strategy positions STRC as a short duration, high yield savings alternative. The perpetual preferred stock pays monthly cash distributions, with the dividend rate adjusted each month to support trading near par and limit price volatility.
During Tuesday’s session, STRC held close to par for most of the day. The company is estimated to have purchased over 1,000 BTC, and it took 12 days for STRC to recover back to par following the ex dividend date. It is likely the shares will continue trading near par over the next two weeks, leading up to the April 14 ex dividend date.
Meanwhile, Strive (ASST), the bitcoin treasury asset manager, saw its own perpetual preferred product, SATA, reach $100 par for the first time. This enabled the company to issue shares through its at the market (ATM) program to fund additional bitcoin purchases. SATA currently offers a dividend rate of 12.7%.


Announced at EthCC in Cannes, the upgrade enables institution-specific borrowing environments, structured credit products, and RWA-backed lending within a unified liquidity system.
Crypto World
Australia passes crypto regulation requiring exchanges to obtain financial services licenses
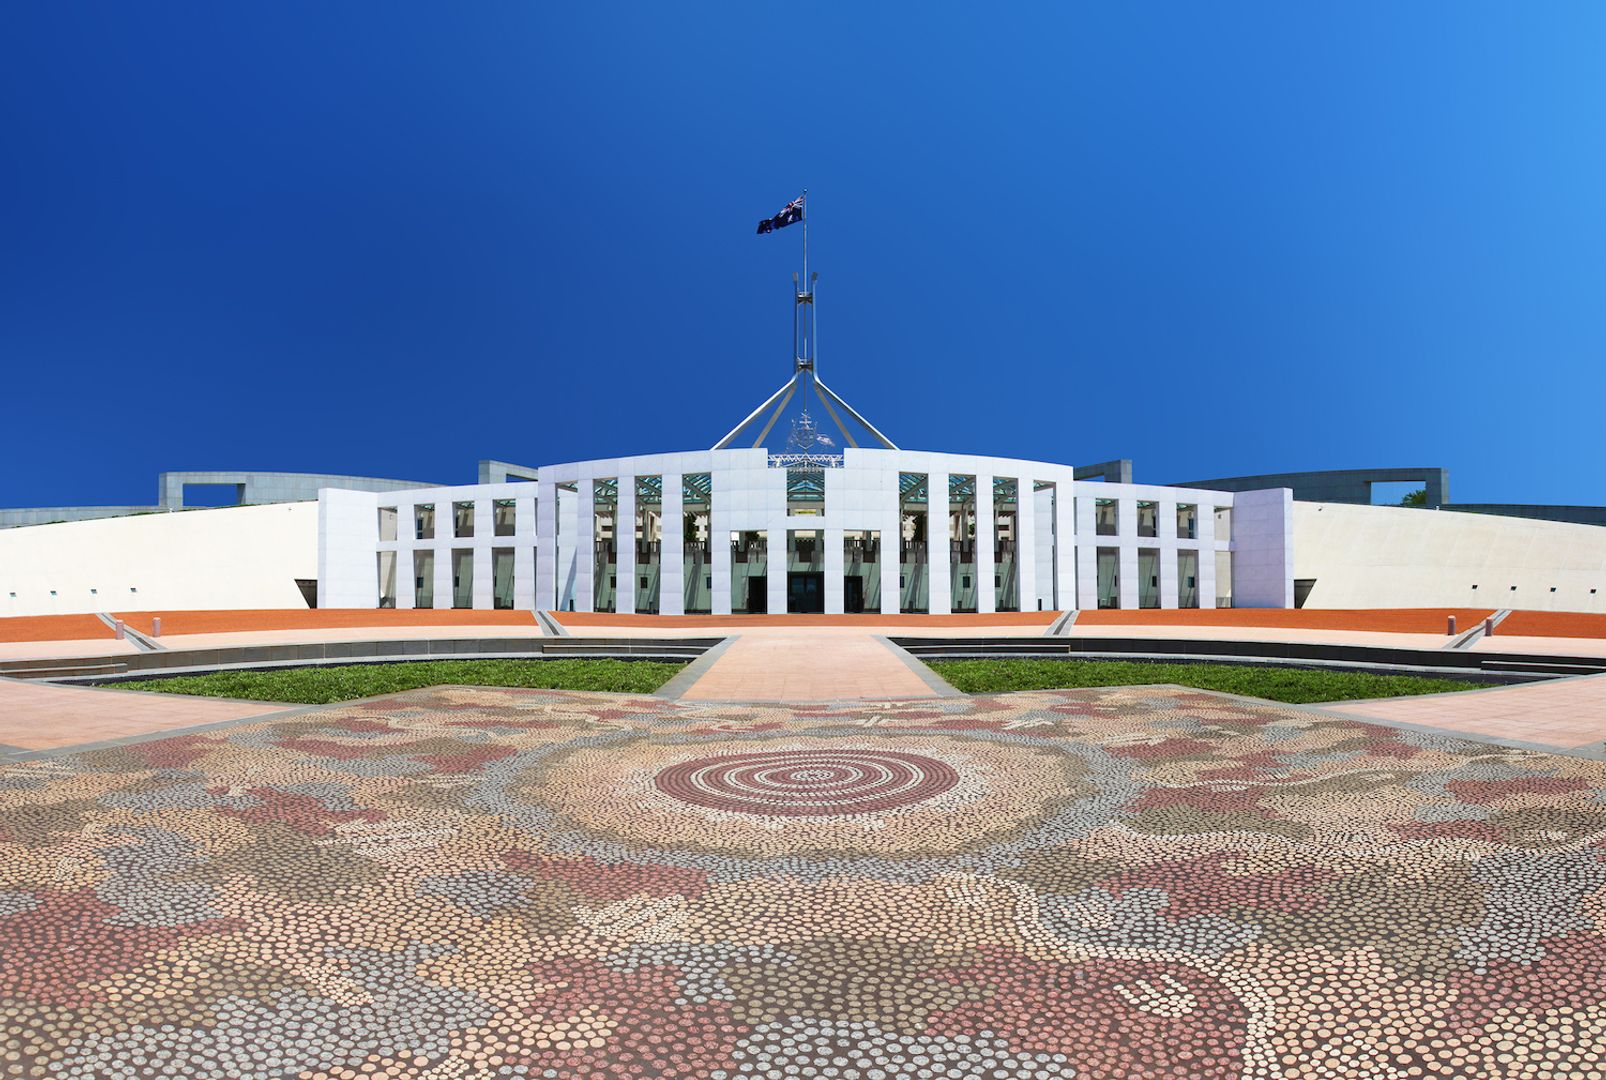

Australia passed legislation on Wednesday, creating its first comprehensive regulatory framework for digital assets that requires crypto exchanges and custody providers to obtain financial services licenses.
The Corporations Amendment (Digital Assets Framework) Bill 2025 cleared both houses on April 1, bringing firms that hold digital assets on behalf of customers into the existing Australian Financial Services Licence regime.
Australia’s bill creates two new regulated categories under the Corporations Act: digital asset platforms, which hold crypto on behalf of users, and tokenized custody platforms, which hold real-world assets and issue a corresponding digital token.
Operators of both must obtain an Australian Financial Services License from ASIC, bringing them under the same core rules as brokers or fund managers, including requirements to safeguard client assets, provide standardized disclosures, avoid misleading conduct, and maintain dispute resolution and compensation systems.
Instead of regulating crypto itself, the law targets the companies in the middle that control customer funds, aiming to reduce risks like commingling, insolvency, and misuse of assets that have caused losses in past crypto failures.
Research from the Digital Finance Cooperative Research Center and industry groups estimates Australia could generate as much as A$24 billion annually from tokenized markets, payments, and digital assets, roughly 1% of GDP. Under the previous regulatory path, the country was on track to capture just A$1 Billion of that by 2030.
A Kraken spokesperson said the law provides a “top-down signal” that Australia is serious about digital assets, adding that clearer rules would give firms confidence to invest and expand locally.
Kate Cooper, CEO of OKX Australia and co-chair of the Digital Economy Council of Australia, called the bill a “pivotal moment,” saying it establishes a foundation for institutional participation and long-term capital allocation.
Almonty’s tungsten mine in Sangdong, South Korea, in March 2026.
Almonty
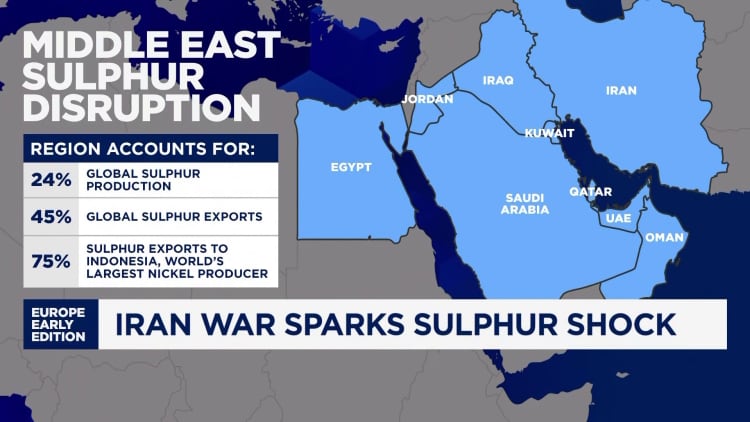
BEIJING — The Iran war is squeezing a global commodities market already pressured by China’s export controls and stockpiling efforts.
Prices of three niche elements — tungsten, sulfur and helium — have climbed sharply in recent weeks.
While none of the commodities are traded as widely as oil, the surge indicates how ripple effects from the Middle East conflict could end up restricting production of the semiconductors that power artificial intelligence advances.
Tungsten, a metal nearly as hard as a diamond, creates the electrical connection in the core of a semiconductor chip. Sulfuric acid, a byproduct of sulfur, cleans chip wafers. Helium enables smooth production of semiconductors since the gas prevents unwanted chemical reactions in the manufacturing process.
Those are just some of the ways in which the three elements have become critical for modern manufacturing, including for defense.
Beijing started to ramp up its control over the critical supplies even before the Iran war started on Feb. 28, partly as tensions with the U.S. escalated over the last few years.
China started restricting tungsten exports just over a year ago, and in December called for tighter limits on sulfuric acid exports. Helium, a gas that’s difficult to store, saw the volume of Chinese imports rise by 15.7% in 2025, after a nearly 65% surge in 2024, according to Wind Information.
The Iran war and the ensuing constraints on the Strait of Hormuz, a critical Middle East shipping route for energy and chemicals, has tipped some oversupply situations into undersupply, while exacerbating existing shortages.

Prices of the three commodities have jumped in some cases by more than oil. The widely used fossil fuel has climbed by more than 50% in March, putting Brent on track for a record month.
“While the Chinese supply chain is being viewed as more resilient than many peers, the risk of disruption in chemicals as raw materials for manufacturers in selected segments is higher than expected based on the feedback,” Goldman Sachs analysts said in a report late last week, citing nearly 40 commodity-related meetings and site visits in China.
Tungsten
Tungsten hit a record high of over $3,000 late last week, marking a surge of well over 50% for the month and more than tripling in price since late December. That’s based on the industry benchmark called “ammonium para tungstate (APT)” in metric ton units, or MTU, from Fastmarket, as quoted by tungsten miner Almonty.
Almonty officially reopened a large tungsten mine in Sangdong, South Korea, earlier this month, and plans to start producing some tungsten this year at a project in the U.S. state of Montana.
The company’s CEO Lewis Black told CNBC that defense sector demand for tungsten has been “extremely strong” since the beginning of last year, but that there’s been no notable change despite the Iran war.
“There’s no material to stockpile. That’s probably the biggest change,” he said.
Sulfur
The price of sulfuric acid in Africa is now at least 30% higher than it was prior to the war, and is still rising, the Goldman Sachs analysts said, citing a local Chinese miner in Africa.
Other assessments point to a milder rise in prices.
China sulfur prices, including cost and freight, climbed by about 13% from early March to $621 per tonne as of March 26, according to S&P Global Platts.
“A 2-3 month effective blockade would likely become a severe supply shock, especially as freight/insurance stay elevated and Middle East-origin cargoes become harder to execute,” Pan Yuya, lead analyst for sulfur and phosphate raw materials at S&P Global Energy, and Isaac Zhao, senior principal analyst, China fertilizers at S&P Global Energy, said in a March 20 note.
The S&P analysts said that around 56% of China’s sulfur imports came from the Middle East in 2025.
“Even prior to the Middle East conflict, sulfur prices were rising sharply as the market tightened. With sulfur prices now at fresh record highs, the ‘super squeeze’ in this rather obscure commodity in supply warrants further examination,” HSBC analysts said in a March 16 report.
Helium
Helium prices have roughly doubled since the Iran war began, according to Fitch Ratings.
As most trading occurs through long-term private contracts between industrial gas suppliers and manufacturers, it is difficult to pinpoint industry-wide prices, said Shelley Jang, Fitch’s director of Asia-Pacific corporate ratings.
Iranian missile attacks this month crippled a key industrial center in Qatar, which produces about one-third of the world’s helium.
That implies helium supply won’t be restored anytime soon, pointed out Christopher Ecclestone, principal and mining strategist at Hallgarten & Company.
In one indication of further market tightness, prices of helium in China’s Henan province have reversed a downturn this year to climb from a Feb. 28 low of 545 yuan ($78.85) a bottle to 600 yuan ($86.81), according to Wind Information.
Subscribe now
Shortages caused by the Iran war are the latest supply chain disruption to rock global markets, which faced similar shocks from Russia’s invasion of Ukraine in 2022 and the Covid-19 pandemic. That’s pushed companies to diversify, and countries such as China to ramp up stockpiling plans.
“Access to supplies of certain physical materials where production and processing is concentrated in China will become more frequent topics of negotiations with Beijing,” Rhodium Group said in a March 24 report.
Limited price transparency also means the shortage could be worse than available numbers suggest.
Tungsten and helium prices have been surging, “but you don’t have anyone on the buy side saying, ‘oh my goodness, we don’t have enough product,’” Ecclestone said. “Defense contractors should have warehouses of tungsten, but they don’t.”
“The world has got lazy. It thinks life is like a supermarket, the product is a pack of cornflakes or a few tons of sulfuric acid,” he said. “The supermarket of commodities has had a few of the aisles chopped down.”


The ex-Blackstone team wants to move beyond crypto-collateralized loans and into ‘real economy credit’ as the tokenized RWA sector continues to grow.
Bitcoin has declined by about 50% this market cycle, far less than in previous cycles, Fidelity Digital Assets said, adding this trend could continue over time.
Bitcoin’s post-all-time-high drawdowns have historically been steep, at about 80% to 90%, but this cycle has been about 50%, Fidelity Digital Assets research analyst Zack Wainwright said Tuesday.
One can see the “diminishing returns” that have developed from cycle to cycle when looking at Bitcoin’s price performance from the perspective of the previous all-time high, he said.
“Each cycle has been less dramatic to the upside than the previous,” he said. “Downside risk has been less dramatic in 2026, the current cycle, as well,” he added.
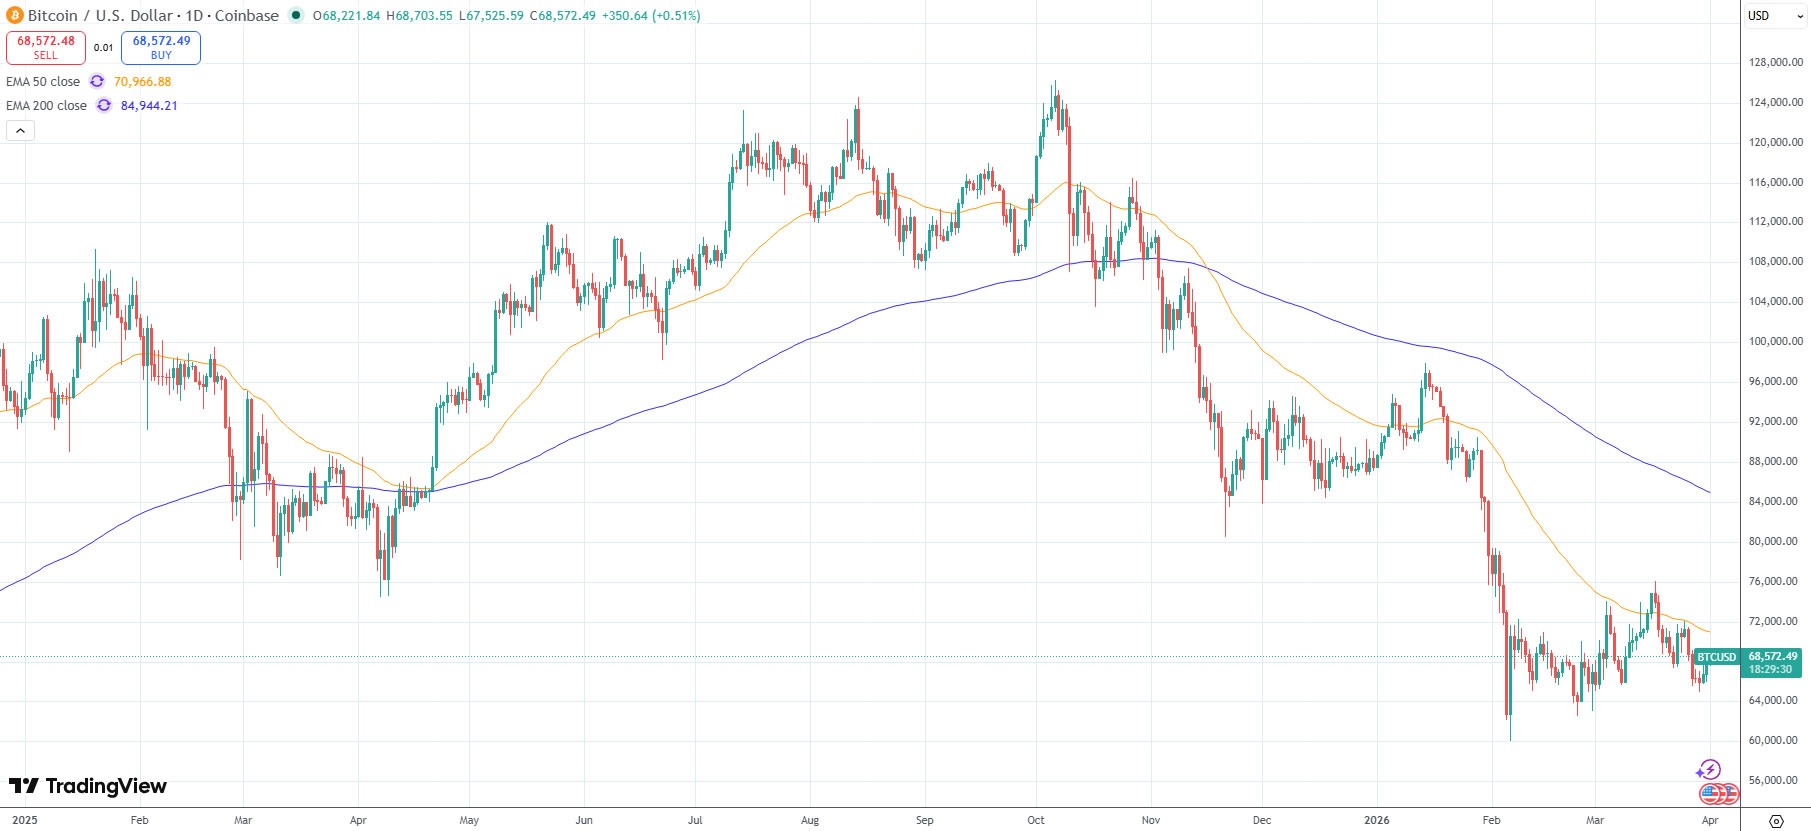
Bitcoin’s price hit its current cycle low of just over $60,000 on Feb. 6, a decline of 52% from its Oct. 6 all-time high of about $126,000, according to TradingView. It is currently down 46% from its peak six months ago.
The previous cycle saw a much larger decline of 77%, from the 2021 all-time high of $69,000 to a bear market low just below $16,000 in November 2022.
Bitcoin may bottom in late September
Fidelity’s assessment that this Bitcoin cycle is notably shallower than prior cycles “indicates a maturing market with reduced volatility and stronger institutional confidence,” Nick Ruck, director of LVRG Research, told Cointelegraph on Wednesday.
“This shift signals that Bitcoin is changing from a speculative asset toward a more stable store of value, potentially paving the way for greater adoption in the future.”
Related: Bitcoin’s $10K range expected to hold until spot traders show up: Data
Meanwhile, Alphractal founder Joao Wedson observed Tuesday that Bitcoin’s top occurred 534 days after the last halving, a shorter span than in the previous cycle.
This “decaying pattern” across cycles suggests the historical bottom may occur between 912 and 922 days after the halving, which “points to a bottom in late September or early October 2026,” he said.
BTC is below key daily moving averages
Bitcoin remains below the key 50-day and 200-day exponential moving averages, two long-term trend indicators.
It is hovering at the 200-week EMA, around $68,000, which has served as a key level of support during previous market downturns.

Magazine: Nobody knows if quantum secure cryptography will even work

The West End restaurateur still backing London despite “being punished for success”

Lonza: Structural Growth Intact, CHI Exit Strengthens Focus, Recent Weakness Reinforces Entry Opportunity

Samsung and SK Hynix Surge Over 10% as Trump Iran Remarks Fuel Tech Stock Recovery


-

 News Videos6 days ago
Parliament publishes latest register of MPs’ financial interests
-
 Tech6 days ago
Intercom’s new post-trained Fin Apex 1.0 beats GPT-5.4 and Claude Sonnet 4.6 at customer service resolutions
-

 NewsBeat5 days ago
The Story hosts event on Durham’s historic registers
-

 Business6 days ago
Instagram, YouTube Found Responsible for Teen’s Mental Health Struggle in Historic Ruling
-
 NewsBeat7 days ago
Tesco is selling new Cadbury Dairy Milk bar and people can’t wait to try it
-

 Sports5 days ago
Sweet Sixteen Game Thread: Tide vs Michigan
-
Entertainment2 days ago
Fans slam 'heartbreaking' Barbie Dream Fest convention debacle with 'cardboard cutout' experience
-
 Entertainment4 days ago
Lana Del Rey Celebrates Her Husband’s 51st Birthday In New Post
-
Crypto World22 hours ago
Dems press CFTC, ethics board on prediction-market insider trades
-

 Sports18 hours ago
Tallest college basketball player ever, standing at 7-foot-9, entering transfer portal
-
 Fashion7 days ago
How to Style Spring Like WeWoreWhat: Easy Outfit Ideas for 2026
-

 Tech2 days ago
The Pixel 10a doesn’t have a camera bump, and it’s great
-

 Entertainment6 days ago
HBO’s Harry Potter Series Will Definitely Fail For One Big Reason, And It’s Not J.K. Rowling Or Snape
-

 Fashion6 days ago
En Vogue in Brown Leather and Tailored Neutrals by Atelier Savoir, Styled by J Bolin
-

 Crypto World1 day ago
U.S. rule change may open trillions in 401(k) funds to crypto
-

 Fashion6 days ago
What Are Your Favorite T-Shirts for the Weekend?
-

 Fashion5 days ago
Weekly News Update, 3.27.26 – Corporette.com
-

 Politics2 days ago
Should Trump Be Scared Strait?
-

 Sports1 day ago
Women’s hockey camp eyes fitness boost, tactics ahead of WC 2026 campaign | Other Sports News
-
 Sports6 days ago
Lewis Hall hopes to miss another summer of village cricket due to World Cup call
You must be logged in to post a comment Login