
Crypto World
ServiceTitan (TTAN) Stock Soars on Robust Q1 Performance and Optimistic Guidance

TLDR
- TTAN shares rally following impressive first-quarter performance and guidance
- ServiceTitan posts 25% revenue increase with expanding profit margins
- Pre-market trading shows significant gains after quarterly earnings release
- Platform adoption accelerates with transaction volume climbing 23% year-over-year
- Management provides confident full-year forecast supporting bullish sentiment
ServiceTitan (TTAN) shares experienced significant upward momentum following the release of impressive fiscal first-quarter financial results and forward-looking guidance. The stock finished regular trading at $74.33, climbing 2.34%, before surging to $86.84 in pre-market activity—a substantial 16.83% gain. This dramatic movement represented a powerful earnings-fueled rally driven by accelerating revenue, expanding margins, and robust platform adoption across its customer base.
Impressive Q1 Revenue Performance Drives TTAN Momentum
The company delivered total revenue of $268.8 million during its fiscal first quarter of 2027, representing a 25% increase compared to $215.7 million in the corresponding period. Platform-specific revenue demonstrated equally strong performance, advancing 25% to reach $260.6 million versus $208 million in the prior year. These figures highlighted sustained demand for the company’s specialized software solutions serving trade service businesses.
ServiceTitan also disclosed that gross transaction volume processed through its platform reached $21.7 billion throughout the quarter. This marked a 23% advancement from the $17.7 billion recorded during fiscal Q1 2026. This metric demonstrated expanding utilization of ServiceTitan’s platform ecosystem among its established client base.
The company maintained its net dollar retention rate above the 110% threshold, consistent with the level achieved in the comparable quarter last year. This retention figure indicated that current customers persistently increased their investment in the platform over time. This dynamic contributed significantly to the accelerated revenue trajectory observed during the period.
Profitability Metrics Show Meaningful Improvement
ServiceTitan successfully narrowed its GAAP operating loss to $25.8 million for the most recent quarter. This represented substantial progress from the $49.5 million GAAP operating loss recorded in the year-ago period. Accordingly, the GAAP operating margin improved dramatically to negative 9.6% compared to negative 23% previously.
On a non-GAAP basis, the company generated operating income of $40.8 million during the quarter. This compared favorably to just $16.2 million achieved in fiscal Q1 2026. The non-GAAP operating margin consequently expanded to 15.2% from 7.5%, demonstrating improved operational efficiency.
Cash flow metrics also displayed meaningful progress, though ServiceTitan continued to report negative free cash flow overall. GAAP net cash utilized in operating activities decreased to $1.6 million from $14.6 million in the prior-year period. Non-GAAP free cash flow improved to negative $9.6 million compared to negative $22.3 million previously.
Strong Full-Year Guidance Reinforces Bullish TTAN Outlook
Looking ahead to the fiscal second quarter, ServiceTitan provided revenue guidance ranging from $284 million to $286 million. Management also forecasts non-GAAP operating income between $38 million and $39 million for the period. This projection suggests sustained momentum following the first-quarter performance that exceeded market expectations.
For the complete fiscal year 2027, ServiceTitan anticipates total revenue between $1.13 billion and $1.14 billion. The company simultaneously projects non-GAAP operating income in the range of $142 million to $147 million. These forward-looking estimates reflect management’s confidence regarding continued demand strength, expanding platform adoption, and improving operational leverage throughout the organization.
ServiceTitan provides comprehensive software solutions to contractors and trade service businesses, enabling streamlined workflow management, payment processing, customer relationship management, and operational efficiency. The firm continues driving adoption of its Max product suite across customer locations. The pre-market surge in TTAN shares reflected investor enthusiasm for accelerating growth, margin expansion, and the company’s strong competitive positioning in its market segment.


Disclosure: This article does not represent investment advice. The content and materials featured on this page are for educational purposes only.
Fhenix and Canopy integrate confidential computation to simplify private onchain app development.
Summary
- Fhenix and Canopy integrate confidential computation, enabling developers to build privacy-preserving onchain apps with encrypted data.
- The two projects have launched a confidential app template, bringing fully homomorphic encryption to sovereign blockchain applications.
- Fhenix brings encrypted computation to the Canopy Stack, simplifying confidential onchain app development with familiar tooling.

Fhenix and Canopy are integrating confidential computation into the Canopy Stack, giving developers a direct way to build sovereign onchain apps that keep user data encrypted while it is being used. The integration removes the need for teams to assemble a separate cryptography stack or hire specialist cryptographers before they can ship private application logic.
The new Canopy Confidential App template is powered by Fhenix’s CoFHE coprocessor for fully homomorphic encryption (FHE). Developers will be able to add encrypted computation through a familiar TypeScript library, making confidentiality part of the app from the start rather than a feature added later. The approach extends Canopy’s existing platform model: the stack handles the underlying infrastructure so builders can focus on the application.
Public-by-default infrastructure works for many onchain use cases, but it breaks down when applications handle commercially sensitive, personal, or strategic data. Some teams respond by moving to closed networks. Fhenix and Canopy are taking a different approach: keep the network open while keeping the data encrypted.
Confidential operations are added through Canopy’s plugin and runtime layer without changing its base consensus. A user’s input is encrypted in the Canopy wallet and submitted as a standard transaction. CoFHE processes the encrypted data offchain, and when a result must be disclosed, a trust-minimized process returns a signed value for Canopy to verify before state is settled. Builders access the flow through familiar tooling, without managing a separate privacy stack or encryption keys.
The core Canopy components are already live, including plugin lifecycle hooks, the state bridge, plugin scaffolding, and the wallet runtime. CoFHE is currently deployed across Ethereum, Arbitrum, and Base. Work on the remaining encrypted-transaction components is in progress.
What it enables
In an onchain game, a player’s hand, units, and map knowledge can remain encrypted. Players submit moves privately and learn only the outcome of each encounter, such as who won, how much damage was dealt, or which territory changed hands.
The same model applies to business workflows. A buyer can open an RFP, receive encrypted bids from multiple suppliers, and publish only the winner and winning price at the deadline. The losing bids do not need to be revealed to the other participants.
The Fhenix integration is in development and is scheduled to roll out in Q4 2026. Canopy is currently live on public testnet, with 16.8k forks and more than 100,000 daily active wallets.
Disclosure: This content is provided by a third party. Neither crypto.news nor the author of this article endorses any product mentioned on this page. Users should conduct their own research before taking any action related to the company.

Bitcoin’s market cycles could be more closely linked to the US political calendar than many investors think, according to a new analysis shared by Alphractal founder Joao Wedson.
In a July 30 post on X, he showed that the flagship cryptocurrency has repeatedly entered bear markets before US midterm elections, only to recover after voters head to the polls.
Recurring Election Cycle Patterns
Wedson compared Bitcoin’s price history against US election cycles and found what he described as a recurring sequence. According to his chart, BTC enters a bear market about one year before every US midterm election before starting a longer bull market right after the vote. In some cycles, the market bottom formed just days before the election, while in others it came shortly afterward.
He also noted that presidential elections have produced a different effect, with Bitcoin rallying strongly every time a president won an election before approaching a major cycle top not long after the president was inaugurated.
“Data reveals patterns that narratives often miss,” wrote the analyst.
According to Wedson, XRP offers an even more striking example, starting a steep rally on the day Donald Trump won the 2024 election and reaching a local peak on January 20, 2025, the day Trump was inaugurated.
His observations are quite similar to those made in a Binance Research report from earlier in the year, which found that BTC has historically struggled during US midterm election years before posting gains once the political uncertainty faded.
Per the report, Bitcoin dropped by an average of about 56% during completed midterm cycles since 2014, before returning an average gain of roughly 54% in the year after the elections.
Wedson had earlier contended that while many market participants believed Bitcoin has already established a bottom, “a price recovery alone does not confirm a structural shift.” He said there must be clear signs of capitulation and deleveraging, as well as short-term investors bringing in new capital before such a conclusion can be reached.
Macro Conditions Could Shape Whether History Repeats
There’s still about three months left before Americans go to the polls, and BTC is currently hovering around the $64,000 level, which is nearly 50% below its October 2025 all-time high of over $126,000, with data from CoinGecko showing it dipped about 2.5% in seven days.
However, it’s still up nearly 8% across the last month, after weathering the latest Federal Reserve decision to leave interest rates unchanged at 3.50% to 3.75%.
The post Bitcoin’s Next Bull Run Could Follow US Midterms: Analyst appeared first on CryptoPotato.

The leading cryptocurrency experienced enhanced volatility over the past week, eventually stabilizing at around $64,500 (per CoinGecko’s data).
Given the ongoing bear market, though, the price may soon head south again, but one popular analyst claimed that a dip to around $60K should actually be welcomed as good news.
Exactly What BTC Needs?
The renowned analyst Ali Martinez argued that a drop by nearly five grand would complete a classic inverse head-and-shoulders pattern that could set the stage for a serious pump. The setup consists of three dips – a low (left shoulder), a deeper plunge (head), and another low (right shoulder) and signals that sellers are running out of steam.
According to Martinez, the completion of the pattern combined with a confirmed breakout above $66,500 could open the door to a pump to a two-month high of around $74,000.
The analyst has been quite focused on BTC lately, revealing that whales have purchased roughly 29,000 units (worth more than $1.8 billion at current rates) over the past week. Accumulation from this cohort of investors is considered a bullish sign as it suggests that they are preparing for a potential upward move. Their actions could encourage smaller players to hop on the bandwagon, too, thus distributing fresh capital into the ecosystem.
Another comment from Martinez was his recent prediction about when BTC will reach its bottom. If the 4-year cycle theory holds, he expects that to happen between October 6 and October 16. This is a common thesis among analysts, as many believe the cryptocurrency could nosedive to multi-year lows before entering a new bull run. Others, like Joao Wedson, anticipate that the pivotal moment when bulls would finally regain control is the midterm elections in the US scheduled for early November.
An Additional Bullish Forecast
Vivek Sen – an X user with almost 300,000 followers – presented another optimistic scenario for BTC, based on the formation of a cup-and-handle breakout.
The pattern represents a big rounded dip (the cup), followed by a smaller pullback (the handle) and typically shows that the asset has built up strength and is perhaps gearing up for a rally. According to the analyst, this formation could be a precursor to a giant increase, setting $220,000 as the minimum target.
“Most people will only find out after it happens,” he added.
The post ‘Don’t Fear a Drop to $60K:’ Analyst Sees That as a Healthy Reset for BTC appeared first on CryptoPotato.
Crypto World
Ark Invest Rotates Within Crypto Equities, Adding Coinbase and Circle While Trimming Other Names

Ark Invest sold shares of Bitmine Immersion Technologies, Bullish, and Block as crypto-related equities extended losses across U.S. markets. The move raised questions after months of aggressive buying during previous pullbacks. Rather than signaling a broad exit, the latest trades suggest Ark is actively rotating capital within its crypto portfolio instead of abandoning the sector.
That view is supported by recent buying activity. Over a three-day period, Ark purchased roughly $43.5 million in crypto stocks, including 122,544 Coinbase shares valued at nearly $18.6 million and 169,777 Circle shares worth about $12.9 million. The purchases came as both companies declined alongside Bitcoin and weakening expectations for U.S. crypto legislation.
— Rahul K (@iamrahulinc) July 30, 2026
 𝗔𝗥𝗞 𝗜𝗡𝗩𝗘𝗦𝗧 𝗦𝗟𝗜𝗖𝗘𝗦 $𝟮𝟬𝟬𝗠 𝗙𝗥𝗢𝗠 𝗕𝗜𝗧𝗠𝗜𝗡𝗘!
Ark Invest trimmed its crypto‑related holdings on Wednesday as prices fell.
The firm sold 120,665 Bitmine shares worth about $2 million, plus 13,403 Block Inc. shares (~$1.1 M), 12,561 Robinhood shares… pic.twitter.com/RaRUCm4Ufv
The broader backdrop also explains the pressure. Falling digital asset prices have weighed on exchange revenues and crypto-related valuations. At the same time, uncertainty surrounding U.S. market structure legislation has cooled investor optimism. Stocks that previously benefited from expectations of regulatory progress have been among the hardest hit during the recent pullback.
Discover: The Best Crypto to Diversify Your Portfolio
Position Rotation Looks More Likely Than a Thesis Change
Ark’s history with these companies provides important context. The firm invested roughly $16.8 million into Bullish and about $7.6 million into Bitmine during late 2025. It also deployed approximately $38.7 million into Coinbase, Bitmine, Circle, and Bullish during another sharp crypto equity decline. Those earlier purchases leave plenty of room to trim positions without changing the broader investment thesis.

The direction of recent trades reinforces that interpretation. Ark previously sold about $8.9 million worth of Block, Bullish, and Robinhood while purchasing roughly $12.5 million of SpaceX and Bitmine. That pattern suggests the firm is reallocating capital toward higher conviction ideas rather than reducing overall crypto exposure.
Block deserves separate attention because its business extends beyond cryptocurrency. Payments, merchant services, and Bitcoin products all contribute to its revenue. Selling Block alongside Bullish and Bitmine therefore points to a broader reduction in crypto equity risk instead of targeting only pure play digital asset companies.
Coinbase and Circle tell a different story. Ark continued adding to both positions during the latest selloff despite near-term losses. That approach signals conviction rather than retreat. While those investments may currently sit below Ark’s average purchase price, the firm appears willing to absorb short-term weakness in exchange for longer-term growth potential.
Circle also occupies a different position within the crypto ecosystem. Its outlook depends heavily on stablecoin adoption and regulatory clarity rather than exchange trading volumes. Continued buying suggests Ark sees stablecoin infrastructure as a stronger long-term opportunity than several other crypto-related equities currently under pressure.
Trade Crypto and Stocks on Bybit and Get a Chance to Win Our $1,000 USDT Airdrop
Bitcoin, Regulation Will Shape Ark Invest Next Moves
Ark’s daily trade disclosures remain the clearest indicator of its strategy. If the firm resumes buying Bitmine or Bullish during additional weakness, the recent sales will likely be viewed as routine portfolio management. However, continued net selling across multiple sessions without offsetting purchases would suggest a more meaningful reduction in risk appetite.
External conditions will ultimately drive that decision. Bitcoin price trends remain the biggest factor influencing crypto equity performance, while regulatory developments continue shaping investor sentiment. Delays to market structure legislation could pressure valuations further, whereas renewed momentum in Washington may revive demand for crypto-linked stocks.
Ark has already shown it will act quickly when conditions deteriorate. Earlier this year, the firm sold roughly $11.2 million of its ARKB spot Bitcoin ETF alongside about $84 million in technology holdings during a broader risk reduction move. That history suggests Cathie Wood remains flexible. For now, the latest transactions look more like selective portfolio rotation than a broad retreat from crypto equities.
Discover: The Best Token Presales
The post Ark Invest Rotates Within Crypto Equities, Adding Coinbase and Circle While Trimming Other Names appeared first on Cryptonews.
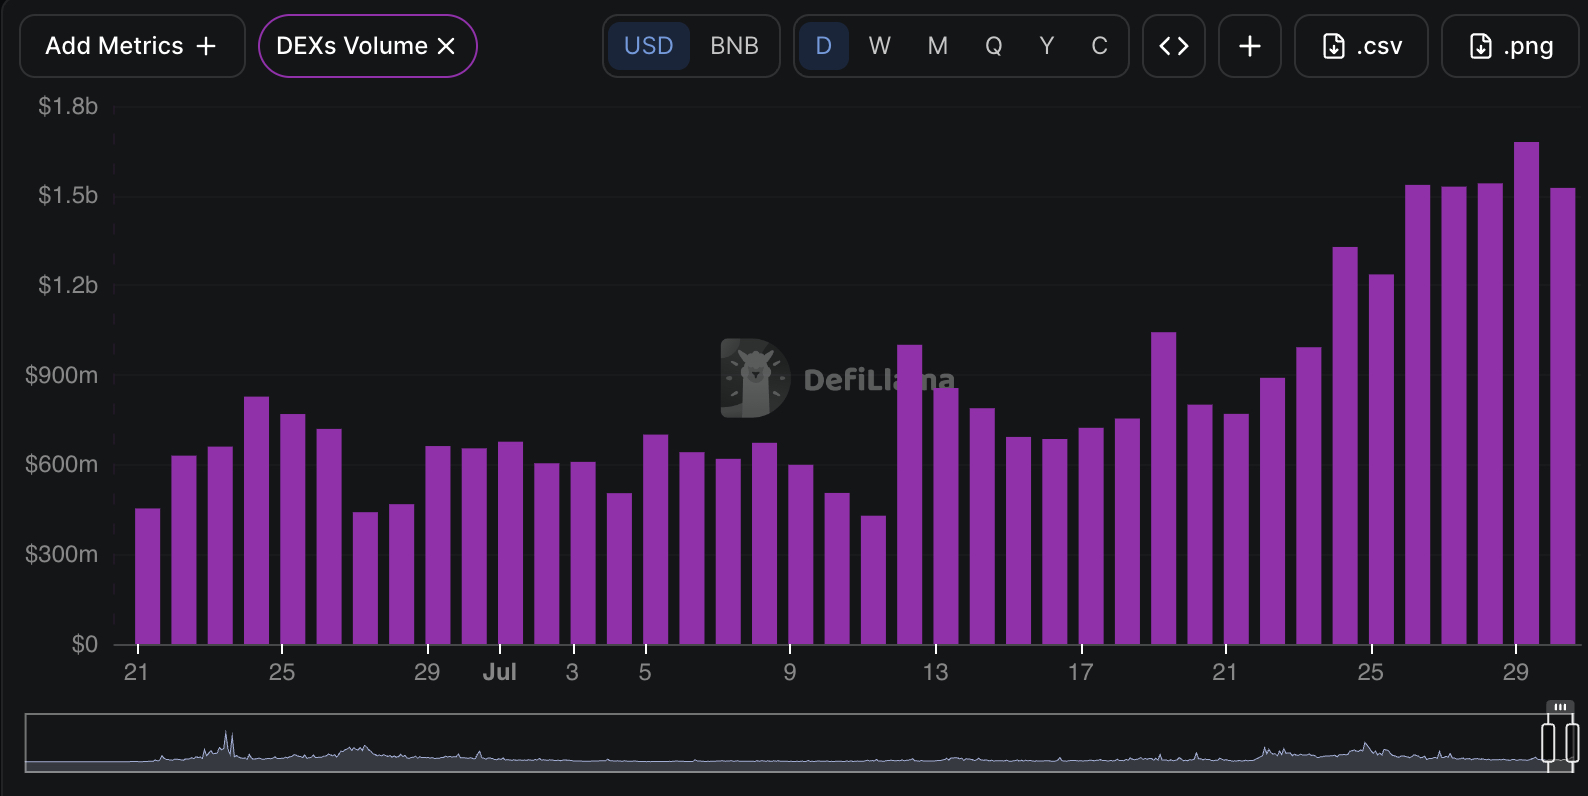
BNB Chain just posted $19 billion in weekly DEX volume, the highest among major blockchains, and the market is taking notice. BNB is trading near $580, holding steady after recent gains. However, BNB price still faces strong resistance around the $620 to $646 zone, where buyers must prove they can sustain a bullish prediction.
Dune Analytics data shows BNB Chain’s $19 billion in weekly DEX volume comfortably outpaced Solana’s $10.6 billion and Ethereum’s $5.8 billion during the same period. PancakeSwap remains the main driver, fueled by retail activity and another wave of memecoin speculation. That combination continues to generate heavy trading volume despite relatively modest capital inflows.

Meanwhile, Robinhood Chain, launched in July 2026, has already processed roughly $3.5 billion in trading during its first week. That rapid start highlights how quickly competition among Layer 2 networks and trading ecosystems can evolve, especially when fresh liquidity enters the market.
Still, DEX leadership alone does not guarantee higher prices. Strong on-chain activity supports demand for BNB, but sustained upside will likely depend on whether buyers can break and hold above the $620 to $646 resistance range. Until then, the recent surge in trading volume remains an encouraging signal rather than confirmation of a lasting breakout.
Discover: The Best Token Presales
BNB Price Prediction: Hit $650 This Week?
BNB is trading around $580, making it the strongest performer among the top 10 cryptocurrencies today, up more than 3%. That rebound puts it back above recent support, although the $620 to $646 resistance zone remains the next major hurdle.
Technical levels remain largely unchanged. A daily close above $646 would strengthen the bullish case and could open the way toward the $650 to $670 range over the coming weeks. Until then, BNB may continue consolidating while buyers build momentum.

If BNB holds above $580, the recent surge in BNB Chain activity should continue supporting sentiment. The chain’s industry-leading DEX volume and renewed memecoin trading have helped attract fresh liquidity. Even so, price action still needs to confirm the improving fundamentals.
On the downside, a daily close below $565 would weaken the current recovery and expose the $540 area. Longer term, some analysts still project $1,300 to $2,100 across future market cycles, supported by Binance’s token burn mechanism and continued ecosystem growth.
Trade BNB and BSC Memecoins on Bybit and Get a Chance to Win Our $1,000 USDT Airdrop
Bitcoin Hyper Targets Early Mover Upside as BNB Tests Key Levels
BNB at $580 with a path to $650 is a legitimate trade, but at a $78B+ market cap, the asymmetry is structurally limited. A move from $588 to $1,100 represents roughly a 90% gain. That’s meaningful, but it’s not the kind of return profile that early-stage infrastructure plays can offer.
Bitcoin Hyper ($HYPER) is building what it positions as the first Bitcoin Layer 2 with full Solana Virtual Machine (SVM) integration, bringing smart contract execution speed and low fees to the Bitcoin ecosystem without sacrificing Bitcoin’s base-layer security.
The pitch is direct: BTC’s trust and finality, SVM’s throughput and programmability. The presale has raised $32.9 million at a current price of $0.0136839, with staking available for early participants.
The broader DeFi liquidity infrastructure narrative, the same one driving BNB Chain’s DEX volume story, is exactly the environment where a Bitcoin L2 with SVM could find traction.
Traders watching BNB for a breakout may find the risk/reward more interesting one layer down the cap table. Research Bitcoin Hyper before the presale closes.
Discover: The Best Crypto to Diversify Your Portfolio
The post BNB Price Prediction: Binance Chain Dominates Weekly DEX Volume Amid Memecoin Revival appeared first on Cryptonews.
Ethereum price remained trapped near $1,920 on July 30 as resistance below $2,000, restrictive US monetary policy, delayed crypto legislation, and broader market fear limited demand.
Summary
- Ethereum price traded near $1,922, below resistance around $1,938 and the psychological $2,000 level.
- 4-hour momentum remains constructive, but a negative CMF reading shows weak capital inflows.
- US spot Ethereum ETFs recorded $18.65 million in net outflows on July 29.
- Fed policy, the delayed CLARITY Act, and geopolitical risks are discouraging aggressive risk-taking.
Ethereum price consolidates below $2,000
According to data from crypto.news, Ethereum (ETH) price was trading around $1,922 at the time of writing, up roughly 0.6% on the daily chart but still unable to turn its July recovery into a clean breakout.
The token has spent several sessions consolidating below $2,000 after briefly reaching the $1,970–$1,980 area earlier in the week. Sellers repeatedly appeared near the upper end of that range, preventing ETH from challenging the psychological threshold.
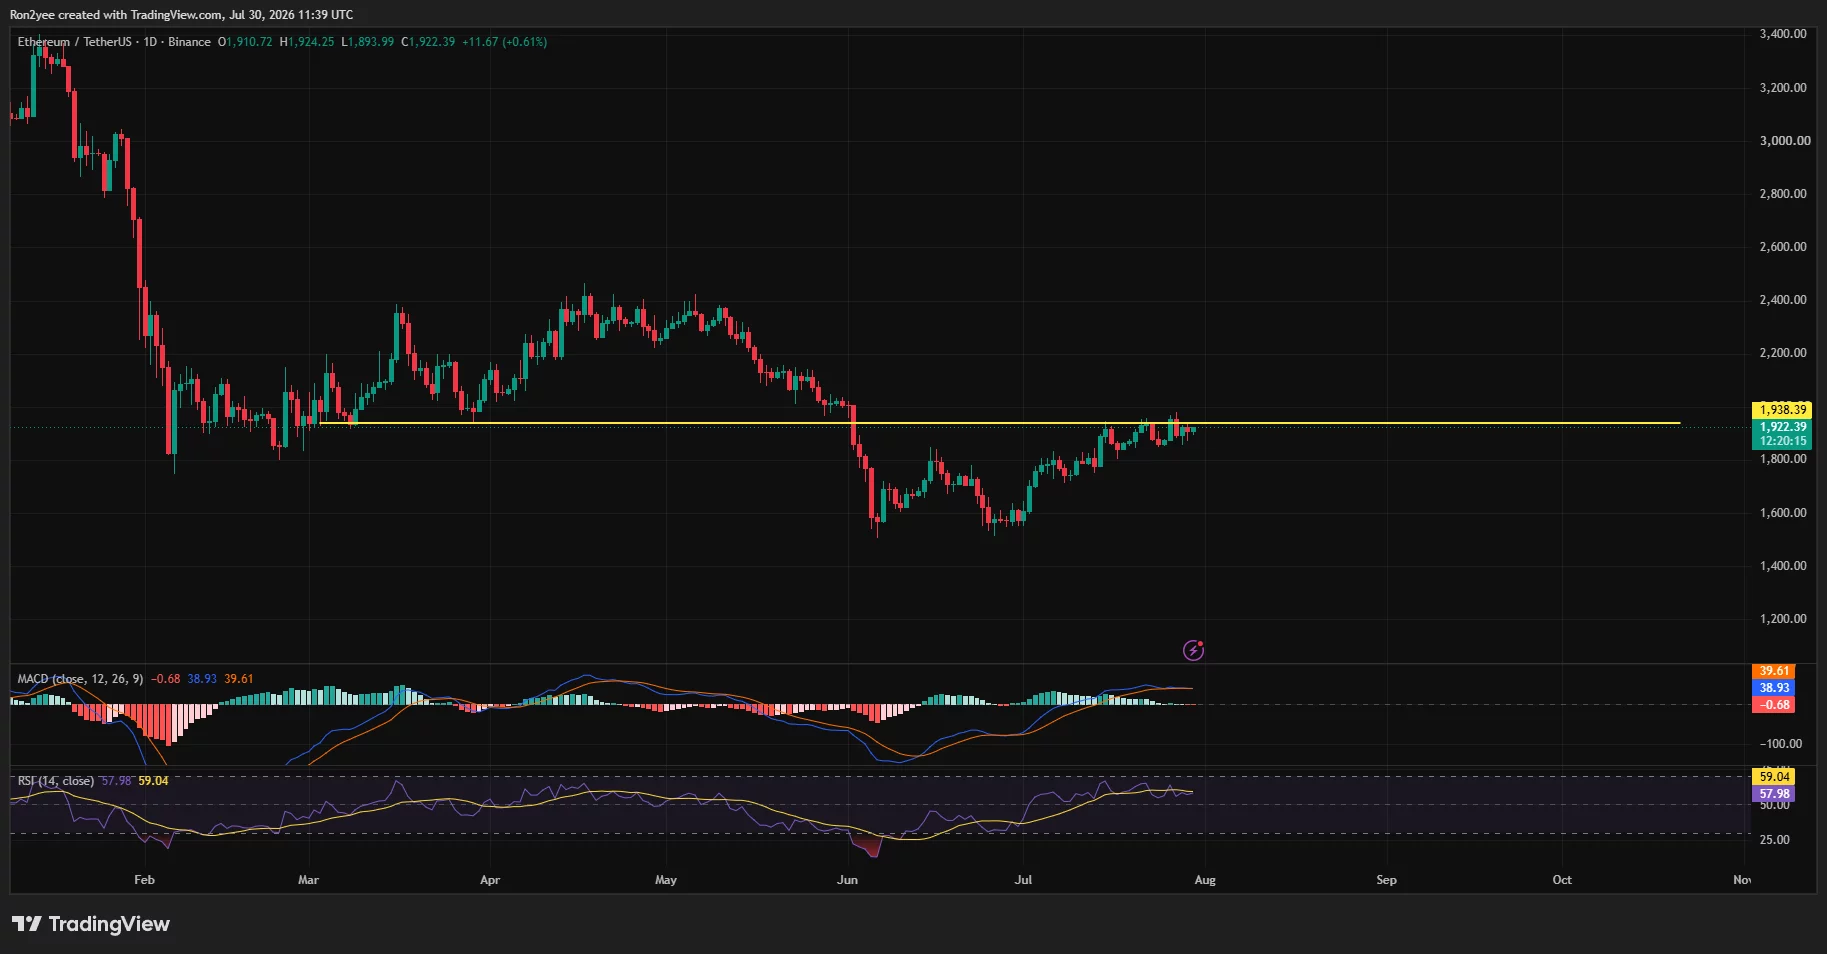
The daily chart places immediate resistance near $1,938, an area that previously acted as support in February and March. Ethereum’s latest candles have formed directly below that level, suggesting buyers and sellers are waiting for a stronger catalyst before taking control.

Momentum has also started to flatten. The daily relative strength index stood near 58, keeping ETH above neutral territory but below overbought levels. The MACD remained positive, although its lines were converging and the histogram had slipped slightly below zero.
These signals point to consolidation rather than a confirmed bearish reversal. However, they also show that the recovery from June’s low near $1,530 has lost momentum as ETH approaches heavier overhead supply.
Macro fear is limiting risk appetite
Ethereum’s stalled breakout follows the Federal Reserve’s decision to maintain its benchmark interest rate at 3.5%–3.75%. Although the decision was widely expected, it gave investors little reason to increase exposure to high-beta assets.
Three Federal Open Market Committee members voted for a quarter-point rate increase, showing that inflation remains a concern inside the central bank. Chair Kevin Warsh also reaffirmed the Fed’s commitment to returning inflation to its 2% target, leaving open the risk of tighter policy if price pressures persist. The Federal Reserve’s statement confirmed the 9–3 decision.
Higher rates increase the relative appeal of interest-bearing assets while raising the opportunity cost of holding cryptocurrencies. The effect is especially important for Ethereum because its recent recovery has depended partly on investors becoming more willing to move back into risk assets.
Geopolitical pressure has added another layer of uncertainty. Brent crude jumped more than 7% on Wednesday amid renewed US-Iran tensions, while the Dow fell 2.2%, the S&P 500 lost 1.5%, and the Nasdaq declined 1.7%. The combination of rising energy prices and weaker equities raised fresh concerns that inflation could remain elevated.
The crypto market’s broader mood reflects that caution. The Fear and Greed Index remained in the “Fear” category on July 30, showing that traders have yet to regain confidence despite ETH’s recovery from its June low.
CLARITY Act delay removes a crucial catalyst
Regulatory uncertainty is also weighing on Ethereum indirectly. The US Senate has postponed work on the Digital Asset Market Clarity Act while lawmakers prioritize a Russia sanctions package and federal nominations.
The delay reduces the likelihood of meaningful progress before the Senate’s August recess. The bill is intended to clarify how the Securities and Exchange Commission and Commodity Futures Trading Commission divide oversight of digital assets.
Ethereum already has access to regulated US spot exchange-traded funds, but wider market-structure rules could encourage exchanges, brokers, and institutions to expand their crypto operations. Delaying those rules leaves investors without a near-term regulatory catalyst.
According to data from SoSoValue, US spot Ethereum ETFs recorded approximately $18.65 million in net outflows on July 29, reversing the previous session’s inflow. The withdrawal was modest compared with the funds’ recent weekly gains, but it showed that institutional demand was not strong enough to force ETH through $2,000 during the latest attempt.
Ethereum breakout needs stronger capital inflows
Ethereum’s 4-hour chart remains more constructive than the macro backdrop. ETH was trading above its 20-period, 50-period, 100-period, and 200-period simple moving averages, which stood near $1,913, $1,903, $1,889, and $1,801, respectively.
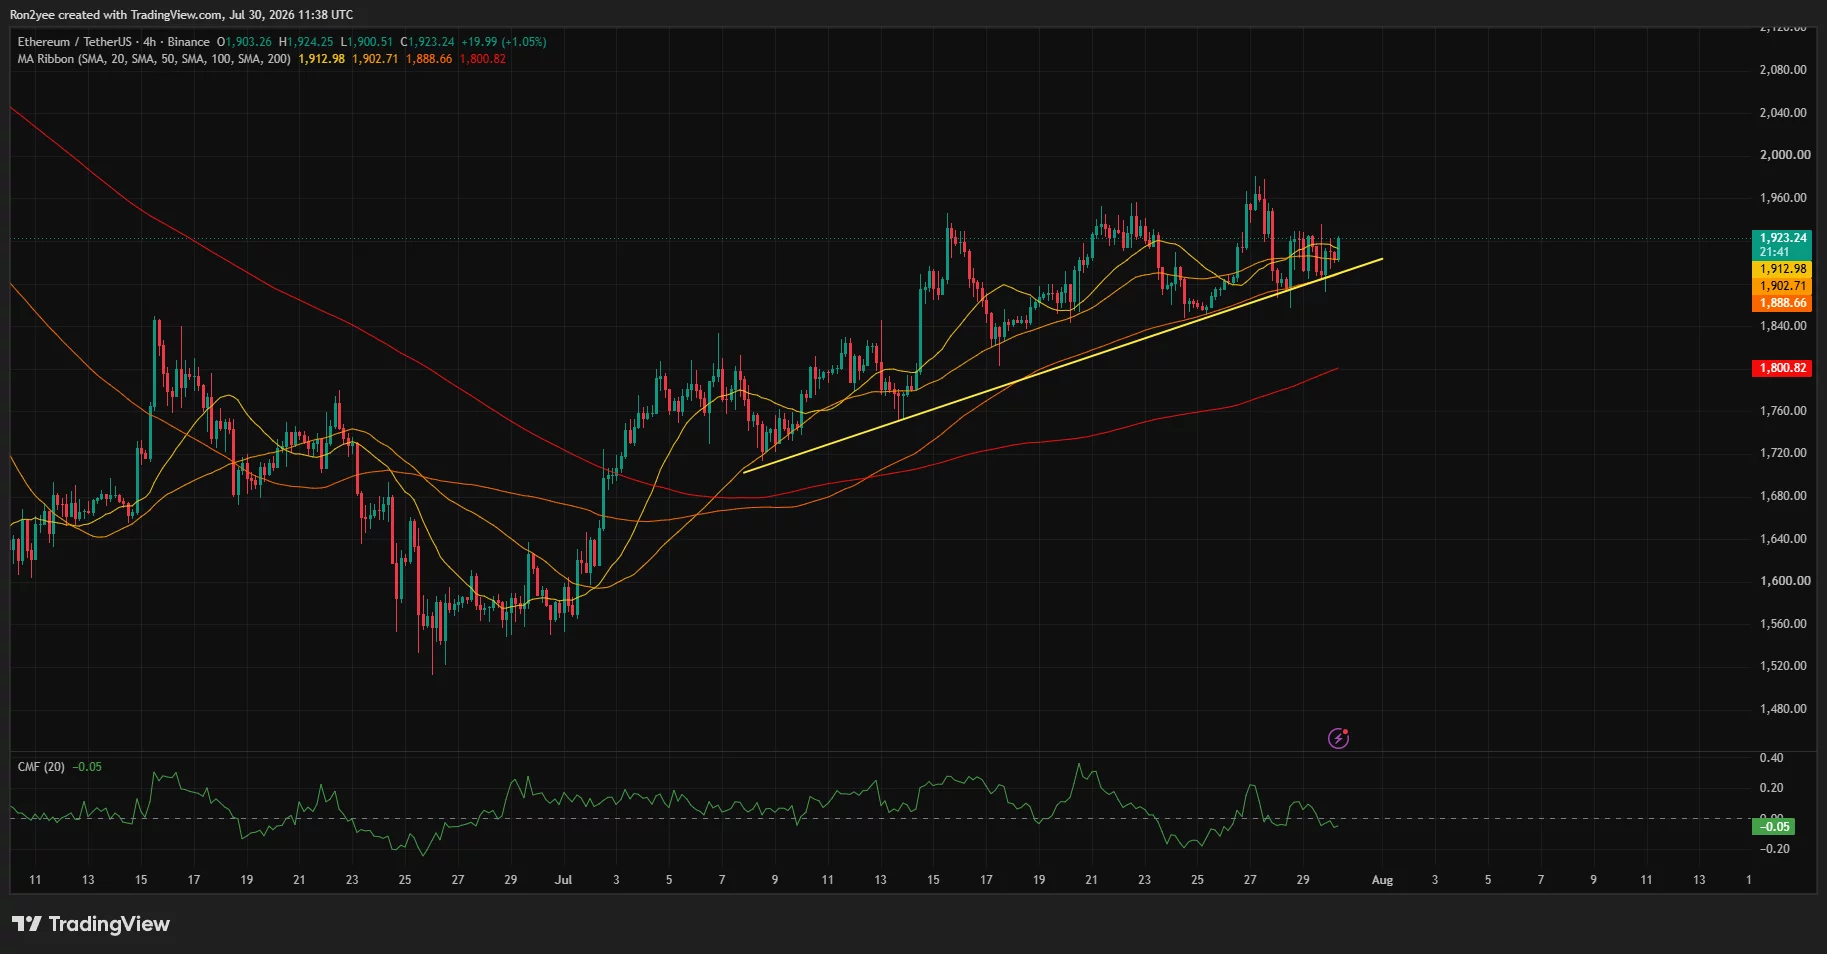
An ascending trendline also continues to support the recovery. That structure gives buyers a path toward $1,960 and $2,000 as long as ETH holds above the $1,888–$1,900 region.
However, the Chaikin Money Flow indicator stood at minus 0.05. A negative reading means capital flow has not confirmed the rising price structure, increasing the risk that another push toward resistance will fade without stronger spot demand.
The liquidation heatmap shows a concentrated liquidity pocket near $1,940, followed by a wider cluster around $1,980–$2,000. A move through $1,940 could therefore trigger short liquidations and pull ETH toward the psychological barrier.
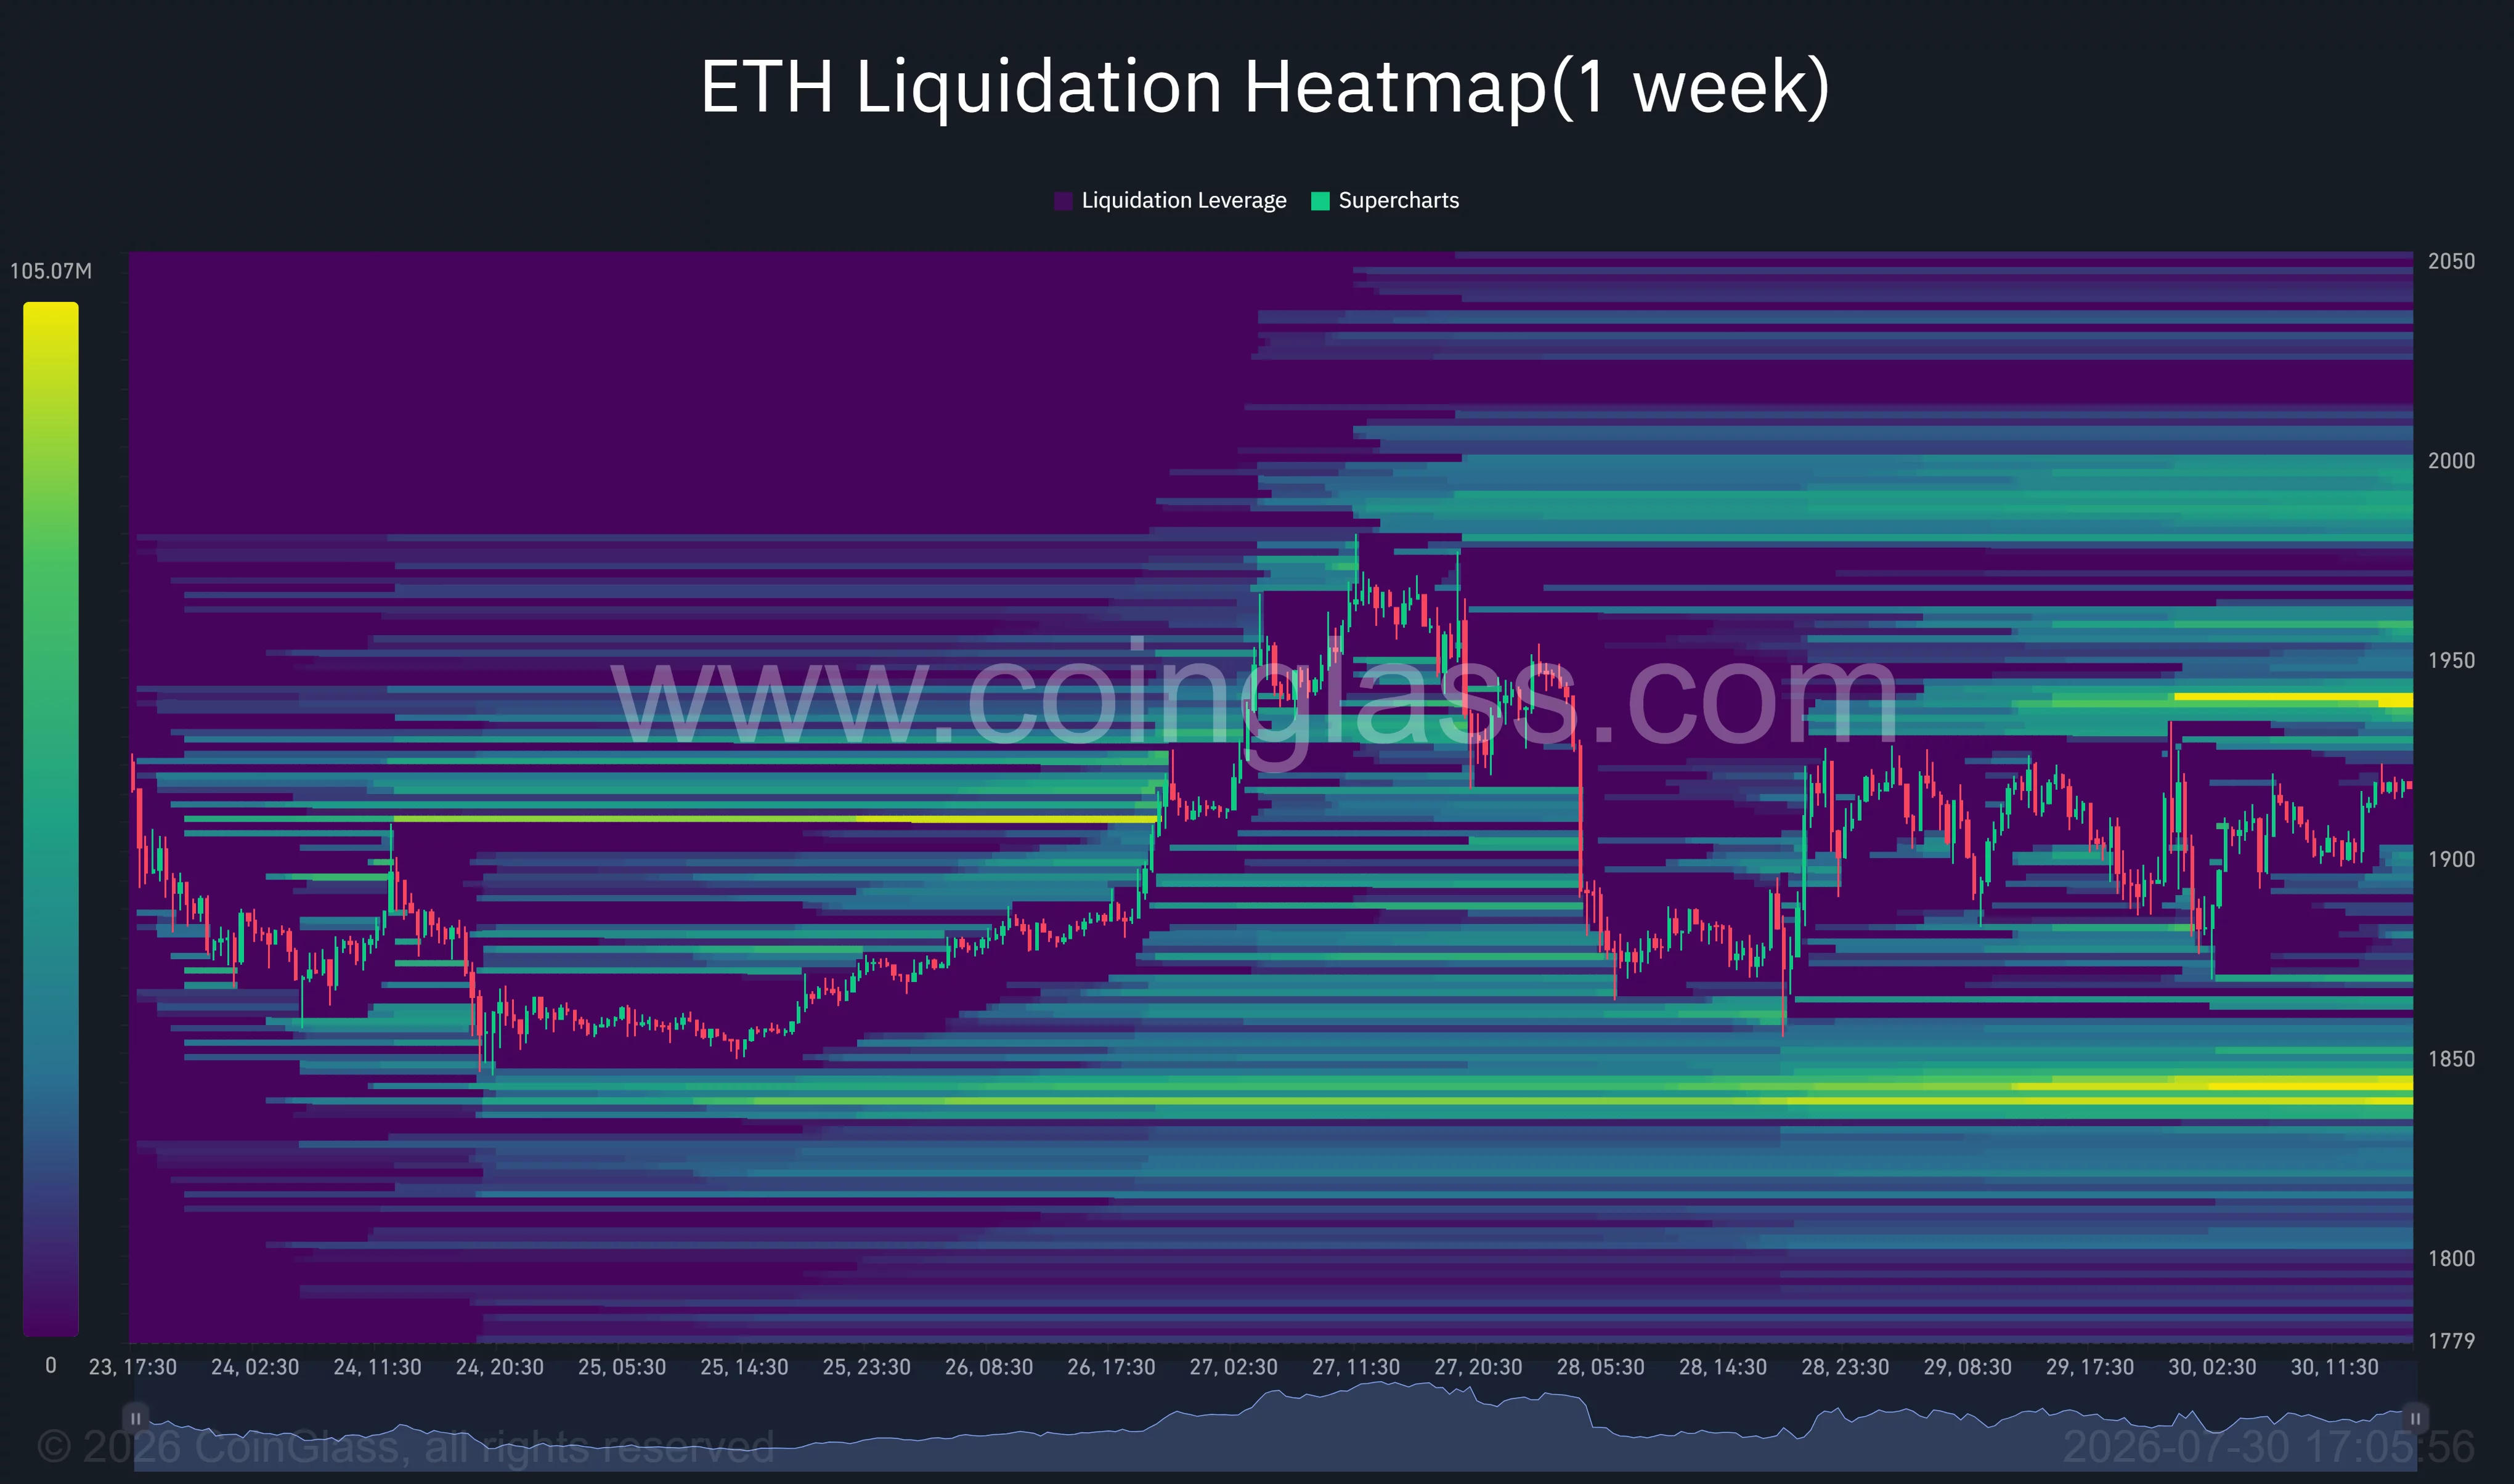
Downside liquidity is concentrated near $1,840. If Ethereum loses the ascending trendline and breaks below $1,888, that lower cluster could attract price and expose the 200-period average near $1,800.
Analysts see upside if support holds
Crypto analyst Michaël van de Poppe expects the recovery to continue while Ethereum remains above its medium-term moving averages.
“As long as ETH remains above the 21-Day MA and the 50-Day MA, higher prices are likely going to follow.”
Van de Poppe also identified US personal consumption expenditure inflation and advance gross domestic product data as the next macro catalysts. Softer inflation could ease pressure on Treasury yields and improve demand for technology stocks and cryptocurrencies.
Analyst Ted Pillows placed Ethereum’s main support slightly lower.
“As long as the $1,850–$1,870 level holds, the next big move for Ethereum will be upside.”
For now, Ethereum’s structure remains resistant to the negative backdrop rather than decisively bullish. Holding above $1,888–$1,900 preserves the recovery, but a sustained breakout will likely require ETH to clear $1,940 with stronger volume before overcoming the larger $1,980–$2,000 supply zone.
Disclosure: This article does not represent investment advice. The content and materials featured on this page are for educational purposes only.
Crypto World
South Korea plans to tax crypto gains over $1,740 as political battle moves to parliament


South Korea plans to impose an up to 22% combined tax on annual crypto gains exceeding 2.5 million won ($1,740).
The country plans on taxing cryptocurrency gains from Jan. 1, 2027, signaling that it does not intend to postpone the measure for a fourth time.
The tax was originally due to take effect in January 2022 and had been postponed until 2025. A December 2024 amendment delayed its introduction by another two years, to the start of 2027.
“We are pushing forward with the plan to tax [cryptocurrency] starting next year as scheduled., Deputy Prime Minister Koo Yun-cheol told lawmakers at a July 29 meeting of the National Assembly’s Finance and Economy Planning Committee.
Under the current framework, income from transferring or lending crypto will be taxed separately as “other income.” Investors will receive an annual deduction of 2.5 million won, with gains above that threshold subject to a 20% national tax rate, or 22% including local income tax, according to Korea’s National Tax Service.
Kim Sang-hoon, of the principal opposition People Power Party, criticized the absence of loss carryforwards and warned that investors could shift activity to overseas centralized exchanges, decentralized platforms and peer-to-peer markets.

Hedge fund Situational Awareness, founded in 2024 by former OpenAI researcher Leopold Aschenbrenner, is reportedly seeking new funding after taking substantial losses during a recent sell-off in artificial intelligence stocks. The Financial Times said the firm has approached investors and lenders for additional capital, and in some cases has offered investors the chance to buy assets from its portfolio.
The fund—tied to a strategy centered on the infrastructure underpinning AI—was reported by the Wall Street Journal to manage roughly $20 billion in assets under management as of June 8. However, the FT reported that the scale of losses and the amount of capital being sought were not disclosed in the discussions it reviewed, which included a July 24 investor letter.
Key takeaways
- Situational Awareness is reportedly raising fresh capital after losses tied to the July sell-off in AI-related equities.
- According to the Financial Times, borrowing amplified the impact of the downturn on the fund’s leveraged positions.
- The fund’s reported AI-infrastructure focus includes trades connected to data centers and power, with past disclosures referencing stakes in Bitcoin mining firms.
- In addition to seeking funding, the firm has reportedly offered some investors the option to purchase portfolio assets.
Why the AI sell-off became a funding story
The immediate catalyst for Situational Awareness’s capital push appears to be the market turbulence that hit AI stock momentum in July. The FT linked the losses to the broader “AI stock collapse” during that rout and emphasized that the fund’s risk profile was made more severe by increased borrowing.
While the FT did not provide a dollar figure for losses or the size of the capital requirement, it reported that Aschenbrenner’s fund had gained 439% after fees through June, as described in the July 24 investor letter. The same letter suggests that strong earlier performance did not prevent a rapid drawdown once AI equities sold off—particularly because leverage can magnify both gains and losses.
That leverage detail matters to investors because it helps explain how a thematic equity thesis—AI infrastructure—can still unravel quickly when valuation compression and liquidity pressures hit the complex simultaneously. The situation also reflects a recurring pattern in crowded “platform” trades: when the market reprices the expected earnings power of AI beneficiaries, funds exposed to those segments may require external capital to stabilize their balance sheets.
What Situational Awareness is betting on
Situational Awareness’s strategy has been described as focused on the physical backbone of AI: the power generation, data centers, and related infrastructure that enable compute-heavy systems. In earlier reporting, Cointelegraph noted that the fund made a notable bet around that infrastructure theme, including investments connected to Bitcoin miners pivoting into AI computing.
Cointelegraph previously pointed to a March filing with the U.S. Securities and Exchange Commission that showed approximately $1.11 billion in positions across seven Bitcoin miner stocks. The stocks cited in that disclosure included IREN, Core Scientific, Riot Platforms, and CleanSpark, among others.
That matters in the current context because it ties the fund’s AI infrastructure thesis to a sector that has its own cycle of operational risk, capital intensity, and market sensitivity. Even if the longer-term narrative is about compute supply, short-term market swings can still create liquidity and valuation pressures for holders of infrastructure-linked equities.
Investors were also offered a chance to buy assets
The Financial Times reported that the fund’s efforts have not been limited to classic fundraising. It said Situational Awareness has offered some investors the option to buy portfolio assets—an approach that can be used when a manager wants to reduce exposure or improve liquidity without immediately selling positions into a weak market.
According to the FT, the account relied on people briefed on the discussions. The report also cited the fund’s July 24 investor letter while noting that the specific amounts involved were not disclosed publicly.
For investors, asset-purchase offers can create a different decision set than a capital raise. Instead of simply assessing whether to contribute more cash, counterparties may need to evaluate the underlying securities at a point in time when market prices may reflect fear or forced selling. That dynamic can produce opportunities for investors willing to underwrite longer-term fundamentals, but it also introduces questions about what happens next if market conditions remain unsettled.
Aschenbrenner’s AGI expectations and the timing
Beyond the immediate funding pressure, the broader storyline includes how closely the fund’s emergence aligned with Aschenbrenner’s public discussion of artificial general intelligence. Cointelegraph previously reported that he authored a series of essays on artificial general intelligence in mid-2024, around the time he launched Situational Awareness, discussing how he believed AGI machines could outpace college graduates by the end of the decade.
Those views help frame why the fund may have been positioned for a sustained build-out of AI-related infrastructure rather than a short-term trade. Yet the funding request underscores an important asymmetry: even a conviction-driven infrastructure thesis can still be pressured by market mechanics—especially when leverage is used to scale returns.
As of publication, Cointelegraph said it contacted Situational Awareness for comment and had not received a response.
What to watch next
Investors watching this situation should focus on two things: whether Situational Awareness secures the capital it seeks without further destabilizing its leveraged positions, and how any asset-buyback offers to investors are priced relative to the market’s ongoing repricing of AI-exposed equities. The next reports—particularly any updates that clarify the scale of losses, borrowing, and proposed restructuring—will determine whether this becomes a one-off liquidity event or a longer process of portfolio adjustment.

Telegram, the messaging platform used by more than 1 billion people worldwide, is facing a major legal challenge in Australia over claims that it failed to stop the spread of terrorism-linked material.
Australia’s online safety regulator, the eSafety Commissioner, launched civil penalty proceedings against Telegram in the Federal Court on Thursday, according to an official statement.
The authority alleged Telegram breached its obligations under the country’s Online Safety Act to address “pro-terror” content by failing to act on multiple user complaints.
The case adds to growing global scrutiny of Telegram’s moderation practices, following legal pressure on CEO Pavel Durov in Russia and France as governments increasingly examine how major online platforms handle harmful content.
Australia alleges Telegram ignored repeated warnings
ESafety said its year-long investigation found that Telegram failed to remove certain unlawful material after becoming aware of it, with some reported content remaining visible for up to three weeks.
The regulator also alleged that Telegram did not take sufficient steps to prevent repeated violations, including removing accounts, channels and groups used to distribute pro-terror material.
According to eSafety, Telegram also failed to detect known extremist content, including footage from the 2019 Christchurch mosque shootings and the 2022 Buffalo mass shooting, before the material was later removed.
Related: Pavel Durov says Telegram to roll out native Gram crypto wallet
The regulator is seeking financial penalties, with violations of Australia’s online safety rules carrying potential fines of up to 54.6 million Australian dollars ($35.8 million).
Telegram has not issued an official statement on the Australian proceedings, but its official X account posted a video captioned “freedom of expression.”
Telegram did not immediately respond to Cointelegraph’s request to comment on this story.
Russia intensifies legal pressure on Durov
Australia’s legal action came a day after Russia’s Federal Security Service (FSB) charged Durov with facilitating terrorist activity and said it had begun procedures to place him on an international wanted list.
Russian authorities alleged that Telegram failed to remove channels, chats and bots that Ukrainian intelligence services, terrorist groups and extremist organizations used to coordinate attacks, recruit operatives and carry out cyber fraud.
Telegram has also not issued an official statement on the latest legal developments in Russia, but posted an image of Durov making a profane hand gesture.

Source: Telegram Messenger
Durov also remains under investigation in France following his August 2024 arrest at Le Bourget Airport. French prosecutors charged him with offenses including complicity in the distribution of illegal content, including material related to organized crime, through Telegram.
Durov has previously criticized what he described as growing threats to online privacy, warning that governments were rolling back protections for the free internet.
“What was once the promise of the free exchange of information is being turned into the ultimate tool of control,” he wrote in an October 2025 post on X.
Magazine: The real reason DeFi projects that survived 2022 crash are shutting down now


Australian authorities are taking Telegram to court over an alleged failure to remove terror-related content, including video of the March 2019 shooting at a Christchurch, New Zealand mosque in which 51 people were murdered, several news outlets reported Thursday.
Julie Inman-Grant, Australia’s Safety Commissioner, said the messaging app founded by Pavel Durov faced a fine of up to $38 million for failing to comply with its obligations under the Online Safety Act, the BBC said.
“This case concerns content linked to some of the most notorious acts of known extremist violence in recent history, including material associated with the Christchurch and Buffalo terror attacks,” Inman-Grant said in a statement, according to Reuters.
“We reject these allegations and will contest them in court,” a spokesperson for Telegram said in response to Reuters a request for comment. Telegram’s anti-terrorism efforts are well-documented, with thousands of extremist communities blocked by the platform in 2026 alone, the spokesperson told the news agency.
Telegram, home of many crypto-related discussion groups, hosting project communities, trading groups, bots and blockchain-based mini apps, did not immediately respond to a CoinDesk request for further comment.

Influencer Sara Gilson’s Husband Will Not Get Funeral: Report
Gemma Owen vows ‘I want to win now’ as Magnolia Cup charity race is won by super sub
Form 4 Eagle Nuclear Energy Corp For: 30 July


-

 Fashion6 days ago
Weekend Open Thread: Brooks Brothers
-
 Sports4 days ago
Commonwealth Games boxing: Jadumani Singh seals dominant 5-0 win over Pakistan’s Sumama Rehman to enter quarter-finals | Commonwealth Games News
-

 Business17 hours ago
Why Trees Belong on the Risk Register
-

 Tech4 days ago
Intel is reversing course and bringing hyper-threading back to its server chips
-

 Crypto World5 days ago
Ripple bought a bank in pieces. The $4 billion audit
-

 Politics3 days ago
Luke Littler dismantles Gerwyn Price to retain title in Blackpool
-

 Politics2 days ago
The Part of the Electric Transition Nobody Wants to Discuss
-
 Entertainment6 days ago
A New Post-Apocalyptic Gundam Anime Series Blasts Into SDCC
-

 News Videos4 days ago
BITCOIN JUST ENTERED THIS CRITICAL ZONE…
-

 Fashion6 days ago
16 Dresses for the High Summer Event
-

 Sports6 days ago
2026 3M Open leaderboard: Scottie Scheffler finds putter in Round 1, sits three back
-

 News Videos7 days ago
The Peugeot Family: How 200 Years of an “Old Money” Dynasty Died in A Boardroom
-

 Business1 day ago
Major shareholder moves on Canyon
-

 Crypto World4 days ago
XRP Ledger adds $2.6B as RWA inflows rank second
-

 Politics4 days ago
Spain sweeps the board at 2026 World Cup with individual awards
-
 Entertainment2 days ago
‘Stargate’ Creator’s New Sci-Fi Series Returns for Season 3 Tomorrow
-

 Crypto World7 days ago
Uniswap (UNI) pushes deeper into tokenized RWAs with permissioned trading pools
-

 Tech5 days ago
Anthropic launches Claude Opus 5, a cheaper AI model for coding, agents and enterprise workflows
-

 Crypto World2 days ago
Kraken Enables Retail Access to Jersey Mike’s IPO via Tokenized Shares
-

 Entertainment5 days ago
Sara Gilson Killed By Husband After Viral “Pedophile” TikTok Video
You must be logged in to post a comment Login