
Crypto World
Latest Bitcoin & Ethereum News, Crypto Prices & Indexes

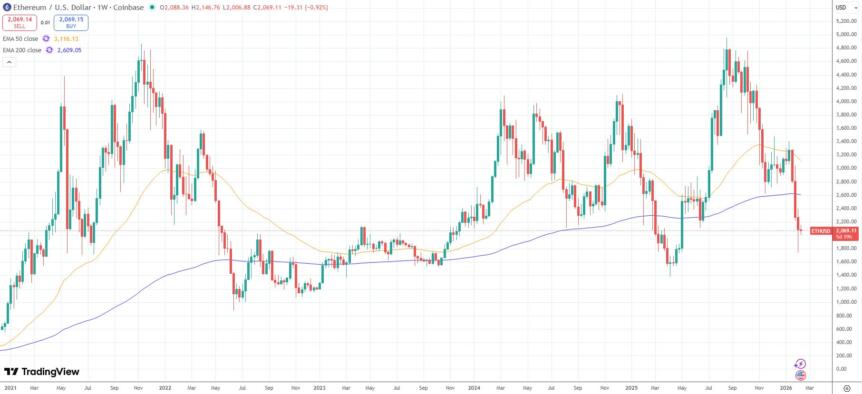
Ethereum (CRYPTO: ETH) has slipped into a zone that market watchers associate with capitulation, as on-chain signals flash bearish, yet opt for caution on whether a definitive bottom is in place. The focal point is the MVRV Z-Score, a gauge that compares current market value to the realized value, effectively measuring how much investors are paying relative to the price at which Ether last moved. A reading around -0.42 indicates Ether is trading below its realized value, a sign historically linked to stress but not a sole predictor of a lasting bottom. While some analysts argue this signals a clear capitulation phase, others warn that the current slide may not reach the extremes observed in past bear markets.
The MVRV Z-Score was designed to flag phases of euphoria or capitulation by showing when market value diverges markedly from realized value. In practice, a notably negative score has preceded bottoming behavior in prior cycles, albeit without a guaranteed timetable. Joao Wedson, a crypto Quant analyst and founder of Alphractal, described the current reading as “showing that Ethereum is indeed going through a clear capitulation process.” Yet, he cautioned that today’s data do not match the intensity of the 2018 and 2022 bear-market lows. The record low for the metric sits at -0.76, observed in December 2018, underscoring the scale of the slide that would be needed for a historical parallel.
The near-term horizon, however, remains contested. Wedson noted that further downside is possible before any sustained recovery takes hold, citing continued market stress and the possibility of liquidity constraints during tax season. “The market is already under stress, but historically, there is still room for further downside before a definitive structural bottom is formed,” he said. Ether’s price action has been volatile, with a sharp decline followed by a tentative rebound, complicating the call on whether the capitulation phase is nearing its end.
The recent price action has been punishing: Ether has fallen about 30% over the past two weeks, sinking to a bear-market low near $1,825 on a Friday before a modest rebound to roughly $2,100 on the following Monday. The moves come amid broader macro fragility and shifting risk sentiment within crypto markets, prompting both caution and opportunism among analysts. Some traders and researchers see this as a rare “buy fear” window, while others warn that risk remains elevated until on-chain dynamics confirm a bottom.
HashKey Group senior researcher Tim Sun told Cointelegraph that historical performance has reinforced the view that Ethereum’s MVRV Z-Score can be a reliable indicator for identifying bottoming zones, particularly when combined with evolving on-chain activity and long-term ecosystem development. “Judging by on-chain activity, protocol evolution, and long-term ecosystem structure, Ethereum’s fundamentals have not seen any substantive deterioration. On the contrary, they continue to improve across several key dimensions,” he said. Still, Sun stressed that current trajectories could change if the primary drivers of decline persist, suggesting that a definitive bottom remains contingent on future liquidity and demand signals.
Meanwhile, other observers offered a more optimistic read. Michaël van de Poppe, founder of MN Fund, argued that the drawdown presents a rare opportunity to consider ETH as an investable bet, noting a substantial gap between the current price and the “fair price” implied by the MVRV ratio. “I think that this is a tremendous opportunity to be looking at ETH,” he tweeted, positing that negative deviations historically precede substantial recoveries when macro and on-chain conditions align. The narrative held that Ether’s network metrics and the broader ecosystem strength underpin a case for accumulation once the weak hands have been flushed out.
Other voices joined the chorus of potential catalysts for a rebound. Andri Fauzan Adziima, Bitrue’s research lead, suggested that persistent negative MVRV zones have historically preceded strong recoveries in subsequent cycles. He contended that ETH’s network fundamentals remained robust and that a long-term accumulation stance could emerge once price risk subsides. “Brutal capitulation now, but historically one of the best ‘buy fear’ windows for ETH,” Adziima said, underscoring the tension between near-term price action and longer-term structural factors.
Market participants acknowledged that the current pullback may be overshadowed by longer-term catalysts such as network upgrades and continued ecosystem maturation, even as price action remains sensitive to near-term liquidity and macro dynamics. The narrative that “buying fear” can yield outsized returns if followed by demand recovery continues to gain traction among several traders, though it remains balanced by caution regarding April liquidity and potential tax-related squeezes.
One of the best “buy fear” windows for Ether
Despite the caution, several observers argued that the current environment could present one of the more compelling entry points for ETH in recent memory. Van de Poppe’s commentary echoed a view shared by others that a sharp deviation below fair value can precede a robust rebound when demand returns and on-chain indicators resume strengthening. The notion is that ETH’s price could be primed for a longer-term recovery even if the immediate path remains choppy.
As the debate continues, sentiment remains nuanced. Some participants emphasize that negative MVRV conditions have historically aligned with durable recoveries once the weak hands capitulate, while others warn that liquidity constraints around the April tax season could delay any sustained recovery. The balance between on-chain fundamentals and macro stressors will likely shape Ether’s trajectory over the coming weeks and into the next quarter.
For investors watching the tape, the key takeaway is that volatility may persist even as underlying fundamentals show resilience. The combination of a negative MVRV reading and persistent price pressure suggests that any bottoming process will require a convergence of favorable liquidity and sustained demand, rather than a simple technical bounce.
Why it matters
The ongoing discussion around Ether’s valuation and bottoming prospects matters for multiple stakeholders. For traders, MVRV-based indicators provide a framework to interpret on-chain signals amid price volatility, while investors may view the current setup as an opportunity to accumulate at a discount relative to realized value. For developers and ecosystem participants, the narrative about Ethereum’s fundamentals—network activity, upgrade timelines, and long-term growth—matters for capital allocation, governance engagement, and potential product developments that could draw renewed user interest.
From a market-wide perspective, Ethereum’s fate remains a bellwether for risk appetite in crypto markets. A clear bottom in ETH could bolster sentiment across altcoins and contribute to a broader risk-on environment, while a protracted drawdown could reinforce caution and delay recovery for other assets. In either case, the episode underscores the importance of on-chain metrics as a corroborating lens for price action, beyond headlines and short-term moves.
What to watch next
- Monitor liquidity conditions around the April tax season for potential downside or relief catalysts.
- Track on-chain indicators related to MVRV Z-Score and general network activity to assess whether a structural bottom forms.
- Watch for sustained price stabilization above recent lows and any acceleration in demand signals that could precede a rebound.
- Observe broader macro factors and crypto market flows that could influence risk sentiment and capital allocation.
Sources & verification
- On-chain MVRV Z-Score interpretation and commentary by Joao Wedson of Alphractal (tweet/status referenced in the article).
- Cointelegraph reports on Ether’s 30% decline over a two-week period and the subsequent move to around $2,100.
- HashKey Group insights from Tim Sun regarding MVRV Z-Score reliability and Ethereum fundamentals.
- Industry commentary from Michaël van de Poppe and Bitrue’s Andri Fauzan Adziima on negative MVRV zones and potential buy opportunities.
https://platform.twitter.com/widgets.js


Stablecoin monthly transaction volume reached $7.2 trillion in February 2026, overtaking the Automated Clearing House (ACH) network’s $6.8 trillion for the first time.
The ACH is an electronic payment network in the United States that enables transfers directly between bank accounts. It has become the most widely used infrastructure for handling electronic money movement across the country.
Follow us on X to get the latest news as it happens
It’s a symbolically significant milestone showing how massive crypto payment rails have become. The February crossover did not happen in isolation.
Artemis data shows that stablecoin volume climbed further in March, reaching $7.5 trillion. That figure matched ACH over the same period.
Meanwhile, the stablecoin market has continued to grow. DefiLlama data showed that the market capitalization surpassed $316.7 billion, setting a new all-time high.
Notably, a recent report revealed that stablecoins dominated crypto markets in Q1 2026. They made up 75% of total trading volume, the largest share on record.
Overall transaction volume exceeded $28 trillion during the quarter, marking another all-time high. However, according to CEX.IO, automated trading played a major role, with bots responsible for 76% of the volume, the highest proportion seen in the past two years.
“Q1 2026 made the 2022 comparison hard to ignore. Stablecoin dominance rising sharply, capital rotating defensively, USDT and USDC diverging, automation surging, and retail pulling back — these patterns appeared together in mid-2022, and they are reappearing now. If broader bearish conditions persist through the year, stablecoins could see further demand and dominance gains in the coming quarters,” the report read.
The rising volumes reflect more than speculative activity. It also highlights the expanding use of these assets in real-world applications, including business-to-business (B2B) payments, cross-border transactions, and other financial activities.
Subscribe to our YouTube channel to watch leaders and journalists provide expert insights
The post Stablecoins Moved More Money Than the US Financial System’s Backbone appeared first on BeInCrypto.


The International Monetary Fund also warns that the distribution and speed of on-chain transactions bring new challenges and risks that require international coordination.
In a new staff research note published on Thursday, The International Monetary Fund (IMF) argues that tokenization represents a “structural shift in financial architecture,” not just an incremental efficiency gain.
Authored by Tobias Adrian — the IMF’s Financial Counsellor and Director of the Monetary and Capital Markets Department — the report focuses on the tokenization of real-world assets (RWAs) within the regulated financial system, namely banks, finance infrastructure, and asset managers, arguing that’s where “the most consequential transformation occurs.”
Settlement Speed Is a Double-Edged Sword
The IMF’s core thesis is that tokenization doesn’t just make existing finance faster, but represents a shift in how trust, settlement, and risk management work. In TradFi, trust is embedded in regulated intermediaries and time-delayed processes (end-of-day settlement, batch reconciliation). Those frictions, the report notes, actually serve a purpose: they give regulators and institutions time to intervene before a crisis cascades.
Tokenization, which the note defines broadly as “the representation of financial assets and liabilities on programmable digital ledgers,” collapses those frictions, bringing what is generally referred to as the primary benefits of blockchain: near instant settlement, 24/7 liquidity, etc. But, the report notes, that this reduction of barriers introduces new challenges and risks.
“Liquidity demands materialize instantaneously,” the note warns, creating conditions where a smart contract bug or oracle failure could trigger a chain reaction before anyone can respond. The IMF argues:
“When trading, settlement, custody, and compliance are embedded in code, supervision must extend beyond market participants to the design, governance, and resilience of market infrastructures themselves. Failures can
originate in smart contracts, data feeds, or consensus mechanisms, rather than firm balance sheets.”
Who Controls the Money?
A major focus of the report is on the quetion of settlement assets. The IMF identifies three competing models: tokenized commercial bank deposits, regulated stablecoins, and what the report refers to as wholesale central bank digital currencies (wCBDCs), with each carrying different risk profiles.
Cross-Border Gaps and the Fragmentation Risk
The report highlights that a major concern around the tokenization of RWAs in regulated financial markets is jurisdictional: tokenized transactions execute across borders at machine speed, while resolution and crisis management frameworks are still built around nationally domiciled institutions.
“Tokenization challenges crisis management and resolution frameworks that are built around nationally domiciled institutions, territorially bounded infrastructures, and jurisdiction-specific legal authority.“
In its research note, the IMF calls for international coordination and legal frameworks that can govern code itself, not just the institutions that deploy it.
“The key levers of control may lie in governance keys, consensus mechanisms, or smart contract logic operating across borders,” the note reads — a setup where no single regulator has a clear handle.
The report lands as the value of tokenized RWAs continue to surge, driven in part by tokenized funds from TradFi giants like BlackRock, Franklin Templeton, and Janus Henderson.
In 2025, tokenized RWA value tripled over the course of the year as a wave of financial institutions began tokenizing U.S. treasuries, private credit, and other RWAs.
Industry forecasts project the sector could hit $100 billion by end of 2026, with more than half of the world’s 20 largest asset managers expected to have launched RWA tokens by year-end.
Meanwhile, stablecoins have already begun functioning as mainstream financial infrastructure, with the GENIUS Act providing U.S. regulatory clarity in mid-2025.
This article was written with the assistance of AI workflows. All our stories are curated, edited and fact-checked by a human.
A solo Bitcoin miner secured a roughly $210,000 block reward on Thursday, proving that the so-called “mining lottery” is still paying out even if industrial operators dominate the network.
The miner, connected to CKPool’s solo service, found block 943,411 and earned 3.139 BTC in subsidy and transaction fees, according to data from block explorer mempool.space.
Solo mining remains rare. Statistics compiled by Bennet’s tracker show that solo mining pools have found just 20 Bitcoin (BTC) blocks over the last 12 months, paying out a total of 62.96 BTC, roughly one win every 18.7 days on average. The longest “drought” between blocks was 58 days, and the previous solo win came on Feb. 28.
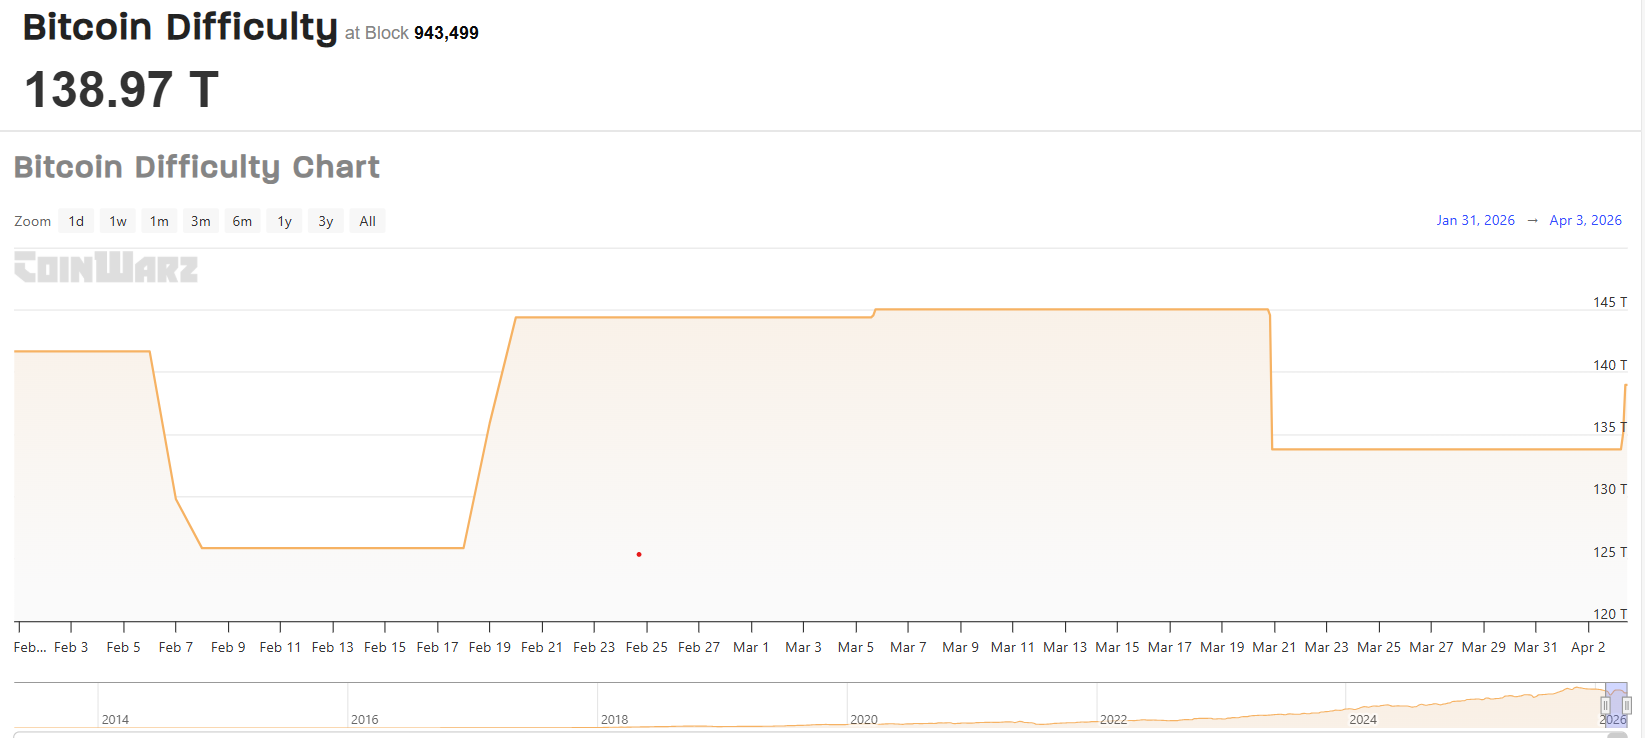
The win comes as Bitcoin mining grows increasingly competitive. Network difficulty, the measure of how hard it is to find a block, recently recorded its steepest adjustment since February, falling about 7.7% before rebounding 3.87% in the past 24 hours, reflecting weaker hashrate and briefly improving miners’ odds.
Bitcoin difficulty relief is fleeting
Even so, current difficulty levels remain near historic highs, meaning the probability of any single solo miner discovering a block is still vanishingly small.
Related: Solo Bitcoin miner bags over $200K block reward using rented hashrate
Public trackers like CoinWarz show Bitcoin’s difficulty has climbed orders of magnitude over the past decade, with only brief downward adjustments when miners switch off unprofitable rigs or redirect machines to other workloads such as artificial intelligence.

As difficulty grinds higher and input costs rise, the economics of mining increasingly favor large, well-capitalized operators over hobbyists.
Major listed Bitcoin miners are responding by reshaping their balance sheets and fleet strategies rather than betting on luck. Riot Platforms sold 3,778 BTC during the first quarter of 2026, according to a Thursday release, adding to a number of crypto miners and firms that have sold Bitcoin recently, including MARA Holdings, Genius Group and Nakamoto Holdings.
Against that institutional backdrop, the CKPool win stands out as a reminder that individuals can still, on rare occasions, beat the odds.
Magazine: Bitcoin may take 7 years to upgrade to post-quantum — BIP-360 co-author
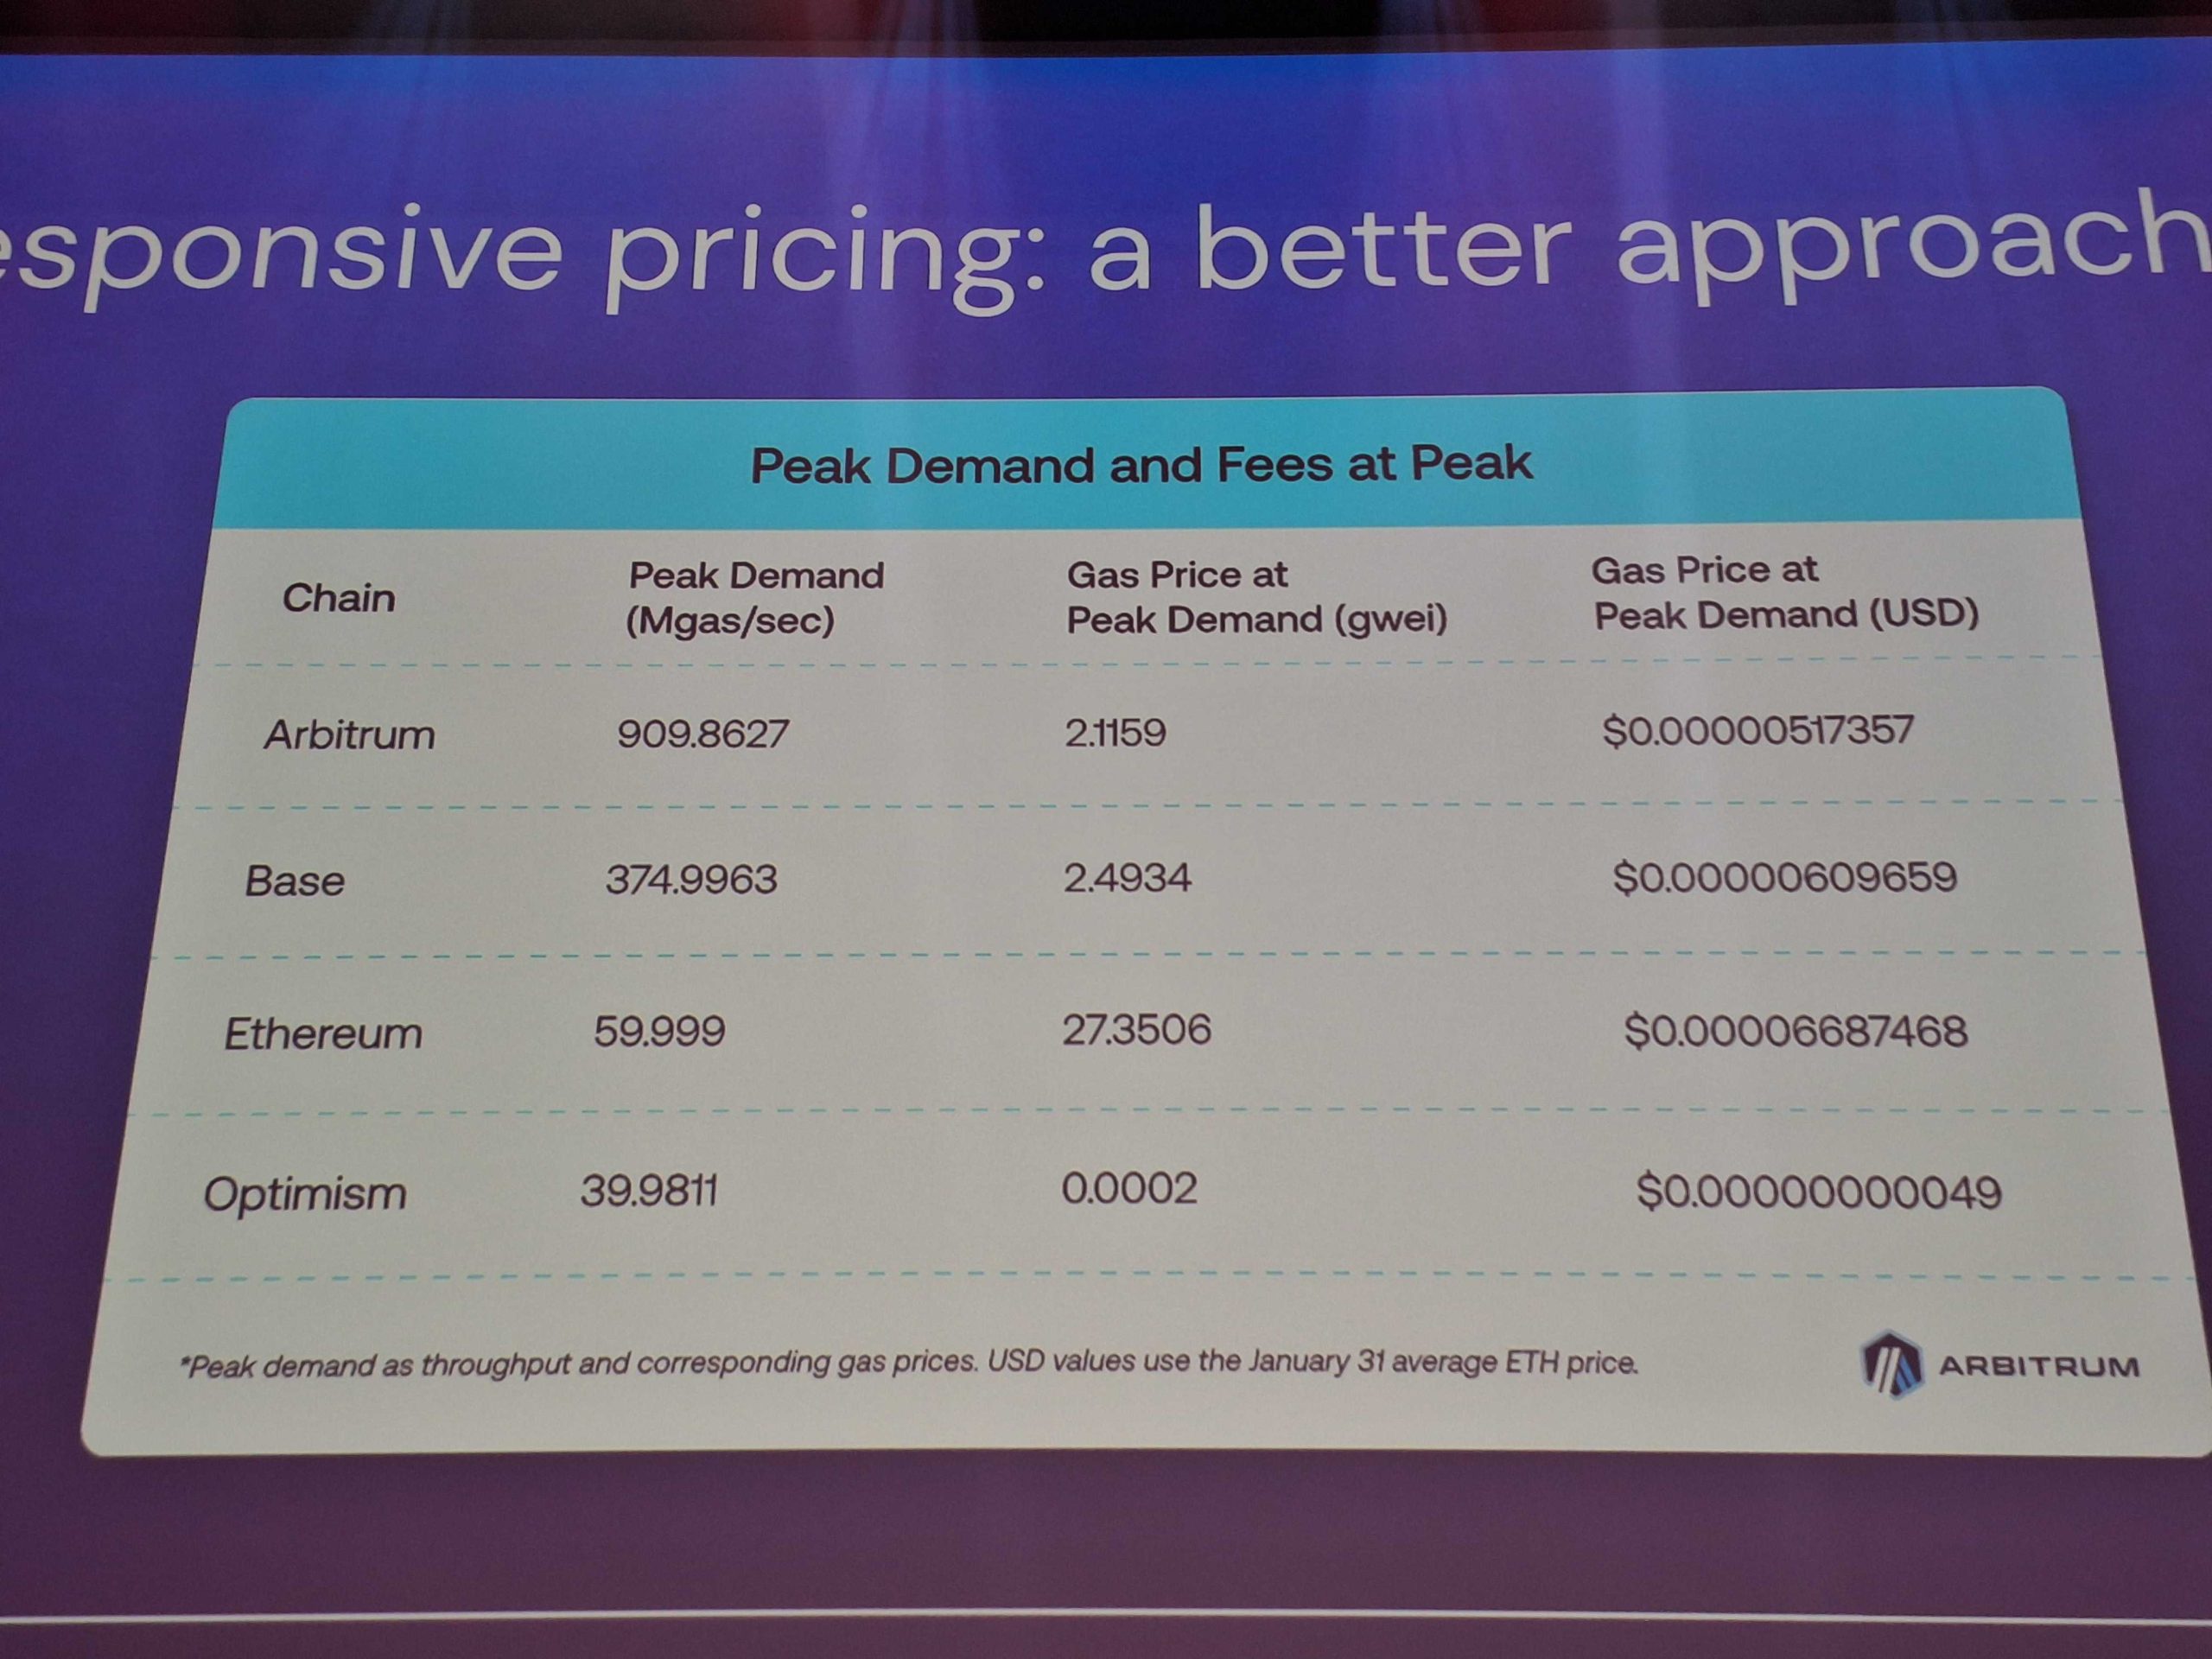
Ethereum layer-2 networks need “responsive pricing” to scale to billions of users and reduce the fee swings that still accompany congestion, Offchain Labs co-founder Edward Felten said during a keynote at EthCC 2026.
Ethereum’s EIP-1559 upgrade launched in August 2021, as part of the London hard fork. It reformed the Ethereum fee market by modifying the gas fee limit and introduced a feature that burns part of the transaction fees, removing them permanently from circulation.
Felten said gas-price swings are still the main mechanism for protecting networks from being overrun during periods of heavy demand, even though that produces the kind of fee volatility mainstream users tend to reject.
“[With responsive pricing], you can see more traffic at lower gas prices without overrunning the infrastructure.”
Volatile gas prices have long been a barrier to mass adoption, particularly for users accustomed to fixed or predictable transaction costs in traditional financial systems.
The issue matters because Ethereum’s scaling story is no longer just about adding more throughput. It is increasingly about whether layer-2 networks can make transaction costs predictable enough for mainstream-style apps while still pricing congestion honestly enough to protect infrastructure under heavy demand. Arbitrum’s dynamic pricing rollout is now one of the first live tests of that tradeoff.

Arbitrum One the first L2 to adopt responsive pricing
Arbitrum One adopted dynamic pricing in January. It described the model as an “Arbitrum platform direction to make fees more predictable under demand by aligning prices with real network bottlenecks.”
Related: Gavin Wood’s biggest hope: Free crypto transactions and Web3 tech worldwide
Felten shared multiple charts showing how Arbitrum gas fees remained lower during peak network volumes than fees on the Base network and other L2s that rely on EIP-1559.

Arbitrum One is the largest L2 with $15.2 billion in TVL, while Coinbase’s Base Chain is second with $10.9 billion, according to data from L2beat. L2s are securing over $39.7 billion in cumulative TVL, up 4.6% over the past year.
While responsive pricing may be more scalable and more transparent about underlying costs, its biggest downside is lower predictability than EIP-1559, according to Julian Kors, a senior developer and founder of execution workspace startup Pulsar Spaces.
The debate is not about one model being better, but whether networks optimise for “predictability and mechanism design purity or for efficiency and real-time cost alignment. EIP-1559 does the first very well. Responsive pricing leans into the second,” he told Cointelegraph.
Related: Ethereum Foundation accelerates 70,000 ETH staking plan after BitMine sale
Responsive pricing is a step forward, but the gas model needs replacing
Jerome de Tychey, president of Ethereum France and EthCC, told Cointelegraph that responsive pricing could improve user experience by making fees more closely reflect actual network demand.
Cyprien Grau, project lead at gasless Ethereum L2 Status Network, agreed, calling the new pricing model a “real improvement in fee accuracy.” However, the model still relies on a “fee market,” meaning that users may still face variable costs and gas spikes during congestion, he told Cointelegraph.
“It doesn’t solve the structural problem: L2 gas fees trend toward zero as scaling on L1 and L2s improves and competition intensifies. Responsive pricing makes the decline smoother, but you’re still building a revenue model on a depreciating asset.”
Grau added that responsive pricing is the “most advanced version of the gas model,” but said the gas model needs replacing. “L2s that scale to billions of users will be the ones where users never think about gas at all, and where networks’ economics don’t depend on charging them for it,” he added.
The fee model debate comes as parts of the Ethereum ecosystem are already rethinking the original rollup-centric scaling thesis. In February, Vitalik Buterin argued that some layer-2 assumptions no longer held and that future scaling should rely more heavily on the mainnet and native rollups.
L2 networks were created to scale Ethereum and offload part of the transaction load from the mainnet. However, Ethereum is now reconsidering its L2-centric approach, as these networks have siphoned significant economic value from the mainnet.
Magazine: Ethereum’s Fusaka fork explained for dummies — What the hell is PeerDAS?


RootData’s project claiming lets teams verify and manage profiles, lifting transparency scores over 30% and driving a 220% jump in heat and visibility across 220+ partners.
Summary
- RootData says more than 20 well‑known projects, including Bitway, Flock, Morph, and Solv, have claimed their profiles in the past week.
- Certified projects that complete information updates see average transparency scores jump over 30%, driving a 220% surge in RootData “heat value” and visibility.
- Over 120 projects have now been certified, gaining direct control over tokenomics, investor and team data, and syndication to more than 220 downstream data partners.
Web3 asset data platform RootData reports that adoption of its project claiming feature is accelerating, with more than 20 recognizable names — including infrastructure and DeFi projects like Bitway, Flock, Morph, and Solv — formally “settling in” over the past seven days. As the company notes in its latest update, projects that complete the claim process and supplement missing fields are seeing their comprehensive transparency scores rise by an average of more than 30%, a shift that in turn pushes their RootData “site heat value” up by roughly 220%. RootData says the move is already “greatly enhancing community trust and market attention,” with the total number of fully certified projects now exceeding 120.
According to RootData’s explainer and posts on X, the project claiming feature allows official teams to “claim your project for free, get verified, and directly manage & update” key datasets on their dedicated pages. That includes token economic models, investor lists, core team members, roadmap and milestones, as well as calendar events such as TGE dates, exchange listings, and governance votes. Once verified, teams can push updates through a one‑click sync system that RootData says distributes changes in real time to more than 220 partner platforms, ranging from exchanges and wallets to research terminals and media dashboards.
RootData’s transparency score, which it describes as measuring the “completeness and timeliness of project information,” is central to this approach. In prior analysis shared via a transparency alert, the platform highlighted that spot tokens with higher average disclosure levels (around 74.7%) tend to show shallower drawdowns and stronger rebounds than lower‑disclosure “Alpha” tokens (around 62.7%), arguing that better information reduces room for teams to exploit asymmetry with retail investors.
That framing has led RootData and commentators on Binance Square to urge teams to treat disclosure quality as a competitive advantage rather than a compliance chore. A recent post amplified by ChainCatcher put it bluntly: projects missing core information on financing, tokenomics or team composition risk being flagged as “black box” listings and deprioritized by sophisticated users and data aggregators.
In contrast, projects that claim profiles and keep them up to date now benefit from higher transparency scores, stronger on‑site heat rankings, and broader syndication across RootData’s data network — an increasingly important distribution channel in a cycle where listing venues, VC desks and retail traders all lean heavily on third‑party dashboards to filter signal from noise.
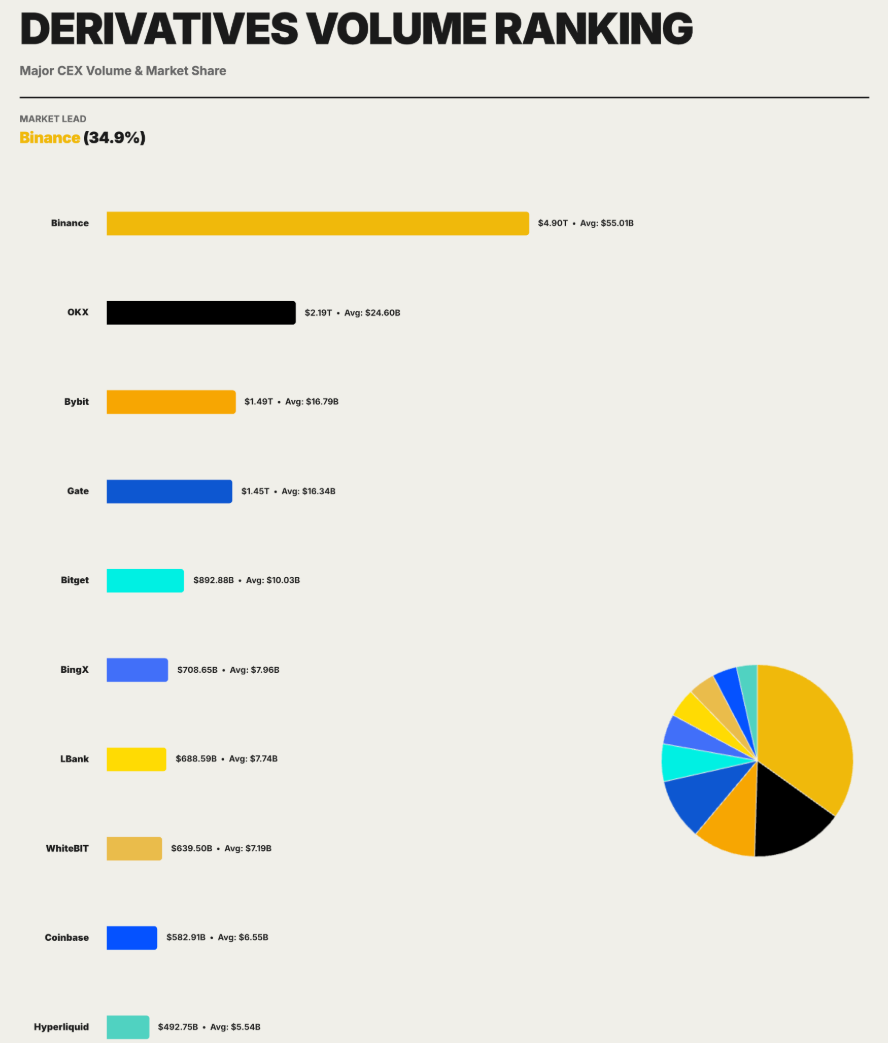
Binance maintained its leading position in crypto derivatives trading in the first quarter of 2026, while decentralized exchange Hyperliquid broke into the top 10 venues by volume, according to CoinGlass.
Derivatives trading remained the dominant force in the crypto market in Q1 2026, totaling $18.6 trillion compared with $1.94 trillion in spot trading, according to a CoinGlass report on Friday.
The analysts said trading activity remained strong over the quarter, though liquidity and capital became even more concentrated at the top. “Q1 was not about euphoria. It was about recovery, concentration, and shifting market structure,” CoinGlass said.
The data shows how a small group of exchanges continue to dominate crypto derivatives, even as decentralized platforms begin to emerge as competitors.
Binance handles $4.9 trillion in derivatives versus $640 billion in spot
Binance processed about $4.9 trillion in derivatives volume in Q1 2026, or roughly 35% of activity among the top 10 exchanges. In 2025, the exchange held about 29% of $85.7 trillion in total derivatives volume.
The exchange also dominated spot markets at a similar share, with Q1 volumes amounting to roughly $640 billion, or around 34% of total volumes among the top 10.

Binance’s dominance points to its resilience despite controversy during the quarter, after several crypto community members, including OKX founder and CEO Star Xu, alleged that it played a major role in the mass liquidation event of Oct. 10, 2025.
Related: Binance sues Wall Street Journal amid report of DOJ Iran probe
Binance repeatedly denied the claims, saying the crash was driven primarily by macroeconomic factors, market maker risk controls and network congestion.
Hyperliquid enters top 10 as perpetual DEXs gain ground
Hyperliquid, a perpetual decentralized exchange, reached a key milestone in the first quarter of 2026, breaking into the top 10 derivatives exchanges by volume roughly three years after its launch.
The platform recorded about $492.7 billion in trading volume during the quarter, securing its place among the industry’s largest derivatives venues, including Binance, OKX, Bybit, Gate, BitGet, BingX, LBank, WhiteBIT and Coinbase.
Related: Wallet in Telegram launches perpetual futures trading with Lighter
The milestone comes after steady growth across previous quarters. In its 2025 report, CoinGlass said Hyperliquid nearly dominated the entire perp DEX sector, with its market share reaching up to 70% at times.
Perp DEX activity also expanded rapidly in 2025, with volumes nearly tripling over the year and accounting for up to 90% of volumes across major derivatives exchanges.
Key points:
-
Buyers are attempting to maintain BTC above the $66,500 level, but several analysts believe that the $60,000 level may crack.
-
Some major altcoins risk breaking below their immediate support levels, signaling that bears remain in control.
Buyers are attempting to push and maintain Bitcoin (BTC) above the $66,500 level, but are facing stiff resistance from the bears. Although recovery attempts are being sold into, the BTC supply in profit and loss metric suggests that BTC may be close to a bottom.
CryptoQuant analyst “Darkfost” said that there are currently about 8.2 million BTC in loss, compared to roughly 10.6 million BTC during the previous bear market. That suggests the market is at a comparable level of undervaluation seen during the previous bear phase.
However, not everyone believes that a bottom is in. Chartered Market Technician Aksel Kibar said in a post on X that BTC may sink to $52,500 if its developing bearish pattern breaks down.

During bear phases, select analysts turn overly negative and forecast gloom and doom for the markets.
One such projection is from Bloomberg Intelligence senior commodity strategist Mike McGlone, who said in a post on X that BTC may collapse to $10,000. Contrary to that opinion, ARK Invest CEO Cathie Wood said in an interview with CNBC that BTC will not see 85-95% collapses from its all-time high.
Could BTC and select major altcoins hold above their support levels? Let’s analyze the charts of the top 10 cryptocurrencies to find out.
Bitcoin price prediction
BTC turned down from the moving averages on Thursday, and the bears are attempting to strengthen their position by pulling the price below the support line.

If they succeed, the bullish ascending triangle setup will be invalidated. That may force the aggressive bulls to close their positions. The BTC/USDT pair may then slump to the crucial $62,500 to $60,000 support zone.
The first sign of strength will be a close above the moving averages. That opens the doors for a rally to $72,000 and then to $76,000. A close above $76,000 will complete the ascending triangle pattern, propelling the pair toward $84,000.
Ether price prediction
Ether (ETH) failed to rise above the $2,200 resistance on Wednesday, indicating that the bears are aggressively defending the level.

The flat moving averages and the relative strength index (RSI) just below the midpoint do not give a clear advantage either to the bulls or the bears. That suggests the ETH/USDT pair may swing between $2,200 and $1,916 for some time.
Buyers will have to push and maintain the ETH price above the $2,200 level to gain the upper hand. If they do that, the pair may climb to $2,400 and thereafter to $2,600. On the downside, a close below $1,916 might sink the pair to the critical $1,750 support.
BNB price prediction
BNB (BNB) turned down from the moving averages on Wednesday and dropped to the solid support at $570.

The downsloping 20-day exponential moving average ($620) and the RSI near the oversold territory signal that the path of least resistance is to the downside. If the $570 support breaks down, the BNB/USDT pair may resume the downtrend to $500.
This negative view will be invalidated in the near term if the BNB price turns up and breaks above the moving averages. That suggests the pair may continue to oscillate between $570 and $687 for a few more days.
XRP price prediction
XRP (XRP) turned down from the 20-day EMA ($1.36) on Thursday, and the bears are striving to pull the price below the $1.27 support.

If they manage to do that, the XRP/USDT pair may plummet to the Feb. 6 low of $1.11. This is a vital support for the bulls to defend, as a close below it may extend the decline to the support line of the descending channel pattern near $1.
Buyers are likely to have other plans. They will attempt to drive the XRP price above the moving averages, clearing the path for a recovery to the $1.61 level and then to the downtrend line.
Solana price prediction
Solana (SOL) has reached the support of the $76 to $95 range, indicating that the bears continue to exert pressure.

Buyers are expected to aggressively defend the $76 level, but the relief rally is likely to face selling at the moving averages. If the SOL price turns down from the current level or the moving averages and breaks below $76, it signals that the bears are back in the driver’s seat. There is support at $67, but if the level cracks, the next stop may be $50.
Contrarily, if the SOL/USDT pair turns up and breaks above the moving averages, it signals that the range-bound action may continue for a while longer.
Dogecoin price prediction
Dogecoin (DOGE) is getting squeezed between the moving averages and the $0.09 support, signaling a potential range expansion in the short term.

A close below the $0.09 support indicates that the bears are back in command. That may intensify selling and sink the DOGE/USDT pair to the Feb. 6 low of $0.08. Buyers will attempt to defend the $0.08 level, but if the bears prevail, the DOGE price may plunge to $0.06.
On the upside, a close above the moving averages suggests that the buyers have overpowered the bears. The pair may ascend to $0.10 and later to the stiff $0.12 resistance.
Hyperliquid price prediction
Hyperliquid (HYPE) is attempting to bounce off the 50-day simple moving average ($34.16), but the relief rally is expected to face selling at higher levels.

The 20-day EMA ($37.10) has started to turn down, and the RSI has slipped into the negative zone, signaling that the bulls are losing their grip. If the HYPE price turns down and breaks below the 50-day SMA, the pullback may reach the $29.42 level.
Contrary to this assumption, if the price turns up and breaks above the 20-day EMA, it suggests that the bulls remain in control. The HYPE/USDT pair may march to $41.59 and subsequently to $43.76.
Related: Here’s what happened in crypto today
Cardano price prediction
Sellers have maintained Cardano (ADA) below the $0.25 resistance but have failed to pull the price below the $0.23 level.

The 20-day EMA ($0.25) is sloping down gradually, and the RSI is in the negative territory, indicating a slight edge to the bears. If the ADA price turns down from the 20-day EMA and breaks below $0.23, it suggests that the bulls have given up. The ADA/USDT pair may drop to $0.22 and later to the support line near $0.18.
Conversely, if buyers propel the price above the moving averages, it suggests that the selling pressure is reducing. The pair may rally to the downtrend line, which is a vital resistance for the bears to defend.
Bitcoin Cash price prediction
Bitcoin Cash (BCH) has dropped to the $443 level, which is a critical support for the bulls to defend.

Any bounce off the $443 level is expected to face selling at the moving averages. If the BCH price turns down sharply from the moving averages, it increases the likelihood of a drop below the $443 level. If that happens, the BCH/USDT pair will complete a bearish head-and-shoulders pattern. The pair may then tumble to the $375 level.
On the contrary, a close above the $486 level suggests that the bulls are back in the game. The pair may then jump to the $520 to $540 zone.
Chainlink price prediction
Chainlink (LINK) has been trading between the $8 and $10 level, indicating a balance between supply and demand.

If buyers thrust the price above the moving averages, the LINK/USDT pair may rise to the $10 resistance. Sellers are expected to defend the $10 level, as a close above it may propel the LINK price to $10.94 and then to $11.61.
Alternatively, if the price turns down from the moving averages and breaks below the $8 level, it signals that the bears have seized control. The pair may collapse to $7.15 and then to the $6 level.
This article does not contain investment advice or recommendations. Every investment and trading move involves risk, and readers should conduct their own research when making a decision. While we strive to provide accurate and timely information, Cointelegraph does not guarantee the accuracy, completeness, or reliability of any information in this article. This article may contain forward-looking statements that are subject to risks and uncertainties. Cointelegraph will not be liable for any loss or damage arising from your reliance on this information.
Crypto World
Gate 2026 Q1 Spot Listing Key Stats: 35.7% of Exclusive Listings Gained 100%+ in One Week
In the first quarter of 2026, against the backdrop of overall pressure in the crypto market and a more cautious risk appetite among capital, high quality early stage assets remained one of the most attractive structural opportunities in the market.
Gate listed a total of 37 new spot assets in Q1, covering 77.1% of the newly added projects across major exchanges during the same period, of which 27 were first listings, accounting for 73% of Gate’s new listings for the quarter; additionally, 14 were exclusive listings, representing 37.8%.
Amid heightened market volatility, Gate maintained a steady listing pace, strong capability in onboarding high quality projects, and a consistent ability to deliver positive return opportunities.
Overall Overview
From the perspective of total sample size, in the first quarter of 2026, using seven major platforms including Gate as the sample, a total of 48 new projects were listed across leading exchanges.
Among them, Gate listed 37 projects during the quarter, corresponding to a coverage rate of 77.1%, meaning that among the newly added high quality supply competed for by major platforms in Q1, Gate covered more than three quarters of the projects.
For general users, the importance of coverage is self evident. It directly determines whether users can access a sufficiently complete set of core new market listings on a single platform. If a platform has relatively low coverage, even if a few projects perform well, it can still leave users with the impression that important projects are not fully represented.
A coverage rate of 77.1% indicates that at least during Q1, Gate remained closely aligned with the mainstream pipeline of new project supply, allowing users to access most of the new assets worth paying attention to on the platform.
However, what truly defines Gate’s competitiveness is not only the breadth of coverage, but also the structure of that coverage.
Among the 37 new assets listed by Gate in Q1, 27 were first listings, accounting for 73%, while 14 were exclusive listings, representing 37.8%. If calculated based on the overall sample of major exchanges, Gate’s first listing coverage reached 56.3%. In other words, among the 48 new projects listed across major exchanges in Q1, more than half were first listed on Gate.
A high proportion of first listings indicates that Gate has strong attractiveness at the critical stage when projects transition from primary market narratives into secondary market trading. Projects choosing Gate as one of their initial public trading venues essentially reflects recognition of Gate’s user base, liquidity absorption capacity, initial price discovery efficiency, and market distribution capability. A platform that consistently secures first listings is often in a relatively proactive position in competition for project resources.
A meaningful share of exclusive listings reflects another layer of capability with substantial value. First listings demonstrate a platform’s ability to participate in mainstream high quality supply, while exclusive listings indicate whether the platform possesses independent judgment and differentiated sourcing capabilities.
Especially in a weak market environment, the selection difficulty for exclusive projects is higher, as exclusivity implies a lack of sufficient external validation from other platforms, requiring the platform to bear the responsibility of early judgment. If selection proves inaccurate, post listing performance will quickly reflect the issue; if exclusive projects perform well after listing, it not only indicates access to resources but also strong forward looking evaluation capability.
From this overall overview, Gate’s core foundation in Q1 can be summarized in three key characteristics.
(1) Broad coverage, indicating continuous participation in top tier new supply;
(2) High proportion of first listings, indicating strong capability to capture high quality projects at their entry into the market;
(3) A meaningful share of exclusive listings, showing that the platform is not merely following the market, but actively identifying and positioning differentiated assets in advance.
Taken together, these three factors form the foundation of Gate’s spot listing system in Q1. Only when coverage, first listings, and exclusivity all hold simultaneously can a platform’s listing framework be considered complete.
Post Listing Performance: Consistent Positive Return Coverage Across Short Term and 7 Day Windows
The quality of a platform’s listing performance cannot be evaluated solely by whether it secures projects, but also by whether those projects demonstrate stable performance after listing. A key characteristic of Gate in Q1 is that newly listed projects exhibited relatively consistent time series behavior across multiple holding periods, with overall positive return coverage remaining relatively stable.
Figure 1: Share of Gate New Listings With Price Increases Across Timeframes (5m–7d)
From the perspective of the share of price increases, among newly listed projects in Q1, 58.3% rose within the first 5 minutes after listing, 54.1% maintained gains at the 1 hour interval, 56.8% still recorded positive returns after 24 hours, 54.1% were up after 3 days, and 50.0% remained in an upward trend after 7 days. The data shows that the positive return coverage of Gate’s listed projects remained relatively stable across multiple holding periods.
Many new projects are driven by early speculative capital, short term sentiment, and traffic momentum at the opening stage, often leading to rapid initial price surges. However, if the project lacks fundamental support or if the platform’s liquidity absorption is insufficient, such gains tend to fade quickly, resulting in significantly weaker performance after 24 hours.
This is not the case for Gate’s Q1 sample. Across 5 minutes, 1 hour, 24 hours, and 3 days, the share of projects with price increases consistently remains above 50%, indicating that most listed projects did not exhibit a typical pattern of opening high and trending downward during the core price discovery window.
The 24 hour and 3 day intervals are particularly meaningful as reference points. Most participants in new listings are not ultra short term traders, and many operate on intraday, overnight, or short cycle holding strategies.
For these users, the fact that 56.8% of projects are up after 24 hours and 54.1% are up after 3 days reflects a more realistic trading experience. It indicates that positive return opportunities for Gate’s new listings are not limited to the initial opening phase, but show a degree of continuity during the key post listing holding window.
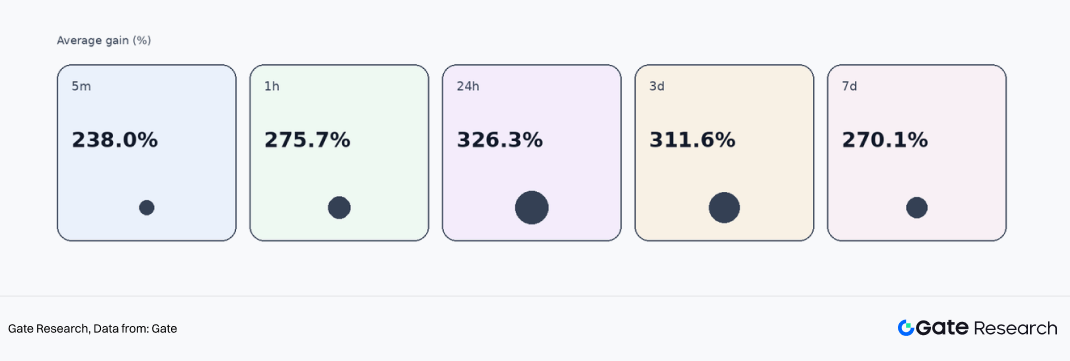
Further examining the average gains of projects that recorded price increases provides a clearer view of return elasticity. In Q1, the average gains for rising projects across the 5 minute, 1 hour, 24 hour, 3 day, and 7 day intervals were 238.0%, 275.7%, 326.3%, 311.6%, and 270.1%, respectively.
This indicates that once high quality new listings on Gate establish early positive momentum, the potential for price expansion remains substantial. Notably, during the 24 hour and 3 day windows, average gains remain around 300%, suggesting that the wealth effect of high quality projects has not disappeared in a weak market, but is instead more concentrated in a subset of carefully selected assets.
Figure 2: Average Gains of Rising Gate New Listings Across Timeframes (5m–7d)
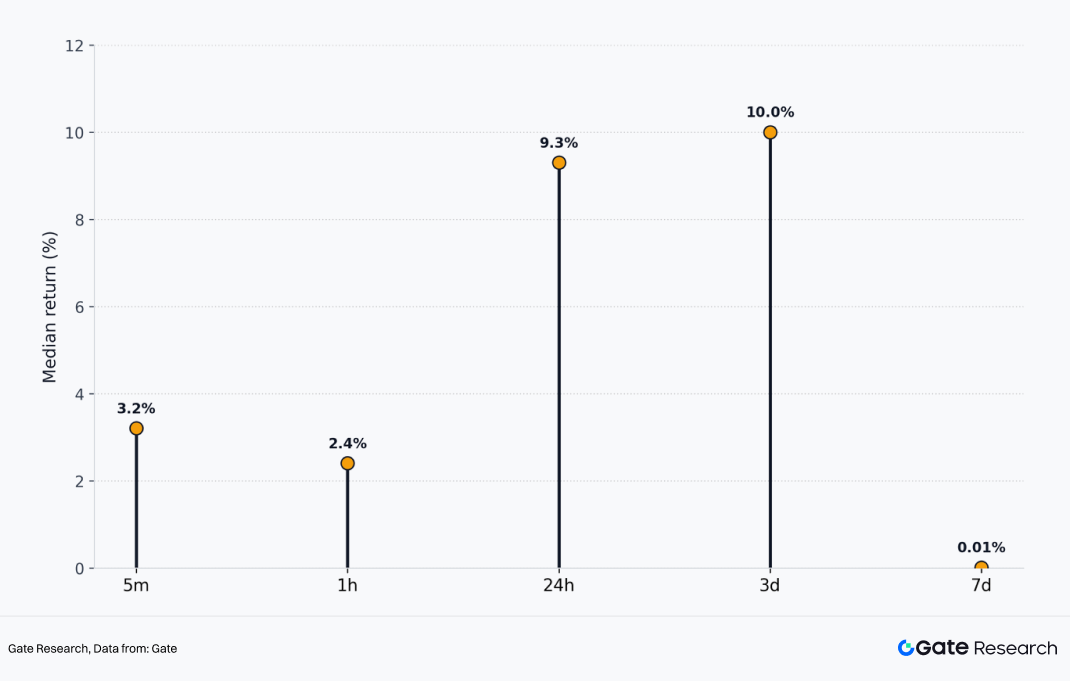
Of course, looking at average gains alone does not provide a complete picture, as averages are easily influenced by extreme outliers, which can obscure the typical performance of most projects. Therefore, the median is particularly important in this context.
The median gains of newly listed projects in Q1 were +3.2% at 5 minutes, +2.4% at 1 hour, +9.3% at 24 hours, +10.0% at 3 days, and +0.01% at 7 days. Even when excluding the impact of extreme high multiple projects, the typical project performance within the sample still shows clearly positive returns at the 24 hour and 3 day stages.
This indicates that the overall performance of Gate’s spot listings during the quarter was not driven solely by a small number of outliers lifting the average, but rather that most projects maintained a certain level of positive return potential during the core post listing observation window.
Figure 3: Median Price Increase of Gate New Listings Across Timeframes (5m–7d)
For general users, what truly determines the participation experience is not whether there are one or two projects with extremely high returns, but whether the overall quality of new listings on the platform is consistent and whether it demonstrates a certain level of repeatability.
Based on the median data, Gate provided a clear answer in Q1, at least within the 24 hour to 3 day window: its spot listings exhibited strong consistency and a certain level of positive expected returns.
At the same time, the near flat median at 7 days also reflects another fact. The advantage of new listings is primarily concentrated in the early stage of post listing price discovery rather than extending indefinitely.
After 7 days, the market enters a more advanced phase of differentiation and elimination, where disparities between projects expand rapidly. Therefore, for users, not all new listings are suitable for long term holding; instead, within the first 24 hours to 3 day window after listing, the market presents a clearer and more stable density of return opportunities.
First Listings and Non-First Listings: A Dual Track Structure
When discussing a platform’s listing capability, many tend to focus entirely on first listings. While first listings are important, a platform with a truly mature listing system demonstrates its strength not only through first listings, but through the ability of different types of projects to form their own clear return logic. Based on Q1 data, this characteristic is particularly evident for Gate.
First Listings: Dominant in Quantity with Stronger Return Elasticity
In Q1, Gate recorded 27 first listings, accounting for 73% of all new listings. First listings formed the core of Gate’s listing structure in Q1, meaning that in most cases, the platform directly participated in the initial stage when projects entered the secondary market.
In terms of performance, the most notable characteristic of first listings is their strong return elasticity. Data shows that nearly 46% of first listed projects remained in an upward trend after 7 days; among the projects that increased in price, the average gains reached 502.8%, 440.7%, and 364.3% on the first day, 3 day, and 7 day intervals, respectively.
This indicates that the core advantage of Gate’s first listings lies not only in early access, but in their ability to build market momentum starting from Gate, often resulting in stronger price expansion potential.
Figure 4: Average Returns of Rising Gate Listings Across Holding Periods (1d, 3d, 7d)
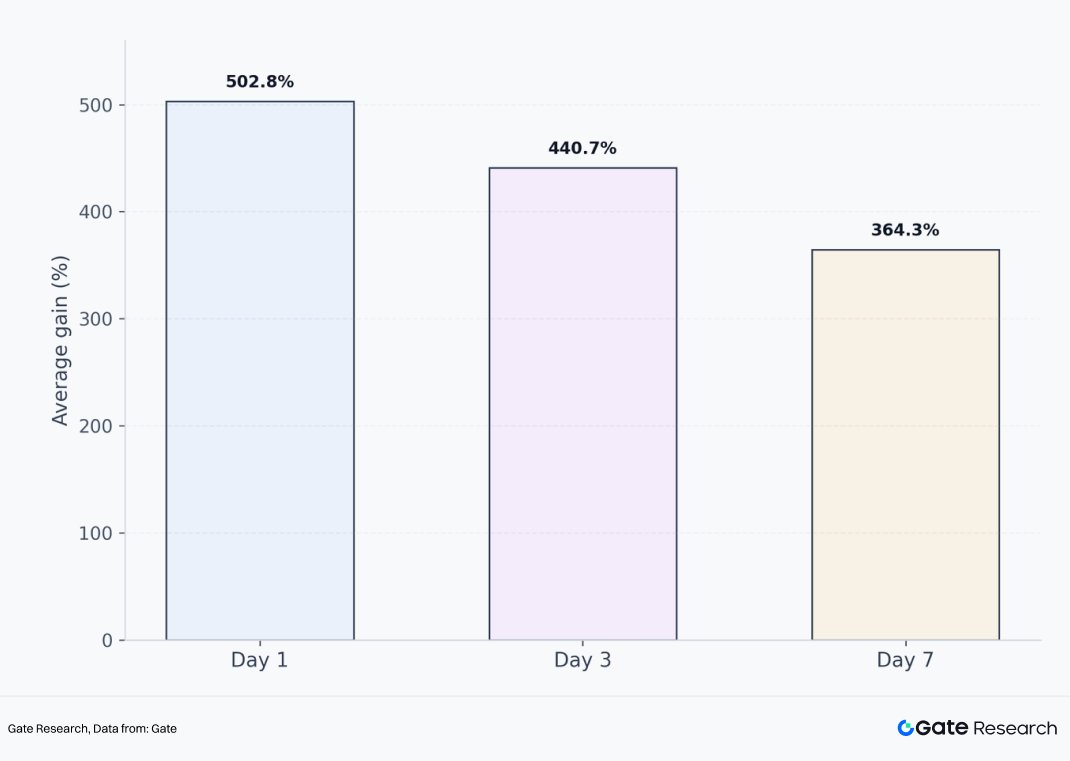
From the perspective of extreme return distribution, this high elasticity is further validated. Among first listings in Q1, 7.4% of projects recorded gains exceeding 500% and even 1,000% within 24 hours. This indicates that within Gate’s listing system, the first listing segment serves as an entry point for high payoff opportunities.
Not every project is guaranteed to surge, but once a selected first listing aligns with market attention, narrative strength, and traffic momentum, the resulting price response is often more pronounced.
The underlying logic is straightforward. First listings occur at the earliest stage of public trading, where price discovery is still incomplete, market understanding is rapidly forming, and capital can concentrate more easily within a short period.
For platforms, the ability to secure high quality projects at this stage determines their capacity to provide users with high payoff, high attention early trading opportunities. For users, first listings offer the potential for earlier participation and higher return elasticity, but also come with greater volatility and faster divergence.
Non-First Listings: Smaller in Number but More Stable in Trend
Compared with first listings, Gate recorded 10 non-first listings in Q1, representing a significantly smaller share. However, in terms of performance, these projects demonstrate more stable median returns.
Figure 5: Win Rate and Median Price Increase of Gate Non-Initial Listings Across Timeframes (5m–7d)
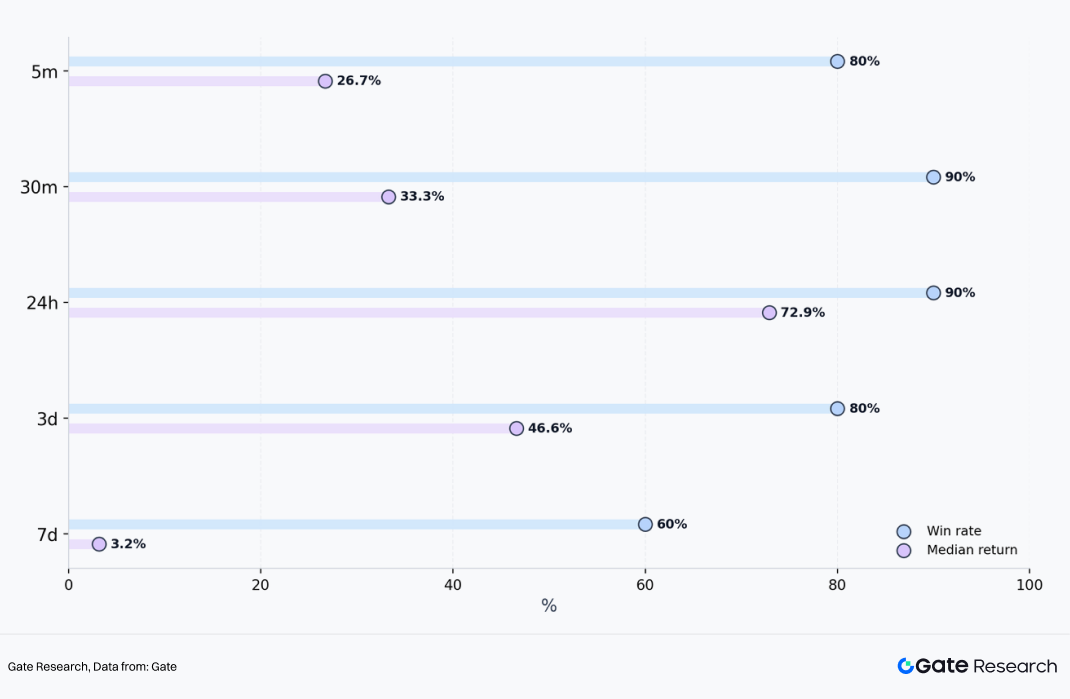
Data shows that non-first listings recorded price increase shares of 80%, 90%, 90%, 80%, and 60% across the 5 minute, 30 minute, 24 hour, 3 day, and 7 day intervals, respectively; the corresponding median gains were +26.7%, +33.3%, +72.9%, +46.6%, and +3.2%. In addition, 40% of non-first listing projects achieved gains exceeding 100% within 24 hours.
The data indicates that although non-first listings do not possess the same initial pricing advantage as first listings, they demonstrate higher success rates of price increases under Gate’s screening mechanism.
This is because non-first listing projects have typically undergone initial market validation, allowing the platform to conduct a second layer of selection based on more comprehensive factors such as price performance, community attention, narrative diffusion, and market absorption conditions, thereby offering greater certainty compared to first listings.
Overall, Gate’s listing structure does not rely solely on first listings to demonstrate its advantage, but instead forms two complementary pathways: first listings provide higher elasticity and stronger wealth effects, while non-first listings deliver more stable median returns.
The former is more aligned with an aggressive approach, while the latter is more aligned with a stable strategy, together enabling the platform to serve different user preferences. From the platform perspective, this dual track structure is more mature than relying solely on first listings.
It shows that Gate is not mechanically pursuing a higher number of first listings, but is also able to continuously provide effective opportunities through the timing and secondary selection of non-first listing projects.
Exclusive Listings: The Segment That Best Reflects Gate’s Proactive Judgment Capability
If first listings reflect a platform’s ability to participate in mainstream high quality supply, exclusive listings reflect a more proactive capability in project selection, resource acquisition, and forward looking judgment. Exclusive listings directly reveal a platform’s project evaluation standards, risk control capability, and execution efficiency.
In Q1, Gate exclusively listed 14 projects, accounting for 37.8% of all new listings. This proportion itself indicates that Gate was not merely passively following the mainstream market listing cycle during the quarter, but instead maintained a differentiated project pipeline to a significant extent. More importantly, these exclusive projects did not underperform after listing; on the contrary, they demonstrated strong competitiveness across multiple key time windows.
Figure 6: Win Rate and Median Price Increase of Gate Exclusive Listings Across Timeframes (24h–7d)
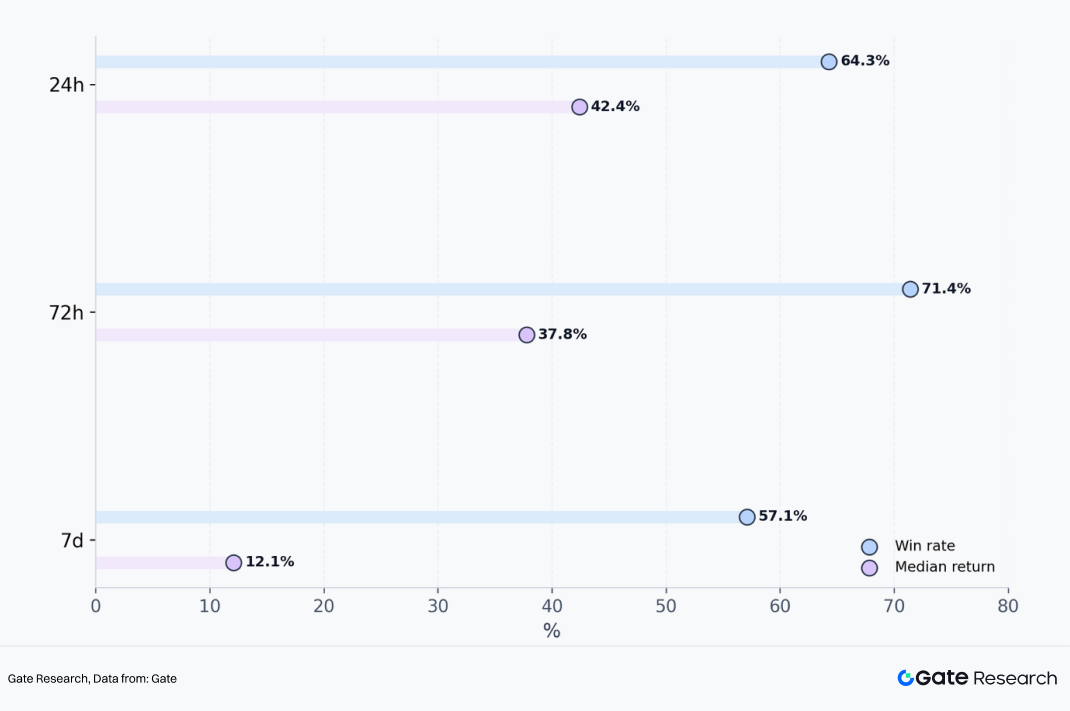
From the perspective of success rate, exclusive listings recorded price increase rates of 64.3%, 71.4%, and 57.1% across the 24 hour, 72 hour, and 7 day intervals, respectively, with the 72 hour window showing the strongest performance. This means that during the period from day 2 to day 3 after listing, Gate’s exclusive projects did not weaken rapidly as initial listing momentum faded, but instead demonstrated clearer capital absorption and upward price momentum.
From the perspective of median returns, exclusive listings achieved +42.4%, +37.8%, and +12.1% across the 24 hour, 72 hour, and 7 day intervals, respectively. This indicates that exclusive projects not only have a relatively high share of price increases, but also deliver median returns that are significantly higher than the overall sample. This suggests that the strong performance of exclusive listings is not driven by a small number of extreme cases, but rather that most projects provide solid return quality within the core observation windows.
Further examining the distribution of extreme returns makes the characteristics of exclusive listings even clearer. From 30 minutes after listing up to 30 days, more than 20% of exclusive projects consistently achieved gains exceeding 100%; during the 3 to 7 day window, the share of projects with gains above 100% reached as high as 35.7%, significantly higher than the 15.4% observed among all first listings; even when extended to a 30 day horizon, 12.5% of exclusive projects still recorded gains exceeding 500% and even 1,000%.
Taken together, these data points indicate that Gate’s exclusive listings do not rely solely on initial scarcity driven momentum at the opening stage, but are able to sustain price discovery and attract consistent buying support across multiple post listing time windows, with a relatively high probability of delivering more pronounced return trajectories.
Case Review
Based on Q1 cases, Gate’s project selection broadly followed three pathways: one category consists of high attention projects where Gate completed early first listings or priority onboarding, followed by validation from other platforms; another category includes exclusive listings on Gate that delivered strong subsequent performance, reflecting the platform’s independent selection capability; the third category consists of narrative driven projects with strong community traction and topic diffusion, demonstrating the platform’s sensitivity to sentiment driven sectors.
Solana Mobile (SKR): Early First Listing Execution on High Attention Projects
Solana Mobile belongs to the DePIN sector, achieving an ATH increase of 2,459% after TGE and a 30 day gain of 715%. As a combination of Solana’s official hardware phone and Web3 applications, Solana Mobile benefits from inherent brand endorsement, a strong community foundation, and significant dissemination advantages. Gate conducted a simultaneous first listing with two other CEXs and went live one day ahead of B*** Alpha to capture market share, indicating that Gate maintained strong responsiveness to globally high attention projects in Q1.
From the SKR listing, it can be seen that Gate is able to enter the key early window for projects with high traffic, strong narratives, and elevated expectations, allowing users to participate before broader market coverage occurs. This capability reflects Gate’s competitive position in accessing mainstream high quality project supply.
CodexField (CODEX): A Representative High Return Exclusive Listing
CodexField belongs to the content creation sector and is one of the most representative exclusive listings on Gate in Q1. It recorded an ATH increase of 4,900% and maintained a gain of 2,566% as of March 25, while B***, B***, and B*** had not yet listed the project.
If exclusive listings best reflect a platform’s proactive selection capability, then CodexField serves as a clear demonstration of Gate’s strength in this area. The project received institutional investment from Gate Labs prior to listing, and Gate provided the initial secondary market pricing venue, ultimately generating a strong wealth effect.
For projects that are not yet widely covered but possess strong growth potential and market imagination, Gate has the ability to establish early positioning and, through its platform liquidity and user base, convert these opportunities into verifiable market outcomes.
Lobster: An Early Positioning Case in AI plus Meme Narratives
The combination of AI and Meme was a high attention yet highly differentiated direction in Q1. Many projects had strong narratives but lacked sustainability, while others demonstrated strong dissemination capability without translating into trading results. Lobster belongs to the AI plus Meme category and was first listed on Gate, achieving an ATH increase of 286% and a 7 day gain of 164%; B*** Alpha followed with a listing the next day after observing Gate’s market signal. This case highlights Gate’s early positioning capability in highly viral narratives, as well as its ability to lead early price discovery.
Overall, these cases show that Gate’s spot listing performance in Q1 was not driven by a single type of project, but rather by a combination of multiple sectors, styles, and narratives. The platform is capable of onboarding high attention mainstream projects while also identifying exclusive growth oriented projects; it covers both technology and product driven projects, as well as community culture and sentiment driven assets. This diversity itself reflects the maturity of Gate’s listing system.
Conclusion
Overall, Gate’s spot listing performance in the first quarter of 2026 can be summarized in one sentence: in a market phase characterized by overall pressure, reduced opportunity density, and intensified project divergence, Gate continued to maintain a relatively high quality pipeline of new listings and convincing post listing performance.
During a period where strong outcomes are not easy to achieve, Gate’s overall sample maintained a relatively high share of price increases across multiple time windows, with median returns at 24 hours and 3 days remaining positive. New listings demonstrated a certain breadth of performance, where first listings provided stronger return elasticity, non-first listings delivered higher success rates, and exclusive listings reflected greater scarcity and stronger mid term performance. The platform’s listing capability is not driven by isolated strengths, but by a systematic and integrated framework.
For users, Gate provides a more complete and structured early stage participation framework. Users seeking higher return elasticity can focus on first listings for higher payoff opportunities; users preferring more stable pathways can look to the higher success rate characteristics of non first listings; users aiming to access differentiated assets before broad market coverage can pay closer attention to Gate’s exclusive listing segment. For project teams, Q1 data also demonstrates that Gate possesses strong capabilities in initial trading support, liquidity organization, and price discovery.
From a longer term perspective, the core competition in spot listing capability among exchanges ultimately lies in whether they can consistently maintain strong project sourcing, selection, and outcome realization across different market cycles. Gate’s Q1 data clearly demonstrates this point: even in a weak market, Gate is able to list accurately, select with stability, and deliver tangible results.
Gate Research is a comprehensive blockchain and cryptocurrency research platform that provides deep content for readers, including technical analysis, market insights, industry research, trend forecasting, and macroeconomic policy analysis.
Disclaimer: Investing in cryptocurrency markets involves high risk. Users are advised to conduct their own research and fully understand the nature of the assets and products before making any investment decisions. Gate is not responsible for any losses or damages arising from such decisions.
The post Gate 2026 Q1 Spot Listing Key Stats: 35.7% of Exclusive Listings Gained 100%+ in One Week appeared first on BeInCrypto.

TLDR
-
South Korean FSS identifies critical omissions in Dunamu-Naver merger documentation
-
Regulator demands immediate corrections to restructuring and investment disclosures
-
Stock exchange agreement encounters obstacles from regulatory oversight
-
Governance structure and control arrangements under FSS evaluation
-
Emerging digital asset regulations complicate merger approval process
The Financial Supervisory Service of South Korea has mandated that Dunamu revise its disclosure documents related to the proposed stock exchange with Naver Financial involving Upbit. The regulatory body uncovered significant omissions and inaccuracies concerning crucial investment information and corporate reorganization strategies. This enforcement action intensifies regulatory compliance requirements as the transaction undergoes official evaluation.
Regulatory Authority Identifies Critical Reporting Deficiencies
Following a thorough examination of Dunamu’s significant transaction filing, the FSS discovered substantial deficiencies in essential disclosure components. The shortcomings centered on prospective corporate reorganization plans and other material information relevant to investors. Consequently, the financial watchdog mandated prompt remedial action to guarantee precise public information.
According to the FSS, inadequate disclosures potentially compromise stakeholders’ ability to properly evaluate the transaction. The regulatory body stressed the importance of transparency regarding risk factors and strategic decision-making processes. Dunamu received explicit instructions to amend and supplement the filing without delay.
In response, Dunamu contended that no definitive restructuring plans have been established following the stock exchange’s finalization. The FSS countered that insufficient transparency nonetheless impairs proper assessment capabilities. The regulator reinforced its position that revised documentation must encompass all pertinent considerations.
Merger Agreement Encounters Regulatory and Organizational Challenges
Under the proposed arrangement, Dunamu will transition into a fully controlled entity of Naver Financial via an all-encompassing stock exchange mechanism. This framework will transform current shareholders into Naver Financial equity holders. The FSS maintains ongoing surveillance of disclosures concerning ownership transitions and governance implications.
The agreement establishes a valuation exchange ratio of 3.064569 to one comparing Dunamu against Naver Financial. The FSS emphasized that mandatory approval procedures could postpone or modify the transaction schedule. These requirements encompass Fair Trade Commission assessments and additional financial regulatory submissions.
Naver intends to maintain operational control through shareholder agreements guaranteeing voting authority within Naver Financial’s structure. The FSS observed that such mechanisms necessitate clear disclosure of their ramifications. The regulatory body continues evaluating whether governance-related risks receive adequate explanation.
Legislative Developments Introduce Additional Complications
South Korea’s developing digital asset regulatory framework introduces ambiguity to the contemplated transaction. The FSS recognized that forthcoming legislation could fundamentally alter ownership parameters and regulatory obligations. Dunamu incorporated legislative uncertainty factors in its updated submission.
The Digital Asset Basic Act establishes more rigorous standards for platform operators and financial configurations. The FSS views these legislative developments as pertinent to transaction viability and strategic planning. The regulator anticipates disclosures will accurately represent prospective regulatory modifications.
Proposed restrictions on cryptocurrency exchange ownership percentages may challenge Naver Financial’s complete control objectives. The FSS categorizes these policy deliberations as substantive elements in investment analysis. Consequently, the FSS continues implementing more stringent disclosure requirements.
The regulatory intervention demonstrates elevated examination of major fintech and cryptocurrency sector consolidations. Dunamu must reconcile its disclosures with regulatory standards as the transaction advances. The FSS maintains its pivotal role in assessing transparency and regulatory conformity throughout the deal.

Crypto World
BlackRock Is Paying $350,000 for Crypto Executives: Is Wall Street Digital Asset Takeover Just Getting Started?
Leading Wall Street firms BlackRock, Goldman Sachs, Morgan Stanley, and Citigroup are actively posting crypto jobs, not for experimental blockchain labs, but for permanent digital asset desks running live revenue operations. This is a structural build, not a pilot program.
The numbers confirm the scale. Crypto companies listed 5,154 open positions in early 2025, a 40%+ rise from late 2023.
BlackRock alone posted a New York Managing Director role for crypto at $270,000–$350,000. Goldman Sachs has disclosed $2 billion in crypto exposure. The ETF approval wasn’t a catalyst – it was the starting gun.
Key Takeaways:
- ETF Catalyst: Bitcoin ETF inflow recovery has forced Wall Street to staff permanent middle-office, trading, and compliance functions – roles that didn’t exist inside these firms two years ago.
- Named Institutions: BlackRock, Goldman Sachs, Morgan Stanley, and Citigroup all carry active crypto job listings; JPMorgan posted a Lead Software Engineer for blockchain infrastructure.
- Role Categories: Current demand centers on institutional trading, fund accounting, ETF market-making, digital asset compliance, and tokenization engineering – not R&D or innovation labs.
- Compensation Signal: BlackRock’s Managing Director crypto role is listed at $270,000–$350,000; global crypto salaries rose 18% year-over-year into 2025, with North America offering the highest base pay.
- Geographic Expansion: New York remains the primary hub, but Singapore crypto job listings surged 158% – signaling the institutional build is global, not domestic.
- What to Watch: Whether TradFi retention packages can outcompete token incentives from crypto-native firms – that tension determines how fast these desks actually scale.
Discover: The best crypto to diversify your portfolio with
What the Shift Actually Signals – and Why This Cycle Is Different From 2021
The last time Wall Street rushed into crypto jobs was 2021. That wave was driven by retail speculation, NFT hype, and internal pressure to appear innovative.
The 2022 FTX collapse and subsequent market crash wiped out more than 70% of crypto jobs globally – and most of those TradFi crypto units quietly dissolved with them.
This cycle is structurally different. The demand driver is regulated product infrastructure: spot Bitcoin ETFs, Ethereum ETFs, and the tokenization of real-world assets (RWAs).
BlackRock’s IBIT has generated historic AUM growth, and that volume demands middle-office expansion – reconciliation, fund accounting, reporting – roles that are operational, not experimental.

Sam Wellalage, founder of recruitment agency WorkInCrypto, put it plainly: “When I speak with CEOs from TradFi who are now building digital assets, they consistently say the same thing: Crypto will ultimately be integrated into TradFi, not exist separately.” That framing matters – integration implies permanent headcount, not rotating project teams.
The regulatory environment has accelerated the timeline. The Trump administration’s pro-crypto posture – light-touch regulation, an explicit goal of making the US the crypto capital of the world – has given compliance and legal teams the green light to build rather than wait. Regulatory clarity at the federal level is precisely what makes a permanent digital asset division viable inside a bank that answers to the SEC.
Wellalage flagged the skills threshold that will define the 2026 hiring class: “Institutional recruitment in 2026 will be about finding digital asset leaders who can operate at the intersection of capital, markets, and regulation – not just crypto enthusiasm.” That distinction – capital plus markets plus regulation, not enthusiasm – is what separates this buildout from the 2021 experiment.
Discover: The best pre-launch token sales
TradFi vs Crypto Desk: The Role Map
The talent pipeline runs in both directions, but the dominant flow right now is TradFi into institutional digital assets – and the role categories are specific. ETF market makers, crypto derivatives traders, digital asset compliance officers, tokenization engineers, and custody operations specialists are the positions drawing the most competitive offers.
BlackRock is staffing for senior portfolio and product roles that sit directly on top of IBIT’s operational infrastructure.
— Coin Bureau (@coinbureau) March 30, 2026
 NEW: BLACKROCK ADDS $350K HEAD DIGITAL ASSETS ROLE
BlackRock is recruiting a Managing Director of Digital Assets in NYC to lead its crypto, stablecoin, and tokenization strategy, reinforcing that crypto is now a core priority for Wall Street. pic.twitter.com/wCrEsxxknR
Goldman Sachs – which reported a significant uptick in clients trading crypto derivatives – is building on its existing trading desk capabilities. Citigroup posted a VP-level backend engineer for digital finance. JPMorgan, which launched its Onyx blockchain platform for tokenized assets in 2021, is now hiring lead engineers to scale that infrastructure rather than prototype it.
The skills that transfer cleanly from TradFi: fixed income structuring, derivatives risk management, fund accounting, regulatory compliance, and institutional sales. The skills that must be learned on the job: on-chain settlement mechanics, wallet custody architecture, tokenomics, and DeFi protocol risk – areas where crypto-native firms like Coinbase, Galaxy, and Grayscale still hold a decisive edge.
That edge is also a competitive threat. Platforms building permanent digital asset divisions – including exchange operators now operating under formal regulatory licenses – are drawing from the same talent pool as the bulge-bracket banks. The retention math favors whoever can offer the better blend of institutional prestige and upside exposure.
Compensation is already being used as a differentiator. Global crypto salaries rose 18% year-over-year into 2025. North America leads on base pay; Asia leads on growth rate, fueled in part by token grants. Singapore’s crypto job listings surged 158%, reflecting how aggressively regional hubs are competing for the same senior institutional profiles that New York firms are targeting.
The US Bureau of Labor Statistics projects 22% demand growth for blockchain developers by 2026 – outpacing average tech roles by a wide margin. With institutional adoption locking in through regulated ETFs and RWA platforms, that demand curve isn’t softening.
Discover: The Best Crypto Presales Live Right Now
The post BlackRock Is Paying $350,000 for Crypto Executives: Is Wall Street Digital Asset Takeover Just Getting Started? appeared first on Cryptonews.
Stablecoins Moved More Money Than the US Financial System’s Backbone
Jack Black gives update on Tenacious D reunion ahead of “SNL” hosting gig following Kyle Gass' Trump shooting remarks

Oracle reveals who it laid off at company – and it’s the latest AI alarm for white-collar workers

Smart energy pays enters the US market, targeting scalable financial infrastructure

Why Israel is blocking foreign journalists from entering

Bitcoin: We’re Entering The Most Dangerous Phase

Michael Saylor on new STRC stock: Creates an on-ramp for bitcoin believers without the volatility

BITCOIN TO $50K?! Oil Surges as the S&P 500 Hits Make-Or-Break Support

THIS IS XRP’S BIGGEST MOMENT EVER!!! (MASSIVE ANNOUNCEMENT JUST WENT LIVE!!!)
-

 NewsBeat7 days ago
The Story hosts event on Durham’s historic registers
-

 NewsBeat23 hours ago
Steven Gerrard disagrees with Gary Neville over ‘shock’ Chelsea and Arsenal claim | Football
-

 Sports7 days ago
Sweet Sixteen Game Thread: Tide vs Michigan
-
Entertainment4 days ago
Fans slam 'heartbreaking' Barbie Dream Fest convention debacle with 'cardboard cutout' experience
-

 Business18 hours ago
No Jackpot Winner and $194 Million Prize Rolls Over
-

 Crypto World2 days ago
Gold Price Prediction: Worst Month in 17 Years fo Save Haven Rock
-
 Entertainment6 days ago
Lana Del Rey Celebrates Her Husband’s 51st Birthday In New Post
-

 Tech5 days ago
The Pixel 10a doesn’t have a camera bump, and it’s great
-
Crypto World3 days ago
Dems press CFTC, ethics board on prediction-market insider trades
-

 Tech5 days ago
Avatar Legends: The Fighting Game comes out in July and it looks pretty slick
-

 Sports3 days ago
Tallest college basketball player ever, standing at 7-foot-9, entering transfer portal
-

 Tech3 days ago
EE TV is using AI to help you find something to watch
-

 Fashion6 days ago
Amazon Sundays: Soft Spring Layers
-

 Business2 days ago
Login and Checkout Issues Spark Merchant Frustration
-

 Fashion7 days ago
When Evening Dressing Gets Colorful for Spring
-

 Tech5 days ago
Elon Musk’s last co-founder reportedly leaves xAI
-

 Tech3 days ago
How to back up your iPhone & iPad to your Mac before something goes wrong
-

 Tech4 days ago
Apple will hide your email address from apps and websites, but not cops
-

 Politics4 days ago
Should Trump Be Scared Strait?
-

 Crypto World4 days ago
U.S. rule change may open trillions in 401(k) funds to crypto
You must be logged in to post a comment Login