
Crypto World
Nvidia (NVDA) Shares Rise Towards a Key Resistance Level

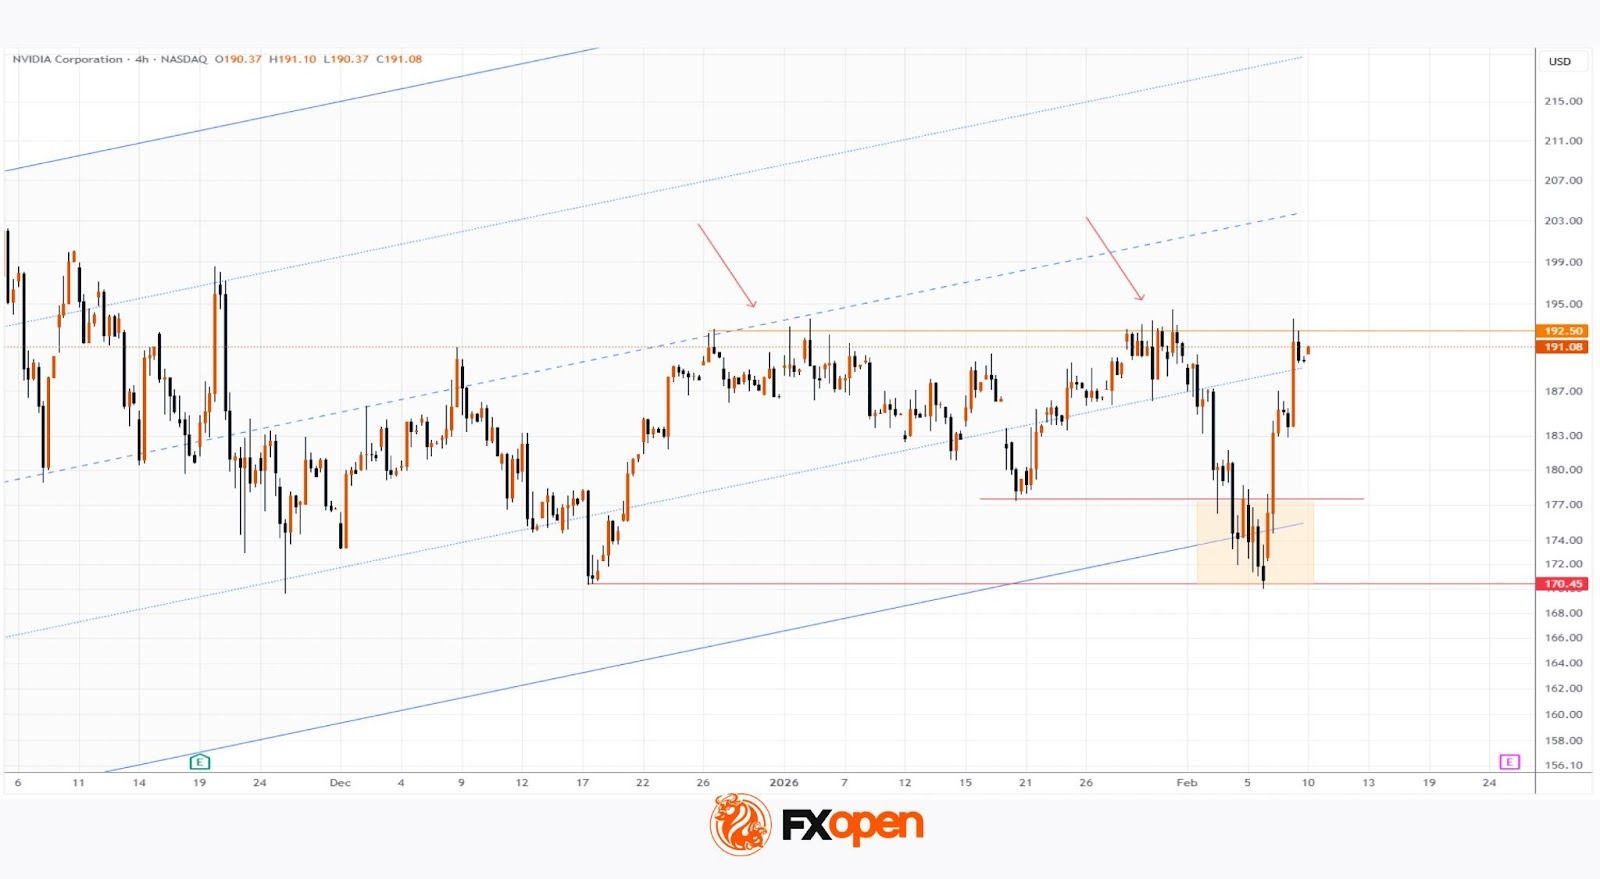
As the Nvidia (NVDA) share chart shows, during yesterday’s trading session the price advanced towards a key resistance area around $192.50, where notable peaks were formed in December 2025 and January 2026. The move was supported by several factors that boosted optimism:
→ Comments from company management. Nvidia CEO Jensen Huang stated that rising spending on AI is justified and reflects a long-term growth phase for the industry.
→ Goldman Sachs analyst Jim Schneider expects Nvidia’s fourth-quarter revenue to exceed forecasts and surpass $67 billion, and also anticipates strong sales and profit figures in the first quarter of the 2026 financial year.
Technical Analysis of the Nvidia (NVDA) Chart
On the morning of 4 February, when analysing NVDA price movements, we:
→ updated the long-term ascending channel, which remains intact;
→ noted the proximity of its lower boundary, which had acted as a key support level for many months;
→ suggested that NVDA’s price could stabilise in the lower quarter of the channel.
Since then:
→ between 4 and 6 February, the price moved sideways near the lower boundary of the channel, reflecting a balance between supply and demand;
→ following a false break below the December low, the share price staged a sharp rebound, signalling the dominance of buying pressure.
It is reasonable to assume that:
→ the initiative is currently on the side of the bulls, who appear determined to resume the long-term upward trend;
→ if another attempt is made to break through the aforementioned resistance level, it is likely to succeed, opening the way for NVDA shares to move towards the psychological $200 mark.
The realisation of this scenario could be supported by positive sentiment ahead of Nvidia’s earnings release on 25 February and the GTC 2025 conference in mid-March, when new product announcements may be made.
Buy and sell stocks of the world’s biggest publicly-listed companies with CFDs on FXOpen’s trading platform. Open your FXOpen account now or learn more about trading share CFDs with FXOpen.
This article represents the opinion of the Companies operating under the FXOpen brand only. It is not to be construed as an offer, solicitation, or recommendation with respect to products and services provided by the Companies operating under the FXOpen brand, nor is it to be considered financial advice.

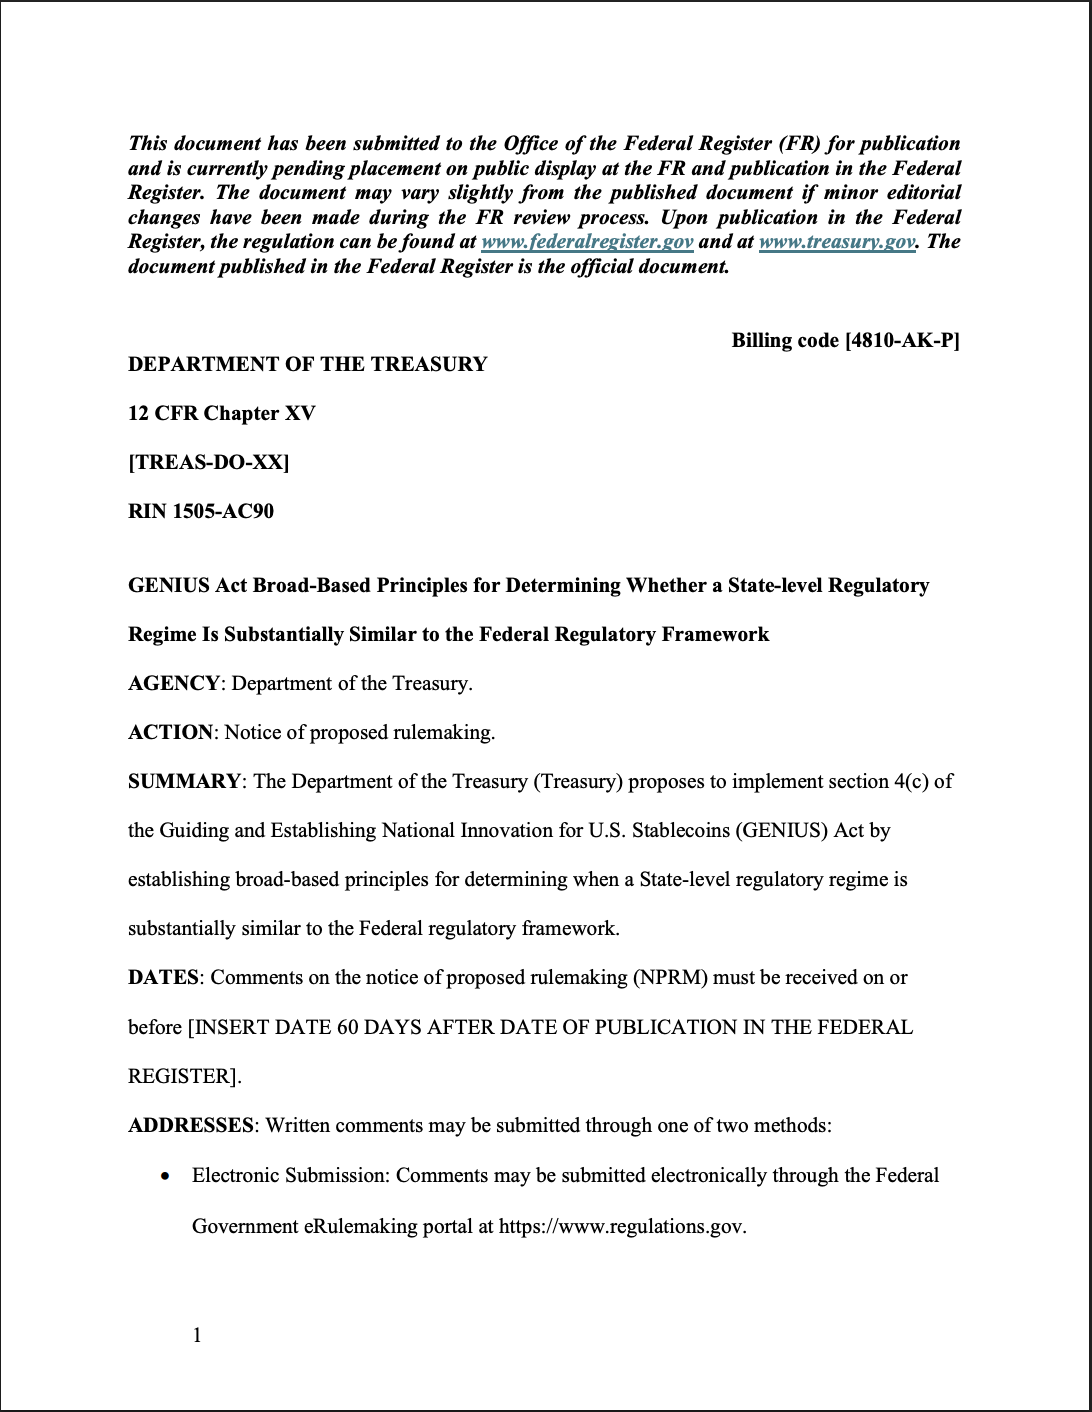
The US Department of the Treasury issued a notice of proposed rulemaking (NPRM) on Wednesday and is seeking public comment on proposed regulations for state-level stablecoin governance frameworks under the GENIUS Act.
The GENIUS stablecoin regulatory framework, also known as the “Guiding and Establishing National Innovation for US Stablecoins Act,” gives states the authority to regulate stablecoins with a market cap of less than $10 billion, as long as the regulations do not deviate significantly from federal policies.
The Treasury outlined several non-negotiable stablecoin regulations that must be in line with Federal regulations, including a 1:1 reserve backing with cash or high-quality cash equivalents and monthly reporting requirements.

States must also comply fully with federal anti-money laundering and sanctions policies for stablecoins, while upholding bans on token rehypothication, or using the same asset to support multiple claims.
Under the proposal, states are allowed to impose their own liquidity, reserve, risk management, regulatory procedures, enforcement and administrative rules, as long as the rules impose higher financial thresholds or are more restrictive than the federal regulations.
“State-level regulatory regimes must lead to regulatory outcomes that are at least as stringent and protective as the Federal regulatory framework,” the proposal said.
The public must submit comments within 60 days of the NPRM announcement. Once a stablecoin issuer passes the $10 billion threshold, it will automatically be under the regulatory jurisdiction of the federal government, meaning the largest stablecoin issuers will be regulated exclusively at the federal level.
Related: FSB flags dollar stablecoins as bigger risk for emerging markets in annual report
GENIUS Act becomes law, but uncertainty remains over yield-bearing stablecoins
US President Donald Trump signed the GENIUS Act into law in July, which was considered a landmark moment for crypto regulations.
Despite the landmark regulations, uncertainty about yield-bearing stablecoins and whether stablecoin issuers can share interest with token holders has stalled the CLARITY crypto market structure bill in Congress.
Some crypto companies, led by Coinbase, argue that yield-bearing stablecoins provide savers with a competitive alternative to traditional savings accounts, which typically have interest rates far below 1%.
The banking lobby continues to oppose yield-bearing stablecoins over fears that the tokens will cause deposit flight and erode the sector’s market share.
Magazine: GENIUS Act reopens the door for a Meta stablecoin, but will it work?
Crypto World
Caltech researchers project functional quantum computer feasible by 2030 with 10,000-20,000 qubits: Caltech


Caltech researchers estimate a working quantum computer could be operational before 2030 using far fewer qubits than previously thought, as crypto industry assesses vulnerability exposure.


Summary
- EthCC 2026 attendees reported noticeably fewer women at this year’s conference in Cannes, with industry participants linking the decline to market‑driven job cuts in marketing, PR and events roles
- Crypto recruiter PlexusRS says women still account for under 8% of crypto hires despite a 137% jump in female placements last year, underscoring how fragile recent diversity gains remain when markets turn.
- Broader corporate layoffs tied to artificial intelligence and cost‑cutting have hit non‑technical roles hardest across finance and technology, a pattern echoed in recent coverage by the Financial Times and Fortune.
Women’s visibility at Europe’s flagship Ethereum (ETH) conference appears to have taken a step backwards this year, as EthCC 2026 attendees in Cannes reported a marked drop in female participation just as crypto companies accelerate layoffs in marketing, PR and events. “There are less women this year because when the market turns the first jobs to get tinned are those where the female concentration is highest (events, marketing, PR),” wrote Sarah Akwisombe, a growth and community specialist, in a widely shared post from the conference, pointing readers to the Plexus “state of crypto hiring” report for further context. Other women in attendance echoed the sentiment on X, with user @ZoeCatherineF responding that they were “always the first to be binned – only the ‘essentials’ do the BD trips,” while another attendee, @Angel__Lou, said she had “definitely noticed it too.”
The Plexus State of Crypto Hiring report paints a stark statistical backdrop to those anecdotes, showing that women still account for less than 8% of all crypto hires despite a 137% year‑on‑year increase in female placements into Web3 roles. That concentration is especially pronounced in non‑engineering positions like marketing, community, communications and events, precisely the categories many crypto firms have targeted for cuts during the latest downturn and in response to structural shifts such as AI adoption. Research compiled by Plexus, based on more than 900 vacancies and over 300 hiring processes, concludes that while headline diversity metrics in crypto have improved, “the jobs market for women in Web3 remains disproportionately exposed to cyclical hiring freezes and non‑technical layoffs.”
The pattern emerging in crypto mirrors broader labour‑market pressures in technology and finance, where softer growth, rising rates and aggressive AI investments have combined to squeeze non‑technical roles. In March, Crypto.com announced plans to cut around 12% of its workforce, telling Bloomberg that it was integrating AI “across its business” and could therefore reduce headcount, in one of the latest examples of digital‑asset firms trimming staff outside core engineering and trading functions. A recent survey cited by Fortune found that 66% of large‑company CEOs plan to freeze or cut hiring through 2026 after more than 1.17 million jobs were eliminated in 2025, with labour‑market data showing a 30% drop in entry‑level listings and a 42% drop in middle‑management postings since 2022.
FT columnist Sarah O’Connor, who covers the world of work, has argued that such cuts often land first in “softer” functions like HR, marketing and communications, roles that tend to have higher female representation across industries. That dynamic appears to be playing out in crypto as well, compounding longstanding diversity gaps just as the market’s attention turns back to institutional adoption, regulation and infrastructure at events such as EthCC.
For women on the ground in Cannes, the impact is immediately visible. Akwisombe’s thread, posted from her @SarahAkwisombe account and tagged with @PlexusRS, noted that the roles most exposed to cuts are also those that had historically offered a pathway into crypto for people without a technical background. “The best events are always run by @lo_tech and I won’t hear otherwise,” she added in a follow‑up post, highlighting the outsized role women have played in shaping the social and cultural fabric of Ethereum conferences even as their headcount shrinks.
Industry data suggests the stakes extend beyond this year’s conference optics. CoinLaw’s 2026 employment statistics report that 28% of women in blockchain say they have experienced harassment or discrimination, while 60% of women in fintech have left jobs due to a lack of diversity. Combined with the cyclical vulnerability of non‑technical roles, those pressures risk entrenching a two‑tier crypto labour market in which engineering teams slowly diversify on paper even as women’s presence in public‑facing roles diminishes when markets tighten.

Solana’s meme coin launchpad, Bonk.fun, used April Fools’ Day to post a mock “feature launch” that quickly turned into a political jab, suggesting the platform would restrict access to users in Israel.
The post, framed as a new “Trench Guard” system, showed a geo-block screen with an Israel flag, implying users from the region would be blocked from trading.
Political Satire at Best
At face value, it looked like a typical compliance update. However, the tone and timing made it clear this was satire. The message wasn’t about a real feature. It was a pointed joke tied to current geopolitical tensions and how they spill into crypto.
The choice of Israel is doing most of the work here. Right now, Israel sits at the center of ongoing conflicts involving Gaza, Lebanon, and Iran. That has driven strong and often negative sentiment online. Bonk.fun taps into that mood and flips the usual script.
Typically, platforms block heavily sanctioned regions like Iran and Russia. Bonk.fun’s joke suggests: what if the “bad actor” label was applied differently? That’s the punchline.
The post is riffing on the idea that they’re blocking Israel because of how negatively Israel is being viewed by a lot of people online right now.
At the same time, the post takes a swipe at crypto’s “permissionless” narrative. In reality, many platforms already restrict users based on geography or regulation.
By exaggerating this with a controversial example, Bonk.fun highlights how political these decisions can feel.
In short, the post isn’t really about Israel alone. It’s using Israel as a symbol to mock how quickly crypto platforms can go from open access to selective control—especially when global politics gets involved.
The post Bonk.fun’s April Fools Joke Targets Israel, Sparks Debate appeared first on BeInCrypto.


Ten foreign nationals across four firms have been charged with orchestrating pump-and-dump schemes.


The market appears to be reassessing long‑term technological risks in crypto following Google’s major quantum computing research update on Monday.
While leading coins like bitcoin and ether (ETH) have seen only modest moves in the past 24 hours, several cryptocurrencies tied to the quantum‑resistant narrative have surged sharply, with some gaining more than 50%.
This outperformance of the so-called quantum-resistant tokens shows how quickly the market is pricing in potential technological risks, even if those are still theoretical. While quantum computers capable of attacking Bitcoin are still years away, traders are already signaling an appetite for “future-proof” assets.
Late Monday, Google’s Quantum AI team suggested that quantum computers could break the elliptic‑curve cryptography used by Bitcoin, with fewer than 500,000 quantum qubits, which is significantly less than previously estimated. This prompted some analysts to cite 2029 as a potential deadline for Bitcoin and the broader blockchain ecosystem to strengthen their defenses.
The study said that a sufficiently advanced quantum computer could attack Bitcoin within nine minutes. A separate report highlighted Ethereum’s vulnerabilities, identifying five potential attack vectors that could put an estimated $100 billion of assets at risk, including DeFi and tokenized holdings.
However, such machines do not exist and remain a threat that’s still a few years away.
Still, over the past 24 hours, the market has shown increased interest in cryptocurrencies and projects that emphasize post‑quantum cryptographic designs, research into future‑proofing security, or that appear relatively more resilient than legacy chains.
Notably, Quantum Resistant Ledger (QRL) and Cellframe (CEL) have surged 50%, reflecting growing market attention to truly post‑quantum protocols, according to data source Coingecko. Other tokens in the category, such as Abelian (ABEL), have risen 25%, while Qubic (QUBIC) and QANplatform (QANX) have each gained 10%, and even the privacy‑focused Zcash (ZEC) has added nearly 7% in the same period.
The market cap of this group, comprising 20 coins, has increased by 8% to $4.66 billion over the past 24 hours. It’s worth noting that ZEC is not yet truly quantum-resistant but is still included in the category by data sources because of its advanced cryptographic foundations, such as zero-knowledge proofs, and ongoing research into post-quantum secure ZK-SNARKs. These factors make it part of the “quantum-aware” narrative, even if it does not currently fully implement post-quantum cryptography.
While the risks remain largely theoretical, they have been influencing market behavior since last year. According to Charles Edwards, founder of Capriole Investments, concerns over quantum attacks contributed to Bitcoin’s decoupling from the rising stock market in the second half of 2025, with the cryptocurrency sliding from $126,000 to $80,000 in the final months of the year.
“We have already started to see quantum risk be priced into Bitcoin. It’s the primary reason Bitcoin is trading -50% against the S&P 500 and -90% against gold since the inaugural Bitcoin Quantum Summit seven months ago,” Edwards said in a report in February.
Coincidentally, this was exactly the period when ZEC staged a sharp rally. ZEC surged by over 1,200% in the second half of 2025, hitting a high of $744.


CoinShares, a leading European digital asset manager with over $6 billion under management, is set to begin trading on the Nasdaq Stock Market under the ticker symbol CSHR.
The listing follows a $1.2 billion merge with Vine Hill Capital Investment Corp., a U.S.-based special purpose acquisition company (SPAC).
The asset manager, which had previously traded on the Nasdaq Stockholm in Sweden under the CoinShares International entity, formed CoinShares PLC through the merger.
The listing comes after BitGo (BTGO), went public earlier in the year, while various crypto firms listed in 2025 including stablecoin issuer Circle (CRCL), CoinDesk owner Bullish (BLSH), and exchange Gemini (GEMI).
CoinShares built its business around crypto exchange-traded products (ETPs) and now manages 39 funds across four platforms. The company generates most of its revenue through recurring fees, a model it says supports strong profitability and free cash flow.
“We are diversifying both our product and revenue mix, including new capabilities in listed asset management, active alternative strategies. and decentralized finance,” CEO Jean-Marie Mognetti said.
For investors, the move opens a new U.S.-based option to gain exposure to crypto markets through a firm already established in Europe. CoinShares says it’s leading the market in the continent with a 34% share.
CoinShares’ U.S. expansion will include product development and acquisitions, while proximity to U.S. regulators may help it adapt quickly to shifting compliance standards in the crypto sector.
UPDATE (April 1, 14:15 UTC): Updates to reflect that CoinShares previously traded on Nasdaq Stockholm


Ripple’s Digital Asset Accounts and Unified Treasury let corporates manage fiat, RLUSD, XRP and other tokens inside existing treasury systems, targeting on‑chain cash and stablecoin demand.
Summary
- Ripple has launched Digital Asset Accounts and Unified Treasury, a crypto fund-management stack for corporate finance teams.
- The platform lets enterprises manage fiat, RLUSD and XRP alongside other digital assets within existing treasury workflows.
- The launch builds on Ripple’s acquisition of GTreasury and targets rising demand for on-chain cash and stablecoins in corporate treasury.
Ripple has unveiled an enterprise-grade cryptocurrency fund-management system designed to let corporate finance teams manage fiat and digital assets on a single platform, in its latest push beyond cross-border payments into full-stack treasury infrastructure. The new stack, branded Digital Asset Accounts and Unified Treasury, allows companies to oversee assets such as RLUSD and XRP directly within existing treasury systems, without the need for separate wallets, exchanges or third-party custodians, according to a report from Decrypt.
The system embeds crypto rails into conventional treasury workflows, effectively turning tokenized balances into another line item alongside existing cash and securities positions. Ripple said the integration “supports corporate finance teams in managing fiat and digital assets on the same platform,” lowering onboarding frictions for enterprises that want exposure to stablecoins and on-chain liquidity but are unwilling to re-architect their internal controls around consumer-grade wallets. The release leverages Ripple’s earlier acquisition of corporate treasury platform GTreasury, a deal the company framed at the time as a way to “embed crypto capabilities into mature corporate financial infrastructure” and plug directly into CFO tech stacks, as previously reported by Decrypt and The Financial Times.
Shift from remittances to on-chain cash management
Ripple’s move comes as stablecoins and tokenized deposits are increasingly used for working capital and cross-border settlement, rather than purely speculative trading. In an earlier interview with Bloomberg, Ripple CEO Brad Garlinghouse argued that “on-chain cash management and real-time liquidity” would be the next major adoption wave for digital assets, as corporates look for faster settlement and programmability without taking on directional crypto risk. By offering a unified treasury view over fiat, RLUSD, XRP and other digital balances, Ripple is positioning its stack as a direct competitor to bank-led tokenization platforms and infrastructure from players like JPMorgan’s Onyx, which already processes trillions of dollars in tokenized intraday repo and payments flows, according to public filings reported by Bloomberg.finance.
In parallel, on-chain cash tools have been gaining traction across the broader market. A recent Forbes analysis of prediction and on-chain markets noted that institutional demand for programmable dollar exposure helped push real-world asset and stablecoin-related protocols to more than $13 billion in monthly volumes by late 2025. Against that backdrop, Ripple’s enterprise treasury product signals a deliberate shift: from being seen primarily as a remittances company tied to XRP price cycles, toward becoming a vendor of compliant, plug-in crypto infrastructure for corporate finance teams that increasingly treat tokenized dollars as part of their core liquidity stack.


eToro has secured a New York BitLicense and money transmission license, reopening crypto trading to New Yorkers and extending its US coverage to 48 states after a 2024 SEC settlement.
Summary
- eToro has secured both a New York BitLicense and a money transmission license, opening its crypto platform to residents of New York.
- The approvals mean eToro now offers cryptocurrency trading in 48 US states, following a $1.5 million settlement with the SEC in 2024.
- The company calls New York “the heart of the financial markets” and frames the move as a strategic milestone in its US expansion.
Online brokerage and social trading platform eToro has obtained a coveted New York BitLicense and a parallel money transmission license, clearing the way for residents of the state to trade cryptocurrencies on its platform for the first time. The twin approvals from the New York State Department of Financial Services (NYDFS) mean eToro’s crypto offering now reaches 48 US states, according to a report from Crowdfund Insider cited by ChainCatcher.
Announcing the launch, Andrew McCormick, head of eToro’s US division, said that “New York is the heart of the financial markets and a hub of innovation,” describing the expansion as “both a strategic milestone and a reflection of our commitment to responsibly advancing the next generation of financial market accessibility.” NYDFS’s BitLicense regime, introduced in 2015, remains one of the strictest state-level crypto frameworks in the US, with only a limited number of exchanges and custodians approved over the past decade, as repeatedly highlighted by outlets such as Bloomberg and the Financial Times.finance.
The New York green light comes roughly two years after eToro resolved an enforcement action with the US Securities and Exchange Commission. In 2024, the company agreed to pay a $1.5 million civil penalty to settle charges that it operated as an unregistered broker and clearing agency, and subsequently delisted most crypto assets from its US platform while it overhauled its compliance controls. That retrenchment mirrored a broader regulatory crackdown on offshore-style token menus, with major venues trimming their listings in response to SEC and CFTC pressure, as detailed in earlier reporting by Bloomberg and the Wall Street Journal on post-2022 enforcement trends.finance.
Since then, eToro has adopted a more conservative US stance, focusing on a narrower range of assets and building out its compliance and surveillance stack to meet NYDFS standards. By securing the BitLicense, the firm joins a small club of global exchanges able to serve New York retail customers, preserving a regulatory moat that rivals without state approval cannot easily cross. For US users, the expansion means a familiar social-trading interface will now sit alongside licensed incumbents in the country’s most tightly regulated crypto market, while for the industry it offers a template for how post-enforcement platforms can re-enter New York — provided they accept heavier oversight and a slimmer token set.
Since its inception, bitcoin has been like a daredevil climber scaling new heights, rarely looking back at the ledges it left behind. Its price seldom retraced to previous bull-market peaks, even during long, grueling bear markets.
But that pattern seems to have changed, suggesting that the market has matured, and the era of runaway, parabolic gains is behind us.
BTC trades near old peak
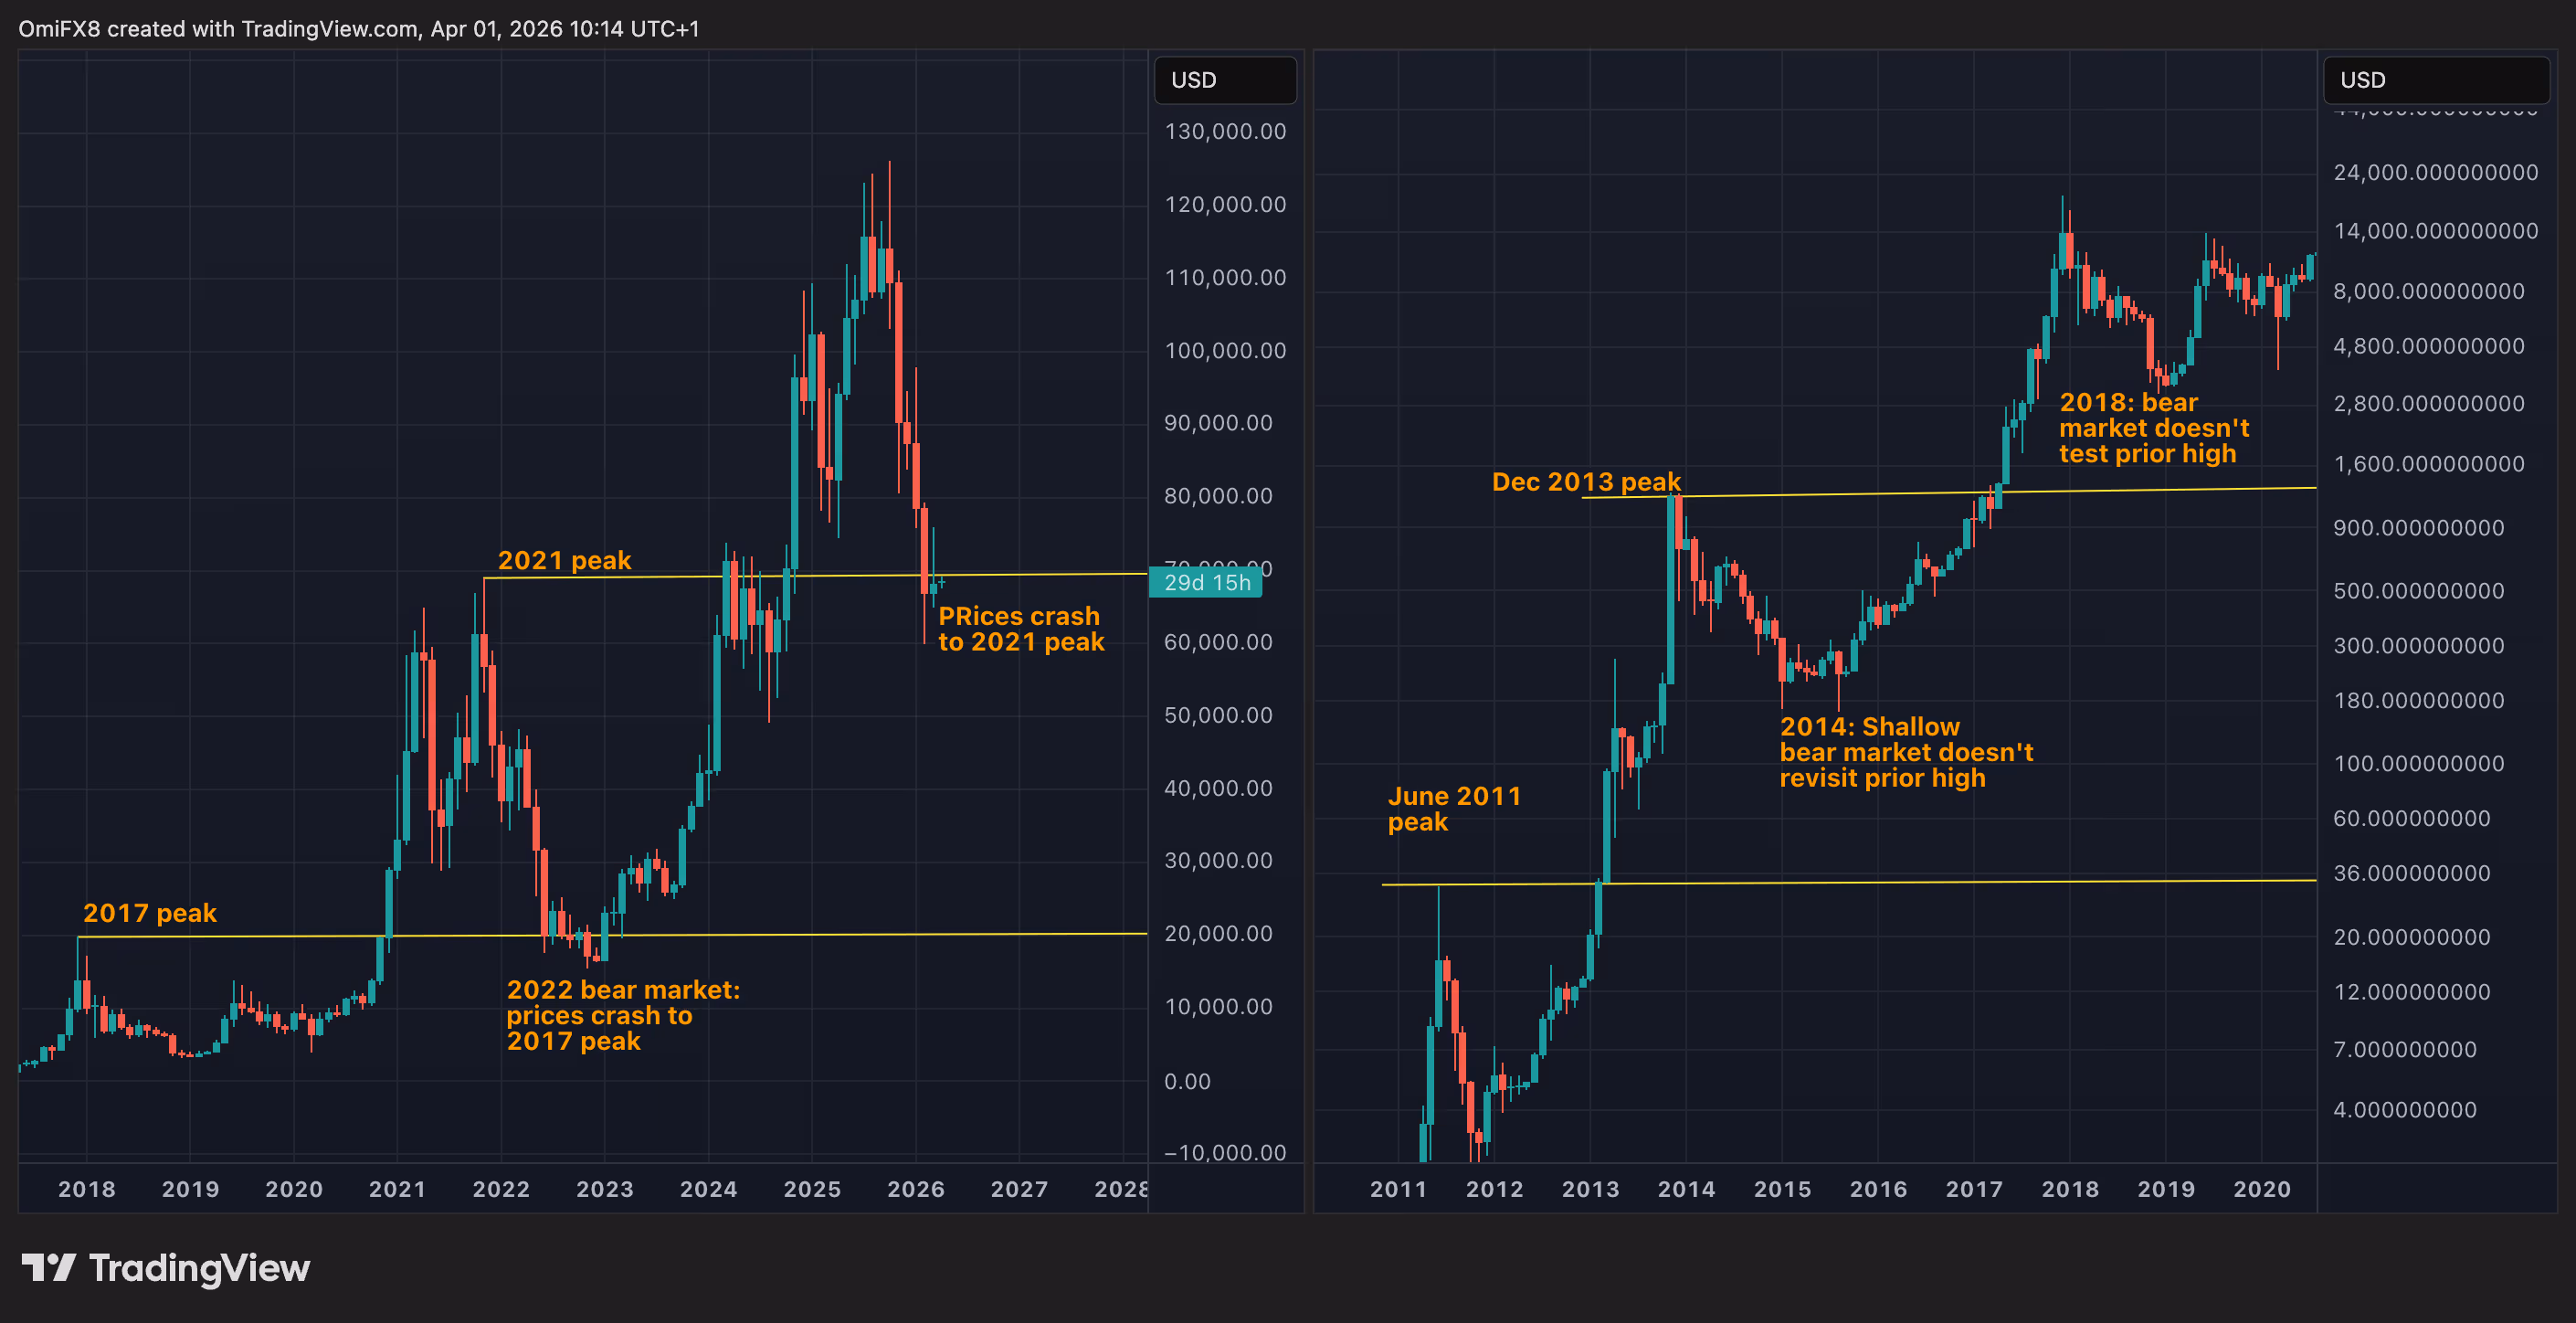
Bitcoin has been hovering around $70,000 since early February – well below the $126,000 peak of the 2023-2025 bull run.
That $70,000 mark is important because it was the record high in the 2019–2022 market cycle. In other words, this bear market has retraced all the way back to a previous summit.
This is unusual. In earlier bear markets, such as those in 2014 and 2018, bitcoin never returned to prior cycle highs. The exception was 2022, when prices dipped under the 2017 high of $20,000. At the time, analysts dismissed it as an anomaly, blaming crypto scams and massive deleveraging.
What makes the current retrace remarkable is that it’s happening without any extreme catalysts. The market has simply returned to a prior peak as part of the natural ebb of a bear cycle.

Slowing growth and the law of diminishing returns
Each new bull run isn’t generating the parabolic gains of the past. Pushing prices far beyond previous peaks is getting harder, which makes retraces to old highs more natural. In other words, previous peaks are no longer untouchable.
This is a clear example of the law of diminishing returns. As bitcoin becomes more expensive, moving prices higher requires ever-larger sums of capital. The days when modest inflows could trigger massive rallies are largely behind us, making price movements more measured and predictable.
Looking at historical growth highlights this trend:
- The 2013 peak was 38 times higher than 2011.
- The 2017 peak was 16 times higher than 2013.
- By 2021, the increase slowed to just 3 times the 2017 level.
- The 2025 peak of over $126K was less than twice the 2021 peak.
While prices are still rising, the pace of growth is steadily slowing.
Institutionalization and broader market participation
Part of this slowdown comes from the institutionalization of Bitcoin and the growth of the derivatives market. Traders now have structured ways to bet on volatility, timing, and market direction, not just price increases. This broader participation has tempered extreme swings.
This is very different from the pre-2020 era, when trading was largely limited to buying and selling on the spot market. Back then, only bullish believers of bitcoin actively participated, often jumping in at the first sign of a dip.
Behavioral patterns and what’s next
Old peaks often act as strong support levels due to a behavioral concept called anchoring bias, where traders fixate on previous highs as reference points.
Many who missed the initial breakout tend to buy when prices return to these familiar levels, fueling the next leg of a bull run. This behavioral tendency, combined with the self-reinforcing nature of support and resistance, helps explain why the recent downtrend has stalled around $70,000.
A strong bounce from this level could signal that the bear market has run its course, similar to late 2022, when the downtrend ended around $20,000.
However, if the law of diminishing returns is any guide, the next uptrend may be more measured and “tradfi-like,” rather than the frenzied rallies of the old speculative days.

US Treasury Seeks Comment on State-Level Stablecoin Regulatory Criteria

Prevent now being used by mental health staff for kids

Women’s Champions League: Sonia Bompastor left furious after Katie McCabe hair pull incident


-

 News Videos7 days ago
Parliament publishes latest register of MPs’ financial interests
-

 Business6 days ago
Instagram, YouTube Found Responsible for Teen’s Mental Health Struggle in Historic Ruling
-
 Tech6 days ago
Intercom’s new post-trained Fin Apex 1.0 beats GPT-5.4 and Claude Sonnet 4.6 at customer service resolutions
-

 NewsBeat5 days ago
The Story hosts event on Durham’s historic registers
-

 Sports5 days ago
Sweet Sixteen Game Thread: Tide vs Michigan
-
Entertainment2 days ago
Fans slam 'heartbreaking' Barbie Dream Fest convention debacle with 'cardboard cutout' experience
-
 Entertainment4 days ago
Lana Del Rey Celebrates Her Husband’s 51st Birthday In New Post
-
Crypto World1 day ago
Dems press CFTC, ethics board on prediction-market insider trades
-

 Sports1 day ago
Tallest college basketball player ever, standing at 7-foot-9, entering transfer portal
-

 Tech3 days ago
The Pixel 10a doesn’t have a camera bump, and it’s great
-

 Crypto World1 hour ago
Gold Price Prediction: Worst Month in 17 Years fo Save Haven Rock
-

 Entertainment7 days ago
HBO’s Harry Potter Series Will Definitely Fail For One Big Reason, And It’s Not J.K. Rowling Or Snape
-

 Tech2 days ago
EE TV is using AI to help you find something to watch
-

 Politics2 days ago
Should Trump Be Scared Strait?
-

 Crypto World2 days ago
U.S. rule change may open trillions in 401(k) funds to crypto
-

 Tech2 days ago
Flipsnack and the shift toward motion-first business content with living visuals
-

 Tech1 day ago
How to back up your iPhone & iPad to your Mac before something goes wrong
-

 Fashion6 days ago
En Vogue in Brown Leather and Tailored Neutrals by Atelier Savoir, Styled by J Bolin
-

 Tech2 days ago
Apple will hide your email address from apps and websites, but not cops
-

 Fashion6 days ago
What Are Your Favorite T-Shirts for the Weekend?
You must be logged in to post a comment Login