
Business
Market Shifts From Risk On To Risk Off


alexsl/iStock via Getty Images

Listen here or on the go via Apple Podcasts and Spotify

David Keller returns to talk volatile markets, sentiment and his investment portfolios (0:20) Emerging strength coming outside of growth sectors (7:40) Fusion analysis: marrying technicals and fundamentals (11:50) The very unique SpaceX IPO (14:30) Trulieve, uplistings and cannabis ETFs (18:10) Equity indexes from a technical perspective (21:20) USD (24:50) Gold and silver (26:35) Contrarian on Bitcoin (29:10) Charts, momentum and relative performance (33:15)
Transcript
Rena Sherbill: David Keller from Market Misbehavior, welcome back to the show. It’s always great to talk to you.
David Keller: Always a pleasure, Rena. Thanks so much for the invite.
Rena Sherbill: It’s great having you back, not least because you are a mindful investor, which we support fully and wholeheartedly. As a mindful investor, how are you looking at these markets these days? At one point people might have called them confusing, but maybe no longer. I don’t know.
David Keller: I mean, I don’t know if they’ve gotten less confusing. They’ve definitely gotten busier. I would say, to be honest with you, it looks like while the VIX is just starting to push above twenty over the last couple sessions, which for me kind of separates a low volatility, low fear, low uncertainty environment from a high volatility, high fear, high uncertainty environment. We’re kind of just pushing above that threshold.
But even though the VIX has remained relatively low, I feel like the emotional VIX for investors has been extremely elevated. And I think the reasons for that are a number of things.
We have a conflict in the Middle East that doesn’t necessarily inspire confidence with the uncertainty of what’s going to happen, but with for now relatively minimal impact on the markets. But I feel like for a lot of investors, we’re just waiting for that next headline that’s going to cause everything to unravel. And then it’s also the narrow leadership, right?
And I think the fact that if you’ve been right on this market, now you’re way over concentrated, most likely, in a bunch of growth names that feel overvalued.
And if you’ve missed this market, then you feel like an absolute train wreck that missed the best trade of 2026. So it’s like even if you were right, no one’s happy right now. So I would say it is a challenging time to be mindful more than anything, right?
Rena Sherbill: They say when nobody’s happy, it means both sides have compromised, although I’m not sure that that’s in play right now. I don’t know if that’s appropriate feedback for this per particular situation.
David, I think I might start out by putting you on the spot. We had a comment on our last article, and I haven’t even shared this with you, but I hope you’ll be game. I think you will. Somebody, a longtime fan, although a bit of a critique in the question. Somebody that’s been following you for a while, I’ll just start quoting right now. The commenter was Big Game James:
I’ve long respected Mr. Keller for his background in technical analysis and his seemingly astute market observations. That’s why I was almost shocked by his response to your question. This is quoting from your last appearance, which was just about last year.
I don’t own a lot of individual stocks, and I will tell you I own very few. I own them as long-term holdings. I own Disney, Berkshire, Hathaway types of stocks. These are companies that I think long-term are going to be good businesses with opportunities to grow. This is where the commenter comes back in. Both stocks have underperformed the SP 500 for the last 10 years, and in the case of Disney, dramatically underperformed. What kind of technical analysis did you use to come up with it?
I don’t have a problem with buy and hold. Stock market titans have repeatedly proven that it works, but traders have also repeatedly proven that trend following and position trading work. They’re all valid. My disappointment with Mr. Keller is that he runs around touting technical analysis. And then when you give him the perfect setup to explain how trend following and technical analysis can be used to identify winning stocks, he doesn’t use that opportunity.
And anyways, that’s the long and short of it. I’ll leave it there.
David Keller: That’s awesome. Number one, I’m thrilled that at least one person watches my content closely enough to kind of detect a bit of a of a disagreement there. Like that’s awesome. A great problem to have. I’ll take that any day.
Rena Sherbill: Good. I’m glad you thought that. I also thought that.
David Keller: It’s funny. I would say, for me, I’ve spent a lot of time as my career has evolved thinking about where my time and energy is best focused. And I think a lot of, and this is more of a philosophical answer to the question, Rena, and then I’ll get to the specifics, but philosophically I would say, for me, I’ve had a lot of opportunities to manage money or or do some sort of fun management type of thing.
And I’ve hated it every time I’ve tried it. Because for me, I feel like I enjoy teaching, I enjoy educating, I enjoy helping people make better decisions way more than I enjoy making better decisions of my own.
Some people have an issue with that because they say, well, if you’re not a great trader, how can you teach how to be a great trader?
I would say those are two very different skill sets. And if you say that, you’re not understanding that there’s a different, you know, if I’m a really good trader, I probably don’t have the time or energy or interest in spending all my time helping other people do it better. I just want to make my own decisions really well. So I’m an educator primarily and I enjoy that role and I love it.
And that comes from training as a musician, which is my undergraduate one of my undergraduate degrees, and I and I think of what I do as being a performer every day. So I love performing and sharing what I’m what I’m hearing and seeing and doing it that way.
But to the specific point, I would say that’s a that’s an understandable critique, but I think it depends on understanding accounts that you’re running or your portfolio and what the goals are.
So I have portfolios where I’m managing more actively. I have a portfolio that’s more of a swing trading portfolio, where I’m taking short-term bets. I have a portfolio that’s more of a kind of stay or portion of a portfolio that’s really more into active bets in individual names.
But what I’ve found, and this probably comes from years of working for big financial institutions with really annoyingly on the ball compliance departments.
That were really keen on us not trading individual stocks or trading too actively. So at the time when I was developing my own personal investment strategy, I was forced to use ETFs. I was forced to have a longer holding period. I was forced to learn how to apply technical analysis more for, you know, sort of cyclical and secular moves as opposed to tactical swings.
And so for a lot of the portfolios that I run, it’s more momentum-based, it’s more longer term, more of a position trader type of approach because that’s what I was allowed to do. And then once I was free from compliance and had the ability to go anyway, I’d already developed a pretty good strategy built on ETFs.
So I trade plenty of ETFs, but I rarely will add individual names, I will more often in my own accounts add ETFs.
Having said that, in the course of my work, I spent a ton of time working with investors and for investors and advisors and institutions that trade a lot of individual stocks.
And I have no problem pointing to charts that I think are good and again, I don’t see that as much of a conflict that I’m not necessarily putting them in my own portfolio.
I think we overvalue that as the way of determining whether what we’re doing is credible versus are we applying the tools and techniques effectively and are we helping people make better decisions? That’s what I’m trying to do. How’s that for an answer, Rena? That was a tough question.
Rena Sherbill: Nailed it, and I appreciate you being game. I think that shows as much as anything, people willing to answer questions, especially off the cuff I think speaks speaks volumes.
So, in the name of education, edification, is there an example that you could use either on the bullish side or the bearish side to highlight maybe how you illustrated or encouraged a fellow investor or trader to look at the charts in terms of a particular holding that you think speaks to this blend of technical analysis and looking at all the things that you look at.
David Keller: Sure. I mean, I would say for me, what we’ve been talking a lot a lot about more recently is the general rotation, right, away from kind of technology mag 7 type of leadership. I think we’re coming out of an environment, and this is a delicate thing to say on the week of SpaceX’s (SPCX) IPO, which is the largest IPO in history.
So I hesitate to kind of plant a flag on this comment, but I mean, there’s generally been a rotation away from technology leadership. And part of that is to make room for SpaceX’s IPO in a lot of portfolios and a lot of index funds.
But the reality is charts like Micron (MU) have already had an incredible run. And a lot of those growth stocks feel overextended based on technical and/or fundamental metrics.
Where we have started to see emerging strength is in other areas of the market, things like healthcare, things like industrials, even things like consumer staples, beverages stocks, real estate, you’re seeing more and more charts starting to go higher.
So I would say for me, there’s been two general buckets of names and types of charts we’ve been talking about.
The one recognizing nice consistent uptrends outside of the growth sectors. And an example that comes to mind would be Caterpillar (CAT), obviously a big industrial name, but this is a stock from a technical perspective, kind of a classic uptrend of higher highs and higher lows consistently pulled back to the 50-day moving average and bounced higher.
It’s just this classic kind of stepwise motion up and to the right.
And so with charts like that, the discussion is more of how do we find tactical points to accumulate a position within a long-term uptrend. And that’s where looking at, I think, moving averages as a smoothing mechanism, looking at an indicator like RSI, the relative strength index, which is based on price momentum.
And recognizing when the RSI gets down to around 40 or 50, that may be a viable dip within an uptrend.
I think charts like Caterpillar, others like aerospace and defense names and some of those other sectors that I mentioned are pretty interesting.
And then the other category would be names just starting to break out because you have a lot of charts like Caterpillar and a lot of the growth stocks that have been in long-term uptrends.
And so I think trying to find some of those charts that are a little earlier on in their in their move, something like DraftKings (DKNG) is a name I was writing about earlier this week as a stock that’s been, I mean, a chronic underperformer and over the last six to eight months has been an absolute dog.
But from February, March, April, May, you’re starting to see stability, more consolidation, more of a basing pattern. And then just this week we’re starting to break out.
So looking for new breakouts, new three-month highs in charts that have not made a new three-month high in quite some time. That’s another whole area of emerging strength.
And so I think if you find you’re overexposed to kind of mature strength, those Micron types of charts that feel like they’ve been going up way too long and your exposure’s gotten bigger and bigger, we look for newer breakouts that are lower on the momentum scale, but maybe showing the potential to have a new accumulation going forward.
Rena Sherbill: Maybe if you could share with us where you go after looking at the charts. Caterpillar sticks out to me. I do this Wall Street Roundup podcast on Fridays with our director of news. And he’s been talking for, I would say the past year about Caterpillar, how that it was like an old school stock that’s getting into AI, that’s getting into automation.
So it’s like an interesting blend of the technical analysis, but then also what narrative they have going on as a company. Where do you take it from the chart analysis? Where do you go from there?
David Keller: No, that’s a really good question. And I think what what you’re alluding to, Rena, is the value of what I do, which is look at a hundreds and hundreds of charts every day, versus what many other investors do, which is think about the the prospects of Caterpillar’s ability to generate earnings years down the road.
I think marrying those two in an intentional way is is the is the sweet spot. I call that fusion analysis. And I think that’s an important way of thinking about it.
How we surface those ideas can be different. So for me, the chart of Caterpillar is what draws my attention to it. I was taught that the technicals tend to lead the fundamentals.
The chart will often show that investors are starting to show new optimism or new excitement or anticipation about a name before the fundamental reasons as to why it’s gonna work become clear. I always say the fundamentals look crystal clear in the rearview mirror.
So down the road, we can look back and say, okay, now I get it. They’re starting to create this new business. They’re starting to incorporate AI and actually be a consumer of it and so I think, for me, scanning for stocks just starting to break out, scanning for, before Caterpillar had this nice year plus run, it was going down. So just recognizing that the chart was shifting in 2025 from a downtrend to an uptrend, I think was pretty important.
Understanding what can create the sustainable growth after that initial breakout. I think that’s part of a larger rotation that we’ve been talking about, which is, from the AI producers to the AI consumers, there’s this transition.
I think we’re in the midst of, and it’s a large gradual transition from the companies creating AI models and investing in AI infrastructure, which have had an incredible run, to names that can actually use all that cool AI stuff to build more things and sell more stuff.
And I think Caterpillar is one of those that has the capabilities and the reach to benefit from all this AI and again, I think the performance of the stock is starting to acknowledge that optimism in those areas. And I think again, as we spoke earlier, the areas of emerging strength I’m seeing are not in companies creating the next AI models. It’s the ones that can use those AI models to do things better, faster, more efficiently, etc.
Rena Sherbill: You mentioned the SpaceX IPO. Just curious, as somebody who’s been around the markets and believes in education and mindfulness. What would you say about that IPO? How are you thinking about it slash encouraging others to think about it?
David Keller: Yeah, you almost called me old and thanks for tapping the brakes just before you got to that point. So we’ll go with experience and tenure, and I’ve seen some things. So thank you for that. That was that’s very nimble, and I appreciate that.
Rena Sherbill: Very empathetic, very empathetic. I expect the same treatment, by the way.
David Keller: Listen, the SpaceX IPO honestly is is very unique. I mean, it’s it’s very unique. And I’m, you know, I as I’m thinking of my own experience, there are very few IPOs that have been anywhere near this magnitude.
And in terms of like the actual dollars and the actual impact, this is the biggest. I mean, it’s the biggest IPO. The fact that indexes like the Nasdaq are changing their listing requirements just to get it in the index more quickly, I think tells you about the anticipation.
And I think for better or worse is gonna change how Anthropic (ANTHRO) and anyone else wants to go public. Like the rules are now different. It’s like the NFL blowing out their highest paid athlete, and all of a sudden everyone deserves more more money. I think we’re at that with IPOs. There’s a skeptical side of me.
My contrarian hat, my contrarian alarm is going off that big IPOs like this usually don’t happen at the beginning of a big theme coming out. It’s usually once the theme is mature enough that people want to throw a lot of money at the idea, it’s often more in the later stages.
So that is one potential macro issue.
But in in terms of IPOs, I mean the the similar IPOs I can think of would be Facebook’s (META) IPO, like Alibaba’s (BABA), but I mean, Facebook’s IPO was one where I was more directly involved. I worked at a large money manager and had Mark Zuckerberg and his team come in and pitch on here’s how we’re gonna make money from mobile, which seemed, I remember the questions were like, how are you gonna make money on mobile? Which is quaint at the moment.
But it required you to really think outside of the box in terms of the future earnings growth you are paying for today. I mean you’re planning for way down the road on how they’re gonna mo able to monetize it. Now it feels like it’s much a much shorter time frame.
I would say from a technical perspective, honestly, IPOs are really hard to think of from a momentum perspective because momentum and what you’re analyzing is based on data. And until we get data on how investors are actually trading and how traders are actually treating this stock, there’s not much I can say about it.
And so I would say in an IPO, there’s the excitement anticipation phase, which we’re kind of right near the end of. There’s gonna be the release stage, which is this week, where we actually, you know, it starts to go out in the market.
You start to see where it’s priced, you start to see what happens immediately after. and I think once you start to gather that data, you will immediately be able to draw some conclusions about, you know, this IPO is being priced at a certain level.
Some would argue higher than it should be. Probably some would argue lower than it sure should be. The market’s going to tell you in the days and weeks to come which one of those is right, or at least what the market is saying that’s right. And so the the actions soon after the IPO will tell you a lot about what could happen after.
And when I think of Robinhood’s IPO (HOOD), Coinbase’s (COIN) IPO, a lot of those did not start well and had a lot of really painful periods before they really entered into a a period of accumulation.
And I think for something like SpaceX, that’s gonna be the move I’m looking for as that sign that investors, once we’ve kind of digested the initial trading, what comes next and do you see some some upside potential there? But for now I have to wait for the data to to emerge.
Rena Sherbill: A measured approach, which is always appreciated. I think this might be something like a similar topic. Trulieve (TRLV), one of the major cannabis companies of the past few years, just uplisted. What would be your thoughts there, if you have any to share?
David Keller: Cannabis is a fascinating area. Full disclosure, I still own (YOLO). That’s one of the ETFs that I have in a in a long-term account. And I’m in Washington State. I mean, cannabis is so widely available here and more socially accepted than in other areas of the country. So I imagine, I’ve not seen the geographical ownership of something like YOLO, but I bet it’s regional in terms of who feels like this is an obvious next step.
But the challenge has been the regulatory challenges, the fact that it’s still a state to state thing and on a federal level is still obviously not as widespread or not as accepted or clean. I would say the other one is just here in Washington State, the problem is there are huge taxes on cannabis. So if you go to a legal cannabis dispensary, you’re paying like a 30% premium or something like that because of all the fees that are added onto there. So I think there’s a lot of hurdles to it.
However, it’s like how do you see it playing out? From a technical perspective, again, that was a very non-technical play that I made in a portfolio, which is I think this is a theme that’s going to emerge. And I think the chart is very challenged now and I’m betting on some point that that’s going to rotate higher.
Something like YOLO had a really good spike higher in 2025. And there’s a lot of discussion about changing the requirements and the legal status. From there, it’s really been sideways. So it sort of hit a new plateau.
So from a technical perspective, it’s sort of building momentum. It’s a pretty straightforward name. It’s a big base. You wait for a big base breakout. So the market’s telling you that this cannabis ETF and this one in particular that I’m looking at is kind of fairly valued, around three to four dollars. And that’s kind of what this is worth.
And at some point we have a catalyst that pushes us to a new swing high. And that happened in 2025. It’d be great to see it happen again, but not yet from a technical perspective.
Rena Sherbill: Why YOLO as opposed to (MSOS)? Out of curiosity.
David Keller: I like the ticker. Is that is that a valid answer? No, I mean, at the time and when I looked at them, I had a whole due diligence process. So I was looking at looking at fees, looking at liquidity, looking at the technical configuration. I settled it on YOLO. I don’t have any particular I mean, that’s more of a global one, right? Compared to like MSOS, which is a US cannabis. There are number that have different exposure to like US versus Canada and everything. I don’t have a lot of high conviction on one versus the other.
From a technical perspective, they’re all very, very similar. More recently, MSOS, though, has outperformed YOLO for for what it’s worth. That’s a fair observation.
Rena Sherbill: So maybe we can get your take on the major market indexes, how you see them from a technical perspective, and then maybe we can add in oil, the dollar, bitcoin if we get to all those?
David Keller: Starting with the with the equity indexes, I mean, obviously the last week has had a very significant shift from risk on to risk off. And I would say the warning signs leading up to that have been pretty clear.
And I would say from a technical perspective, probably the most clear way of illustrating that would be the lack of breadth support. So as the market’s going higher in April and in May a lot of breadth indicators were not going higher, right?
So the advanced decline line, which is a classic just measure of every day how many stocks going up, how many stocks going down. And you look at that trend over time. In a healthy bull market like mid 2025, the S&P (SP500) is going higher, the advanced decline data is trending higher as well because more stocks are going up than going down, which kind of makes sense. And in a bearish market, you’d see more stocks declining than advancing, because that’s what generally drives the index.
But we’ve had a disconnect coming off of the March low for the S&P 500, where the S&P and the Nasdaq (NDAQ) have surged higher, but it’s really been driven by technology, which is about 40% of the S&P on its own. And if you add the kind of other things in like consumer and communication services that are essentially technology, but just are labeled in a different sector. I mean, it’s over half of the S&P are just big, growth kind of plays.
And so when that group of mega cap growth stocks are doing well. The S&P and the NASDAQ are doing well.
So the indexes have been going up, but the breadth has all been rotating lower, indicating that not as much participation as we would generally want to see. So that has been, I would say, from a technical perspective, a real challenge to this market in April and May.
But the warning signs have remained relatively low. So volatility has been low, credit spreads have been narrow.
Those kind of things have still been okay. All of that shifted starting mid last week. We started to see spreads widen up a little bit. We started to see volatility pop, especially on Friday.
And now this week we’re seeing the VIX pushing back above twenty. We’re seeing defensive sectors like utilities and REITs start to really outperform. And those are just really common things at major tops.
I should note by the way, two of my favorite indicators that flashed here in the last month would be the Hindenburg Omen, which is a classic kind of market top indicator looking at breadth conditions and trend. And then another one called the Titanic Syndrome. And you can assume by the the naming of those indicators just how bullish they are when they start firing.
And the answer is not much in all there, they’re very bearish indicators. And both of those, the Hindenburg Omen, which is based on trend and breadth.
The Titanic Syndrome, which is looking for the market to make a new high, but new lows outnumber new highs. All those things have fired in the last couple of weeks.
And so the market rolling over in the last week, week and a half doesn’t surprise me because we’ve had a lot of warning signs that sort of emerged beginning of Q2. And so now we see the S&P starting to rotate lower and start to break initial support. Our initial line in the sand was 7340.
And just as we’re recording this on June 10th, we’re potentially closing below it today for the first time. So I think that puts us in more of a risk off vibe for the S&P here.
Rena Sherbill: Should we go to the dollar? Is that a good place to go next?
David Keller: I think as an equity investor, it behooves you to really think about non-equity asset classes, commodities, currencies, interest rates. I think these are all pivotal.
And I find when people ignore those asset classes, you ignore them at your own peril because a lot of times indications will and and and changes in sentiment will be reflected in the dollar.
They’ll be reflected in interest rates in terms of like expectations about economic growth or reaction to inflation data, something like gold or silver and some sort of safe haven move.
So I appreciate you asking about those other things. I think it’s important to reflect on all of them.
The dollar’s been a really interesting chart. If you look at the chart of the dollar, it’s been sideways for over a year now. I mean, right now we’re right at the same level we were in April of 2025. and so the dollar has been choppy and noisy, but generally sideways.
I would say one of the risks right now is the dollar index pushes above 100 and it’s kind of right there over the last week. So the dollar’s been popping since the end of in since the end of April. It sort of bumped up against the same level it hit in March and April, same level it hit back in November of last year, same level it hit back in summer of last year.
And it’s sort of usually gotten up to around this point, and that’s been it. Dollar pushes above 100. I think that starts to indicate a larger shift in sentiment and more of a risk off type of feel.
So I think the dollar for now still probably kind of neutral on that longer term timeframe, but very close to where it starts to feel like a sign of of of flight to safety that would be a potential issue for equities.
Rena Sherbill: Gold? Speaking of flight to safeties.
David Keller: What’s so funny is you think, and I immediately I even just mentioned gold as like a safe haven. It really hasn’t traded like one though recently.
I mean, the correlation between stocks and gold, one of the best, I think, benefits of gold over the long term has been the correlation is so low to stocks. So people think of it as an inverse relationship, right? So when stocks go down, gold should go up because it’s a safe haven. But that’s really not what the data shows you.
The data shows you that correlation is just very low between the two, which means when stocks do something, gold most likely is kind of doing its own thing. And and and that’s good because you want low correlated assets in a portfolio. That that’s true diversification.
So gold generally, I generally have a position in gold. I still have a position in the (GLD), but my position in the GLD has gotten smaller and smaller as the chart has looked less and less good.
So while the S&P and the NASDAQ have been pressing new highs in April and May, the chart of gold, particularly the chart of GLD, which is what I look at pretty regularly, has been breaking down. It was sideways for quite some time, very similar to the chart of oil, but just in the last couple of weeks, we’ve seen the GLD start to break down.
And just in the last week, as the S&P and the NASDAQ have pulled back, gold’s actually gone below its 200 day moving average for the first time in in quite a long time. And so I think that represents a real shift in precious metals.
So for me, I’ve been lightening up in my own position. I’ll always have some position in gold because I think it’s a good way of diversifying away from equities. But I kind of lighten up or add to that position based on the momentum.
And the momentum for me says more leaning away at this point.
Rena Sherbill: Silver and then I’m gonna do Bitcoin and oil for for those paying attention.
David Keller: Silver, very similar. Silver in a lot of ways has felt like a leverage play on gold, to be honest with you. It’s like a triple long or triple levered gold ETF almost. And that’s not entirely true, but that’s exactly how it’s felt.
I haven’t owned silver in my portfolio. I’ve just owned gold and and gold miners. but I would say a very similar sort of setup. And between the two, when that group looks, when precious metals start to recover.
Most likely I would not be surprised if silver leads on the way out because that’s pretty common that you would see it underperform on the way down and start to outperform on the way up.
So something that’s on my I have a watch list of things that are definitely in a downtrend, but I’m waiting for signs that that momentum shifts and for silver just not there yet.
Rena Sherbill: Bitcoin?
David Keller: So Bitcoin (BTC-USD), I do have a contrarian hat, as I alluded to earlier. And I would say the justification for owning Bitcoin at this point from a technical perspective is it’s gone down a lot.
And to be honest with you, right? It’s gone down so much that it’s testing those February lows. I have owned owned Bitcoin at many times over the last couple of years. I’ve usually used ETFs, although I did I did own, you know, just own Bitcoin directly for a while. I’ve exited all those positions.
At this point I don’t own any (GBTC), but I’m starting to think about it given the fact that we’re retesting those major lows. So the sweet spot from a technical perspective would be, or kind of the ideal situation would be what we’re seeing now is a retest of those February lows right around like 60,000-ish.
And we’re testing that support. We find stability, we start to rotate higher. And we saw a bit of that over the last week. not quite enough for my own momentum models to turn overwhelmingly bullish, but definitely where I’m jotting it down on a notepad and saying, let’s watch GBTC for some sort of upside rotation.
So something like Bitcoin, I think of it in a couple steps. I think too often individual investors think in binary terms, right? I own 100% of something or I own zero percent of something. And I think what we want to do is learn more from how an institutional investor would generally think of it, which is if I think it’s an interesting opportunity but a high risk, I’ll take a smaller speculative position just to see if it works.
So I limit my exposure, but I get the benefit of that initial surge. And that’s kind of where I’m at right now this week.
And then if the uptrend emerges and if you see signs of accumulation, which would be we start to break above moving averages, the momentum starts to shift, meaning the RSI is pushing higher as we swing higher in price, those would be the things I would need to see to say, okay, that speculative position now needs to be a larger position that I put in a portfolio.
But at this point, it’s more of a speculative play, given the lack of sort of signs of accumulation as I would describe them.
Rena Sherbill: A nibble approach, if you will. Last one, oil.
David Keller: Crude oil, honestly, I mean, if you the the spike in crude oil sort of around the I guess initiation of hostilities or the escalation that original escalation earlier this year was not surprising. you know, given what’s happened in the Middle East and and how the US was drawn into, I mean, it wasn’t too long ago we were debating whether the US would be drawn into this Middle East conflict. Now the US is kind of central to it.
So you had that initial spike in crude oil, but from there, to be honest with you, crude oil has been really choppy, sloppy sideways, which is another, again, the professional term for that, for that chart pattern. I mean, it’s really, it’s really been choppy. It’s been very noisy.
And so, crude oil has kind of fluctuated from, eighty five, eighty seven dollars a barrel up to like one eight, one ten or so. And it’s just been been very, very sideways to that. What’s interesting to me right now is in the last couple days, headlines are all speaking to a re-escalation of hostilities with a helicopter, shot down and retaliation of some sort. So it seems like the momentum headline wise is for an escalation.
Crude oil prices are still relatively low versus the range we’ve been in just during this conflict. So I would say as a swing trading opportunity, we’re at the lower end of an of a range that we’ve established based on this conflict.
And so I would say on the short term, it’s probably a tactical rotation up to at least the middle part of that range. So I think it’s a good short term opportunity.
As a long term investment, the problem I would have with crude is it’s sort of established this range. So things would really have to get severely more negative or restricted. Some larger change would have to happen.
To put upside pressure on crude oil prices beyond what we’ve seen so far. So I think of it as more of a trade than an investment at this point.
Rena Sherbill: What other charts are part of your daily or weekly process?
David Keller: Ooh, that’s an awesome question. I mean, my process goes through honestly, it’s evaluating the major indexes, it’s evaluating momentum, it’s evaluating relative performance, which is something we haven’t talked about, I guess, a ton here today.
Relative performance or relative strength is all about, you know, this chart I’m looking at. How does that compare to all the other charts I can look at?
And I think that’s super important in the equity space because you can spend all your time trying to analyze one particular chart, but the relative strength, how this is doing relative to its peers, like that’s the most important thing arguably to look at.
Because that tells you whether you’re looking at the right chart at all. Because what we want to think about as equity investors is owning stocks that are outperforming the S&P because if you own stocks where the relative strength is going down, there’s that opportunity cost of I’m just I’m not in the better charts that are out there.
So my goal is to keep upgrading my roster and trying to put the best 11 players on the team, whatever sports analogy you want to use. And so if one of my players is not doing well and the relative strength is not great, I want to swap someone in who’s doing better and and just keep upgrading the portfolio.
And relative strength is the most important way to do that. So I would say some of the things that come out of that work right now, one would be small caps.
Which, generally in 2026 and it’s changed a bit with this last surge with the Nasdaq, but for most of 2026, small caps have been outperforming large caps at the higher index level. So in my own portfolios, I own a lot more small cap ETFs than large cap than I normally would versus large cap ETFs because of that performance gap.
So I think recognizing that has been important and then on a sector basis, because technology’s really been the only S&P sector to outperform in the second quarter, but you’re starting to see those trends shift. And so you’re seeing technology start to come off a bit, and then you’re seeing an emergence of strength in other sectors.
So when I’m scanning regularly for individual stock ideas and things that are moving higher, it’s in value-oriented sectors like industrials, materials like an (LIN) comes to mind.
And then it’s in defensive sectors, things like REITs. There are more and more real estate names popping up on the list. And again, that I think that has a macro tell because it tells you that investors are kind of shifting into sort of low volatility areas of the market, maybe a little bit.
But also in terms of idea generation, because I want to generally keep rotating to where the relative strength is. And it’s been in small caps, it’s been in value, it’s been in defensive sector. So I’m gonna keep looking there.
Rena Sherbill: It’s interesting. Our next two episodes are about small caps. I don’t know if you know Courage and Conviction Investing. He’s a big small cap guy who’s done well. And the next episode after that is about REITs. Anything else to underline or highlight about the small cap space?
David Keller: To be honest with you, I think with with small caps, it’s been fairly across the board, right? I tend to look at the Morningstar style boxes. So look at small cap growth, value, core, and then the same for large cap, same for mid cap and you get a different read depending on what slice you’re looking at, I guess.
But generally, I mean, even small cap value has been outperforming a mid-cap value or large cap value. So even within a value sleeve, it’s generally paid to go smaller than larger. So I think that’s kind of consistent across those different cap tiers, not just small cap value and then other things are working.
I mean in most of those areas, the small cap counterpart has outperformed the large cap counterpart. And so again, for me that’s a reminder to continue to evaluate performance and at some point small caps will not be as strong, and that’s when I’ll rotate away from them.
But for now, we’re still seeing strong performance.
Rena Sherbill: I’m curious, and not a plug, just a curious question. We have this quant system on Seeking Alpha that relies heavily on momentum and also sector relativity. I’m curious, do you use that at all? Or does quant play a part in your strategy process?
David Keller: I actually do. and I’ve talked to Steve Cress about the quantitative model and how it’s designed and everything. For me, the quantitative approach is super valuable, especially for someone like me. My skill set and my background is in technical and behavioral analysis, right? So my goal is to understand the charts and the momentum and the sentiment and the psychology behind decisions that I’m making and behind decisions that other investors are making.
But I also recognize that generally buying undervalued stocks has usually worked over the long term, particularly in a beaten-down market, right? Buying undervalued names and I’ve learned that earnings growth, particularly estimate revisions, right? Improving expectations for earnings generally tends to work.
So I can either flip through a ton of 10 Qs to make my own assessment and review a bunch of street research, or I can use a well designed quant model to cut that corner and recognize look, let me find companies that score well on earnings quality and score well on a value metric or whatever I think is important.
And then the momentum that’s included in the quant model is pretty good. For me, I feel like I have a lot of really good additional moment, ways to measure momentum and think on a more tactical timeframe. So I think of it as more as let me look through all the thousands of stocks I should be considering.
Let me look at only those ones that score well for for earnings quality. the dividend components in that in that model, by the way, I think are really good as well, right? The dividend aristocrat, right? Consistency in dividends, increasing dividends.
Let me find those stable, good companies with good growth prospects using that quantitative approach. And then let me look at those charts. And find the best charts within that universe.
And for me, combining those has been a pretty, pretty powerful approach. And that that mirrors very much what we did when I worked for a large buy-side institution.
We we called it a thrice blessed screen or a trip aces screen, the fundamental, technical, and quantitative teams all agreed that something looked pretty good. That was a really good list of of names to to focus on. So that’s how I use quant in my own approach and and the Seeking Alpha model in particular.
Rena Sherbill: Much appreciated. You were talking before how your firm was involved in the Facebook IPO. And I meant to ask after you mentioned that if there was anything that you took anything else that you took away from that meeting, like in terms of watching a company grow and develop, has it taught you anything?
David Keller: Oof. That could be a whole other hour discussion we have, maybe a whole weekend. I think.
Rena Sherbill: Yeah. That’s a whole episode, you being a part of that IPO.
David Keller: It is. That was a fascinating experience. And I would say a number of things that I took away from it without revealing anything proprietary. Then probably the statute of limitations is probably done on any NDA I signed when I left that firm. But I would say this: number one, I was amazed at how oversubscribed that IPO was.
And I just know from my firm, we had Zuckerberg and the team come in. He was wearing a hoodie. I mean, right out of the script. I mean, he literally walked in to a professional money management firm in Boston in a hoodie. It was awesome. We were all like debating, is he gonna do it? He totally did it.
So we had like six or seven portfolio managers in a small conference room as to not overwhelm it. But then I was in a separate room where there are like 150 of us because so many people wanted to like think about it. And we were able to like talk to the people in the room and stuff. But it was more just like, I looked around, I’m like, my God, the entire firm wants to like check out this IP. I mean, that tells you how just within our firm, how many people wanted to participate. So it’s like the scale of interest, you could tell it had market moving potential.
I think the other thing that struck me at the time, Facebook was only monetizing their desktop app. And they hadn’t, I mean, and there was a mobile app. And again, I mean, mobile was in a different, I mean, different era altogether. But I mean, I remember the questions were all about how are you possibly gonna monetize mobile because they hadn’t done it. And it was like all this really soft and fluffy idea about here’s how we’re gonna do it. And I remember a lot of people being very skeptical like that, like no one’s gonna want to use their phone if there’s a bunch of ads popping up. Like that’s the non starter.
And so it taught me how far you’re looking forward during an IPO. And then I would say the third thing is, Meta has obviously been one of the great success stories in terms of like the performance of a stock, but there have been some really rocky periods during that. I mean, some huge management missteps, like the whole metaverse thing, right?
So it’s not a straight line between we have this really cool way that we’re gonna be profitable years and years down the road. And this is one of the biggest stocks that everyone seems to have to need to own a little bit of. There’s it was not a you know direct line from A to B.
And so I think there’s a lot of money to be made within even if you think something like SpaceX is gonna be the future. And if you feel like the Starlink network is the future and everyone’s gonna need it, and we’re gonna colonize Mars and this company is probably, I don’t doubt that a lot of that probably happens.
But that doesn’t mean it’s a good stock to own right at this particular moment. And I think there’s a lot of time, there’s a desperation that if you don’t get into an IPO early enough, you miss out. I would guarantee, I mean, I’m not going to guarantee, but as close as I can come to guarantee and still be compliance friendly, I would say there’ll probably be a great buying opportunity on a chart like that that’s not at the IPO. That would be my my third lesson there.
Rena Sherbill: Getting back to cannabis, one of our headlines last year on the Cannabis Investing Podcast was, have cannabis investors been early or wrong or both? So definitely the first move or advantage, not always an advantage, to be sure.
David Keller: And it and it’s so funny, I think that’s a constant theme here. I mean, culturally will we think of cannabis differently? I think undoubtedly, I think that is a thing that’s happening. We are. And just the way we’re talking about it now, the fact that you have a cannabis podcast that is not a fringe thing that no one knows about, I think tells you a lot about how it’s becoming more widespread. And at least people are thinking about it.
But I remember Bitcoin being like this fringe thing. And I remember when the Bitcoin ATM went up in South Station and we all got pictures where we’re like, this is so dumb. Like, why would you even do what is these? What do you even get out of this? And it was way early and it ended up getting removed because no one was using it. But it was like it was a great sign that this was a theme. So I think we get way too nervous about missing out on themes. And just that’s why charts for me are so vital.
Because you don’t have to have a crystal ball. You just have to track the trends and how the sentiment is shifting. The sentiment hopefully will shift because I still own YOLO on cannabis stocks, but I’ll be there when it does and I’ll look for that breakout.
Rena Sherbill: My last question about the Facebook meeting, did you generally leave impressed with with Mark Zuckerberg?Or is the hoodie the answer?
David Keller: No. I mean, if you want to not sell a group of stuffy Boston money managers coming in the hoodie, that is like number one on your list. But it it definitely showed the attitude. I mean, it was just, it was such a culture shock. It was awesome. I mean, I would say very few were impressed with Mark Zuckerberg in particular, plenty impressed with the prospects of it, but it showed how much the team that he had around him were the ones actually able to articulate the investment case and what the potential was.
And Zuckerberg was very good about talking about these ideas, but in terms of what your dollar now could mean down the road, that was others. So it definitely taught me in some cases the founders are the visionaries. The others are the ones that can help actually demonstrate how that can add value over time.
Rena Sherbill: Two questions to end with. Number one, as a music man, what’s your favorite kind of music to listen to and what’s your favorite live show that you’ve been to? Or some of the top.
David Keller: That is such an awesome question. So I’m I might disappoint you a little bit ’cause I’m a classically trained musician. I actually studied trumpet and voice as an undergraduate. So I my favorite stuff is all classical, to be honest with you. And honestly, some of the best pop musicians are classically trained, I would argue. I don’t think it hurts to have a good music theory sense when you’re writing stuff.
So for me, it’s all honestly, it’s all classical. And I sing with the Seattle Symphony Chorale, which has been a joy. And I used to sing with the Cleveland Orchestra chorus. So doing Mahler’s Second Symphony. And those of you that are not classical music people, listen to Mahler’s Second Symphony. It’s the Resurrection Symphony. It is absolutely stunning and the ending should bring shivers to your spine or you’re not human. I mean, it is the like the quintessential emotion driven from a big orchestra and a big choir singing and playing loudly but musically. It’s absolutely fantastic. So performing that in Severance Hall in Cleveland was a favorite moment for sure.
Rena Sherbill: Great answer. Not disappointed at all. Impressed if anything. And the last question is I’ve been asking people at the end of conversations if they have an investing or a life motto.
David Keller: Ooh. so many. I only get one though. That’s tough. I will tell you the investing one and then I’ll tell you a life one. The investing one is it’s always a good time to own good charts. And I sign off my market recap show with that at the end of every episode.
And it’s just a reminder for me, like so many times as investors, we get too caught up in the narrative and what should work or what should be happening. And a former therapist called called that shoulding all over yourself to me. She was absolutely right.
So it’s like you need to think less about what should happen and more about what actually is happening. And so a consistent process of identifying strength and following it, identifying weakness and getting away from that is important.
I always just think it’s always a good time to own good charts. Don’t ever discount some good opportunity because it’s not in this sector or it’s not this type of thing that should work. Like just find the good opportunities.
And my other one, my life lesson, most important one to me, remember rule number six. And that is a quick story if you indulge me. It’s basically these two there’s a different versions of the story that come in, but the one is there are two, you know, prime ministers in their office.
And they’re talking about matters of state. And an assistant comes in and says, you know, hey, we have this issue with, you know, XYZ and I’m not sure what to do. And he says, Hey, remember rule number six. And so the person goes, you’re right, and walks out. And then they keep talking, another one comes in and says, Hey, we have a huge problem with this economic release. Something somebody goes, Hey, remember rule number six, and they go, You’re right, and leaves. This happens a couple of times. And so the other prime minister’s like, what is this? You know, remember rule number six.
And the prime minister says, it’s don’t take yourself so damn seriously. And he said, well, what are the other five rules? And he says, there aren’t any. And so the lesson is don’t take yourself so damn seriously. And for me, I feel like with parenting, with investing, with my career, anytime I’ve taken life too seriously, it has usually not helped me.
Anytime I’ve just relaxed, taken a deep breath, and been myself and just done what I felt was right, it’s usually ended up better. So that’s my my hope for everyone listening.
Rena Sherbill: Love that. David, I always appreciate these conversations. Always appreciate you coming on. If you would share with our audience where else they can find you, read you, get in touch with you, would be happy for you to do so.
David Keller: Thank you, Rena. You do awesome work with the show and I appreciate you inviting me on. It’s a pleasure, as always.
You can find more information about me at marketmisbehavior.com. That URL is a recognition of the bonehead mistakes we often make in our own investing and the mistakes that other investors make that hopefully we can take advantage of in our consistent processes of decision making. So marketmisbehavior.com, you’ll find my YouTube channel, my own podcast, and a lot of great content to share.
Editor’s Note: This article discusses one or more securities that do not trade on a major U.S. exchange. Please be aware of the risks associated with these stocks.


Bloom Energy Just Proved Bears Wrong

Operator
Good day and welcome to the BrightSpire Capital Second Quarter 2026 Earnings Conference Call.
[Operator Instructions] Please note, this event is being recorded.
I would now like to turn the conference over to David Palame, General Counsel. Please go ahead.
David Palamé
Executive VP, General Counsel & Secretary
Good morning and welcome to BrightSpire Capital’s Second Quarter 2026 Earnings Conference call. We will refer to BrightSpire Capital as BrightSpire, BRSP or the company throughout this call.
Speaking on the call today are the company’s Chief Executive Officer Mike Mazzei, President and Chief Operating Officer Andy Witt, and Chief Financial Officer Frank Saracino.
Before I hand the call over, please note that on this call, certain information presented contains forward-looking statements. These statements, which are based on management’s current expectations, are subject to risks, uncertainties, and assumptions. Potential risks and uncertainties could cause the company’s business and financial results to differ materially. For a discussion of risks that could affect results, please see the risk factors section of our most recent 10-K and other risk factors and forward-looking statements in the company’s current and periodic reports filed with the SEC from time to time.
All information discussed on this call is
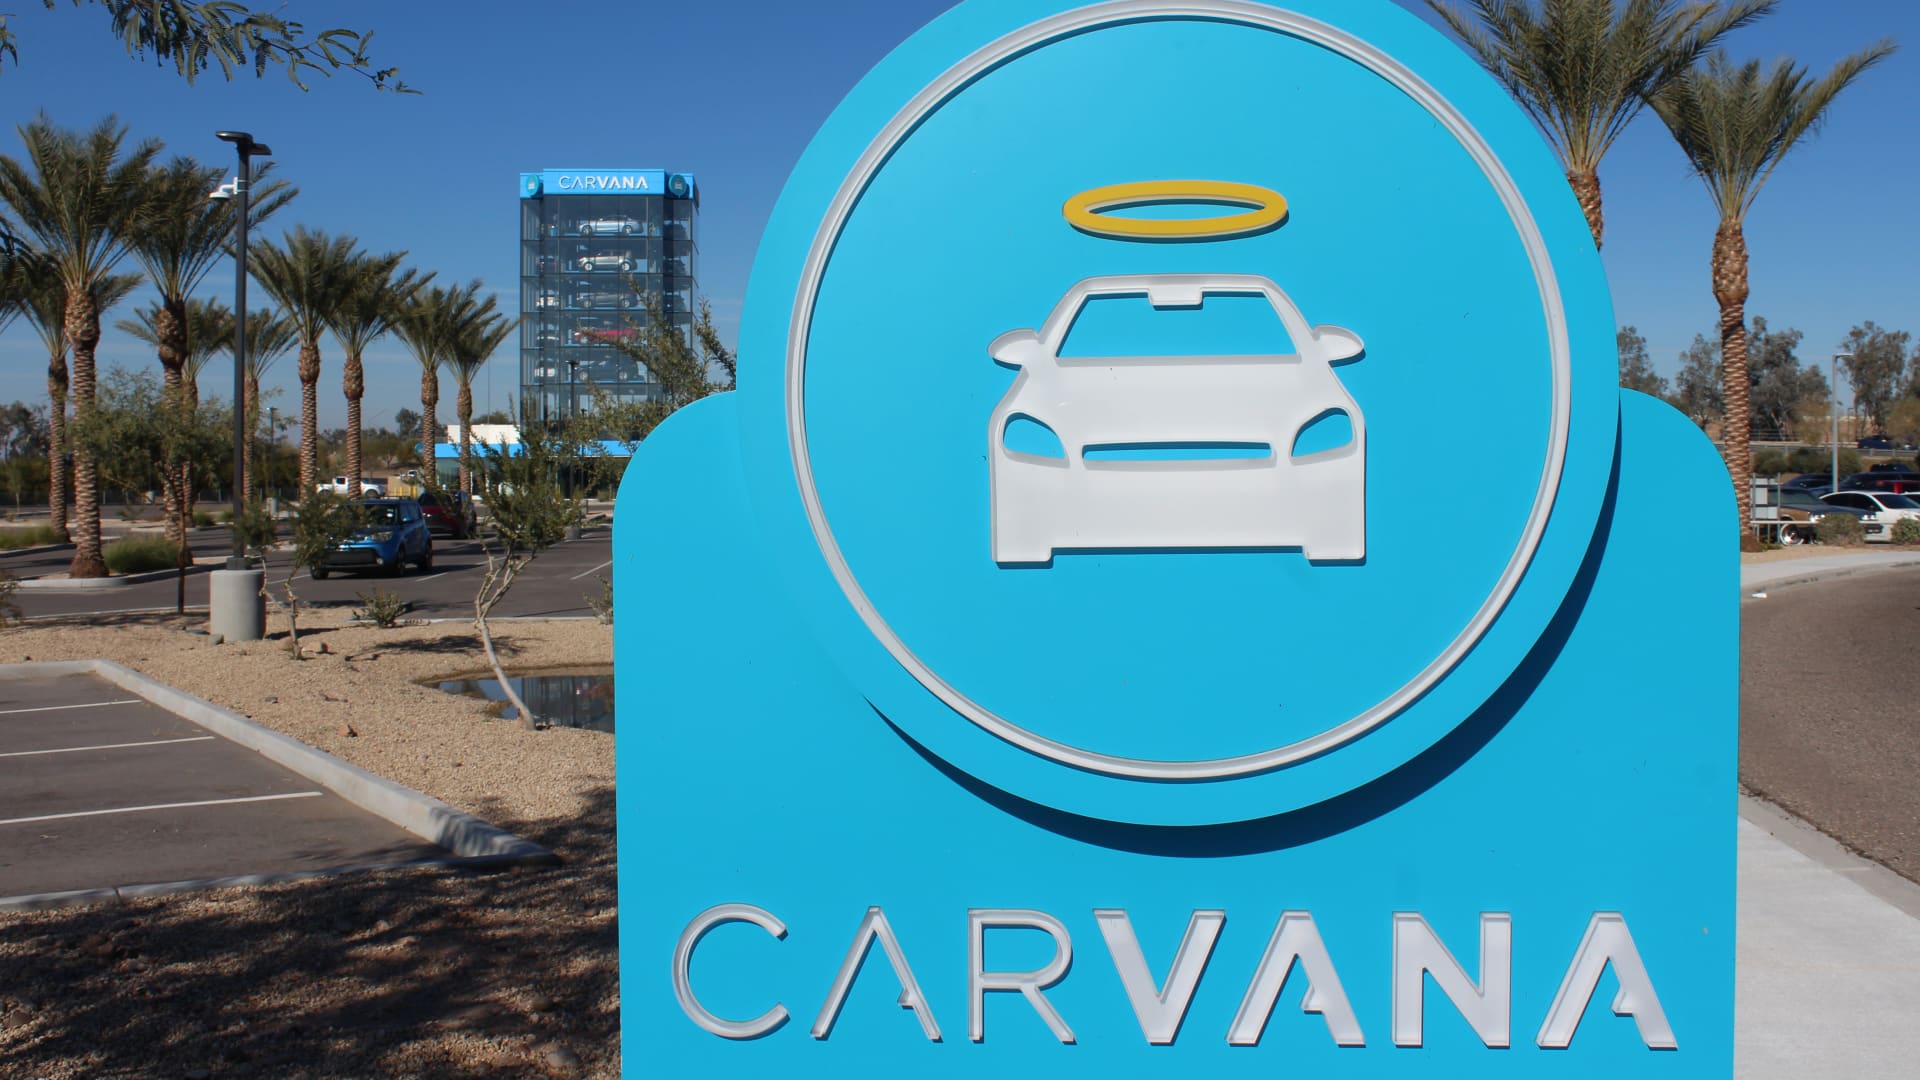
A Carvana sign and signature vending machine in Tempe, Arizona.
Michael Wayland | CNBC
Shares of Carvana fell drastically during after-hours trading Wednesday after the company reported full-year guidance that failed to meet some of Wall Street’s expectations for the auto retailer.
Carvana’s stock fell by more than 20% shortly after the company reported its second-quarter results and guiding for earnings of between $2.7 billion and $3 billion this year. The stock recovered some of those losses, but was still trading down roughly 15% before the company’s earnings call with analysts, which was set for 5:30 p.m. ET.
The guidance was lower than analyst expectations, which included forecasts of $3 billion to $3.2 billion from Deutsche Bank and $4.45 billion from Morgan Stanley.
The guidance means the company expects a relatively flat second half of the year compared with the first six months, with between $1.3 billion and $1.6 billion in adjusted earnings during the second half of this year. Such results would easily top Carvana’s record $2.2 billion in adjusted earnings from 2025.
The new guidance follows the company reporting $1.4 billion in adjusted earnings before interest, taxes, depreciation and amortization during the first half of this year, including a record $769 million during the second quarter.
Carvana’s second-quarter results included net income of $513 million, up $205 million from a year earlier; revenue of $7.38 billion compared to analyst estimates compiled by LSEG of $6.91 billion; and a 38% increase in vehicle sales to 197,325 units from April through June.
The company did not break out its sales of used versus new vehicles, which Carvana has been expanding into through Stellantis franchised dealerships.
Carvana said it expects a sequential increase in retail units sold in the third quarter compared to the second quarter, which the company said marked its 10th straight quarter of being “the fastest-growing and most profitable automotive retailer – achieving both by large margins.”
“Q2 2026 was Carvana’s 10th consecutive quarter of industry-leading growth and profitability, and it was made possible by the foundations we laid in the 10 years prior,” Carvana CEO Ernie Garcia said in a release. “We built an experience customers love, our model gets better as we get bigger, and our execution is the key driver of our progress from here.”
Garcia in a quarterly letter to shareholders said the company remains on track to selling 3 million cars per year and achieving a 13.5% adjusted EBITDA margin by 2030 to 2035.
The company’s adjusted margin during the second quarter was 10.4%, down 2 percentage points from a year earlier as it pushes its expansion efforts.
“We have only 2% market share of used retail and 1.5% market share of all automotive retail. Our runway is huge,” Garcia said in the investor note.
Business
Abbott Shares Climb 2.4% to $109.87 Following Strong Q2 Results and Raised Full-Year Outlook
CHICAGO — Shares of Abbott Laboratories advanced 2.37% on Wednesday to $109.87, gaining $2.54, as investors continued to respond positively to the healthcare company’s solid second-quarter performance and increased full-year earnings guidance.
The stock extended its recent recovery, trading higher after Abbott reported results on July 16 that exceeded expectations and lifted its profit forecast for 2026. The shares have climbed notably since the earnings release, reflecting renewed confidence in the diversified medical products maker’s growth trajectory across diagnostics, devices and other segments.
Abbott, based in Abbott Park, Illinois, posted second-quarter sales of $12.59 billion, an increase of 13.0% on a reported basis and 4.8% on a comparable basis that adjusts for acquisitions, divestitures and foreign exchange. GAAP diluted earnings per share came in at $0.53, while adjusted diluted EPS, which excludes specified items, reached $1.31.
The company reaffirmed its full-year 2026 comparable sales growth guidance of 6.5% to 7.5% and raised its adjusted diluted EPS outlook to a range of $5.45 to $5.60, up from the previous $5.38 to $5.58. Abbott returned $2.1 billion to shareholders in the second quarter through dividends and share repurchases.
“Our second-quarter results reflect the momentum we are building,” said Robert B. Ford, chairman and chief executive officer. “We expect this momentum to continue and drive accelerating sales and earnings growth in the second half of the year.”
The results were supported by broad-based contributions. Medical Devices, Abbott’s largest segment, delivered solid comparable growth led by electrophysiology, rhythm management, diabetes care and heart failure. Continuous glucose monitoring systems, including the FreeStyle Libre franchise, continued to expand in the U.S. and international markets.
Diagnostics sales rose sharply on a reported basis, boosted by the March 2026 acquisition of Exact Sciences Corporation for approximately $20.6 billion. The deal added leading cancer screening and diagnostic products such as Cologuard and Oncotype DX to Abbott’s portfolio, establishing a stronger position in oncology diagnostics. Comparable diagnostics growth was more modest once the acquisition was factored into prior-period comparisons.
Nutrition showed signs of stabilization and sequential improvement after earlier challenges related to pricing and volume. Established Pharmaceuticals also contributed positively in key emerging markets.
Pipeline progress provided additional support for the outlook. Abbott completed enrollment in its TECTONIC U.S. pivotal trial evaluating an investigational Coronary Intravascular Lithotripsy system for treating severe calcification in coronary arteries. The company also completed its FDA submission seeking approval for the Amulet 360 left atrial appendage device. In May, the American Cancer Society updated colorectal cancer screening guidelines that reaffirmed Cologuard and Cologuard Plus as preferred options for average-risk adults age 45 and older.
Management pointed to four areas expected to drive much of the anticipated second-half acceleration: Nutrition, Electrophysiology, Core Laboratory diagnostics and Cancer Diagnostics. Visibility into demand drivers in these businesses has improved, according to company commentary on the earnings call.
Foreign exchange was slightly better than expected in the quarter. Adjusted gross margin expanded, and cash generation remained strong, supporting both pipeline investment and capital returns. Third-quarter adjusted EPS was guided to a range of $1.38 to $1.46.
The Exact Sciences acquisition, completed in late March and funded largely with new long-term debt, has begun contributing to results. Integration is progressing, and early performance in cancer diagnostics has helped ease some investor questions about the strategic fit and near-term dilution.
Abbott operates across a range of healthcare categories, from diabetes management and cardiovascular devices to diagnostics, nutrition and established pharmaceuticals. This diversification has historically provided resilience through varying market conditions. Procedure volume trends in hospitals and the competitive landscape for continuous glucose monitors and structural heart products remain areas of focus for investors.
The stock has experienced volatility over the past year, trading in a 52-week range from the low $80s to the high $130s. Recent gains have recovered ground lost earlier in 2026 amid broader medtech concerns and questions surrounding the Exact Sciences deal and nutrition volumes.
Analysts have generally maintained constructive views following the second-quarter report, citing the raised guidance, sequential improvement and pipeline milestones. Consensus price targets sit above the current trading level, though individual firm targets vary.
Looking ahead, investors will monitor execution on the second-half acceleration, the ramp of newly acquired cancer diagnostics products, regulatory progress on key devices and any further updates to guidance. Demand for healthcare products and services is expected to remain supportive longer term, driven by demographic trends, chronic disease prevalence and technological advances in diagnostics and monitoring.
Abbott’s combination of established franchises and newer growth platforms positions it to benefit from these trends. The second-quarter results and guidance increase have provided a clearer picture of near-term momentum after a period of investor caution.
Wednesday’s share price advance reflected ongoing digestion of the positive earnings update and confidence that the company can deliver on its raised outlook. With several catalysts still ahead in the second half, including potential product launches and further data on acquired businesses, attention remains on operational delivery and sustained growth across the portfolio.

Most businesses can tell you when the boiler was last serviced, when the fire alarm was last tested, and when the lift was last certified. Ask when the mature beech at the edge of the car park was last inspected by someone qualified to assess it, and the answer is usually a pause.
Trees occupy an odd position in commercial risk management. They are conspicuous, they are often the most valuable landscape feature on a site, and they are almost never on the maintenance schedule. Then a limb comes down on a parked car, or a whole tree fails across a footpath, and the question of who was responsible for knowing it was going to happen becomes a very expensive one.
The duty is not optional and it is not passive
If your business occupies land with trees on it, you owe a duty of care under the Occupiers’ Liability Act 1957 to anyone lawfully on that land, and a lesser but real duty under the 1984 Act even to trespassers. Where a tree overhangs a road or footpath, the Highways Act 1980 gives the highway authority powers to compel action and to recover costs.
The important word in all of this is reasonable. The law does not require that trees never fail. Trees are living structures and some proportion of them will shed limbs regardless of what anyone does. What the law asks is whether the occupier had a reasonable system in place for identifying foreseeable risk, and whether that system was actually followed.
Courts have consistently framed the test around inspection. Not around outcome, and not around whether the defect was obvious in hindsight, but around whether a landowner had arranged for someone competent to look at the trees at sensible intervals, and whether that person would have spotted the problem. Where a business can produce records showing a periodic inspection regime by a suitably qualified person, the defence is strong even when a tree has failed. Where there are no records at all, the position is weak even when the failure was genuinely unforeseeable.
The absence of a paper trail is, in practice, the liability. This is why arboricultural contractors such as Red Oak Tree Care are increasingly asked for written condition surveys rather than a verbal quote to take a tree down. A quote is a commercial document. A survey is evidence.
What a defensible regime actually looks like
The National Tree Safety Group, whose guidance is widely treated as the reference point in this area, sets out an approach based on proportionality rather than blanket inspection. The core idea is straightforward. Assess trees according to the likelihood that a failure would hit somebody.
A tree in the middle of a fenced field poses a negligible risk to people regardless of its condition. The same tree, in the same condition, standing beside a school gate or a busy loading bay, requires a different level of attention. Zoning a site by target occupancy is the first step, and it is the step that keeps the cost of the whole exercise proportionate.
For most commercial sites, a workable regime looks like this. An informal walkover by a member of staff who has been briefed on the obvious warning signs, carried out a few times a year and particularly after severe weather. A formal inspection by a qualified arboriculturalist at intervals determined by the risk zoning, typically somewhere between one and five years. A written record of both, retained.
The warning signs a non specialist can be trained to spot are not subtle. Fungal fruiting bodies at the base or on the stem. Cracks or splits in major limbs. Cavities and decay pockets. Soil heaving or lifting on one side of the root plate. Sudden leaf loss out of season. A distinct lean that was not there last year. None of these confirms a tree is dangerous. All of them justify a call to someone who can tell you.
The insurance dimension people forget
There is a second financial exposure that has nothing to do with falling branches.
Across much of southern England, and particularly on the shrinkable clay soils that run through Surrey and the surrounding counties, tree roots are implicated in a significant share of subsidence claims. Clay expands when wet and contracts when dry. A large tree drawing moisture from beneath a shallow foundation during a dry summer can cause differential movement in a building, and the resulting cracking is expensive to remediate.
Where a claim is made against a neighbouring landowner whose tree is alleged to be the cause, the question of whether that landowner knew, or ought to have known, about the risk becomes central. Insurers examine tree management records. A business that has been actively managing its trees, with crown reductions carried out at appropriate intervals and documented, is in a materially better position than one that has left everything to grow unchecked for twenty years.
The inverse problem also exists. Remove a mature tree that has been drying out clay soil for decades, and the ground can rehydrate and heave, lifting foundations upward. This is why the reflexive answer to a tree near a building is not always to fell it, and why the decision should not be made by whoever happens to be holding the chainsaw.
Development sites and the cost of finding out late
For anyone acquiring or developing commercial property, trees carry a distinct category of risk that surfaces at exactly the wrong point in the transaction.
Tree Preservation Orders and conservation area designations restrict what can be done to trees regardless of who owns the land. A protected tree standing where the access road needs to go is a planning problem, a programme problem, and occasionally a deal breaker. Breaching a preservation order is a criminal offence, and sentencing takes account of any financial benefit the offender obtained, which means the calculation that it might be cheaper to fell the tree and pay the fine has been closed off deliberately.
BS 5837, the British Standard covering trees in relation to design, demolition and construction, sets out how an arboricultural impact assessment should be produced and how root protection areas should be calculated. Planning authorities expect to see it. Commissioning that work at the feasibility stage, before the design is fixed, costs a fraction of redesigning around a constraint discovered at planning committee.
Where businesses go wrong
Three failures account for most of the exposure.
The first is treating tree work as a grounds maintenance line item to be awarded on price. The gap in competence between a certificated arboriculturalist and a two person outfit with a chainsaw and a van is enormous, and it is invisible until something goes wrong. Ask for NPTC or equivalent certification covering the specific operations involved, and ask for the public liability certificate rather than accepting an assurance.
The second is failing to keep records. An inspection that happened but was not written down provides no protection whatsoever in a claim.
The third is reacting rather than planning. Emergency tree work carried out after a storm, at short notice, in poor conditions, costs several times what the same work would have cost as a scheduled operation, and it happens at the moment when every contractor in the region is fully booked.
A modest suggestion
Trees are assets. They raise property values, they contribute to biodiversity commitments that increasingly appear in reporting frameworks, and they do things for the experience of a workplace that no amount of interior design achieves. They are also structures that can kill people, and the law treats them accordingly.
Put them on the risk register. Establish who is responsible for them. Get a qualified survey of anything large enough to hurt someone. Keep the paperwork. The cost of doing all of that, for a typical commercial site, is smaller than most organisations spend annually on the coffee machine.


Investment of $18 million from L. Catterton will grow retail, team and brand.

Form 4 D Wave Quantum Inc For: 29 July

Cbiz shareholders will receive $55 per share, a 17.8% premium to the stock’s previous close. The shares rose 17.5% in premarket trade after the announcement.
The deal will make Grant Thornton the fifth-largest provider of professional, tax and advisory services in the US, behind Deloitte, EY, KPMG and PwC. The combined platform will have a presence in more than 20 countries and territories and generate nearly $7.5 billion in revenue.
“By combining our multinational platform with CBIZ’s strong market presence, we’re broadening our ability to support businesses through every stage of growth — from early development to global scale,” Grant Thornton Advisors CEO Jim Peko said.
The transaction is expected to close in the fourth quarter of 2026. It includes a “go-shop” period that allows CBIZ to seek competing offers until August 27.

Goldman Sachs advised CBIZ on the transaction. Deutsche Bank is the lead financial adviser for Grant Thornton Advisors.
Also Read: Vertiv shares crash 14% in pre-market after Q2 revenue misses estimatesDeal overshadows mixed earnings
The acquisition announcement came alongside CBIZ’s second-quarter results, which showed a clear earnings beat but weaker-than-expected revenue.
For the quarter ended June 30, 2026, CBIZ reported adjusted diluted earnings per share of $0.91, above analysts’ estimate of $0.8046. Revenue came in at $682.2 million, about 3.2% below the $704.9 million expected by analysts.
Revenue was down 0.2% from a year earlier, hurt by a similar decline in the company’s core financial services business. Adjusted EBITDA fell 14.3% year-on-year to $103.1 million. Adjusted EBITDA margin narrowed to 15.1% from 17.6%.
On a GAAP basis, net income dropped 55.6% to $18.6 million, or $0.31 per diluted share. The decline reflected higher operating expenses and acquisition-related costs tied to the integration of Marcum, which CBIZ bought in 2024.
The CBIZ deal is another sign of consolidation in the US accounting industry, where mid-tier firms are trying to build scale and narrow the gap with the Big Four.
Baker Tilly and Moss Adams combined last year in a $7 billion deal. CBIZ had also expanded through acquisitions, including its $2.3 billion purchase of accounting firm Marcum in 2024.
Grant Thornton has been expanding since receiving investment from a consortium led by New Mountain Capital in 2024. New Mountain is making a fresh investment to support the CBIZ transaction, which the companies said is the largest deal of its kind in more than 25 years.
Business
Bitcoin Steadies Near $64,000 as Crypto Traders Brace for a Pivotal Federal Reserve Rate Decision Today

Bitcoin traded at $63,860.26 as of Wednesday afternoon, up a modest $13.14, or roughly 0.02%, as cryptocurrency markets settled into a holding pattern ahead of a Federal Reserve interest rate decision that traders across both traditional and digital asset markets have described as unusually difficult to predict.
Bitcoin opened Wednesday at $63,853.49, up 0.2% from Tuesday’s opening price, before climbing as high as $64,244.18 during the morning session, according to pricing data. The cryptocurrency’s relatively flat overall movement Wednesday followed a volatile stretch earlier in the week, including a sharp pullback Tuesday when bitcoin opened 2.5% lower than the previous day, dropping to around $63,327 as investors broadly reduced exposure to riskier assets ahead of the Fed’s two-day policy meeting.
The Federal Reserve’s rate decision, due later Wednesday, has emerged as the dominant catalyst shaping crypto market sentiment this week. According to data from the CME Group’s FedWatch tool, market participants assigned a 35.8% probability to a rate increase following the meeting’s conclusion, up sharply from 25.7% just a week earlier. Separate estimates cited by CoinDesk showed a somewhat different split, with roughly a 70% probability assigned to rates remaining unchanged and a 30% chance of a surprise quarter-point increase. Some analysts have characterized the meeting as among the hardest Fed decisions to forecast in recent years, given the unusual combination of economic signals policymakers are currently weighing.
Ether, the second-largest cryptocurrency by market value, moved somewhat more sharply than bitcoin during the same period. Ethereum opened Wednesday at $1,919.73, up 1.5% from Tuesday’s opening price, before slipping back to $1,904.82 by mid-morning, according to pricing data. Bitcoin and ether moved in opposite directions for stretches of Wednesday’s session, a divergence that market watchers attributed to renewed airstrikes in the Middle East combined with the approaching Fed announcement, both of which have added competing sources of uncertainty for crypto investors this week.
Broader cryptocurrency market data showed modest overall improvement heading into Wednesday. The total global cryptocurrency market capitalization rose 0.4% to reach approximately $2.28 trillion, recovering from a 1.6% decline recorded the previous day, according to data from CoinMarketCap. Bitcoin’s dominance within the broader crypto market held steady at approximately 56.3%, while ether accounted for roughly 10.2% of total market value. Despite the modest recovery in headline prices, a widely tracked measure of investor sentiment, the Fear and Greed Index, remained in “fear” territory at a reading of 28 to 29, reflecting continued caution among traders even as prices stabilized somewhat.
Institutional flows into bitcoin exchange-traded funds showed signs of softening in recent sessions. Spot bitcoin ETFs recorded a net outflow of $11.6 million on July 27, ending a streak of seven consecutive sessions of net inflows, with asset managers BlackRock and Fidelity leading the pullback, according to data on ETF flows. Even so, some corporate treasury activity continued during the same window, with Hyperscale Data disclosing a bitcoin treasury holding of 1,106 bitcoin, valued at approximately $71.7 million, as of July 28, signaling that at least some institutional accumulation of the cryptocurrency has continued despite broader market softness.
Macroeconomic factors beyond the Fed decision have also weighed on crypto sentiment this week. Rising oil prices, driven by renewed hostilities between the United States and Iran, have added to broader inflation concerns across financial markets, a dynamic that traditionally creates headwinds for risk assets including cryptocurrencies. At the same time, a strengthening U.S. dollar has added further pressure, with analysts noting that the combination of higher oil prices and dollar strength has increased overall macro-volatility risk heading into the Fed’s announcement.
Trading data suggested bitcoin has largely oscillated within a defined range in recent sessions, generally trading between roughly $62,700 and $65,500. Some market analysts have pointed to that range as a key technical zone to watch in the near term, with the lower boundary near $62,700 serving as a support level and the $64,500 to $65,500 zone acting as resistance that bitcoin has struggled to convincingly break through in recent trading.
Beyond bitcoin and ether, individual cryptocurrency tokens showed more significant divergence Wednesday. Jupiter, a decentralized finance token, rose nearly 6% to lead gains within a broader recovery among DeFi-focused tokens, while artificial intelligence-linked tokens continued to struggle, with Fetch.ai falling more than 4% on the day as AI-related crypto tokens continued unwinding gains posted the previous month.
Bitcoin’s current price level remains well below its all-time highs reached earlier in the cryptocurrency’s price cycle, though the asset has still posted substantial gains compared with prior years, with its market capitalization standing at approximately $1.27 trillion to $1.33 trillion depending on the specific pricing snapshot used, maintaining its position as by far the largest cryptocurrency by market value, well ahead of ether’s market capitalization of roughly $233 billion.
With the Federal Reserve’s decision expected to be announced later Wednesday, crypto traders and analysts broadly expect increased volatility to follow the announcement, regardless of whether the central bank opts to raise rates, hold steady, or signal a different policy path than markets currently anticipate, given how closely digital asset prices have tracked broader shifts in monetary policy expectations throughout the past several weeks of trading.
The cloud services arm of e-commerce giant Amazon had posted net profit of Rs 23.1 crore in FY25.
Its consolidated revenue from operations grew by about 21 per cent to Rs 20,225.6 crore in FY26 from Rs 16,744.9 crore in FY25.
AWS, however, reported a decline of around 14 per cent in standalone net profit to Rs 242.4 crore in FY26, compared to Rs 281.5 crore in FY25.
The company’s revenue from operations on a standalone basis grew by 21.4 per cent to Rs 20,225.6 crore during the period under review from Rs 16,659 crore in the year-ago period.
“The company’s total expenses for the fiscal were reported at Rs 19,888 crore (on a standalone basis),” Tofler said.
Fidelity Flags October and Bitcoin Bottom as ‘Yardstick’ Hits Historic Lows

Family Reportedly Seeks Social Media Account Data

AI Agent Trading Bot Makes Me 1K Day Trading (Vibe Coding Tutorial)


-

 Fashion5 days ago
Weekend Open Thread: Brooks Brothers
-
 Sports3 days ago
Commonwealth Games boxing: Jadumani Singh seals dominant 5-0 win over Pakistan’s Sumama Rehman to enter quarter-finals | Commonwealth Games News
-

 Tech3 days ago
Intel is reversing course and bringing hyper-threading back to its server chips
-

 Crypto World7 days ago
Ethics, other provisions in crypto Clarity Act to be further discussed
-

 Politics2 days ago
Luke Littler dismantles Gerwyn Price to retain title in Blackpool
-

 Crypto World4 days ago
Ripple bought a bank in pieces. The $4 billion audit
-
 Entertainment5 days ago
A New Post-Apocalyptic Gundam Anime Series Blasts Into SDCC
-

 News Videos3 days ago
BITCOIN JUST ENTERED THIS CRITICAL ZONE…
-

 Politics2 days ago
The Part of the Electric Transition Nobody Wants to Discuss
-

 Sports6 days ago
2026 3M Open leaderboard: Scottie Scheffler finds putter in Round 1, sits three back
-

 Fashion6 days ago
16 Dresses for the High Summer Event
-

 News Videos6 days ago
The Peugeot Family: How 200 Years of an “Old Money” Dynasty Died in A Boardroom
-

 Business16 hours ago
Major shareholder moves on Canyon
-

 Crypto World4 days ago
XRP Ledger adds $2.6B as RWA inflows rank second
-
 Politics3 days ago
Spain sweeps the board at 2026 World Cup with individual awards
-

 Crypto World6 days ago
Uniswap (UNI) pushes deeper into tokenized RWAs with permissioned trading pools
-
 Entertainment1 day ago
‘Stargate’ Creator’s New Sci-Fi Series Returns for Season 3 Tomorrow
-
Crypto World7 days ago
SEC Agrees to Overhaul Recordkeeping After Settling Coinbase Lawsuit Over Gensler’s Lost Texts
-

 Tech5 days ago
Anthropic launches Claude Opus 5, a cheaper AI model for coding, agents and enterprise workflows
-
 Entertainment4 days ago
Sara Gilson Killed By Husband After Viral “Pedophile” TikTok Video
You must be logged in to post a comment Login