
Crypto World
Singapore bank DBS to offer tokenized gold to retail customers


Crypto-friendly DBS Bank said it will start offering tokenized gold trading to its retail customers in the second half of 2026.
DBS said it will list the product, called DBS Physical Gold Tokens, on its digibank platform and is also considering making it available on the DBS Digital Exchange (DDEx), which is tailored for accredited investors and institutions.
The bank will tokenize, issue, distribute and manage the physical gold tokens entirely in-house, backed by trusted bank-grade infrastructure. Each token is backed by 1 gram of physical gold held by DBS in a dedicated vault in Singapore, the bank said in a statement.
The move builds on a growing trend towards blockchain-based versions of real world assets (RWAs). The size of physical gold holdings in the portfolios of wealthy clients of DBS has more than doubled over the past three years.
In 2025, DBS tokenized structured notes on Ethereum and listed sgBENJI, the token of Franklin Templeton’s tokenized money market fund, alongside the Ripple’s RLUSD dollar-pegged stablecoin.
“While our retail investors have been able to buy gold funds, access to physical gold has been largely available to only institutional and accredited investors,” said James Tan, the head of DBS’ investment product and advisory unit. “DBS has offered physical gold investments to wealth clients since 2013, and we are now leveraging tokenisation to broaden access, enabling more retail customers to invest in gold in a safe and meaningful way.”


David Schwartz, an XRP Ledger co creator and current Ripple board member, proposed a Bitcoin inheritance setup on Aug. 3 that separates access to duplicate hardware wallets from the PIN needed to unlock them.
Summary
- David Schwartz proposed giving two duplicate Bitcoin wallets and their shared PIN to separate people.
- The setup uses one seed across devices, so it remains a single signature wallet structure.
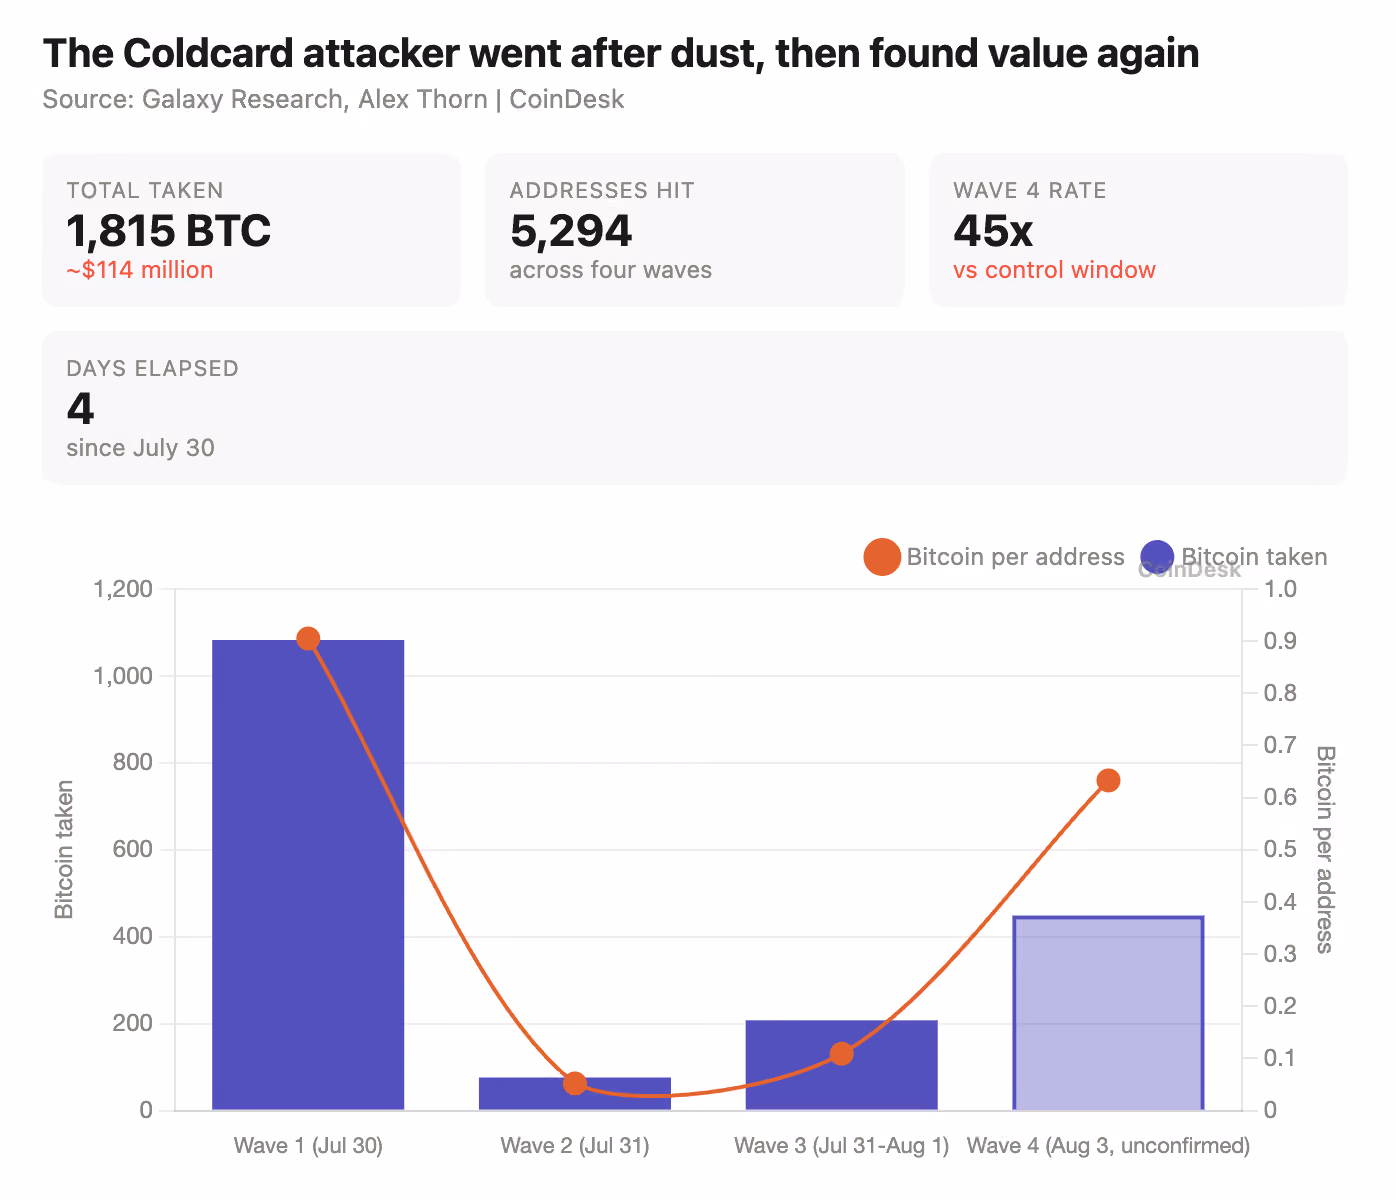
- Four suspected Coldcard waves moved about 1815 BTC from more than five thousand addresses overall.
- Coinkite says fixed firmware protects new seeds but cannot repair phrases generated on affected devices.
- Multisignature inheritance systems require separate keys, unlike duplicate devices sharing one recovery phrase between them.
His post followed a renewed debate over paper backups after the Coldcard firmware failure. Ripple identifies Schwartz as an original XRP Ledger architect, while its current leadership page lists him as a board member.
Schwartz described the idea as “one way” to handle inheritance, not as a finished product or guaranteed security model. He suggested loading the same 24 word recovery phrase onto two additional cold wallets, setting the same PIN on both, giving one device to each of two relatives, and sharing the PIN with two trusted friends who would disclose it after the owner’s death. The post did not name a wallet model or use the “nuclear briefcase” label.
How the Bitcoin inheritance plan would work
The proposed setup creates two physical copies of the same wallet. Each relative would hold a signing device but lack the PIN. Each friend would know the PIN but hold no device. Under normal conditions, neither group could access the Bitcoin without cooperating with someone from the other group.
Schwartz’s argument came during a discussion about whether paper backups are simpler than hardware wallets. Paper avoids firmware exposure, but it remains vulnerable to theft, fire and accidental destruction. Bitcoin Design notes that metal backups offer greater physical durability, while hardware wallets isolate recovery phrases and private keys from connected devices.
Meanwhile, the arrangement does not create a multisignature wallet. Both devices contain the same recovery phrase, so each represents the same signing authority. One relative and one friend could therefore gain full control together. A leaked PIN paired with a stolen device could create the same result.
True multisignature systems use separate keys and require more than one signature before funds move. Unchained describes a common two of three structure where one compromised key cannot spend the Bitcoin alone. Schwartz’s proposal instead divides one complete credential into a physical component and a knowledge component.
Coldcard losses make seed quality the central risk
The debate follows a Coldcard flaw that weakened randomness during seed generation on affected firmware. Coinkite has released corrected versions, but updating firmware cannot repair an earlier recovery phrase. Affected users must create a new seed and move their Bitcoin. Coinkite says sufficient private dice entropy or a strong passphrase may provide additional protection in some cases.
Block’s security team traced the issue to a deterministic software fallback and limited reseeding process. It cautioned that it had “not done full empirical testing to confirm exploitability,” while reporting that active theft was underway. The findings show why copying a wallet is safe only when the original seed was generated securely.
As crypto.news reported, a fourth suspected attack wave moved 448.7 BTC from 709 possible victim addresses. Four observed waves may total about 1,815.75 BTC across 5,294 addresses if there is no overlap. Those figures remain onchain estimates rather than losses confirmed by every wallet owner, Coinkite or law enforcement.
A complete inheritance plan needs legal steps
Schwartz’s outline addresses access, but inheritance also requires clear instructions, legal ownership records and a process that heirs can execute under stress. Unchained advises documenting the security model and ensuring an executor or trustee understands how to use the relevant keys. In related coverage, crypto.news noted that self custody can leave assets permanently inaccessible when owners fail to prepare heirs.
The setup also depends on relatives and friends remaining reachable, trustworthy and capable of coordinating. Device failure, forgotten PINs, disputes or premature disclosure could still disrupt the transfer. The claim that heirs are “guaranteed” to receive the funds would therefore be too strong.
Schwartz’s post did not announce a commercial service, audit or formal technical specification. Independent review would need to compare the approach with multisignature wallets, time based controls and professional estate planning. Any recovery process should also be tested with a small balance before it is trusted with long term Bitcoin savings.
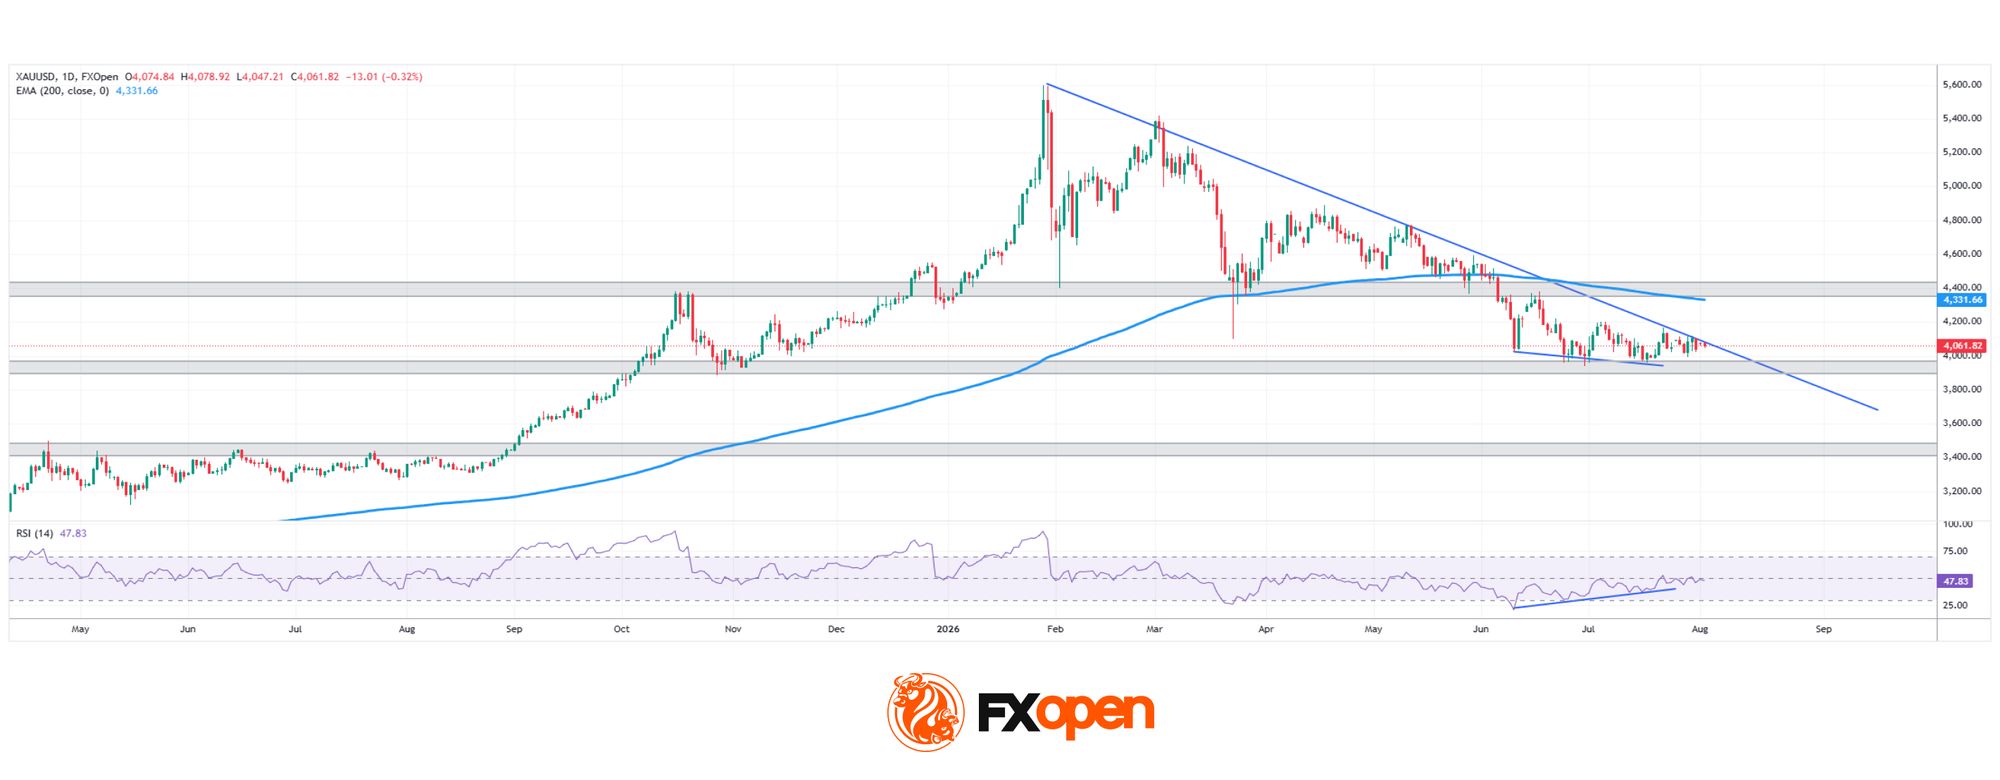
Gold has had a rough year. After hitting an all-time high near $5,602 in January, the metal has since dropped roughly 27% from that peak, weighed down by rising Treasury yields, a firmer dollar, and cooling demand for safe-haven assets.
This week brought a fresh twist. Gold climbed back above $4,050 on Monday after President Trump signaled that peace talks with Iran would resume, following pressure from regional allies like Saudi Arabia to pause military strikes. The news pushed oil prices lower and eased inflation fears, but it also reduced some of the safe-haven demand that had been supporting gold.
Despite the sharp correction, most analysts still expect gold’s long-term uptrend to eventually reassert itself. In the near term, though, all eyes are on Friday’s US jobs report, the week’s key catalyst: a weak print could revive rate-cut expectations and give gold fresh support, while a strong one could extend the current pullback.
Technical Analysis of XAU/USD Chart

As the XAU/USD chart shows, gold remains locked in a broader downtrend since January’s record high, currently testing the descending trendline from below while holding just above the 3,900-4,000 support zone.
Bullish Scenario
Gold has already shown signs of life bouncing from the 3,900-4,000 support, and the RSI divergence lends some credibility to this reaction. Should price break decisively above the descending trendline, the next real test becomes the 4,400 resistance zone, where the 200-period EMA also converges—a level that has proven highly significant over recent months. A confirmed break above this confluence would mark a meaningful shift in gold’s broader structure.
Bearish Scenario
Should gold instead reject the trendline once again, price risks getting trapped between resistance above and support below. In that scenario, Friday’s NFP report looms as a potential catalyst: a strong print could tip the balance, breaking the 3,900-4,000 support and opening the path toward the next meaningful level, the former resistance-turned-support zone at 3,400-3,500.
With price squeezed between a stubborn trendline and a battle-tested support, and a major data release just days away, gold’s next move could finally answer the question traders have been asking since January’s peak: is the correction over, or just catching its breath?
Start trading commodity CFDs with tight spreads (additional fees may apply). Open your trading account now or learn more about trading commodity CFDs with FXOpen.
This article represents the opinion of the Companies operating under the FXOpen brand only. It is not to be construed as an offer, solicitation, or recommendation with respect to products and services provided by the Companies operating under the FXOpen brand, nor is it to be considered financial advice.


Earlier this year, the U.S. Department of Health and Human Services (HHS) stopped recommending that all children get an annual influenza vaccine. Instead, it made the shot a matter of “shared clinical decision-making”—something for parents and a doctor to weigh case by case—citing, among other reasons, a lack of randomized controlled trials proving the vaccine’s efficacy in children, including the very young.
After a lawsuit from public health organizations, a federal court blocked it, leaving the previous recommendation in place. But the case is ongoing, and earlier this year President Donald Trump issued an executive order directing the government to treat a recent HHS assessment as a “guiding resource” and to revisit the childhood vaccine schedule. That assessment argues that recent evidence behind annual flu shots for children, much of it from observational studies rather than randomized trials, is thin. While we believe that the evidence base, which in fact includes many clinical trials, is stronger than suggested by that assessment, it is correct to note that observational studies of annual flu shots suffer from various statistical biases.
In a new study published this summer, we showed one way that vaccine efficacy can be reliably measured each season using data we already collect, minimizing statistical bias without running a randomized trial at all. In principle, it’s a measurement that could be repeated every year.
Randomized trials have earned their reputation as the “gold standard” because they address a real statistical problem. When we simply compare children who got the flu shot with those who didn’t, for example, the two groups can differ in ways that have nothing to do with the vaccine, like how cautious their parents are or how often they visit a doctor. A randomized trial solves this by assigning the shot purely by chance, so the only way the groups differ is in whether they got a flu shot.
But randomized trials are not the only place to find randomized data. Sometimes the world randomizes people for us by accident.
Young children tend to have their annual checkup around their birthday, and that visit is a convenient moment for a flu shot if the vaccine happens to be available in the pediatrician’s office. Children with fall birthdays, who tend to see their pediatrician in the fall, just as the season’s vaccine arrives, can get it then and there. Children with summer birthdays have to make a separate trip, which many families never get around to doing. And birth month is essentially random when it comes to the flu; there is no biological reason a child born in October should need a flu shot more than a child born in June.
This lottery has real consequences. In a prior study, we showed that among children aged two to five, those with fall birthdays are more likely to be vaccinated, less likely to be diagnosed with the flu, and less likely to have a family member catch it than children with summer birthdays.
For this new study, we took advantage of this same randomization, but this time we used it to estimate how effective the vaccine was in each of five recent flu seasons, tracking vaccination and influenza rates among two- to five-year-olds with fall vs. summer birthdays.
In a given flu season, if children with fall birthdays were vaccinated more than children with summer birthdays, but didn’t get the flu less often, it would suggest that the flu shot wasn’t very effective in that season. This could happen if the strains of influenza that the flu shot protected against didn’t end up circulating that season. Alternatively, in a season where children with fall birthdays got vaccinated more and also avoided more flu than the summer-born children, it would tell us the vaccine was effective in that season.
In every season we examined, the vaccine clearly worked as intended: for every 100 children vaccinated because of the timing of their birthday—the children whose shot hinged on that convenient scheduling—there were between 9 and 14 fewer diagnosed cases of influenza, depending on the season.
If children with fall and summer birthdays are truly comparable—as they would be in a randomized trial—we shouldn’t see differences in conditions the flu shot doesn’t prevent. So, we compared their rates of non-influenza infections, like stomach viruses and common colds, and found no difference. That result suggested our flu findings weren’t the result of one group simply seeing the doctor more often, or being more health-conscious than the other.
As helpful as accidental randomization can be, producing what are called “natural experiments” like this one, true randomized controlled trials remain the most rigorous form of evidence. But it is simply not feasible to run a trial to settle every question medicine and public health face each year. Trials are slow, expensive, and logistically challenging. And when it comes to research on existing treatments, they can be unethical, since researchers cannot withhold treatments believed to be effective just to keep proving the point.
If the federal government’s concern is that we lack fresh randomized evidence that a long-established treatment is effective, the solution isn’t to stop the treatment and wait for a trial that may never come. Using the enormous quantity of data the health care system already generates—that is largely sitting idle and unexamined—to its fullest potential is an excellent alternative. Birthdays handed us a natural experiment that, unlike a randomized trial, didn’t require enrolling thousands of patients, spending millions of dollars, or waiting years to complete.
With a bit of creativity and rigorous statistical methods, that evidence can be drawn from the data we already have in the form of natural experiments. The efficacy of flu shots in children is just one of thousands of questions we could answer this way—no new trial required.
The crypto market will welcome tokens worth around $630.2 million in the first week of August 2026. Major projects, including Hyperliquid (HYPE), Succinct (PROVE), and Ethena (ENA), will release significant new token supplies.
These unlocks could introduce market volatility and influence short-term price movements. So, here’s a breakdown of what to watch.
1. Hyperliquid (HYPE)
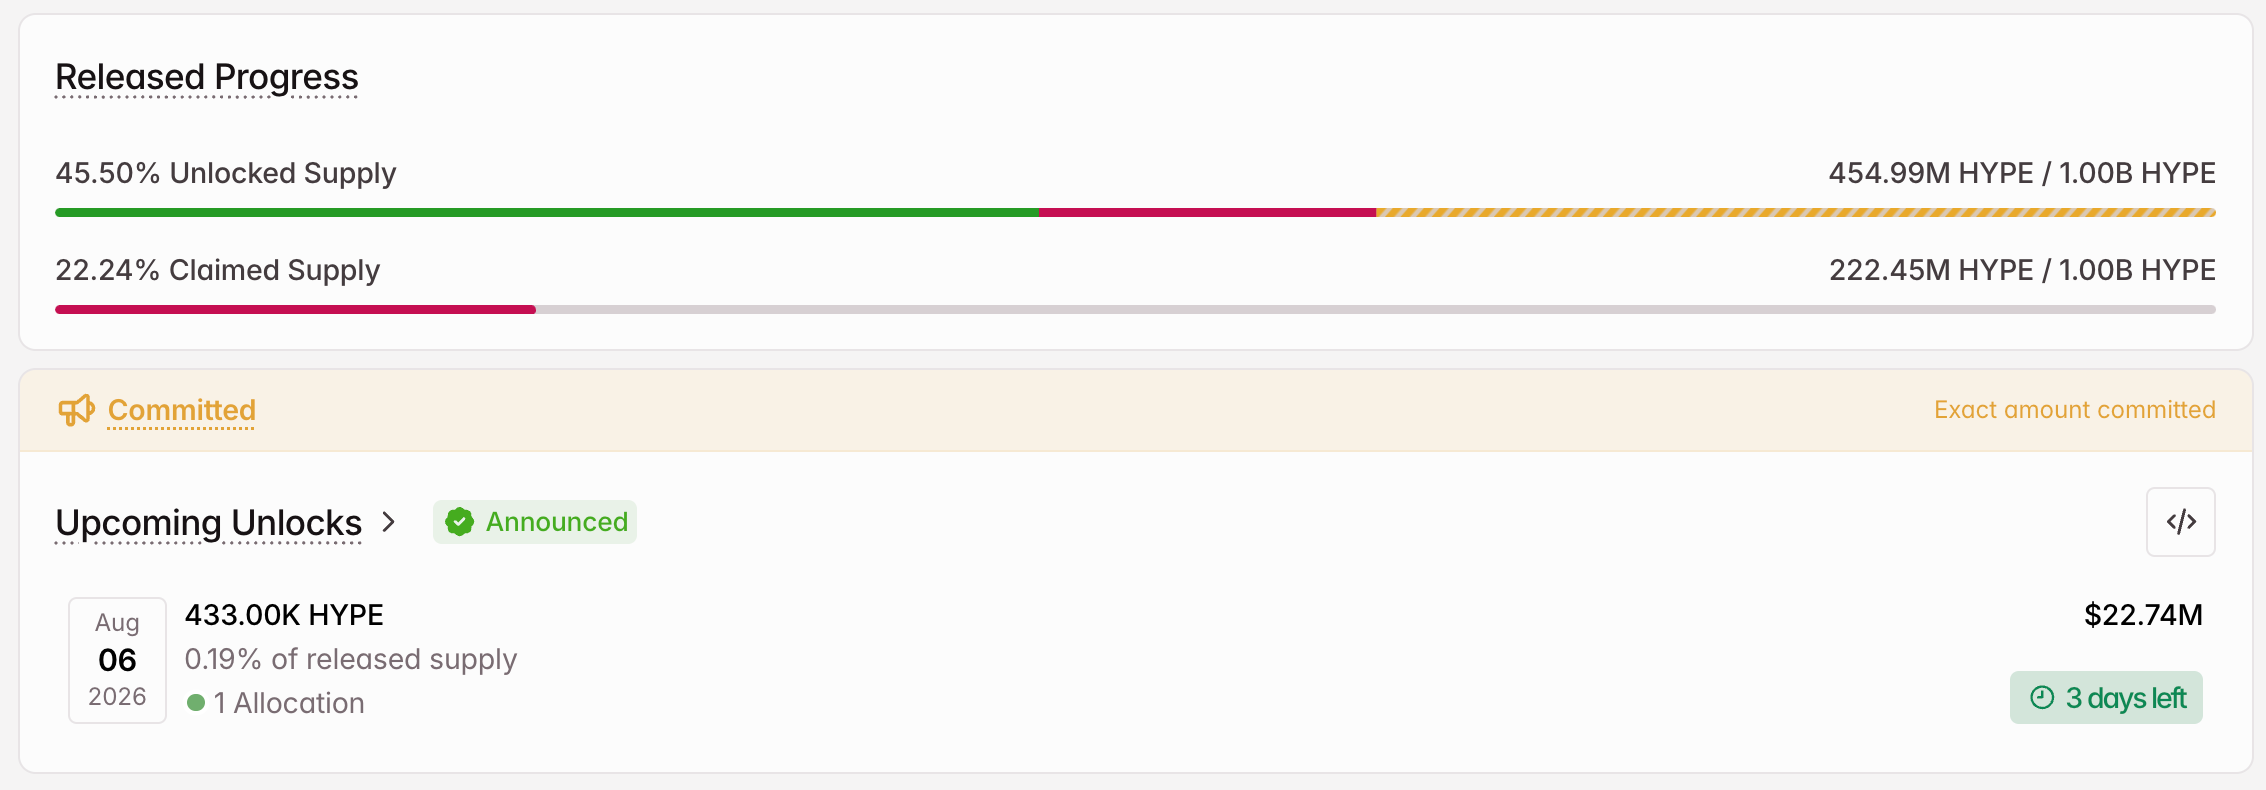
- Unlock Date: August 6
- Number of Tokens to be Unlocked: 433,000 HYPE
- Released Supply: 454.99 million HYPE
- Total Supply: 1 billion HYPE
Hyperliquid is a leading decentralized perpetual futures exchange built on its own Layer-1 blockchain. It offers high-performance trading with low latency, on-chain order books, and sub-second transaction finality.
On August 6, the team will unlock 433,000 HYPE worth $22.74 million. The tokens account for 0.19% of the released supply.

The team has allocated the unlocked supply to core contributors. Tokenomist pointed out that HYPE has historically claimed far fewer tokens than its projected unlock amounts.
2. Succinct (PROVE)
- Unlock Date: August 5
- Number of Tokens to be Unlocked: 208.33 million PROVE
- Released Supply: 200 million PROVE
- Total Supply: 1 billion PROVE
Succinct is a zero-knowledge proof infrastructure project built around SP1, a zkVM that lets developers generate ZK proofs from ordinary Rust code without custom cryptography. The Ethereum-based PROVE token handles payments, staking, and governance.
The team will release 208.33 million tokens on August 5. The tokens are worth $34.7 million. The unlock exceeds the token’s entire released supply, representing 104.17% of tokens currently on the market.

Succinct will split the supply five ways. The network will direct 83.33 million tokens towards the ecosystem and research and development. Contributors and investors will get 73.75 million tokens and 26.25 million tokens, respectively.
In addition, the team will allocate 16.67 million PROVE to public allocation and incentives. Finally, the Succinct Foundation will get 8.33 million tokens.
3. Ethena (ENA)
- Unlock Date: August 5
- Number of Tokens to be Unlocked: 171.88 million ENA
- Released Supply: 8.73 billion ENA
- Total Supply: 15 billion ENA
Ethena is a synthetic dollar protocol built on Ethereum (ETH). The protocol’s flagship product is USDe, a synthetic dollar stablecoin. Furthermore, ENA is the protocol’s governance token.
The team will release 171.88 million ENA tokens on August 5. The tokens, worth $15.36 million, account for 1.97% of the released supply.

Ethena will award the 93.75 million tokens to core contributors. In addition, the investors will receive 78.13 million ENA.
In addition to these three, Opinion (OPN), BounceBit (BB), and Momentum (MMT) will also experience new supply entering the market in the first week of August.
The post 3 Token Unlocks to Watch in the First Week of August 2026 appeared first on BeInCrypto.
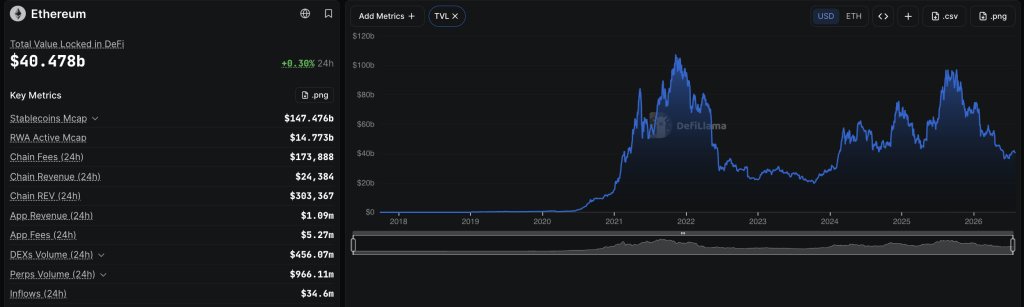
In Ethereum news today, the application layer generated $1.79Bn in fees during Q2 2026; rollups are processing 1,270 user operations per second, and $17.2Bn in real-world assets sit on-chain.
However, the ETH price remains below $2,000, roughly -60% off its all-time high near $4,950 set in August 2025. The network activity is real. The value accrual to the ETH token is not keeping pace, and that gap is now the central structural debate in the Ethereum ecosystem.
On-chain analyst @Tanaka_L2 published a detailed breakdown on July 31 that quantifies the severity of the divergence. Ethereum L1 itself captured only 4.9% of the economic value generated by its application layer in Q2, $88.4M in Real Economic Value.
This came against $1.79Bn flowing through the apps built on top of it. That ratio is the arithmetic explanation for ETH’s underperformance against both its own history and Bitcoin, which has shed roughly 11% year-to-date in 2026 while ETH has dropped by closer to 32%.
The value capture collapse stems from structural issues rather than cyclical ones. Layer 2 rollups are now the primary driver of user activity, with Tanaka’s data showing rollups at around 1,270 UOPS compared to just 20.4 UOPS on the Ethereum mainnet.
Ethereum News: The Blob Fee Era Broke the Burn Thesis

Although this scaling has worked well, the introduction of cheap blob fees to make L2 data posting affordable has diminished the fee pressure that previously led to ETH burn.
As a result, the seven-day blob fee burn was only about 0.22 ETH, which is minimal. With a 0.85% annual supply growth and a 2.6% staking yield, the dynamics supporting the “ultrasound money” concept have stalled. The ETH/BTC ratio reflects this, compressing to multi-year lows as Bitcoin benefits from consistent institutional buying.
This is all while Ethereum faces ETF outflows and lacks a strong demand anchor. Understanding these diverging flows requires analyzing the current rotation of institutional capital across altcoins, where narrative clarity is as crucial as fundamentals.
Discover: The Best Token Presales
Tanaka’s Revised Thesis: Settlement Layer, Not Gas Token
Tanaka argues that the old model of ETH is outdated and proposes a new framework in which ETH serves as reserve capital and the settlement medium for institutional tokenized finance, rather than just a fee-accruing asset. He notes that increased on-chain financial assets will boost demand for ETH as collateral and gas, shifting the demand driver away from retail transactions.
Current data supports this view, with stablecoins on Ethereum valued at about $299.4Bn and RWA tokenization reaching $17.2Bn. Tanaka emphasizes that Ethereum’s strengths lie in institutional liquidity, settlement credibility, and a significant portion of ETH supply being staked, rather than in transaction costs. This evolving thesis is gaining attention among major asset managers, despite ETH’s current price performance.
However, Tanaka highlights three key conditions for price translation: the economic scarcity of L2 throughput-generating fee revenue; active turnover of stablecoins and RWAs rather than their sitting idle; and institutions holding ETH as a reserve asset rather than merely using the network. None of these conditions has been met at a substantial scale yet.
Trade Ethereum on Bybit and Get a Chance to Win Our $1,000 USDT Airdrop
What Has to Change for ETH to Close the Gap
In other Ethereum news, the forward scenario hinges on a transition from using network activity as a metric to using it as a revenue source for L1. If RWA settlement volumes and stablecoin turnover grow to the point where blob space demand outstrips supply, fee pressure returns to L1 and the burn mechanism reactivates.
That is the path where the current technical scaling investment pays off in token terms. The alternative, sustained high activity with low L1 fees, continues to compress the ETH/BTC ratio and validates the market’s current skepticism about Ethereum’s value accrual mechanics.
ETH’s near-term price action remains constrained by macro sensitivity; ETH carries a higher Nasdaq correlation than Bitcoin, and by the absence of a near-term catalyst that directly addresses the L1 revenue capture problem. Tanaka’s position is that Ethereum is in a deliberate margin-compression phase.
It subsidized cheap execution to build ecosystem scale, and the economic return to L1 has been deferred. Whether that deferral resolves into a structural re-rating or becomes a permanent feature of the modular architecture is the question the market is currently pricing at a significant discount.
Discover: The Best Crypto to Diversify Your Portfolio
The post Ethereum Network Earns $1.79Bn in App Fees, But Captures Less Than 5% appeared first on Cryptonews.


Crypto-friendly trading platform Robinhood (HOOD) is now registered to offer cryptocurrency services in the U.K.
Robinhood’s U.K. arm was added to the Financial Conduct Authority’s (FCA) list of registered cryptoasset companies as of July 31.
The company’s existing FCA registration means it meets the regulator’s requirements where it comes to anti-money laundering (AML). A regime for crypto firms has been in effect since 2020 and now numbers over 50 approved companies, including Ripple, Kraken and traditional finance (TradFi) giants like BlackRock and BNY.
Winning the regulator’s permission to offer crypto services has added significance ahead of the inception of the more comprehensive framework for crypto regulation in the U.K. The authorization process opens at the end of September and closes at the end of February next year, ahead of the full regime coming into force in October.
The relatively brief window for companies to register and obtain full regulatory approval means those firms already registered under the FCA’s existing regime may have done a lot of the heavy lifting in advance.
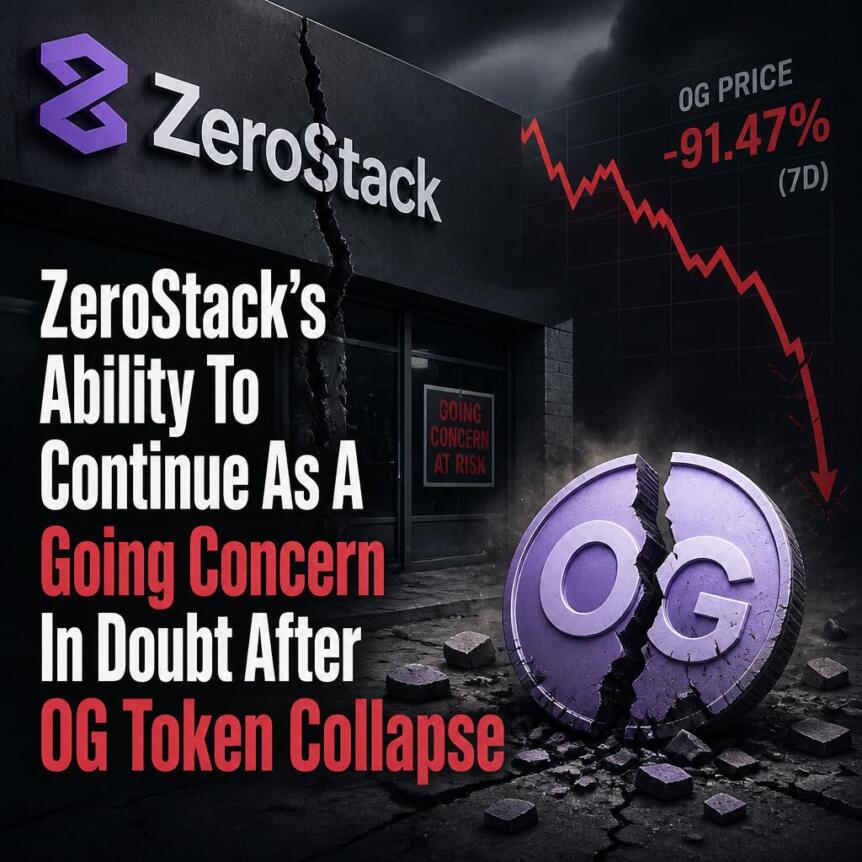
ZeroStack’s plan to fund operations through 0G token reward sales is in jeopardy after a sharp drop in the token’s value. The downturn has also cast doubt on the company’s ability to continue as a going concern.
ZeroStack ended June with a $61.3 million first-half loss, negative working capital, and $2.6 million in cash.
ZeroStack’s Form 10-Q Disclosure
According to its Form 10-Q disclosure for the quarter ending June 30, ZeroStack held $2.6 million in cash, negative working capital of $600,000, an accumulated deficit of $339.1 million, and a $61.3 million net loss. The company also reported an accounting loss of $82.5 million after re-measuring its assets at fair value.
ZeroStack held 75.1 million 0G tokens with a fair value of $15.17 million and a recorded cost of $163.33 million. It also held a small Bitcoin (BTC) position, taking the total fair value of ZeroStack’s holdings to $15.21 million and the total recorded value to $163.43 million.
The downturn in the value of ZeroStack’s 0G tokens represents a 90% decline and has cast serious doubts on the company’s financial stability and its ability to continue operations without securing additional funding.
Staking Reward Sales To Fund Operations
ZeroStack received 6.62 million 0G tokens through staking rewards in the first half of 2026, earning $3.78 million in revenue. The company sold 4.94 million 0G tokens for $2.4 million and used $2.47 million in cash for other operational activities. The company plans to monetize staking rewards and fund operations.
It may also sell some of its underlying holdings. ZeroStack stated in its disclosure that the staked tokens are held in company wallets and can be withdrawn when needed. The company also noted that staking rewards could decline or disappear entirely, and that any sale depended on prevailing market conditions and token value.
However, ZeroStack’s strategy could be at risk due to the significant decline in the 0G token’s value. The token is currently trading at $0.14, declining nearly 5% in the past 24 hours.
Investor Confidence Shaken
ZeroStack’s 0G bet and the subsequent decline in the token’s value significantly impact its investors. The downturn could result in further write-downs, affecting stock price and investor confidence.
Investors will closely monitor ZeroStack’s next steps. The company can raise funds through asset sales, a capital raise, or restructuring efforts. However, its current model could fail if the 0G token’s value continues declining.
ZeroStack’s July 20 acquisition of Texas Blocker increased its 0G token holding to 223.77 million, amplifying its exposure to the token’s downturn.
Disclaimer: This article is provided for informational purposes only. It is not offered or intended to be used as legal, tax, investment, financial, or other advice.


HashKey Exchange said it received approval to open client money accounts with JPMorgan, weeks after it launched customer fund accounts with DBS Bank.
The flaw allowing the exploit traces to a March 2021 firmware build that routed seed generation to a predictable software randomizer instead of the chip’s hardware one, leaving the resulting keys reproducible offline by anyone who works out the range. Coldcard manufacturer Coinkite released emergency firmware for every affected model and told users who had generated a seed on the flawed software to move funds to a wallet address made with a fresh one.
Thorn said he had no direct victim report and published his findings on pattern matching alone, choosing speed over confirmation to warn people while the transactions were still unconfirmed.
If it holds, however, the running total across four waves had reached about 1,816 bitcoin, near $114 million, from more than 5,200 addresses since July 30.

Thorn advised users to check funds, move anything off an affected device and bid the fee up.
The pattern covered blocks 960,778 to 960,792, with 218 transactions hitting 462 victim addresses at a rate of about 14 sweeps per block against 0.3 in a pre-incident control window, roughly 45 times normal.
Each of the spent coins that arrived after the Coldcard firmware boundary, and the destinations were fresh addresses with no prior history, one per victim rather than the shared collectors that made the first two waves easy to map.


Disclosure: This article does not represent investment advice. The content and materials featured on this page are for educational purposes only.
Learn how to choose the best crypto payment gateway for businesses by comparing settlement, compliance, integrations, automation, and fees in 2026.
Companies serving international customers, digital-first audiences, or markets with limited card and bank transfer coverage may use crypto payments to fill the gap. A crypto payment gateway allows a business to accept crypto payments without building blockchain infrastructure internally. The provider can generate addresses, monitor confirmations, convert assets, screen transactions, and route settlements. The key question in 2026 is which provider can support the required assets, jurisdictions, settlement model, compliance process, and volume.
What defines the best crypto payment gateway for businesses?
The best crypto payment gateway for businesses depends on how the payment flow is expected to work.
Supported cryptocurrencies determine which assets customers can use, while blockchain coverage determines the available networks. The same stablecoin may operate on several blockchains with different fees and confirmation times.
The next question is what happens after payment. Some businesses retain crypto, while others convert it into stablecoins or fiat. Settlement options and automatic conversion should therefore be reviewed together. Auto-conversion can reduce volatility exposure and manual exchange work, while fiat settlement can simplify accounting and treasury management. However, availability may depend on the provider, jurisdiction, banking partners, and compliance checks.
Businesses must also decide how the gateway will connect with existing systems through an API, hosted checkout, or payment links. An API provides greater control over checkout logic and transaction handling, while hosted checkout reduces development work. Payment links support invoices and direct sales that do not require a conventional online store. Webhooks complement these methods by sending updates when a transaction is confirmed, underpaid, expired, or refunded.
Security and compliance determine whether the gateway fits internal policies. Relevant controls include KYB onboarding, AML screening, access permissions, withdrawal allowlists, transaction monitoring, and audit records. Transaction histories, exports, and reconciliation reports also reduce manual interpretation of blockchain records.
Finally, businesses need to assess reliability and total cost. Uptime and support affect payment continuity, while a headline fee may exclude blockchain charges, conversion fees, payouts, or fiat withdrawals. Providers should therefore be compared across the complete payment and settlement flow.
Comparison of leading crypto payment gateways
| Provider | Best suited for | Supported crypto | API | Fiat settlement | Auto-conversion |
| PassimPay | International digital businesses requiring multi-chain payments, automation, and several collection or payout methods | 74+ | Yes | Yes | Yes |
| CoinGate | Merchants seeking an established checkout ecosystem, major assets, e-commerce plugins, and scheduled settlement | 10+ core assets | Yes | EUR, GBP, and USD | Yes |
| NOWPayments | Projects prioritizing broad asset coverage, flexible integrations, subscriptions, or mass payouts | 350+ | Yes | Available through fiat processing and withdrawal tools | Yes |
| CryptoProcessing by CoinsPaid | Larger organizations requiring managed payment infrastructure, permanent deposit addresses, exchanges, and batch payouts | 20+ | Yes | Crypto-to-fiat exchange and bank withdrawal | Yes |
The table reflects publicly available product information. Exact availability can vary by jurisdiction, asset, network, account type, and onboarding outcome.
PassimPay overview
PassimPay combines payment acceptance, fund management, conversion, and payout tools in one crypto payment solution. The platform supports more than 74 cryptocurrencies across over 18 blockchains and is available in 122 countries.
Businesses can integrate through a Payment API or use Hosted Checkout when a ready-made interface is more suitable. Payment Links support remote billing, while Static Deposit Wallets provide reusable addresses for account-based deposits. Webhooks connect transaction events with merchant systems.
Beyond incoming payments, Mass Payouts and Batch Transactions support transfers to multiple recipients. Auto Conversion can move received assets into another supported currency, while Fiat Settlement provides an off-ramp for companies that do not want to retain all revenue in crypto. The Merchant Portal includes Transaction History and Reports for tracking and reconciliation.
PassimPay also provides AML Screening, checkout customization, and payment monitoring. It has more than 530 merchants, over 750,000 monthly transactions, more than $4 billion processed, and 99.99% uptime. Fees start at 0.5%, although the final cost depends on the services and transaction flow used.
This feature set suits SaaS, gaming, AI, hosting, e-commerce, and other digital services that need multi-market payments, user deposits, automated updates, conversion, or recurring payouts.
When different providers may fit different business needs
CoinGate may fit companies that value an established merchant ecosystem, e-commerce integrations, core cryptocurrency support, and settlement in major fiat currencies. Its standard plan lists a 1% processing fee and weekly automatic settlement.
NOWPayments may suit projects that prioritize asset breadth. It supports more than 350 cryptocurrencies, API-based payments, subscriptions, payment buttons, custody options, mass payouts, and auto-conversion. Its published service fee is 0.5% for single-currency payments and 1% when conversion is required.
CryptoProcessing by CoinsPaid may fit enterprise-oriented operations that need permanent deposit addresses, payment links, internal exchanges, mass payouts, e-commerce plugins, and crypto-to-fiat withdrawal. Its documentation lists support for more than 20 cryptocurrencies.
PassimPay may fit companies that need multi-chain coverage together with hosted payments, static wallets, automated conversion, fiat settlement, reporting, and payout functions. The final decision depends on the assets, networks, countries, controls, and settlement routes required by the business model.
Conclusion
Selecting the best crypto payment gateway for businesses requires more than comparing supported coins. Companies need to assess integration depth, blockchain coverage, settlement currencies, compliance controls, reporting, uptime, support, and total processing costs.
CoinGate, NOWPayments, CryptoProcessing by CoinsPaid, and PassimPay address different operational priorities. PassimPay stands among the more functionally complete options in this group for international digital businesses requiring multi-chain acceptance, automated fund management, and both collection and payout tools. Still, the appropriate provider is the one that matches the company’s payment flow, risk policy, technical resources, and settlement requirements.
Disclosure: This content is provided by a third party. Neither crypto.news nor the author of this article endorses any product mentioned on this page. Users should conduct their own research before taking any action related to the company.

Richard Tice Under Scrutiny In Commons Sleaze Probe

Fantasy Baseball Week 20 Preview: Two-start pitcher rankings highlight Troy Melton, Logan Henderson

Lava Virat Series Runs Out of Stock as Flipkart Sale Goes Live


-

 Business5 days ago
Why Trees Belong on the Risk Register
-

 Fashion3 days ago
Weekend Open Thread: Wit & Wisdom
-

 Politics3 days ago
Meta enters AI-training agreement with far-right ‘propaganda rag’ Newsmax
-
 Entertainment6 days ago
‘Stargate’ Creator’s New Sci-Fi Series Returns for Season 3 Tomorrow
-

 Politics7 days ago
Luke Littler dismantles Gerwyn Price to retain title in Blackpool
-
 Crypto World2 days ago
MicroStrategy Post-Earnings CLARITY Act Push Could Add New Catalyst for Its Stock
-

 Politics6 days ago
The Part of the Electric Transition Nobody Wants to Discuss
-

 Business5 days ago
Major shareholder moves on Canyon
-

 Crypto World2 days ago
XRP Ledger v3.3.0 brings five institutional features
-

 News Videos4 days ago
Bitcoin Enters the 3rd Stage of the Bear Market
-

 Crypto World5 days ago
Kraken Enables Retail Access to Jersey Mike’s IPO via Tokenized Shares
-

 Tech6 days ago
New macOS Sequoia & Sonoma security updates for older Macs
-

 Politics4 days ago
Luke Littler’s dominance sparks GOAT debate
-

 News Videos6 days ago
Claude: Build Financial Dashboards in Minutes (2026)
-

 Business6 days ago
Johnson & Johnson agrees to $5.5B settlement over talc cancer claims
-

 Sports3 days ago
Seema Kaliramna Wins Discus Throw Bronze, Takes India’s CWG Medals Tally To 17
-

 Crypto World1 day ago
Crypto PAC spending tops $2M in Michigan House race
-

 Business3 days ago
Trump Announces Hamas Disarmament Agreement as Iran Strikes Kuwait Air Base and US Attacks Pause Overnight
-

 Tech5 days ago
Gemini can now summarize the messiest comment threads in Google Docs
-

 Tech1 day ago
ESET tracks rise in malicious AI skills and adaptable malware
You must be logged in to post a comment Login