

Crypto World
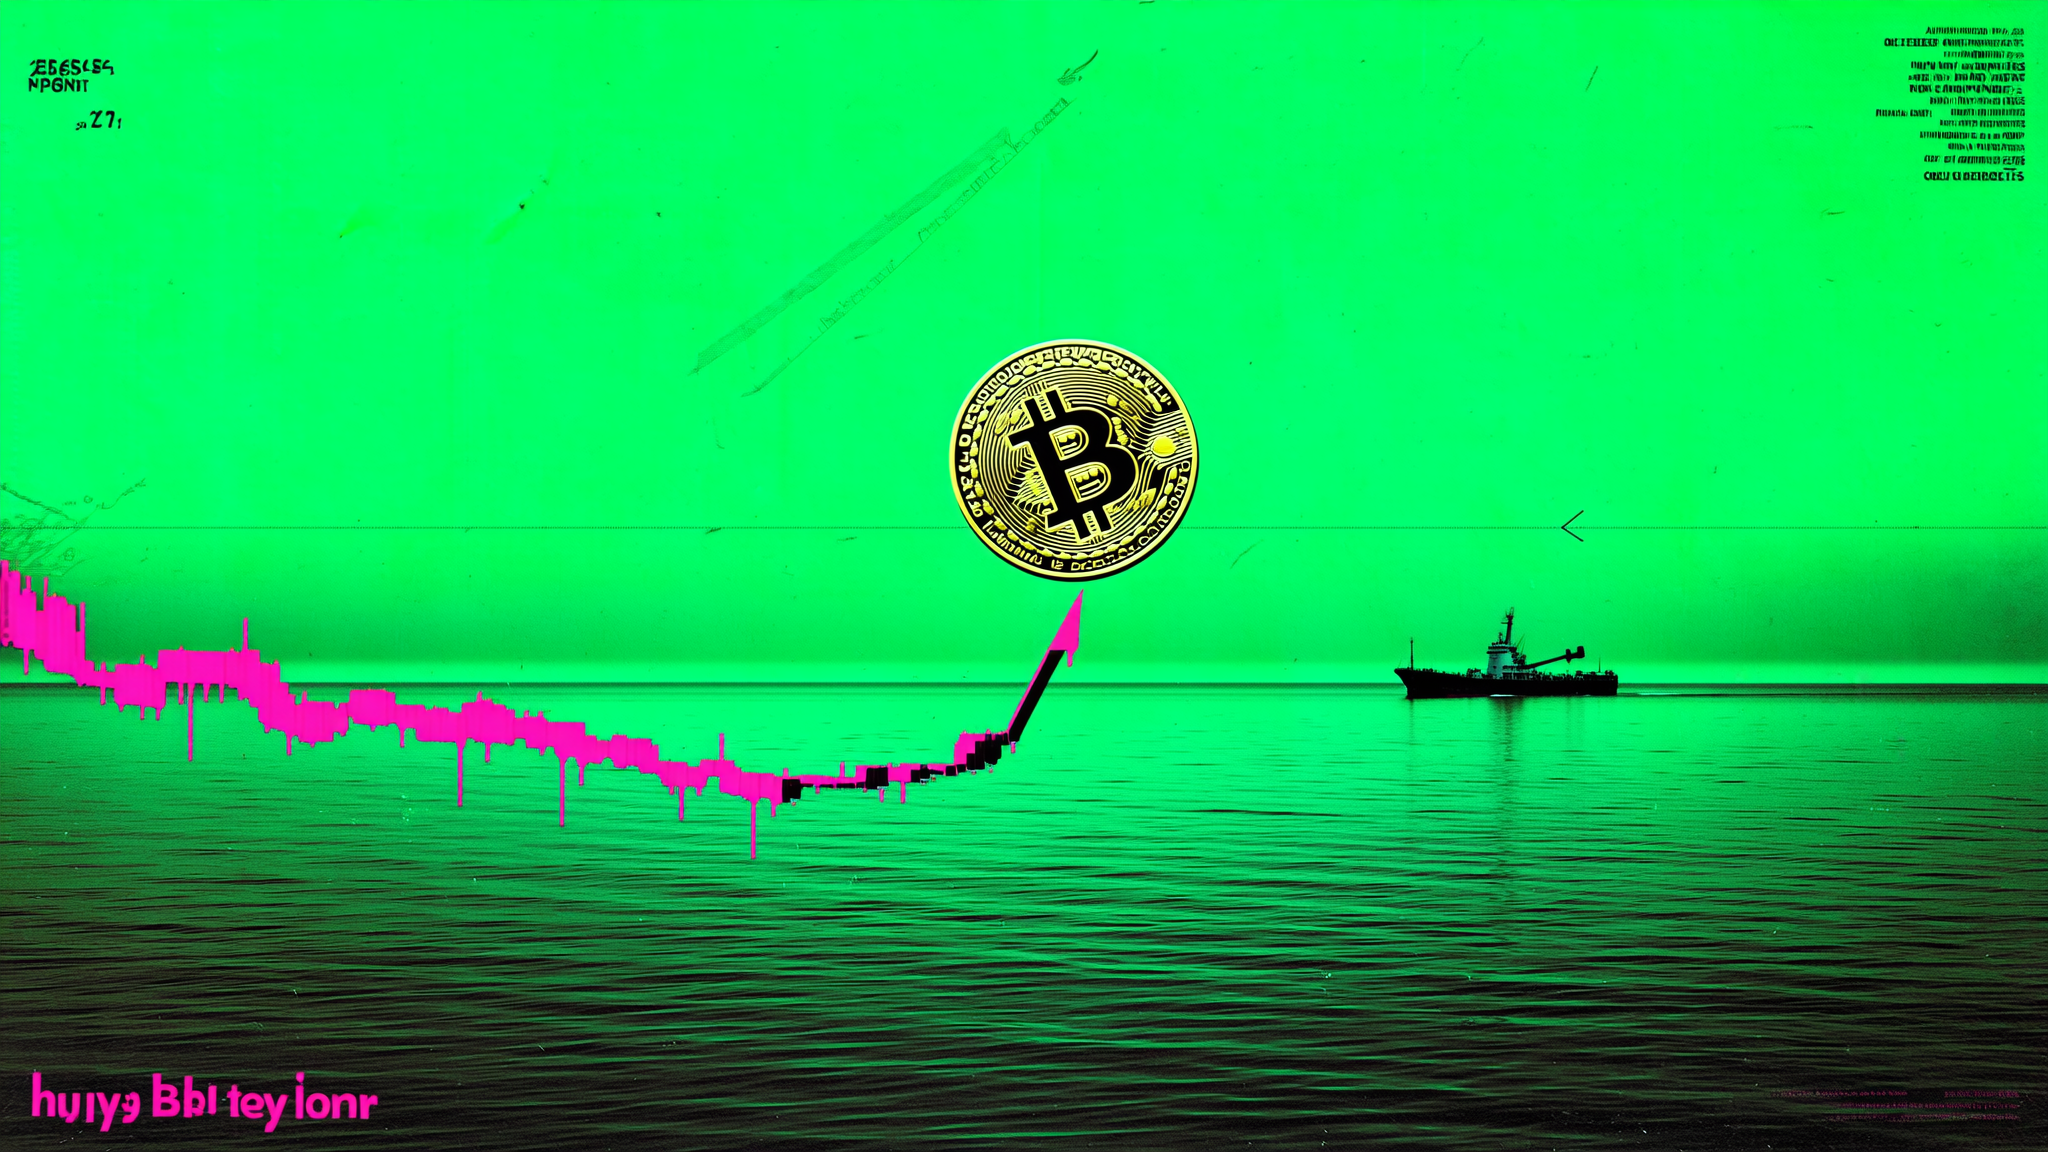
Research Warns Bitcoin’s ‘Calm Top’ May Undercut Market Bottom Estimates
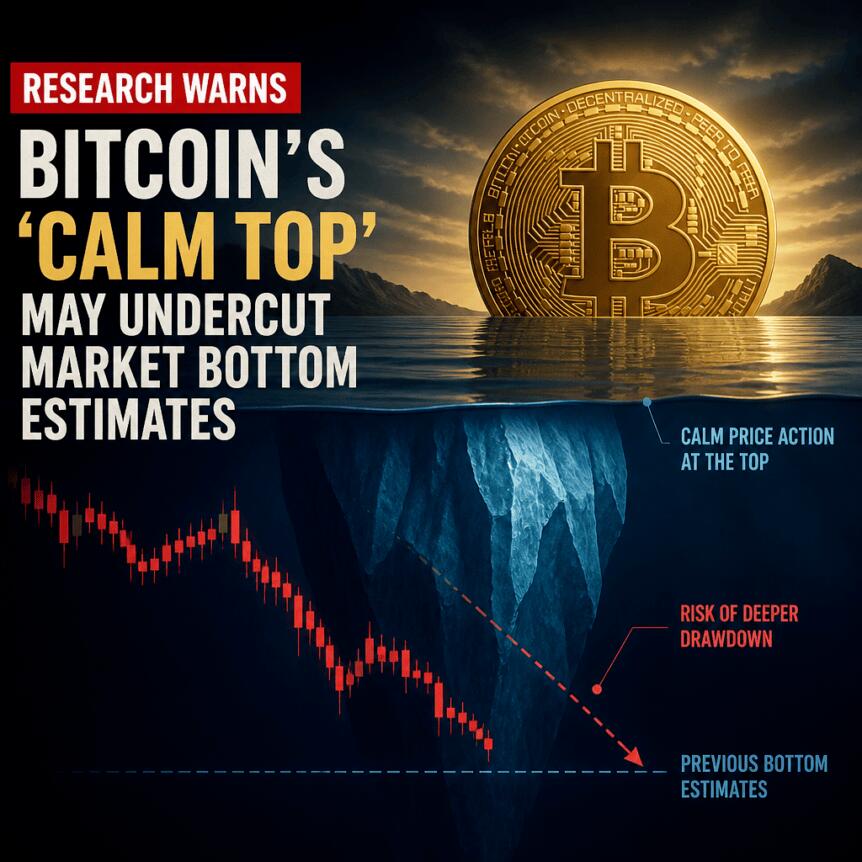
Bitcoin’s next major downside test may not have to sink as far as it did in earlier bear markets, according to a new analysis from Galaxy Digital. The firm argues that the asset’s realized-cost “floor” is currently higher than in previous cycles, implying that a cycle low could form at elevated price levels rather than through the deeper washouts seen historically.
In Galaxy’s base-case framing, the potential bottom sits between $40,000 and $46,000, with a tighter reference point tied to Bitcoin’s realized price at roughly $53,600. Galaxy head of research Alex Thorn also highlights that the current drawdown is still relatively young compared with prior cycle bottoms, while several commonly used bottoming indicators have yet to fully appear.
Key takeaways
- Galaxy Digital says Bitcoin’s “muted” cycle top could keep the network’s cost basis higher than prior bear markets, lifting the implied downside floor.
- The analysis places a base-case bottom range at $40,000 to $46,000, compared with a “washout” scenario of $30,000 to $37,000 and a shallower case near $51,000 to $54,000.
- Thorn estimates the cycle low could arrive sooner than in some prior downturns, as the current selloff is about eight months old versus 12–13 months in earlier cycles.
- CryptoQuant places BTC inside a historical value zone tied to bear-market lows, but demand indicators show a notable contraction.
Why Galaxy believes the downside floor may be higher
Galaxy’s research centers on a concept Thorn describes as “realized price” and the behavior of Bitcoin’s cycle from top to bottom. Thorn analyzed every Bitcoin cycle top and bottom and argues that the four-year rhythm continues to match historical timing closely, even as the magnitude of peak-to-trough declines has narrowed over recent years.
Across cycles, Galaxy notes that the drawdowns have compressed: from roughly mid-80% declines in earlier periods down to 77% in 2022 and around 51% in 2026. The implication is that the market is, so far, experiencing a less severe compression than past bear episodes.
A calmer top, fewer extreme signals
A central part of Thorn’s case is the behavior of the October 2025 cycle top. Galaxy claims that the topping environment was comparatively subdued: only two out of eleven traditional topping indicators triggered, and the Pi Cycle Top indicator reportedly failed to signal for the first time in this cycle framework.
Galaxy also points to MVRV (market value versus realized value), which Thorn says peaked at 2.29—below prior cycles, which ranged from 2.93 to 5.91. Thorn argues that this “calm top” matters because it affects where long-term holders’ cost basis is anchored.
“The key insight: a calm top RAISES the floor. Because October’s top was so muted, the network’s cost basis sits at 43.7% of ATH, vs ~34%, 21%, and 17% in prior cycles.”
Bottom signals are not fully in place
Even if the floor is higher, Galaxy stresses that a bottom is not guaranteed simply because the top appeared muted. The report says several “bottoming signals” are still absent: only four of thirteen indicators have triggered so far, and most of the stronger signals have yet to appear. In other words, the analysis frames current conditions as supportive of a higher landing zone, but not as confirmation that a low is already locked in.
Cycle timing and scenario ranges for the next low
Beyond indicator counts, Galaxy also looks at when prior cycle bottoms formed relative to the market peak. According to the firm’s historical comparison, previous cycle lows typically emerged about 12 to 13 months after the peak. Thorn argues the present drawdown is roughly eight months old, leaving room—based on timing—for a bottom to form ahead of some earlier cycle patterns.
Realized price as an anchor
Thorn’s modeling uses Bitcoin’s current realized price, which Galaxy sets at $53,600. From there, Galaxy outlines three scenario ranges for where a bottom could form:
- Base-case: $40,000 to $46,000
- Washout scenario: $30,000 to $37,000
- Shallower decline case: $51,000 to $54,000
These ranges are designed to reflect different degrees of capitulation and the effect those sell-offs would have on the realized-cost distribution of holders across the network.
What could still move the “floor”
Galaxy’s most important caveat is that the cost-basis floor is reflexive—it can shift if market stress forces holders to transact at losses more broadly than expected. Thorn warns that real panic conditions could lower the implied floor by dragging down the network’s average cost as coins change hands below prior thresholds.
“The catch: the floor can move. cost basis is reflexive. in a real panic, coins change hands at a loss and drag the average down. A 10-30% cost basis decline pulls the implied floor from ~$40k back toward $28k.”
CryptoQuant: BTC near a bear-market value zone, but demand is weakening
Complementing Galaxy’s “realized price” approach, CryptoQuant’s on-chain work argues that Bitcoin is trading within a valuation zone historically associated with major bear-market lows. CryptoQuant’s framing, as reported by the firm’s research, notes that BTC recently traded around $59,000—about 9% above its realized price of $53,600.
CryptoQuant’s historical comparison suggests that prior cycle bottoms, including the November 2022 FTX-linked sell-off, tended to form at or slightly below the realized price. That pattern supports the idea that the eventual low could fall below $53,600 and overlap with Galaxy’s base projection between $46,000 and $40,000.
Demand contraction adds caution
Where CryptoQuant’s data introduces caution is in demand metrics. The firm reports a combined weekly decline of 652,000 BTC across speculative futures demand and apparent spot demand—described as the sharpest contraction since January 2022. It also says its one-year demand gauge has turned negative, indicating fewer BTC buyers than in the prior year.
This matters because the market can remain anchored near a value zone while still lacking the incremental bid needed to quickly reverse the downtrend. In practical terms, weaker demand can prolong the search for a bottom even if valuation levels look historically “cheap.”
What investors and traders should watch next
Galaxy’s analysis suggests a comparatively higher realized-cost floor and a path to a cycle low that may arrive before the deepest historical washouts—but both Galaxy and CryptoQuant emphasize that key signals are still incomplete and demand has cooled sharply. For the next leg of clarity, readers should focus on whether additional bottoming indicators trigger on the same timeframe that network valuation stabilizes, and whether BTC’s demand profile starts to recover as price tests the realized-cost bands.

Crypto World
SpaceX IPO leaves retail investors with too few shares and a tough hold-or-sell decision

Billboards in Times Square celebrate the SpaceX IPO debut at the Nasdaq on June 12th, 2026.
Adam Jeffery | CNBC
Retail investors who clamored for shares in SpaceX‘s blockbuster initial public offering received only a fraction of what many had requested, and are already split on what to do with the stock.
Across online investing forums, users complained of allocations as small as a single share despite requesting far larger amounts. Those who did receive stock are taking different approaches, with some selling into the company’s market debut while others are holding for the long haul.
Marvin Jung, a 51-year-old investor who requested 1,000 shares through Robinhood and received just 17, opted to quickly sell his stake after trading began.
“I have exited my position of SpaceX stock at $160,” Jung said. “It’s struggling too much and can’t find its footing. I’ll continue to watch and return in about six months when the lockup period is over.”
SpaceX shares rose another 6% on Monday, extending gains after the company’s record-breaking Nasdaq debut. The stock surged 19% on Friday to close around $161, up from its IPO price of $135 a share, lifting the company’s market value above $2 trillion.

SpaceX since IPO
Ross Cameron, 41, founder of trading education platform Warrior Trading, also came away with far fewer shares than he sought. He initially requested 2,500 shares through Schwab before increasing the order to 4,250 shares ahead of the deadline. He ultimately received 147 shares at the IPO price of $135.
“I would’ve liked to have gotten more shares filled because it would’ve increased my total profit, but I understand the demand was very high,” Cameron said. “My plan is to hold the shares unless they break $150, and take profit if they get closer to $200 a share.”
Cameron is also cautious about the months ahead, expecting a wave of selling pressure once lockup restrictions expire and additional shares become available for trading.
“I still think that the next six months will create a wave of selling due to the lockup expiration period,” Cameron said. “I don’t think there will be enough buying to support the current prices when those shares come onto the market.”
Most subscribed offering
The demand was intense across brokerage platforms. SoFi Technologies said SpaceX was “the largest and most subscribed offering” on its platform to date, adding that all qualified investors who requested shares received an allocation. Even so, many retail investors reported receiving only a fraction of the stock they requested.
Fidelity was also able to allocate shares to all eligible customers who sought to participate in the IPO, according to a source familiar with the matter, though some clients received fewer shares than requested given the SpaceX IPO demand was high relative to the available supply.
Others are taking a longer-term view. Helaine Markham, co-owner of Markham Trading, received all two shares she requested in the IPO and intends to hold the stock.
Markham said she has not added to her position because she views SpaceX’s valuation as “aggressive” and expects additional volatility as lockup restrictions expire and more shares become available for trading. She plans to wait for further price discovery before potentially increasing her stake.
The mixed reactions highlight the challenge facing investors trying to value one of the market’s most closely watched companies. While some see SpaceX as a rare long-term opportunity tied to the growth of Starlink and commercial space exploration, others are wary of the company’s now $2 trillion valuation and are choosing to take profits early.
Symbolic one-share allocations
Justin Sacco, founder of Sacco Financial, received 11 shares through Charles Schwab after requesting 75. Rather than sell, Sacco added to his position after the stock started trading, purchasing four additional shares in the open market and bringing his total holdings to 15 shares.
“I was certainly hoping to receive more than 11 shares after requesting 75,” Sacco said. “At the same time, considering the unprecedented demand for the IPO, I wasn’t shocked by the outcome. The fact that I received a meaningful allocation at all felt like a win.”
Sacco said he plans to hold these shares long term even though he has grown concerned about the lofty valuation.
Sacco’s experience was relatively fortunate compared with some retail investors. On Reddit’s WallStreetBets forum, users posted screenshots showing allocations of just a single share despite requesting hundreds or even thousands. Others joked that the tiny allocations amounted to little more than a souvenir from one of the most anticipated IPOs in recent memory.
CNBC has reached out to Robinhood, ETrade, Schwab for comment on retail allocation.

Crypto World
Warren Buffett AI Agent (WarrenAI) Predicts Incredible Bitcoin Price by The End of 2026

The number that stands out from Warren AI Bitcoin price predicts is not $140,000 or even $200,000. It is $50,000 to $55,000, because that is the bear case floor, and the fact that it frames that level as resilience rather than disaster tells you everything about how it views Bitcoin’s current position in the market cycle.
With BTC at $66,500, the downside scenario is a 17% to 25% pullback. The upside scenario is a 2x to 3x. That asymmetry is the whole argument.
The bull thesis runs on 3 converging forces. The post-halving supply cycle is still playing out, institutional infrastructure keeps deepening with every ETF filing and corporate treasury allocation, and macro conditions that are currently a headwind eventually rotate back to favoring scarce hard assets.
Warren AI is not predicting when those catalysts converge; it is predicting that when they do, the market cap math gets interesting fast.
A $140,000 to $200,000 Bitcoin implies a $3T to $4T market cap, which sounds aggressive until you remember gold alone sits north of $20T.
The bear case earns its place too. Higher-for-longer rates, tighter regulation, and a wave of crypto deleveraging could all conspire to push BTC back into the $50,000 to $55,000 band.
But the word choice is deliberate, resilient floor, not breakdown, not capitulation. Even Warren AI’s pessimistic scenario is framed as a buying opportunity rather than a trend change.

Bitcoin Price Prediction: The Bounce That Could Change Everything
What makes this moment interesting on the chart is that BTC just did something it has not done convincingly in months. It bounced.
Price sits at $66,572 after printing a low near $60,000 earlier this month, and that recovery candle off the June low is the first real sign of demand stepping in at a structurally meaningful level.
The $60,000 to $62,000 zone has now been tested twice this year, held twice, and rejected sellers both times. That is not a coincidence; it is the market telling you where the buyers live.
The overhead picture is less comfortable. Every recovery attempt since the $126,000 peak has rolled over, and the $70,000 to $72,000 region is now loaded with trapped longs from the May selloff who will be looking to exit.
Getting through that supply pocket cleanly is the real test before any conversation about $80,000 or beyond becomes credible.
The RSI is the most compelling piece of this right now. It is reading 44.87 with the signal line way down at 27.16, a gap of nearly 18 points.
That is not a small divergence. RSI spent weeks pinned in the oversold basement while price ground lower, and now it has ripped back through its average with serious velocity.
That kind of momentum recovery, especially when it leads price rather than follows it, tends to precede sustained bounces rather than fakeouts.
It does not guarantee the $140,000 case plays out, but it strongly suggests the $60,000 low is more likely a launchpad than a waystation on the way to $50,000. Warren AI’s end-of-year target starts with surviving this zone, and right now, the chart says the bulls are doing exactly that.
You Might Like What Warren AI Predicts About LiquidChain
The money that wins cycles never announces where it is going.
Large caps are not broken. They are out of the room. Bitcoin, Ethereum, and XRP have been testing the same ceilings for weeks. Every macro catalyst has a new arrival date. Every institutional wave has a new quarter attached. Waiting on someone else’s decision is not a trade. It is a waiting room.
Capital that understands cycles moves before the destination has a name.
Small market cap infrastructure plays operate on physics large caps cannot replicate. A rotation that vanishes as noise at Bitcoin’s scale reprices an undiscovered project by multiples. The opportunity exists in the gap between what something is genuinely worth and what the market has assigned it. That gap closes permanently the moment discovery happens.
Multi-chain fragmentation has never been solved. Bitcoin, Ethereum, and Solana exist as completely isolated systems with no shared architecture and no native interoperability. Every time value crosses those boundaries it pays for that in fees, slippage, and failed transactions. Every single time.
Warren AI predicts LiquidChain makes that crossing free. All 3 networks inside one execution environment. Single deployment. Complete ecosystem access. No tax on any interaction.
The presale is at $0.01454 with just over $830,000 raised. Early and undiscovered.
Execution is unproven. Adoption is unknown. Established assets offer predictability toward a ceiling the market already sees. LiquidChain is an entry point that disappears once the market finds it.
Explore the LiquidChain Presale
The post Warren Buffett AI Agent (WarrenAI) Predicts Incredible Bitcoin Price by The End of 2026 appeared first on Cryptonews.
Bitcoin has staged a notable recovery over the past few days after a sharp correction drove the asset toward a major demand zone around $60K.
The rebound appears to have been fueled in part by improving macro sentiment following the preliminary peace agreement between the U.S. and Iran, which significantly reduced geopolitical uncertainty and boosted risk appetite across global markets.
The easing of tensions triggered a broad rally in risk assets while supporting Bitcoin’s recovery from recent lows.
Bitcoin Price Analysis: The Daily Chart
On the daily timeframe, BTC remains within a broader corrective structure despite the recent bounce from the $60K psychological support zone.
This area once again attracted substantial demand, producing a strong reaction and allowing buyers to regain some control in recent sessions. However, Bitcoin is now approaching its first significant resistance cluster around $65K-$67K, which previously acted as support before turning into supply following the breakdown.
The current rebound appears constructive, but the broader structure remains bearish in the short term. BTC continues to trade below the broken channel and beneath the major resistance region around $72K-$74K. As a result, the ongoing move could still be interpreted as a relief rally unless buyers manage to reclaim higher supply levels.
Should Bitcoin face rejection from the current $65K-$67K supply zone, another corrective move toward the $62K support area remains a realistic scenario. Conversely, a successful breakout above this region would expose the next resistance zone around $72K-$74K.
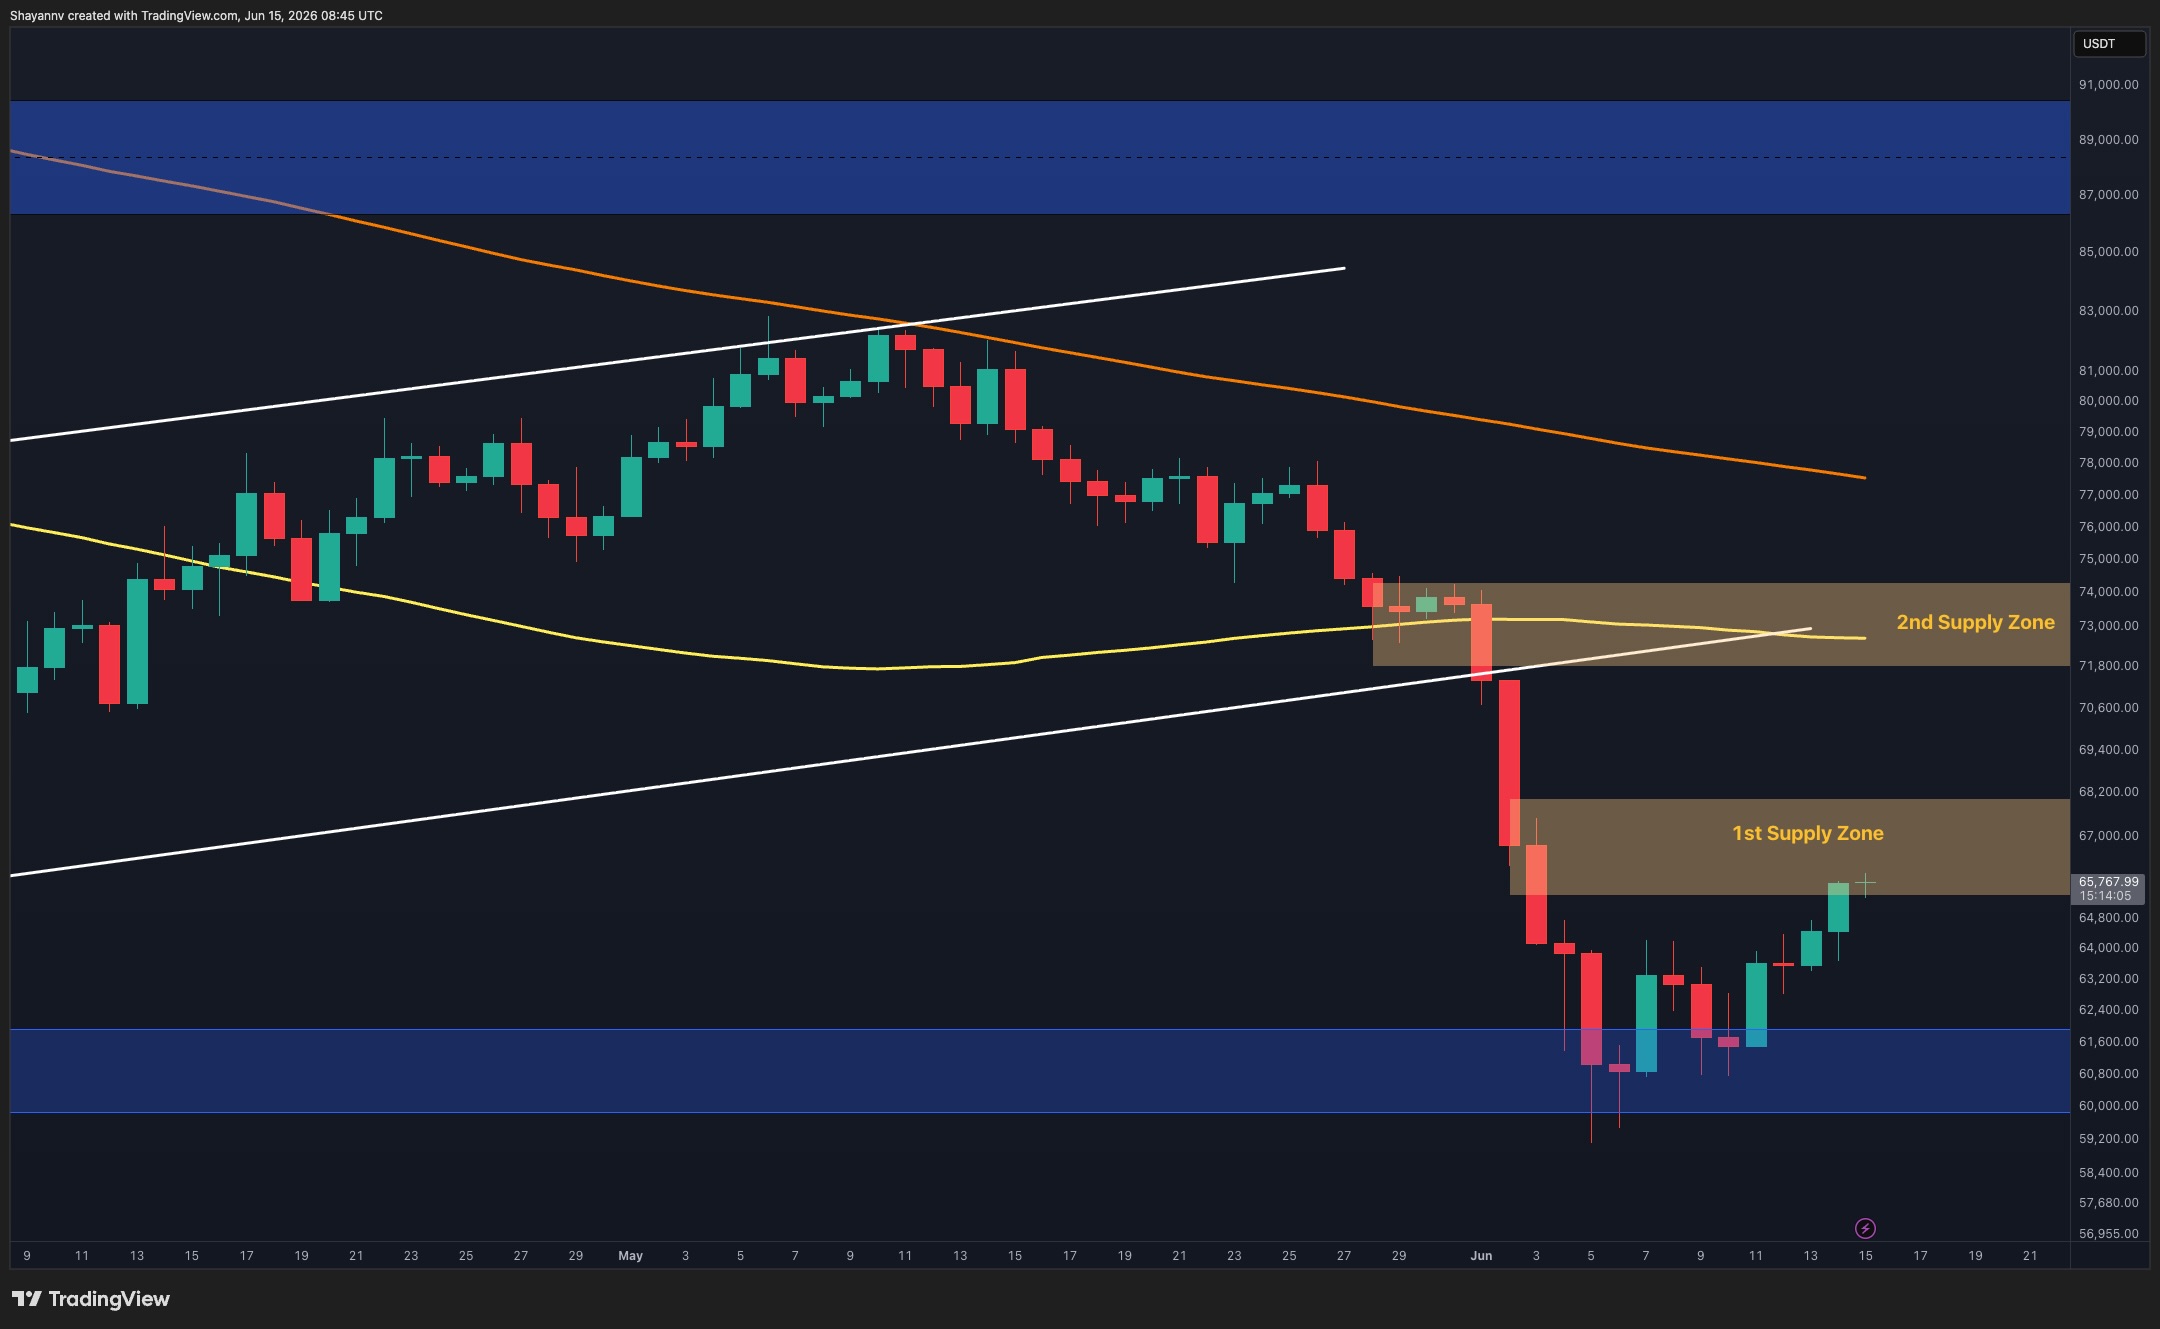
BTC/USDT 4-Hour Chart
The 4-hour chart reveals that Bitcoin has recovered steadily from the recent bottom near $60K, forming a rising wedge/flag pattern while climbing from the lower boundary of the demand zone.
The latest surge has pushed the asset directly into the first supply zone between roughly $65.5K and $68K. This area represents the most important short-term obstacle for bulls, as it coincides with a previous consolidation range that eventually triggered the sharp breakdown.
Although momentum has improved considerably following the geopolitical developments, the market is now testing a region where sellers may attempt to regain control. A rejection from the current supply zone could lead to a pullback toward the wedge support and potentially the $62K-$63K area.
If buyers manage to absorb the supply and establish acceptance above $68K, the probability of a deeper recovery toward the higher resistance cluster near $72K-$74K would increase significantly. Until then, the price remains vulnerable to short-term retracements after the recent impulsive move.

Onchain Analysis
The UTXO Age Bands Realized Price chart provides an interesting view of investor positioning during the recent correction.
Bitcoin is currently trading below the realized price of the 1M-3M holder cohort, which is positioned around $75K, while remaining above the realized price of the 18M-2Y cohort near $74K. These levels often act as important psychological zones because they represent the average acquisition cost of different groups of market participants.
The recent decline below the short-term holders’ cost basis suggests that many newer investors are currently holding unrealized losses, a condition that typically weighs on market sentiment during corrections.
The continued upward trend in both realized price cohorts also suggests that capital entered the market aggressively throughout the previous advance. While this does not eliminate the possibility of additional downside volatility, it supports the view that the current phase resembles a correction within a larger cycle rather than a complete trend reversal.
For now, on-chain data remains constructive, but from a technical perspective, Bitcoin is approaching a critical resistance area where the recent relief rally may face its first meaningful challenge. A temporary pullback from the $65K-$68K region would therefore not be surprising before the market attempts a larger recovery.

The post Bitcoin Price Analysis: Can BTC Extend Its Rally After Reclaiming $66K? appeared first on CryptoPotato.

Moonrock Capital founder Simon Dedic has said that if the United States and Iran actually sign a peace deal on June 19 as has been reported, it could mark the start of a major rally across risk assets, considering how they behaved when past conflicts ended.
His argument is that, as the most volatile major asset class, crypto would be the first to benefit once the macro pressure from the situation in the Middle East eases.
The Case for a Crypto Rally
In a post on X published on June 15, Dedic started off with a disclaimer, saying that trying to predict anything based on what US President Donald Trump says or does was “a fool’s game.”
He compared the head of state’s unpredictability to that of his Official Trump meme coin (up over 20% in the past week), but he argued that if indeed the Iran deal gets signed as planned this coming Friday, the setup looks a lot like previous moments when conflict-related uncertainty cleared out of markets all at once.
For example, when the Korean War ended, the S&P 500 gained 44% in the following year, according to Dedic. It was the same after the Iraq war, with the S&P 500 rising 25% in the year after the guns went quiet. The analyst also pointed out that in 19 out of 20 conflicts that came after the Second World War, markets took an average of just 28 days to fully recover the minute hostilities stopped completely.
Per his assessment, the Iran war has been the biggest reason why risk appetite has been so low lately. He noted that Bitcoin (BTC) was sitting near $65,000, down almost 48% from its all-time high, with many altcoins faring even worse. But if that overhang gets removed, Dedic expects crypto to reprice quickly, considering how closely it follows changes in risk sentiment.
“Everyone who’s been looking like an idiot for the last few months will soon look like a genius,” he wrote.
Trump confirmed the “Great Deal” in a post on Truth Social, with market commentary account The Kobeissi Letter saying that the proposed agreement would extend the current ceasefire, reopen the Strait of Hormuz, and kick off negotiations around Iran’s nuclear program. It will also reportedly lead to discussions regarding the lifting of sanctions against the Islamic Republic as well as unfreezing its funds, including about $1 billion in crypto seized under Operation Economic Fury.
Markets Are Already Rebounding
Indeed, there was a reaction in the market soon after Trump’s post, with S&P 500 futures going up 0.8% and their Nasdaq counterparts gaining 1.3%, while BTC moved to its highest level in almost two weeks.
Ethereum (ETH) also climbed back above $1,800 after languishing below that level since June 5, only briefly coming up for air on June 9 when it hit $1,700, per CoinGecko data, before promptly diving back under.
Others like XRP, Solana, and Cardano also posted notable results following news of the peace deal, but among the majors, Hyperliquid had the best uptick, with its price just above $68 at the time of writing representing a 10% increase in one day.
The post Analyst Predicts ‘Massive Bull Rally’ if US-Iran Peace Deal Is Signed appeared first on CryptoPotato.

Standard Chartered’s head of digital assets research Geoffrey Kendrick says bitcoin may have already put in its low for the current market cycle, arguing that a combination of improving investor flows, corporate buying and easing macroeconomic pressures points to a stronger recovery ahead.
The latest call marks a shift in sentiment after several months in which crypto markets struggled with rising geopolitical tensions, concerns about inflation and persistent outflows from U.S. spot bitcoin exchange-traded funds (ETFs.)
Last Friday, Kendrick told clients he believed bitcoin’s decline to roughly $59,000 represented the cycle low. At the time, however, he outlined three developments he wanted to see before gaining more confidence in that view: renewed bitcoin purchases by Strategy (MSTR), a return to positive ETF inflows and continued weakness in oil prices.
By Monday, all three had materialized.
Strategy, the largest corporate holder of bitcoin, disclosed that it purchased another 1,587 BTC last week. U.S. spot bitcoin ETFs posted net inflows of $86 million on Friday after a stretch of notable redemptions. Oil prices also continued to move lower, reducing concerns that higher energy costs could push inflation and bond yields upward.


An attacker drained roughly $2.1 million from a deprecated Aztec Connect smart contract on Sunday, three years after the privacy bridge was shut down, by abusing a flaw in how the contract verified zero-knowledge proofs. The exploit hit the RollupProcessorV3 contract at around 8:26 a.m. ET Sunday,… Read the full story at The Defiant
Crypto World
Bitcoin Tops $67,000 to Two-Week High After Trump Declares US-Iran Deal Complete and Hormuz Reopening

Bitcoin pushed above $67,000 on Monday, its highest level in roughly two weeks, after President Trump said the US-Iran deal was "complete" and that he had authorized reopening the Strait of Hormuz. The largest cryptocurrency traded around $67,170, up 4.9% over 24 hours, touching an intraday high… Read the full story at The Defiant

Ventuals is shutting down its on-chain pre-IPO trading platform and folding its team into another project building on Hyperliquid. The wind-down ends one of the first venues that let traders take leveraged positions on the valuations of private companies like OpenAI and Anthropic. The platform… Read the full story at The Defiant


The rest of the Clarity Act depends on that guarantee, because there is no digital asset market to regulate if the people who build it cannot afford to build it in the U.S. The provision survived the committee markup intact, despite a filed amendment that would have gutted it, and it must stay in through the final vote, fully and without dilution.
Here is why this matters to people who will never read a word of the statute. The engineers who write this software, from core Solana contributors to the designers of new DeFi protocols, publish code that anyone in the world can download and use. They hold no money. They cannot freeze an account or move funds, because they never touch them. Treating a software developer like a bank teller makes about as much sense as calling an email app’s engineer a mail carrier. Treasury’s 2019 FinCEN guidance already recognized that merely providing software or network tools used by money transmitters does not, by itself, make someone a money transmitter. The BRCA aligns the criminal code with that standard.
When laws are murky, regulators and prosecutors fill the gap. Treasury has pursued builders who wrote and released software but never held a customer’s assets. The conviction of Tornado Cash developer Roman Storm for conspiring to operate an unlicensed money transmitting business is the case people know, and it fits a pattern that should worry anyone who cares about American innovation. Cases like it are already pushing developers overseas.
Crypto World
Wallet V Launches Public Performance Benchmark for AI Trading Agents on Hyperliquid and Aster

[PRESS RELEASE – Road Town, British Virgin Islands, June 15th, 2026]
Wallet V, a self-custody Web3 wallet, launched a public performance benchmark for the AI trading agents that its users have configured on the third-party decentralized derivatives platforms Hyperliquid and Aster. The benchmark publishes aggregate cohort performance and is hosted on the Wallet V website.
The benchmark covers 688 agents created by Wallet V users over the prior two months. Each agent was configured by the user, used a large language model selected by the user to generate trading decisions, and executed on Hyperliquid or Aster. Wallet V aggregates the on-platform performance of those agents by underlying model. Performance is refreshed as new agents are deployed.
The cohort spans seven large language model families. Across the cohort, 42 percent of agents recorded a profit and loss balance of zero or higher over the period. Peak agent-level return on investment in the dataset ranged from negative 30 percent on the lowest-performing model to positive 307 percent on the highest. Models represented by fewer than 10 agents in the cohort are reported as directional rather than statistically conclusive.
Agents in the cohort executed strategies as perpetual futures across four asset classes available on Hyperliquid and Aster. These include major digital assets such as BTC, ETH, and SOL; equities, including pre-initial public offering equity exposure; commodities including gold, silver, and oil benchmarks; and major foreign exchange pairs. All instruments are accessed through third-party venues.
“At Wallet V, the focus has been on building infrastructure for the next phase of crypto. This benchmark is what that next phase looks like up close. Users now decide which AI model to configure their agent in the same way institutions evaluate managers, by reviewing observable performance over time,” said Adam Cai, Founder & CEO of Virgo Group.
Wallet V plans to extend the benchmark in subsequent releases. Future releases include the addition of newer model families, support for prediction markets, advanced analytics features for copilot trading and personalized AI prompt generation tailored to each user’s trading style.
The Wallet V applications for iOS and Android are available at dl.walletv.io.
About Wallet V
Wallet V is a Web3 self-custody wallet that gives users access to third-party AI models to configure AI agents and execute user-defined trading strategies. The application connects to third-party platforms supporting cross-chain swaps, perpetual futures, prediction markets, and onchain exposure to tokenized equities.
Wallet V is an incubation project by Virgo Group, a digital asset service provider led by CEO Adam Cai. Virgo Group is backed by investors including Draper Dragon, OKX Ventures, Vaulta Foundation, Cobo Ventures, Waterdrip Capital, and Sora Ventures.
Disclaimer
Trading crypto, perpetual contracts, tokenized assets, and prediction markets involves significant risk of loss and is offered by third-party platforms. Wallet V is a software provider that connects to external platforms and does not offer trading services or AI automation tools directly or indirectly. Wallet V does not provide investment, tax, or legal advice. Access to certain products may be restricted in some jurisdictions.
The post Wallet V Launches Public Performance Benchmark for AI Trading Agents on Hyperliquid and Aster appeared first on CryptoPotato.

Angel Reese dragged to floor in flagrant foul as Atlanta Dream rout Toronto Tempo

Creality Falcon T1 Combines Five Laser Engravers Into One Machine

Crypto Live Trading| 08 june #vinbullindia #livetrading #vinbulllive #live #trading #cryptotrading

BloFin War of Whales 2026 Grand Prix opens registration for $5M trading championship

Blockchain.com files with SEC for U.S. IPO

Israel says it has killed new Hamas military leader in Gaza City airstrikes
Crypto Live Trading| 08 june #vinbullindia #livetrading #vinbulllive #live #trading #cryptotrading

Is it worth paying your FINANCIAL ADVISOR? #financialplanning #radhikagupta #financialadvisor #ceo

Everyone Is Pretending They Have Money | Just Getting Good
-

 Business1 day ago
No Jackpot Winner as $257 Million Prize Rolls Over to $269 Million Monday Draw
-

 Crypto World4 days ago
Oppenheimer backs SpaceX as $70 billion retail frenzy builds
-

 Crypto World4 days ago
Markets Rally as SpaceX IPO Looms Amid Iran Tensions and Inflation Surge
-

 Fashion3 days ago
Weekend Open Thread: Tuckernuck – Corporette.com
-
 Crypto World17 hours ago
Zimbabwe Requires Crypto Businesses to Register Annually Under New FIU Regulations
-

 Entertainment6 days ago
The Ryan Gosling True Crime Thriller On Netflix That Gets Even Stranger, Stream It Now
-
 Sports6 days ago
Bangladesh beat Australia after 20 years in ODIs, register only their second win over six-time world champions | Cricket News
-

 Tech3 days ago
NanoClaw integrates JFrog registries to secure AI agent downloads
-

 Tech3 days ago
This Week In Security: Microsoft On Microsoft, Register Your Domains, Linux On ARM, And FreeBSD Joins The File Cache Club
-

 Crypto World2 days ago
Bitget enters Argentina’s regulated crypto market through PSAV registration
-

 Politics4 days ago
Politics Home | Healey Resignation Is “Colossal Failure Of Government”, Says Former Labour Defence Secretary
-
 Tech4 days ago
Dutton Ranch star claims they ‘didn’t see any disruption’ on set following Chad Feehan’s exit from Yellowstone spinoff fueled by Taylor Sheridan clash rumors
-

 NewsBeat4 days ago
El Nino has formed in the Pacific and could set records, forecasters say
-
 Tech5 days ago
‘This is Seattle’s position on AI’: City Council votes unanimously to pause big new data centers
-
 Entertainment4 days ago
Donnie Wahlberg & More Heat Up Las Vegas at Circa’s Barry’s Downtown Prime
-

 Sports4 days ago
First Time Since 1971: Australia Register Historic Low In ODI Cricket
-
 Tech4 days ago
Opendoor Ends India Operations, Fueling a Bigger Conversation About AI and Outsourcing
-

 Politics4 days ago
Belfast burns, while Met chief points finger at Iran and Russia
-

 Business6 days ago
Thailand Ranks Second Worldwide for AI Adoption Growth, Microsoft Reports
-

 NewsBeat3 days ago
FBI searches office of Ohio voter registration group
You must be logged in to post a comment Login