

Crypto World
SIREN Token Crashes 95% in a Week After Whale Sells 670M Tokens for $64.8M

The SIREN token has lost about 95% of its value in a week after a single whale sold roughly 670 million tokens, near 92% of the total supply, for $64.8 million. The sell-off traced to one dominant wallet draining its position into a thin market. On-chain intelligence platform Lookonchain first… Read the full story at The Defiant

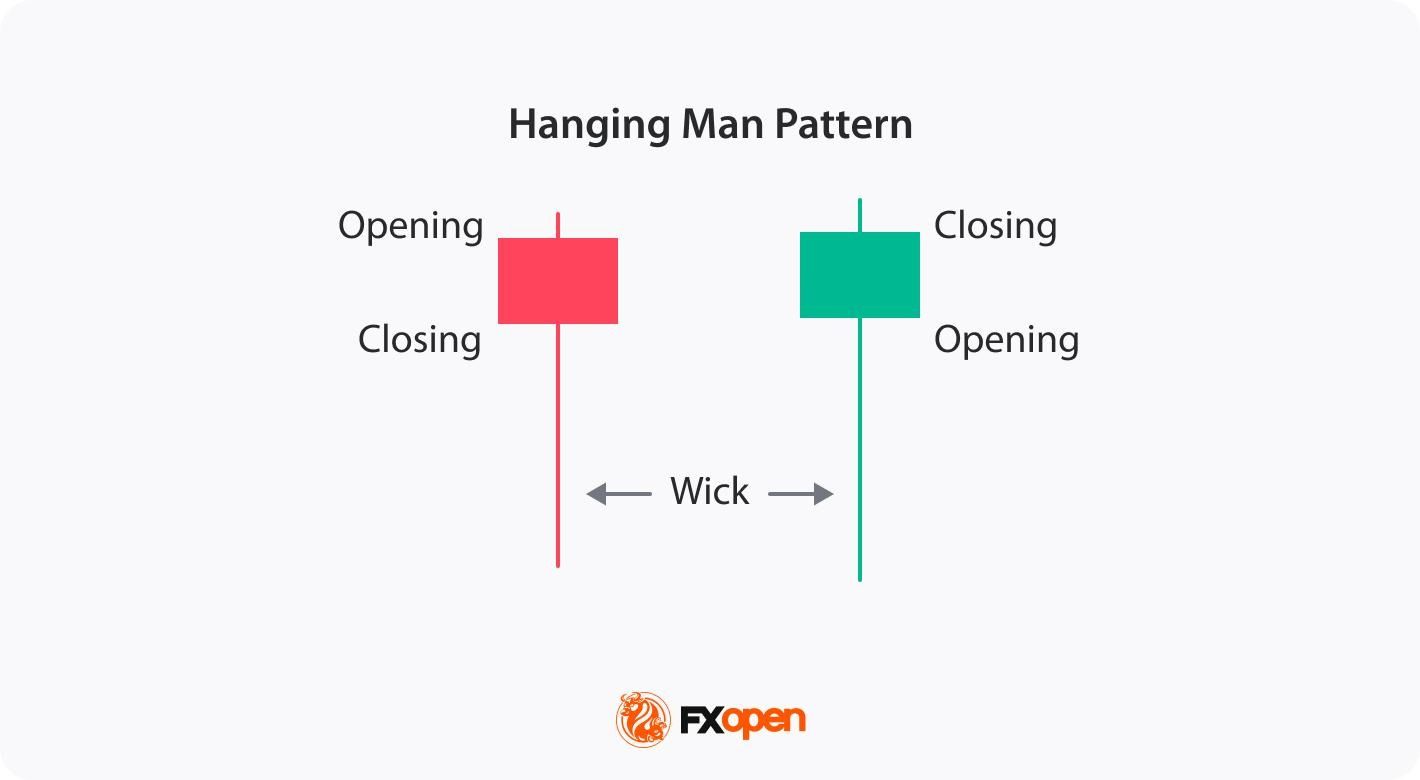
The hanging man candlestick is a single-bar pattern that forms after an uptrend. It consists of a small body near the top and a long lower shadow. It points to a possible bearish reversal. Most traders wait for a confirmation candle before acting.
In the world of technical analysis, candlestick patterns are commonly used to decipher market trends and potential reversals. Among the many setups, the hanging man holds particular significance. This distinctive formation captures traders’ attention as it often serves as a warning sign of a possible trend reversal. This article will go through the technical analysis of the hanging man formation and explain how traders can trade with it.
What Is a Hanging Man Candlestick Pattern?
A hanging man candle is a single-bar pattern that forms after an uptrend and warns of a possible bearish reversal. It has a small real body near the top, a long lower shadow, and little or no upper shadow. The colour of the body is secondary, though a bearish close adds weight.
Psychology Behind the Hanging Man Pattern
The psychology behind the hanging man candlestick pattern reflects a shift in market sentiment. Buyer exhaustion sits at the core of the hanging man pattern. After a long advance, demand thins and fewer buyers step in at higher prices. Sellers then emerge and drive the long lower shadow, signalling a possible uptrend reversal.
The long lower shadow shows that sellers were able to push prices down significantly during the trading session. Although buyers managed to drive prices back up, the close near the open price suggests weakening bullish sentiment. This pattern signals that seller pressure is increasing, potentially leading to a bearish reversal as confidence among buyers diminishes.
The hanging man is a versatile formation that can be applied across a wide range of financial instruments, including stocks, indices, commodities, and forex, on different timeframes.

Characteristics of a Hanging Man Candle
A hanging man candle has a clear shape that sets it apart on a chart. Five features define it. Each one matters, and the pattern carries more weight when all five line up after a strong uptrend.
- Small real body: the open and close price sit close together, near the top of the range.
- Long lower shadow: the shadow runs at least twice the length of the body.
- Little or no upper shadow: price closes near the session high.
- Prior uptrend: the candle forms after a sustained move higher.
- Confirmation: a bearish follow-through candle is needed before the signal holds.
Without a prior uptrend, the same shape is read as a hammer rather than a hanging man candlestick. Context, not colour, gives the candle its meaning.
How Traders Identify a Hanging Man Candlestick
To spot a hanging man pattern in stocks and other financial instruments, you may follow these steps:
- Look for an existing uptrend: Start by identifying a prevailing upward price movement on the chart.
- Find a small real body near the top of the range: It should have a long lower shadow and little to no upper shadow. This formation resembles a figure hanging from its head.
- Check the lower shadow runs at least twice the length of the real body: A short shadow weakens the signal.
- Treat colour as secondary: The colour of the candle doesn’t matter, but if it’s bearish, the signal is stronger.
- Consider supporting indicators: Utilise other technical indicators or oscillators to further validate the potential reversal. These can include trendlines, moving averages, or momentum indicators that align with the bearish interpretation.
Even with all five checks met, the hanging man candlestick still needs a confirmation candle before it carries weight. The pattern is a warning, not a trigger.
What Is the Confirmation Candle for a Hanging Man?
A hanging man confirmation candle is the bearish bar that follows the pattern and provides the candlestick confirmation that validates the reversal. Without it, the hanging man is only a warning. Traders typically watch for one of three signals in their candlestick chart analysis.
The first is a bearish engulfing candle that fully covers the prior body. The second is a strong bearish close well below the hanging man’s real body. The third is a clean break below the hanging man’s low. Each shows that sellers have taken control after the initial warning. The stronger the confirmation, the more weight the signal tends to carry.
Trading the Hanging Man Pattern
Those trading the hanging man reversal pattern apply a systematic approach. Here are a few steps traders usually follow to trade this pattern:
- Spot the pattern: Identify the setup by using the steps mentioned above.
- Look for confirmation signals: The setup alone is not sufficient for making trading decisions. Seek additional confirmation through subsequent candlestick patterns or technical indicators. This can include bearish candlestick patterns (e.g. bearish engulfing), a pullback from a resistance level, or the convergence of other indicators signalling a potential reversal.
- Define your entry point: Traders typically consider an entry point either when the next candlestick confirms the bearish sentiment or when the price breaches a significant level.
- Identify profit targets: The candlestick itself doesn’t provide specific targets. Traders could identify profit targets by looking at previous support levels, Fibonacci retracement levels, or other technical analysis tools like moving averages or pivot points.
- Consider risk management: Traders might set a stop-loss order above the hanging man pattern. Some traders assess the risk-reward ratio of the trade to ensure the trade aligns with their risk tolerance. Risk management tools like position sizing, setting stop-loss orders, and diversification may help traders calculate risks.
- Monitor the trade: Traders keep a close eye on their positions as they progress. They pay attention to any changes in market conditions or additional signals that may invalidate the trade.
- Learn from outcomes: Regardless of the outcome of the trade, traders analyse it afterwards to identify areas for improvement. They assess whether the setup provided accurate signals and identify any factors that may have affected the trade.
Live Market Example
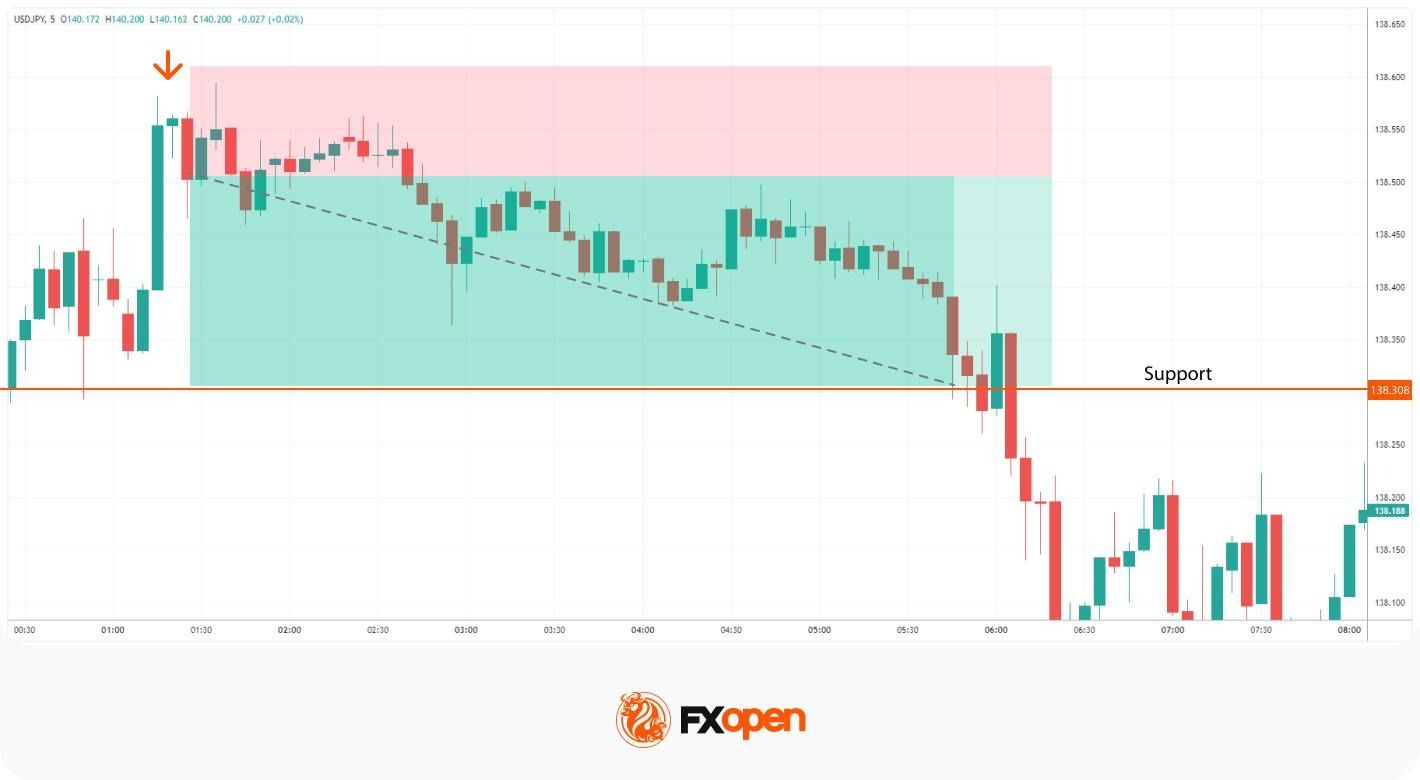
Consider a hanging man that forms on the USD/JPY pair after a steady uptrend. The candle has a small body near the top and a long lower shadow. A bearish candle follows and closes lower, which validates the setup.
A common approach places the stop loss just above the high of the hanging man, since a move back above it would weaken the bearish case. The take profit order is at the next level of support. The gap between entry and that support sets the risk-reward ratio for the trade.
Traders can consider using the TickTrader platform to test the hanging man pattern rules.
Limitations of the Hanging Man Pattern
The hanging man candlestick pattern, while useful, has certain limitations that traders need to consider:
- False Signals: The hanging man can produce false signals, especially in volatile markets where price movements are erratic. A candle that looks valid can still fail once the next bar prints.
- Market Context: The reliability of the pattern varies depending on the broader market context and prevailing trends. The same shape means little without a clear prior uptrend behind it.
- Timeframe Sensitivity: The pattern’s signals can vary across various timeframes; what works on a daily chart may not be a strong signal on an intraday chart.
- Not Standalone: It is used as part of a comprehensive trading strategy that includes other indicators and risk management tools.
Context does most of the work here. The pattern flags a possibility, not a certainty.
Hanging Man vs Similar Candlestick Patterns
Understanding how the hanging man pattern differs from similar candlestick patterns may help in accurate technical analysis.
Several single-candle formations look almost identical to it, which makes them easy to confuse. The difference comes down to three things: the trend the candle forms in, where the body and shadow sit, and the signal it gives. The three comparisons below break it down against the hammer, the pin bar, and the shooting star.
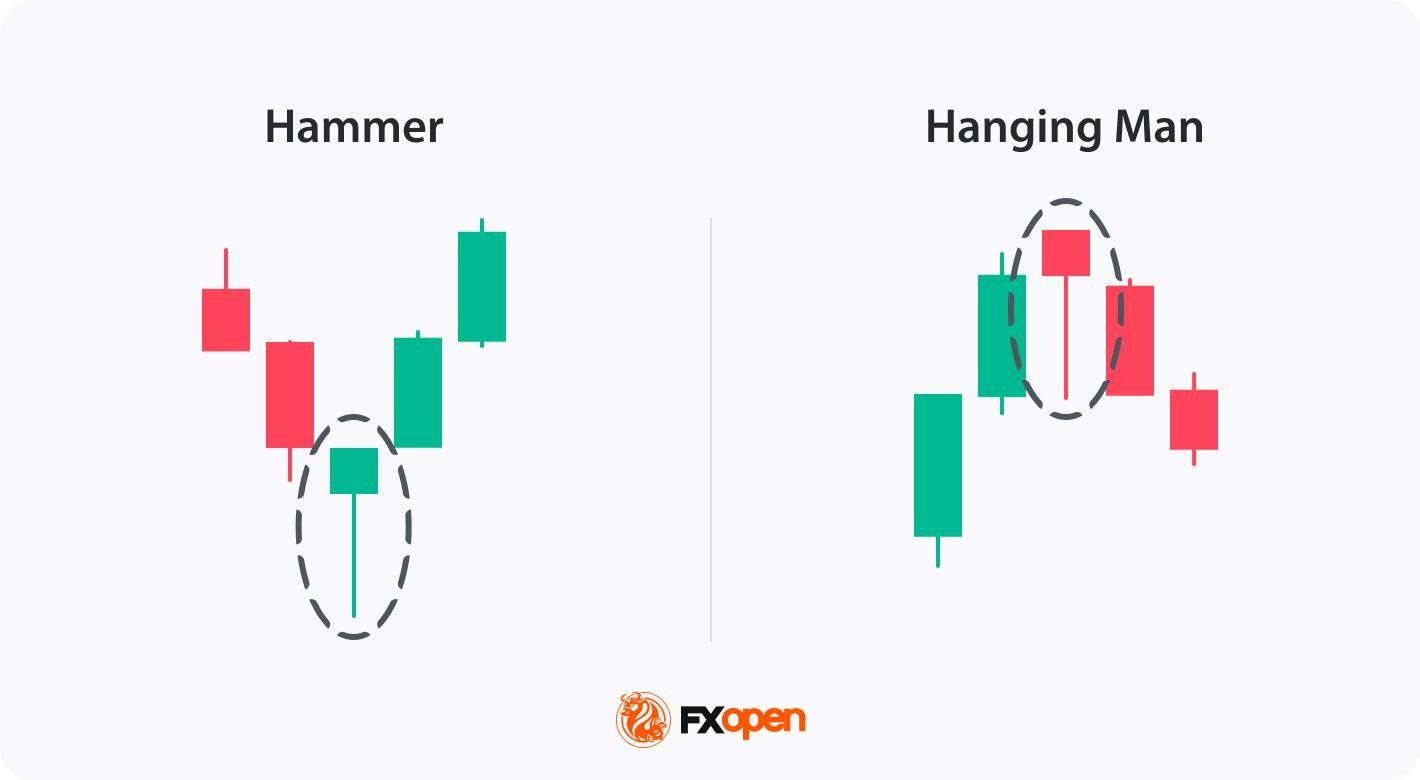
Hanging Man vs Hammer
Both candles share the same structure: a small body near the top and a long lower shadow. The hanging man vs hammer difference comes down to the trend each one forms in.
The hanging man candlestick forms in an uptrend and signals a potential bearish reversal, while the hammer appears in a downtrend, indicating a potential bullish reversal. Both candles require confirmation from subsequent price movements. They are typically analysed within the context of the overall market trend and other technical indicators.
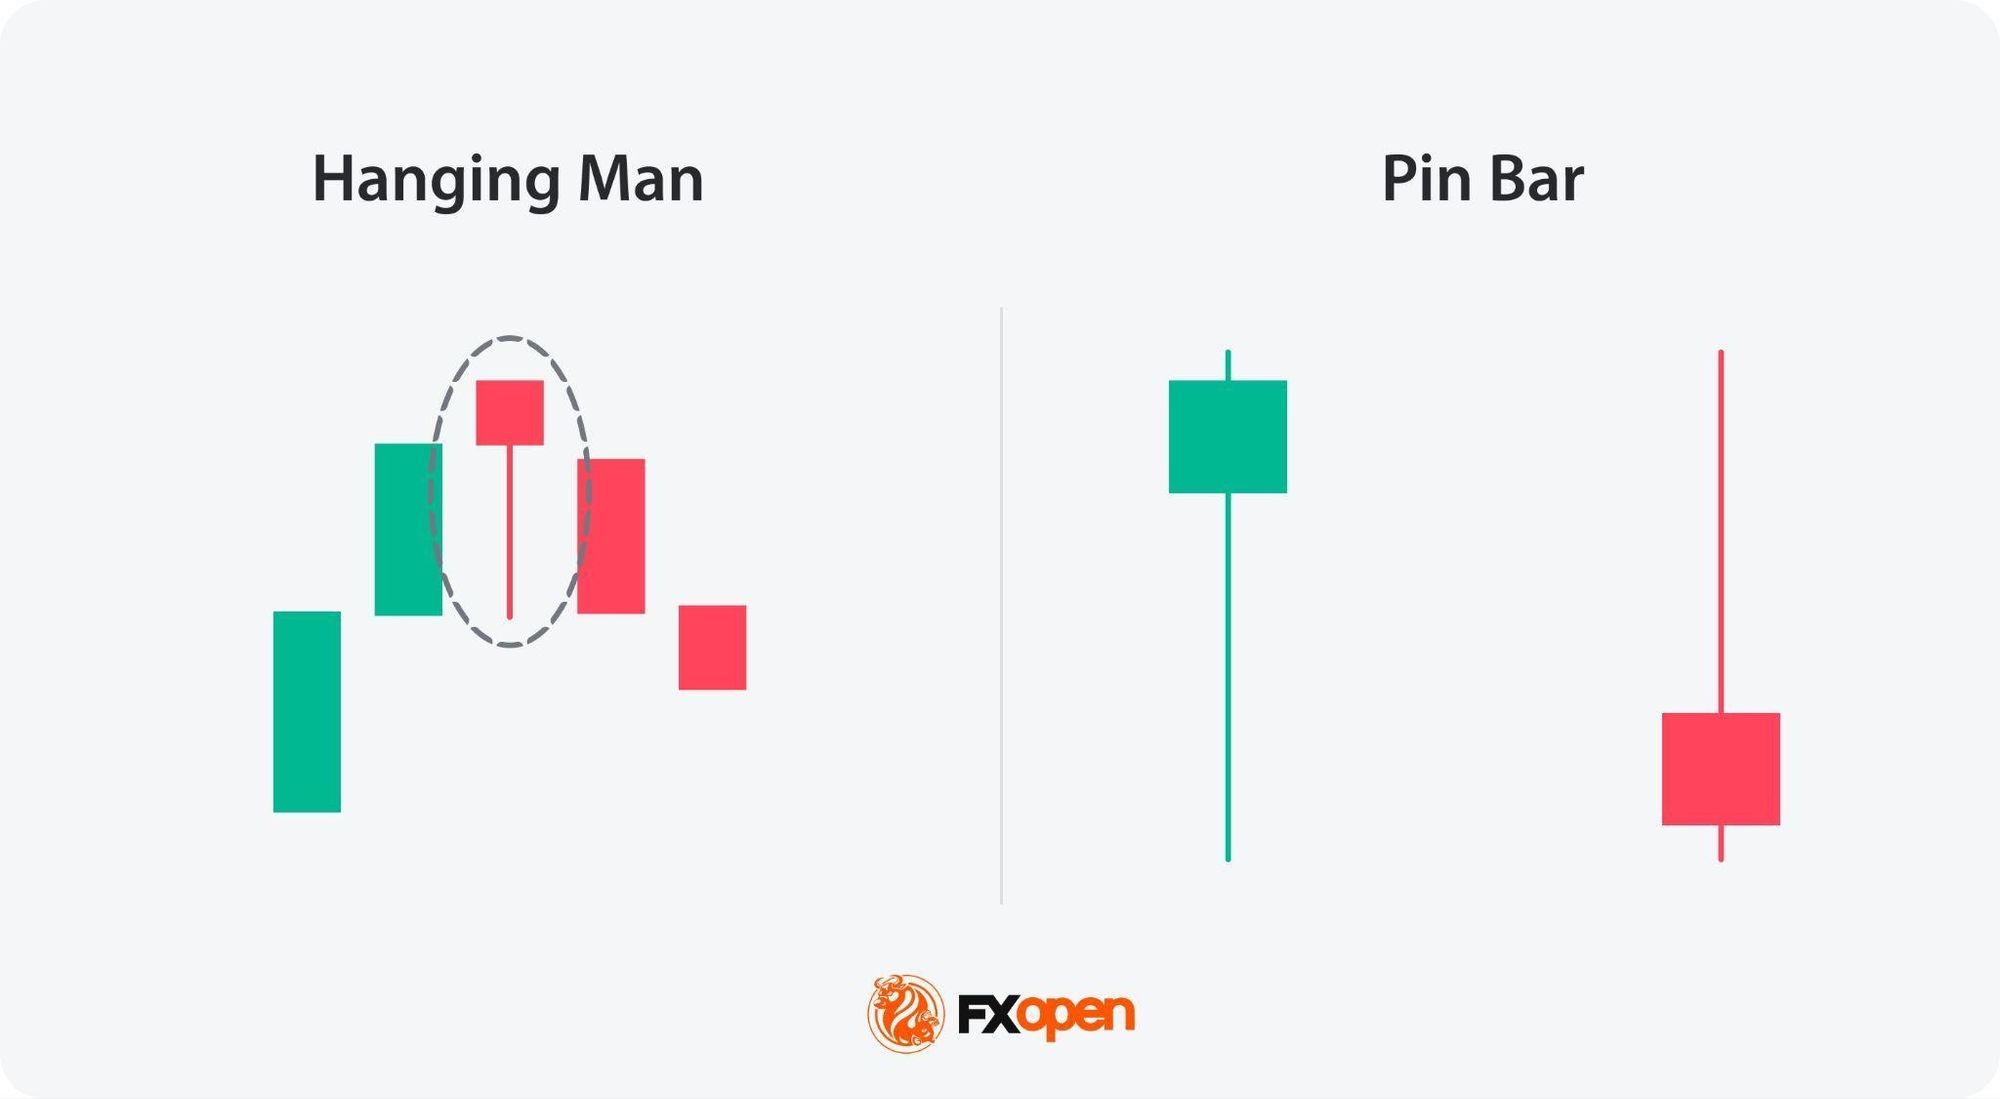
Hanging Man vs Pin Bar
A pin bar and a hanging man are both single-candlestick patterns with small bodies and long shadows, but they serve different purposes in price action trading. The pin bar has a small body and a long tail, indicating a reversal, but it can appear in bullish and bearish markets. In a bullish trend, it’s called a shooting star, it has a long upper shadow and a small body, and signals a downward reversal. In a bearish trend, it’s called a hammer, it has a long lower shadow and a small body, and signals a bullish reversal. Its long tail shows a strong rejection of a certain price level, with the body pointing in the direction of the anticipated reversal.
The hanging man, however, specifically occurs after an uptrend and signals a potential bearish reversal, characterised by a small body at the top and a long lower shadow, indicating selling pressure.
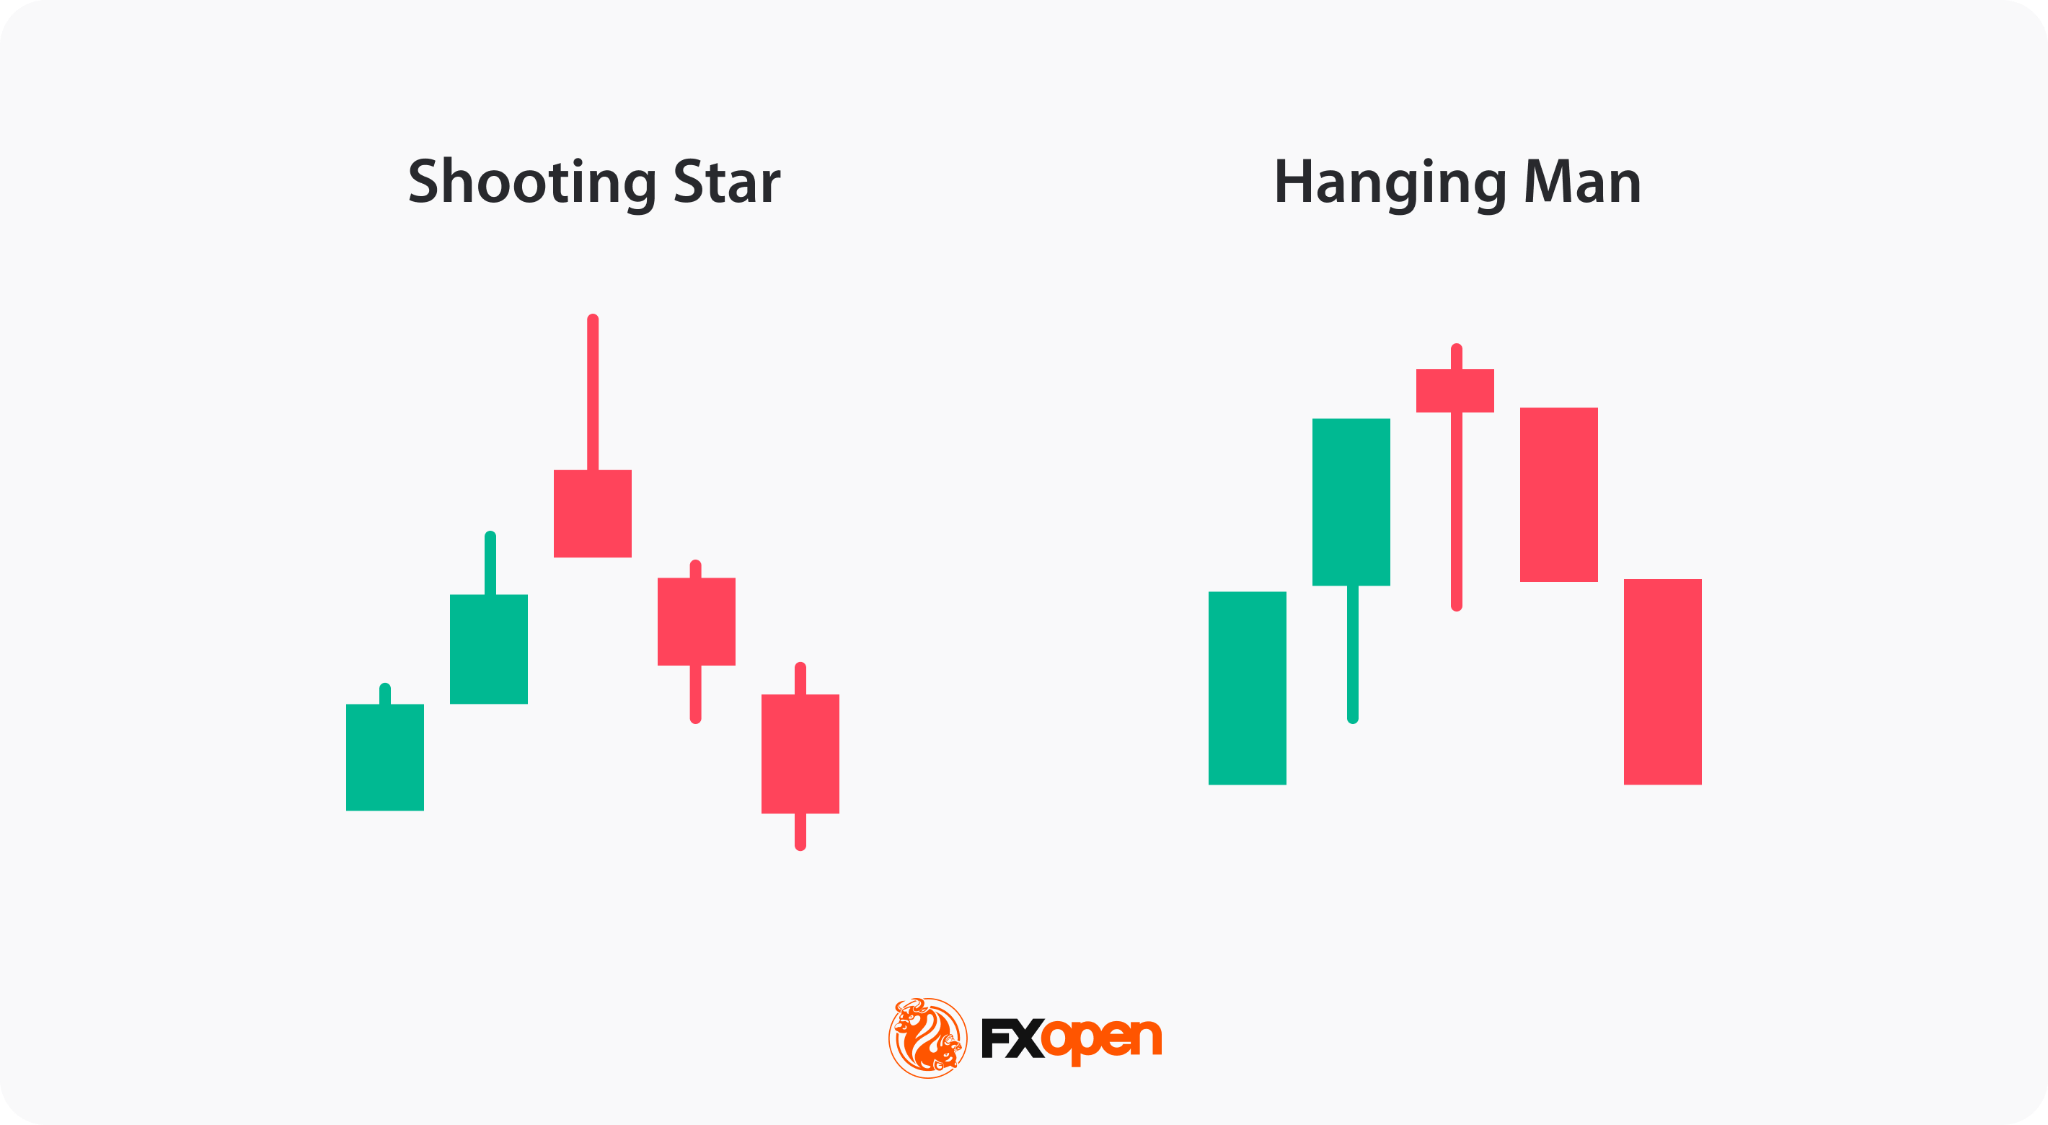
Hanging Man vs Shooting Star
The shooting star and the hanging man are both bearish reversal patterns, but they differ in their appearance and context. A shooting star occurs after an uptrend and features a small body at the bottom with a long upper shadow. It indicates that the price was pushed up significantly but fell back down, showing strong selling pressure.
The hanging man also appears after an uptrend but has a small body at the top with a long lower shadow. It suggests that sellers dominated the session despite an initial push by buyers.
Both require confirmation from subsequent candlesticks to validate the reversal.
Is the Hanging Man Pattern Reliable?
On its own, the hanging man is a moderate signal. Its reliability depends on what surrounds it, not the candle alone. Four factors decide how much weight it carries.
Market context matters first. The pattern means little without a clear, sustained uptrend behind it. The same shape inside a choppy range carries almost no signal.
Trading confirmation comes next. A hanging man without a bearish follow-through candle is just a warning, and many resolve back into the uptrend. A confirmed signal is far more dependable than an unconfirmed one.
Timeframe shapes reliability too. A hanging man candle on a daily or weekly chart tends to hold more weight than one on a one-minute chart, where noise produces frequent false signals.
Supporting tools round it out. Traders often pair the pattern with support and resistance, volume, or momentum readings as part of their hanging man technical analysis. Agreement across signals raises the odds the reversal holds.
The takeaway is simple. The hanging man pattern flags a possibility, not a certainty, and works as one input among several rather than a standalone trigger.
Final Thoughts
While the hanging man alone is insufficient for making trading decisions, it serves as a warning signal that buyers may be losing control and that selling pressure could increase. Traders seek additional confirmation through subsequent candlestick patterns, support and resistance levels, and other technical indicators to validate the potential reversal.
In short, identify the candle by its small body, long lower shadow, and prior uptrend, then wait for a bearish confirmation candle before the trend reversal signal carries weight. By understanding the implications of the setup within the broader market context and employing proper risk management strategies, traders can support their decision and identify different setups across the markets. Once comfortable with a strategy, traders may consider opening a forex trading account with FXOpen to apply it across more than 700 markets.
FAQ
What Does the Hanging Man Pattern Indicate?
The hanging man trading pattern in technical analysis typically indicates a potential bullish trend reversal. It suggests that the buyers, who have been driving the market higher, are losing control, and the selling pressure may increase. The hanging man is represented by a small body near the top of the candlestick, a long lower shadow, and little to no upper shadow.
Can a Hanging Man Candle Be Bullish?
No, there is no such thing as a bullish hanging man candlestick pattern. The bearish hanging man pattern indicates a potential trend reversal from an uptrend to a downtrend.
Is the Hanging Man Pattern Reliable?
The reliability of the hanging man pattern, like that of any candlestick formation, depends on the broader market context and supporting technical signals. Although it is widely recognised as a potential bearish reversal pattern, it isn’t used as the sole basis for trading decisions. Traders typically seek confirmation through subsequent bearish price action, such as a strong bearish candle following the pattern, as well as additional technical indicators that support the likelihood of a trend reversal.
What Is the Confirmation Candle for the Hanging Man?
A confirmation candle for the hanging man is a bearish candlestick that follows the pattern, confirming the reversal. This can include a bearish engulfing candle or a candlestick closing well below the hanging man’s body, indicating increased selling pressure.
Is the Hanging Man Pattern Bearish?
Yes, it is generally considered a bearish pattern that appears after a strong uptrend. It is formed when the price’s open or close is near or at its high and there is a significant decline during the trading session.
Does the Colour of a Hanging Man Candle Matter?
No, colour is secondary. A hanging man can close red or green, and both versions are valid. However, a bearish red close adds weight, since it shows sellers ended the session in control. The shape and the prior uptrend drive the hanging man candle meaning far more than the body colour.
Can a Hanging Man Appear in Forex Markets?
Yes. The hanging man appears across forex, stocks, indices, commodities, and other markets on any timeframe. In hanging man forex trading, it often forms on major pairs after a sustained uptrend. The signal reads the same way regardless of instrument, though confirmation and market context still decide its reliability.
What Timeframe Is Commonly Used for a Hanging Man Pattern?
Higher timeframes tend to be more reliable. A hanging man on a daily or weekly chart usually carries more weight than one on a one-minute chart. Lower timeframes produce more noise and more false signals. Many traders treat the hanging man trading pattern as stronger when it forms on longer timeframes near key levels.
What Indicators Are Often Used With a Hanging Man Candle?
Traders often pair the candle with momentum and trend tools. Common choices include the RSI, moving averages, volume, and resistance levels. These may help confirm whether the bearish reversal candlestick signal is likely to hold. No single indicator confirms the pattern alone, so agreement across several tools tends to raise the odds.
This article represents the opinion of the Companies operating under the FXOpen brand only. It is not to be construed as an offer, solicitation, or recommendation with respect to products and services provided by the Companies operating under the FXOpen brand, nor is it to be considered financial advice.
The U.S. and Chinese flags are seen on the day of a bilateral meeting between the U.S. and China, in Geneva, Switzerland, May 10, 2025.
Keystone/eda/martial Trezzini | Via Reuters
BEIJING — Senior Chinese officials on Wednesday stressed Beijing’s plans to share artificial intelligence globally and safely, the latest sign of how the U.S. and China are promoting different approaches to the tech.
“China is accelerating the establishment of a global AI cooperation organization, and welcomes all parties to join,” Wang Yi, China’s top diplomat, told reporters in Mandarin Chinese, according to a CNBC translation. He emphasized the tech should serve the needs of humans.
Wang was speaking at the release of China’s global governance whitepaper, which criticized trade wars and emphasized support for the Global South. The category loosely refers to less developed economies, especially countries outside the U.S. and European orbits.
Wang’s comments came as the U.S. ramps up efforts to restrict foreign access to leading, U.S.-developed AI models.
During a summit in France this week, the wealthy Group of Seven countries — the U.S., the U.K., France, Germany, Canada, Italy and Japan — discussed a plan to give “trusted partners” access to the U.S. AI models, Reuters reported on Tuesday, citing three diplomatic sources. CNBC was unable to independently confirm the report and has reached out to the White House for comment.

U.S. AI models also tend to be subscription-only, while China’s efforts have focused on cheap or free AI models that can often be downloaded in their entirety.
Speaking alongside Wang on Wednesday, Zhao Haibing, vice chair of China’s top economic agency, pushed back on “closed, exclusive and monopolistic approaches to tech development.”
Instead, Zhao emphasized China’s efforts to deepen international AI cooperation through BRICs and the Shanghai Cooperation Organization, an annual gathering of countries including Russia and Iran that was initially focused on security.
Zhao also pointed to China’s “AI Capacity Building for All” initiative, support for the United Nations in leading global AI governance and efforts to help developing countries with tech and talent.
The U.S. and China separately said last month the two sides would work on AI guardrails, but few details have emerged.
Beijing has made sweeping proposals for global cooperation over the last 12 months.
Chinese President Xi Jinping proposed the “Global Governance Initiative” at a China-hosted meeting of the SCO late last summer.
A few weeks prior, at an annual AI conference in Shanghai, Chinese Premier Li Qiang announced the Chinese government had proposed the establishment of a global AI cooperation organization. Li’s remarks came just days after the Trump administration announced an AI action plan that included support for U.S. tech development overseas.
Crypto World
Crypto News, June 17: Kevin Warsh First FOMC, Binance vs. MiCA as CZ Takes on Hyperliquid, and BTC USD Grinds Sideways

Kevin Warsh steps into his first FOMC spotlight later today, while Binance MiCA license is hanging in the balance. As BTC USD Grinds sideways, a viral teaser clip from CZ on Hyperliquid comes and stirs fresh drama.
BTC USD holds steady at $65-$66K with on-chain buyers absorbing over 125,000 BTC this month. Markets sit in classic pre-decision limbo, watching every word from the new Fed chair.

Discover: The Best Crypto to Diversify Your Portfolio
Kevin Warsh First FOMC: Hold Expected
Kevin Warsh chairs his debut FOMC meeting today with rates almost certain to stay at 3.50%-3.75%. Although the real fireworks sit in the dot plot, his tone on inflation. As we heard, Kevin Warsh has a reputation for blunt talk. If he signals cuts are off the table longer than expected, crypto could face short-term pressure. History shows BTC USD often dips after FOMC announcements.
What would happen? What are we expecting? A fully hawkish Kevin Warsh will likely send BTC USD slightly downward. Neutral language with a slight dovish lean keeps the range intact and might also fuel altcoin rotation. Any surprise dovish pivot from Kevin Warsh would likely spark a rapid relief rally across BTC USD and Alts.
He could play it pragmatic, with persistent energy-driven inflation, to give him cover for a hawkish hold. Yet softening geopolitics and stable growth data might let him leave doors open. So tune in and wait for his first press conference at 2:30 PM ET.
Discover: The Best Token Presales
Binance MiCA Drama and CZ Hyperliquid Take
Binance MiCA troubles escalated with reports that the exchange may lose its EU license bid. Right now, regulators appear unhappy with compliance gaps. Binance themself stated that the company remains fully committed to securing our MiCA license and operating under a unified European framework.
However, a question also lingers from the user’s perspective. Germany had already issued 45 MiCA licenses. The Netherlands had issued 22. Both are well-established regulatory jurisdictions with clear processes. But Binance chose Greece, a country that had issued zero MiCA licenses at the time of application. Why?
— Coin Bureau (@coinbureau) June 17, 2026
 BINANCE PROGRESSES WITH MICA LICENSING
Binance says it remains committed to securing a MiCA license and will update European users before June 30, 2026.
The exchange says Greece’s HCMC completed its review and considered the application compliant with MiCA requirements. pic.twitter.com/AP3EnuJ2cV
In a teaser from an upcoming interview, CZ offered backhanded praise for Hyperliquid. He called the invention “awesome” for grabbing a no-KYC niche Binance cannot touch. Then came the shade: CZ questioned their decentralization claims and said he would never operate the same way, given his experiences, assuming they have “good lawyers.”
The clip will drop the full episode tomorrow, but CZ hyperliquid comments come with extra bite because he supports ASTER, another no-KYC style play. These all are happening while Coinbase, Binance’s biggest rival, goes ahead with tokenized stocks and equity options.
Binance MiCA drama displays regulatory risk, and CZ hyperliquid shade shows old rivalries never die. Now, the question is, who actually controls the next wave of trading infrastructure?
From the market, we saw a large wallet shift of around $200 million in BTC ahead of today’s decision. Uniswap ripped 22% on bullish Standard Chartered targets as BTC USD Grinds Sideways. Bitcoin has spent the morning consolidating after absorbing heavy buying earlier in June. Though the 125,000 BTC accumulation figure from on-chain data flashed a potential bottom signal.
The market feels coiled, but historical post-FOMC patterns keep us worried. BTC USD has sold off after several recent meetings. FOMC meetings are becoming bad memories. BTC USD may grind today, but the setup favors those positioned for the next macro catalyst. Kevin Warsh, Binance MiCA, and CZ comments on Hyperliquid will fade once markets digest the FOMC outcome.
Be ready to get shaken. Follow us for more updates here.
Discover: The Best Crypto to Diversify Your Portfolio
The post Crypto News, June 17: Kevin Warsh First FOMC, Binance vs. MiCA as CZ Takes on Hyperliquid, and BTC USD Grinds Sideways appeared first on Cryptonews.
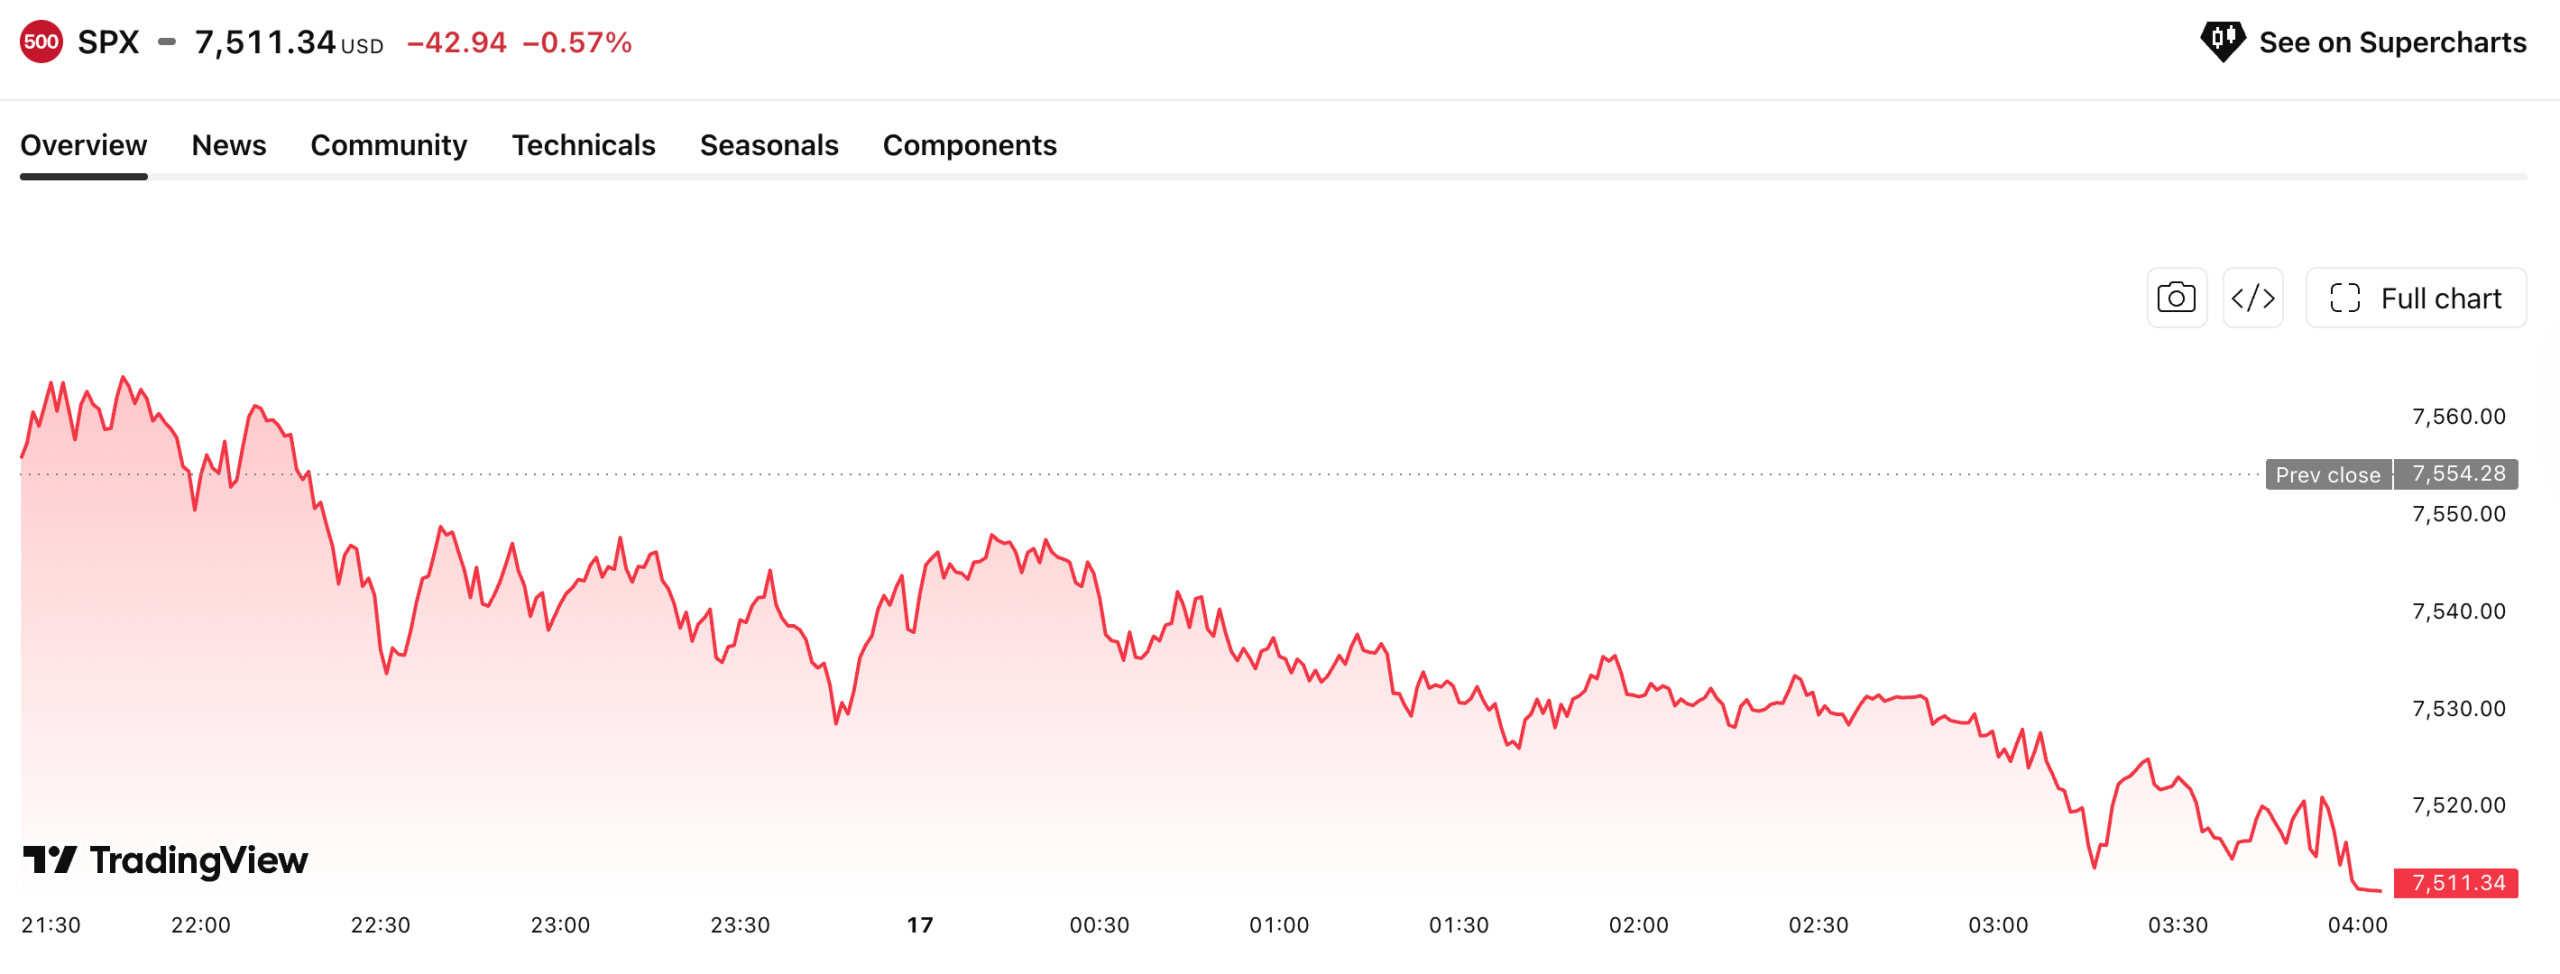
Markets are broadly higher this week, oil is down, a peace deal was signed, and SpaceX just became the world’s fifth-largest company. So why are the Nasdaq and S&P 500 the only major indices going the wrong way?
Two forces are working against the two most-watched US indices at the same time: a hawkish Federal Reserve that just killed rate cut expectations, and a capital rotation pulling money out of the tech-heavy names that dominate both.
Why Tech Stocks Are Taking the Hit First
On the day Trump announced the Iran peace deal, the Nasdaq gained about 3%, and the S&P 500 added nearly 2%. In the following session, both slipped: the Nasdaq fell 0.41%, and the S&P 500 dropped 0.19%. The Dow, by contrast, hit a record above 52,000 on the same day both slipped.

The reason sits with the Fed. Kevin Warsh removed the easing bias from the Fed’s statement on June 16, and the dot plot abandoned its last projected rate cut for 2026. With inflation running at 4.2%, higher rates look more likely than lower ones.
That hurts the Nasdaq and S&P 500 more than the Dow because both carry heavy weightings in technology companies, and tech stocks are growth stocks, valued on earnings years into the future.

When rates stay high, those future earnings are worth less in today’s money. The industrial, energy, and consumer names that dominate the Dow are far less sensitive to that pressure.
SpaceX and the Rotation Away From Big Tech
The other factor is where capital is going. When the peace deal landed, the biggest beneficiaries were the assets most beaten down by the Iran conflict: European industrials, Japanese exporters, and energy-dependent sectors. The STOXX 600 hit an all-time high. Japan’s Nikkei surged nearly 5% and crossed 70,000 for the first time.
Money rotated there fast, and some came from richly valued US tech positions that had held up relatively well through the conflict.
SpaceX also entered the equation. Trading as SPCX on Nasdaq, the stock surged nearly from its June 12 IPO price of $135 to a high of nearly $220 and briefly overtook Amazon. A newly listed stock attracting that level of attention draws capital, and some of that capital comes from existing Nasdaq positions rather than fresh money entering the market.

The Nasdaq and S&P 500 are not falling because investors are worried. They are falling because investors found something they like more.
The post Why Nasdaq and S&P 500 Are Sliding While World Rallies appeared first on BeInCrypto.
The Federal Reserve decides rates today. Even with no cut expected, the tone new Chair Kevin Warsh sets could shift sentiment. That has crypto whales positioning with caution.
BeInCrypto analysts tracked on-chain flows across three tokens where large holders paired spot moves with perps hedges. They are accumulating some, fading one, and bracing for a possible squeeze ahead of the FOMC meeting.
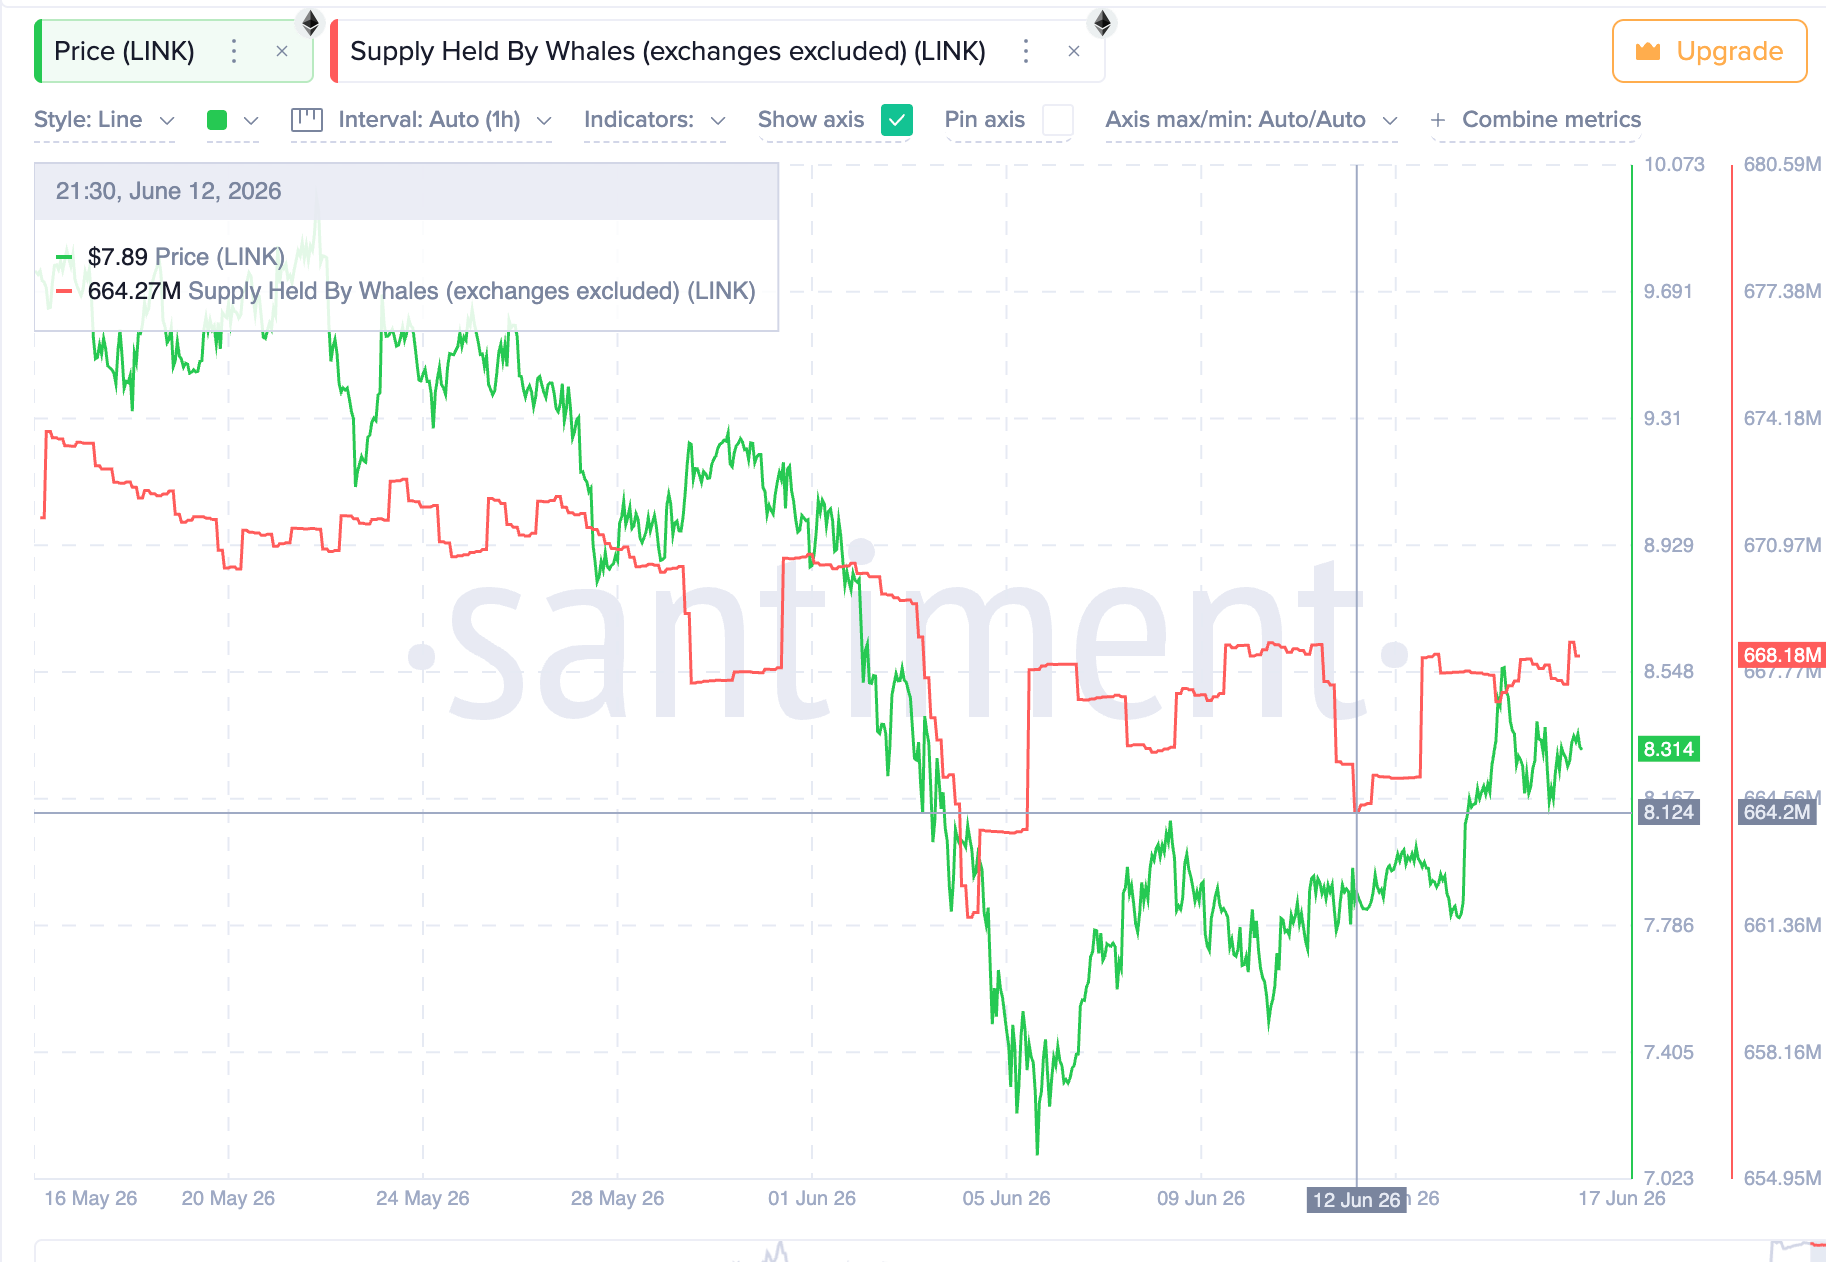
Chainlink (LINK)
The oracle leader sits at the center of the crypto whales debate. Spot accumulation and derivatives positioning point in opposite directions ahead of the Fed.
Want more token insights like this? Sign up for Editor Harsh Notariya’s Daily Crypto Newsletter here.
On-chain data shows whale spot balances climbed from 664.2 million LINK on June 12 to 668.18 million now. That is an addition of nearly 4 million tokens worth about $33 million, with fresh pickups on June 15 and June 17. The whale accumulation lines up with real adoption.

FIFA’s prediction-market partner adopted Chainlink as its exclusive oracle. The DTCC also tapped its data standard for a collateral platform a few months back. Wallets holding at least 1 LINK hit 535,650, the highest since 2022, giving spot whales the much needed sentimental push.
Derivatives tell a different story. Over the past two days, all three cohorts on Nansen turned net short, a clear bearish tilt from sophisticated traders. Smart money shorts sit in profit, while the largest whale long is down about $1.3 million.

The split defines the setup. Spot buyers treat the macro uncertainty as a value entry, betting on Chainlink’s expanding utility. Leveraged desks lean short into the Fed instead, bracing for near-term downside. Tonight’s FOMC decision is the pivot that decides which side is early.
Uniswap (UNI)
Uniswap’s rally over the past 24 hours put it among the week’s biggest gainers, but it now meets a more cautious whale cohort. Spot selling and net short perps suggest large holders are fading the move into the Fed.
Whale spot balances fell from 780.50 million UNI on June 15 to 778.53 million now. That is a drop of nearly 2 million tokens. The selling began as UNI surged on Standard Chartered’s $100 price target and its new tokenized stocks. Price is up about 23% today despite the distribution, yet whales trimming into strength often warns of resistance ahead.

The perps side leans the same way. Over the past seven days, whales and smart money on Nansen moved net short. The bias deepened as price rose. Smart money holds about 95% of its exposure short, a decisive directional call. One whale short opened near $8 sits up about $688,000 (selling incentive), while a $1.4 million long entered at $6.37 is trapped well below the mark.

Like Chainlink, Uniswap whales pair their spot move with a perps short. The difference is direction. Chainlink whales hedge accumulation, while Uniswap whales trim spot and short the bounce. That reads as profit-taking into a sharp rally rather than fresh conviction. Tonight’s FOMC decision will test whether the fade holds or the breakout extends.
Ondo Finance (ONDO)
The leading real-world asset token closes the set with the cleanest accumulation, yet the perps book hides a catch. Spot buyers are loading up while the derivatives crowd leans hard the other way.
Whale spot supply climbed from 7.82 billion ONDO on June 13 to 7.9 billion now. That is an addition of about 80 million tokens, and the buying picked up again in the past few hours. The accumulation rides the RWA narrative. Ondo leads tokenized treasuries with total value locked near $3.7 billion, and it just hired an ETF veteran for on-chain portfolios. Standard Chartered also projected a $2.7 trillion DeFi market by 2030.

The catch sits on Hyperliquid per Nansen data. Crypto whales, smart money, and public figures are all net short, roughly $2.56 million combined, with only one visible long. Shorts cluster between $0.38 and $0.54 (per positioning data), a clear bet that price stays capped. Yet ONDO is up about 7% on the week. With spot buying building under it, a push higher could force the crowded shorts to cover and fuel a squeeze.

Like Chainlink, Ondo whales pair spot accumulation with perps shorts, classic swing hedging. Across all three tokens, the perps shorts read as caution into the Fed decision. No rate cut is expected. But the tone Warsh sets could justify the hedges, or trigger the squeeze that traps them.
The post What Crypto Whales Are Buying and Selling Ahead of the June FOMC Meeting appeared first on BeInCrypto.
Bitcoin has retreated toward $65,000 ahead of the Federal Reserve’s policy decision as traders cut risk and reassess the outlook for interest rates under newly appointed Fed Chair Kevin Warsh.
Summary
- Bitcoin fell from near $67,200 to around $65,236 ahead of the Fed’s June 17 rate decision as traders reduced risk.
- Key resistance sits between $67,500 and $68,000, while analysts are closely watching support around $63,700 and $60,000.
- Falling oil prices, Middle East tensions, and uncertainty over Fed Chair Kevin Warsh’s policy outlook continue to shape market sentiment.
According to data from crypto.news, Bitcoin (BTC) price fell from a June 16 high of near $67,200 to an intraday low around $65,236 on June 17 before stabilizing near $65,300 at press time. The pullback came as investors awaited the outcome of the Federal Reserve’s two-day policy meeting, with policymakers expected to keep rates unchanged at 3.50%–3.75% when the decision is released later today.
Attention has instead shifted to the Fed’s updated dot plot and Warsh’s first post-meeting press conference. Traders have increasingly focused on whether policymakers abandon any remaining easing bias and reinforce expectations that borrowing costs could remain elevated for longer amid inflation running above 4%.
Outside crypto, the cautious mood extended across several asset classes. Gold and silver both traded modestly lower during the session, while crude oil slid toward $75 per barrel for a fifth consecutive day as markets priced in the possibility of renewed Iranian oil exports under a proposed U.S.-Iran agreement.
At the same time, Asian technology shares continued attracting capital, with Japan’s Nikkei 225 reaching fresh record highs above 70,000 amid ongoing enthusiasm surrounding artificial intelligence investments.
Technical structure leaves Bitcoin trapped between $60K support and $68K resistance
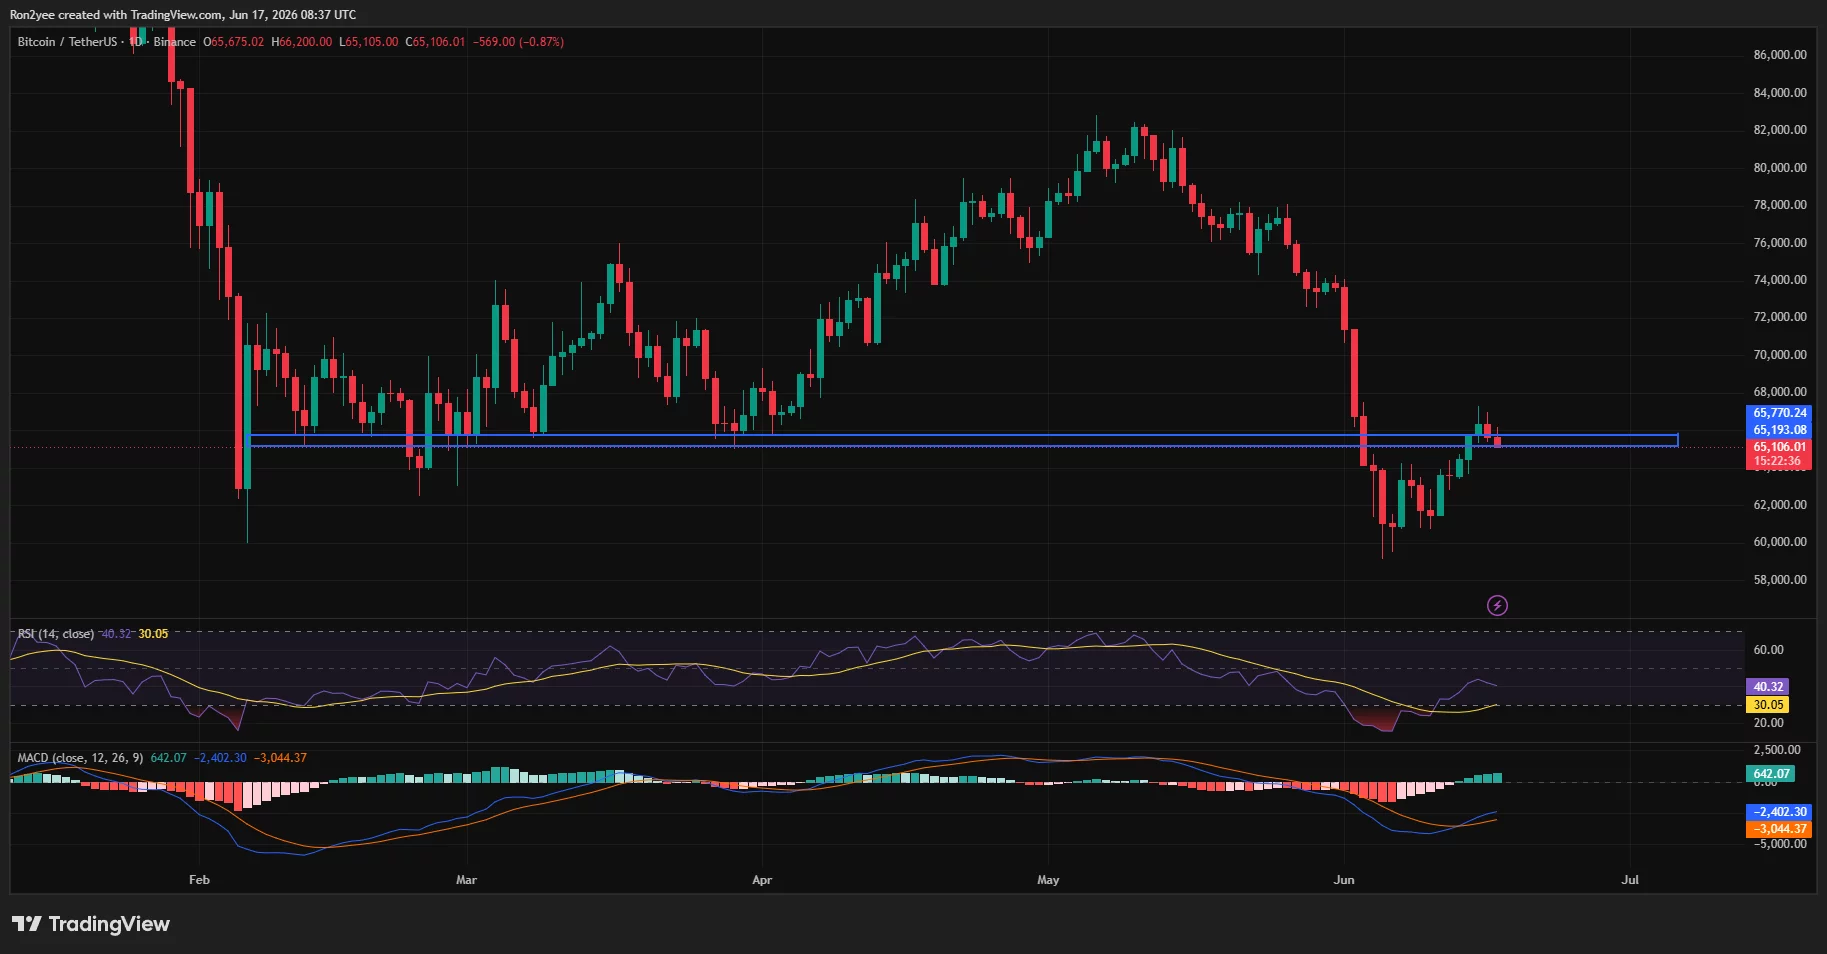
Bitcoin’s recent rebound from below $60,000 has stalled near a major technical resistance zone.
On the daily chart, BTC has returned to a support-turned-resistance region between roughly $65,200 and $65,800. The area previously acted as a key floor during February and March before breaking during the sharp selloff earlier this month. BTC price briefly reclaimed the zone before slipping back underneath it.

Momentum indicators remain mixed. The daily RSI has recovered from oversold territory but remains below the neutral 50 mark, while the MACD continues to trade beneath its signal line despite narrowing bearish momentum.
On the four-hour chart, Bitcoin has also fallen back below the 61.8% Fibonacci retracement level near $65,016 after failing to sustain a breakout above the 50% retracement around $66,829.
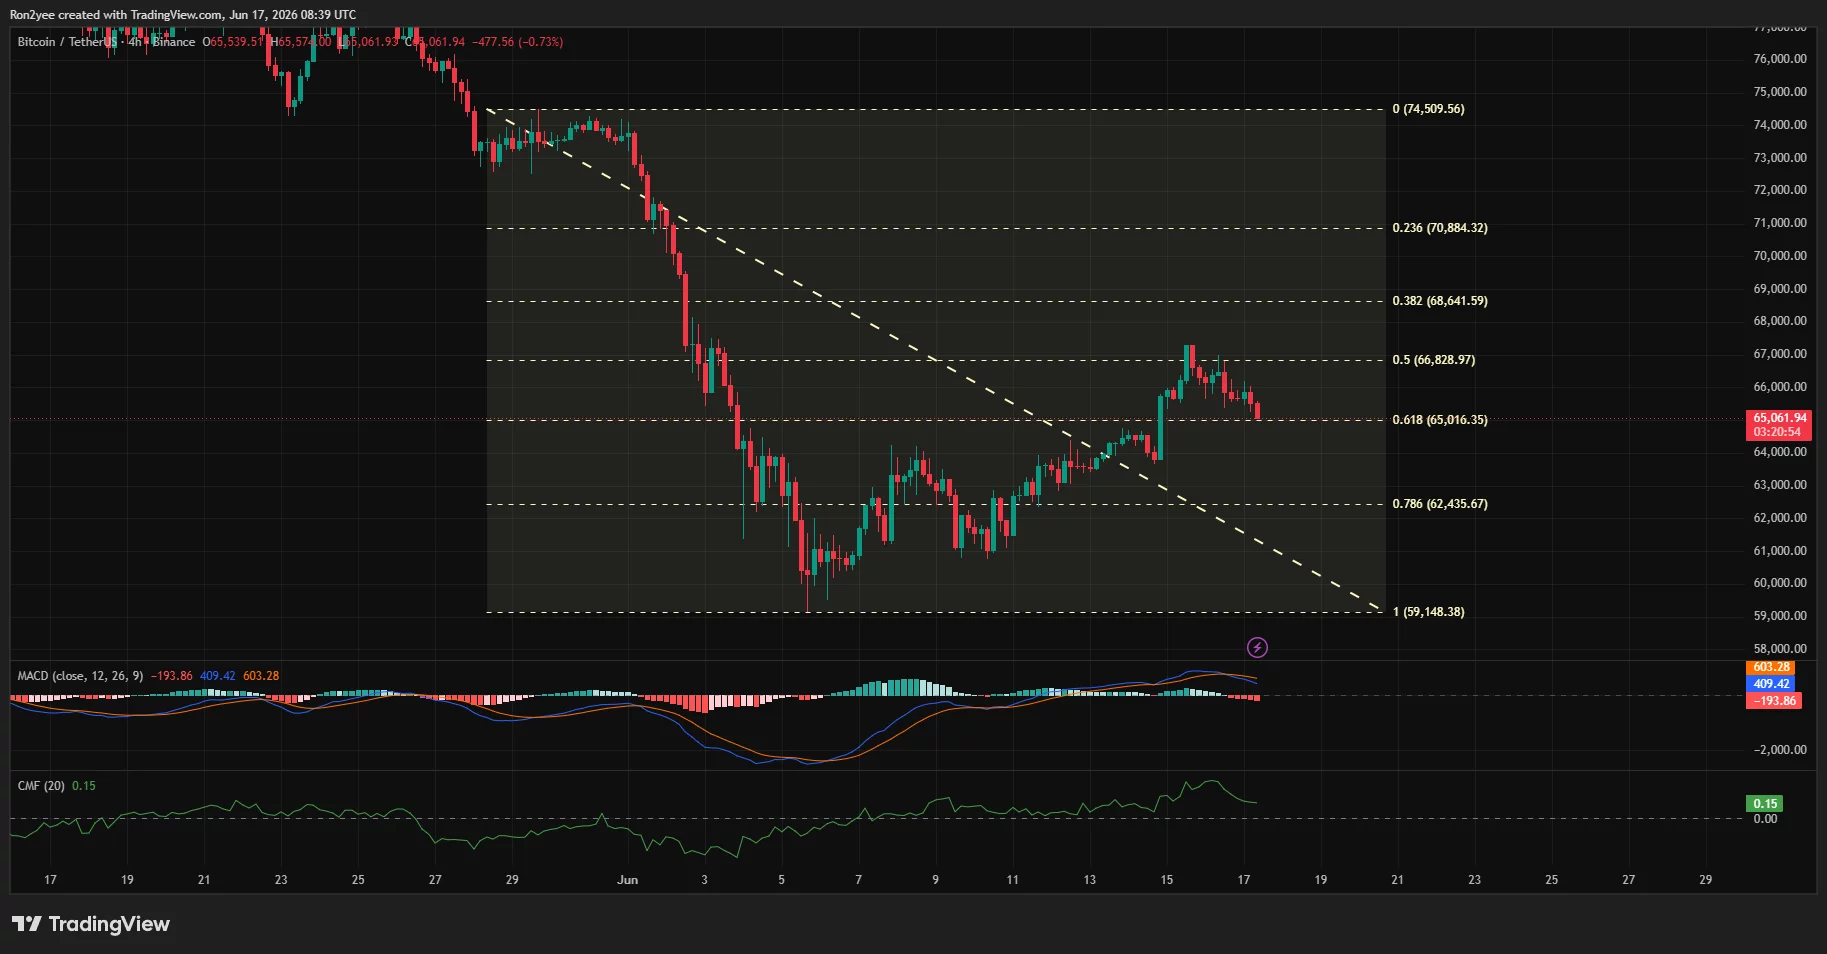
According to analyst Kamile Uray, the market is now closely watching whether support around $63,700 can hold.
“In deep declines, we will be tracking the 60000 level. This level must be held. Otherwise, the decline deepens further.”
On the positive side, Uray added that $67,500 remains the first major resistance zone, while a sustained move above $74,500 would be required to restore a stronger bullish structure.
Meanwhile, CoinGlass liquidation heatmaps show a dense concentration of leveraged positions sitting above current prices. Commenting on the setup, crypto analyst Daan Crypto Trades noted that “$68K is the biggest one to watch in the short term,” adding that the largest liquidity clusters now sit above the market after Bitcoin swept liquidity beneath $60,000 earlier this month.
Fed guidance and Middle East tensions could determine the next move
Macro developments remain the primary risk factor heading into the Fed announcement.
While falling oil prices have eased some inflation concerns, geopolitical uncertainty has persisted after Iran accused Israel of violating a Lebanon truce dozens of times and warned of a “harsh response” if attacks continue.
Tehran has also linked any final agreement with Washington to sanctions relief, the release of frozen assets, and an Israeli withdrawal from Lebanon.
The combination of Fed uncertainty, geopolitical risks, and persistent institutional caution has kept Bitcoin below major resistance despite recovering from its June lows.
A break above $68,000 could expose the next liquidity zones near $74,000 and $78,000, where large concentrations of leveraged positions remain.
On the downside, losing support around $63,700 would place renewed focus on $60,000. A decisive move below that level could open the door toward the $55,000–$50,000 region highlighted by several market analysts.
Disclosure: This article does not represent investment advice. The content and materials featured on this page are for educational purposes only.

XRP price traded near $1.20 on June 17 as buyers tried to hold a narrow support zone while ETF inflows and spot demand improved.
Summary
- XRP price now sits near $1.20 as ETF inflows return but momentum remains fragile.
- Spot demand has improved, yet Binance perpetual selling shows traders still lean against the rebound.
- Support near $1.19 and $1.14 now decides whether XRP can retest higher resistance levels next.
According to crypto.news market data, XRP fell 3.29% over 24 hours, with trading volume at $1.76 billion. The token ranged between $1.20 and $1.25, while its market cap stood at about $74.45 billion.
XRP price holds $1.20 as ETF inflows return
The latest pullback came after XRP briefly pushed above $1.26 and reached as high as $1.2996, according to levels tracked by analyst EGRAG Crypto. He said the next task is to see whether XRP can turn old resistance into new support.
EGRAG wrote that holding above $1.19 keeps the “structure remains bullish,” while a move below that level could open a retest of lower support. He also said a loss of $1.14 would weaken the setup again.
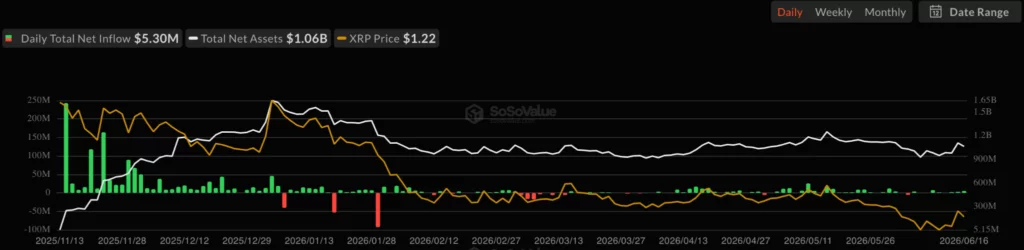
ETF flows remain a key support factor. XRP products recorded a second straight week of inflows, adding $10.68 million and lifting cumulative inflows near $1.44 billion.
Daily flows also improved. According to SoSoValue, XRP products added $5.30 million on June 16, up from $2.82 million on June 15. Total net assets still slipped to $1.06 billion from $1.11 billion, showing that price weakness offset some demand.
As previously reported by crypto.news, XRP-linked products had already outpaced Bitcoin and Ethereum funds for five straight weeks. That demand has not stopped the chart from staying weak, but it has helped keep XRP above the deeper $1.10 area.
Spot demand clashes with Binance short pressure
CryptoQuant analyst Amr Taha said XRP reclaimed $1.20 while spot cumulative volume delta rose to $267.4 million, its highest level since mid-May. He said the same metric stood near negative $177 million on April 12.
The reading suggests spot buyers have returned across exchanges. That matters because spot buying reflects direct demand for XRP, not only leveraged trading.
The derivatives market tells a different story. Taha said Binance perpetual CVD fell to a record low near negative $792.5 million, down from about negative $218 million on May 12.
This means Binance perpetual traders kept selling even as spot demand improved. With open interest near $251 million, leverage has not fully left the market. If spot buyers keep absorbing that pressure, short positions may face stress. If demand fades, the same setup may increase downside risk.
Moreover, BankXRP also pointed to a deposit and withdrawal pattern on Binance. The analyst said XRP printed the same exchange flow signal that appeared near the last two cycle bottoms, though he warned the sample size is small.
Technical setup keeps XRP inside the range
Bollinger Bands show XRP trading near the middle band. Price was near $1.1957, close to the middle band around $1.1948, while the upper band sat near $1.3471 and the lower band near $1.0425.
That position shows XRP is not at a clear volatility extreme. The bands also look compressed compared with earlier moves, which points to consolidation rather than a confirmed breakout.
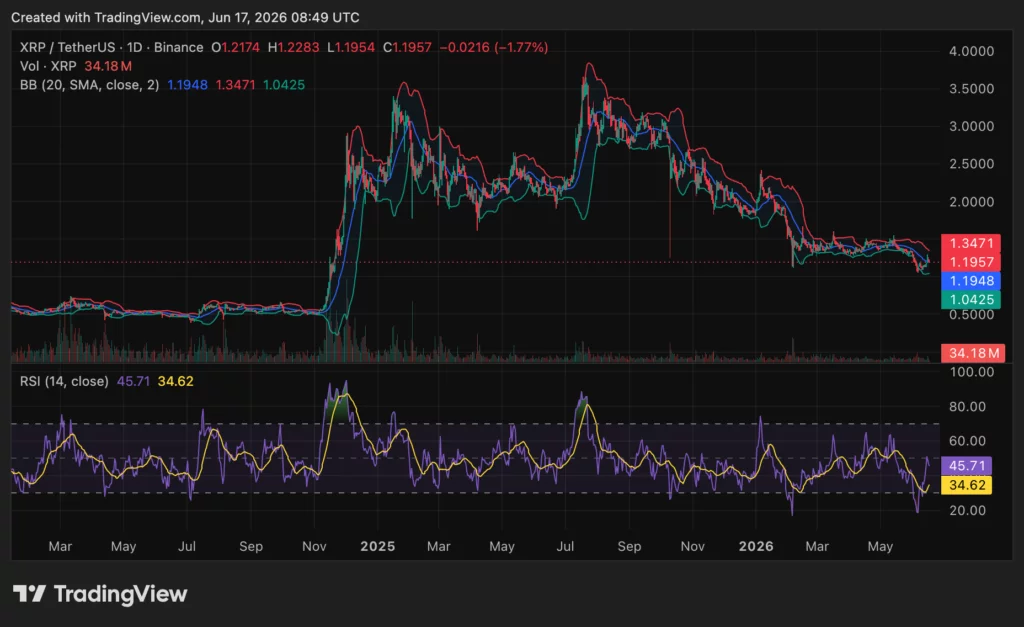
A move toward the upper band near $1.35 would show better strength. A rejection from the middle band would keep XRP range-bound and leave sellers in control of short-term direction.
The RSI stood at 45.71, still below the neutral 50 level. Its moving average was near 34.62, meaning downside pressure has eased, but momentum has not fully turned positive.
Key XRP levels decide the next move
EGRAG’s daily map places $1.11 as the survival zone, $1.21 as first strength, and $1.28 as the next level where structure improves. He said $1.35 to $1.38 would show stronger buyer control, while $1.51 remains the major breakout area.
That view matches the current range. XRP must hold $1.19 first, then reclaim $1.28 and $1.35 before a wider recovery can gain force. A break below $1.14 would put $1.11 and $1.05 back in focus.
As crypto.news reported earlier, XRP had already faced pressure near $1.14 after ETF outflows and whale selling weakened the market in early June. More recent coverage also noted that whale accumulation and $1.30 resistance remain key factors after the latest rebound.
The market now has two competing signals. ETF inflows and spot CVD point to demand, while weak RSI, compressed Bollinger Bands, and heavy Binance short pressure show caution.
Disclosure: This article does not represent investment advice. The content and materials featured on this page are for educational purposes only.

The US dollar remains well supported against most major currencies, although the next phase of its movement will largely depend on the outcome of the Federal Reserve meeting. Investors are adopting a cautious stance ahead of the interest rate decision, the release of updated FOMC economic projections, and Jerome Powell’s press conference. Particular attention will be paid to policymakers’ forecasts, as these could reshape expectations regarding the number of potential rate cuts before the end of the year.
Market participants will also focus on a fresh batch of US economic data. Today’s retail sales figures are expected to provide further insight into the strength of consumer demand in the United States. Investors will also monitor Canada’s New Housing Price Index ahead of the Fed decision. While the Fed is widely expected to leave rates unchanged, the key driver for markets will be any signals regarding the future path of monetary policy and the timing of possible rate cuts.
USD/JPY
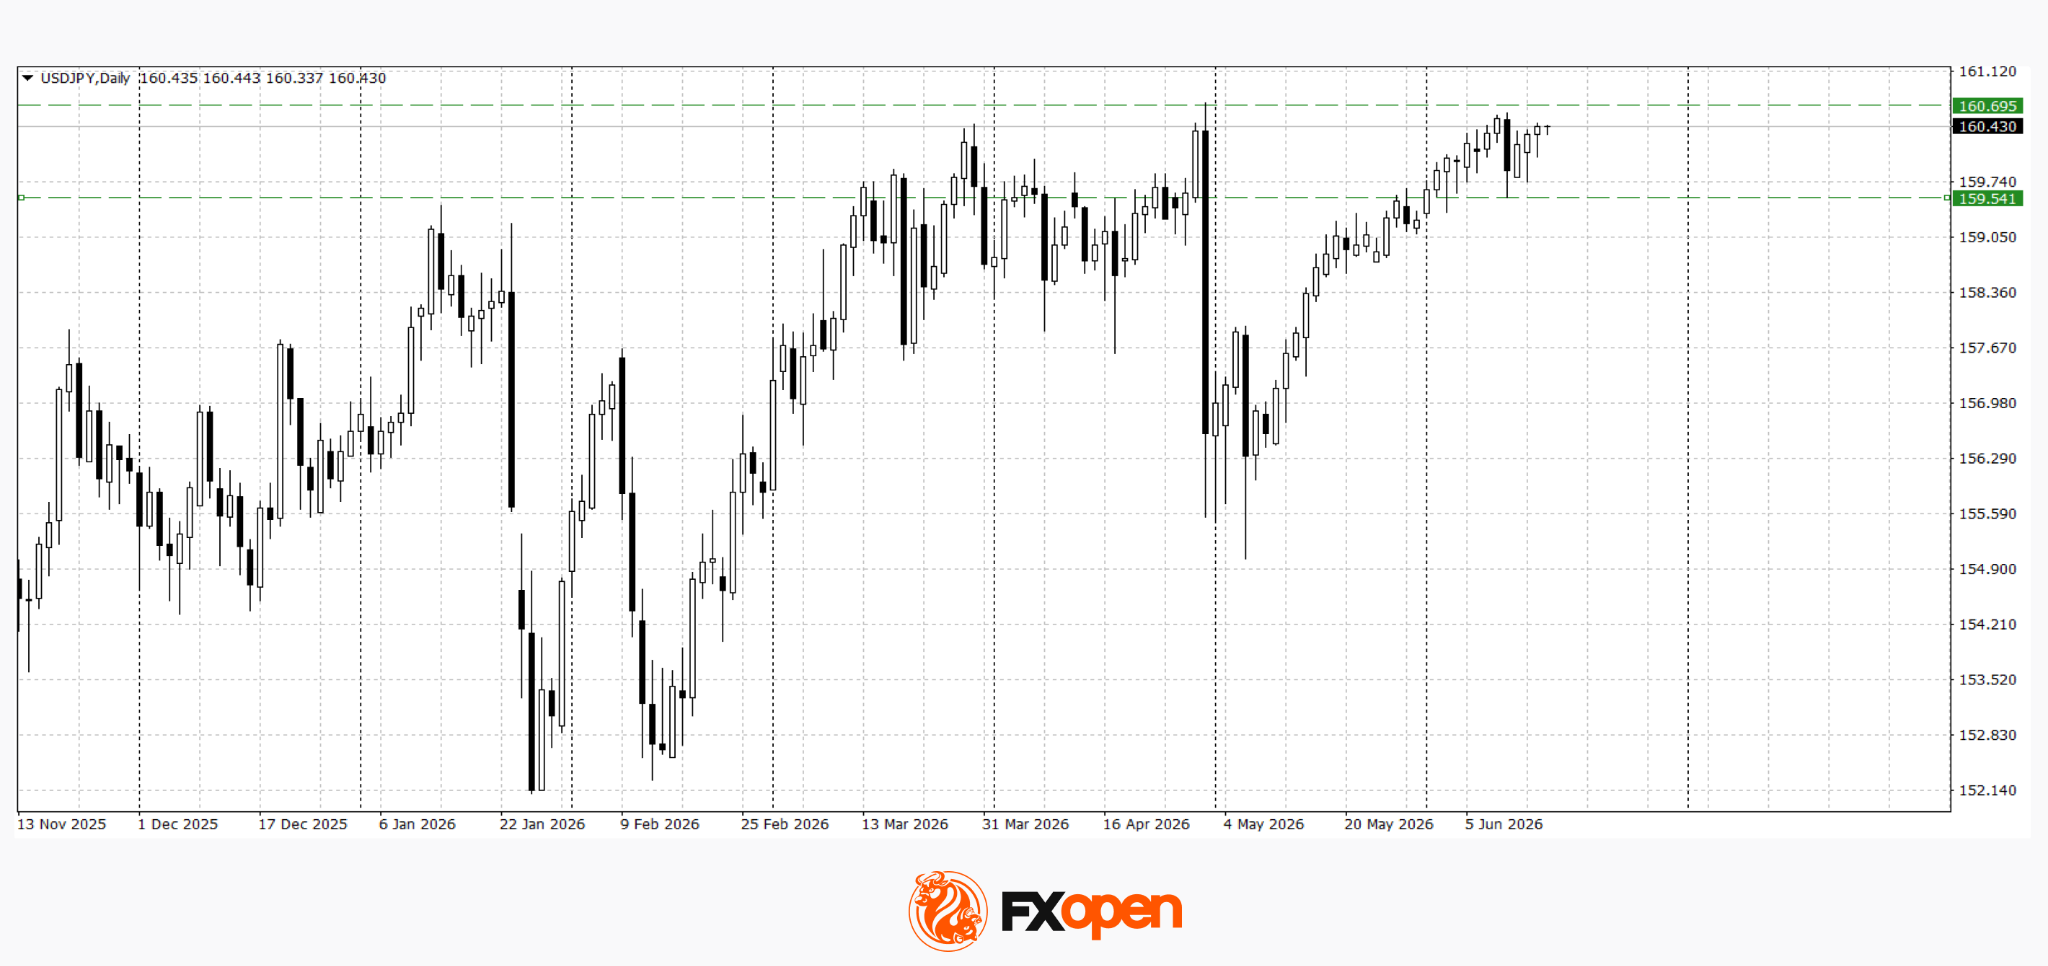
Sellers in USD/JPY managed to trigger a correction towards 159.50 last week. However, they failed to develop a sustained downward move, and the pair is once again trading above 160.00. Technical analysis of USD/JPY points to range-bound trading within the 159.50–160.70 corridor. It appears that investors require clearer guidance from the Fed regarding the future direction of monetary policy.
Key events for USD/JPY:
- Today at 15:30 (GMT+3): US Core Retail Sales;
- Today at 16:30 (GMT+3): speech by US President Donald Trump;
- Today at 21:00 (GMT+3): Federal Reserve interest rate decision.
USD/CAD
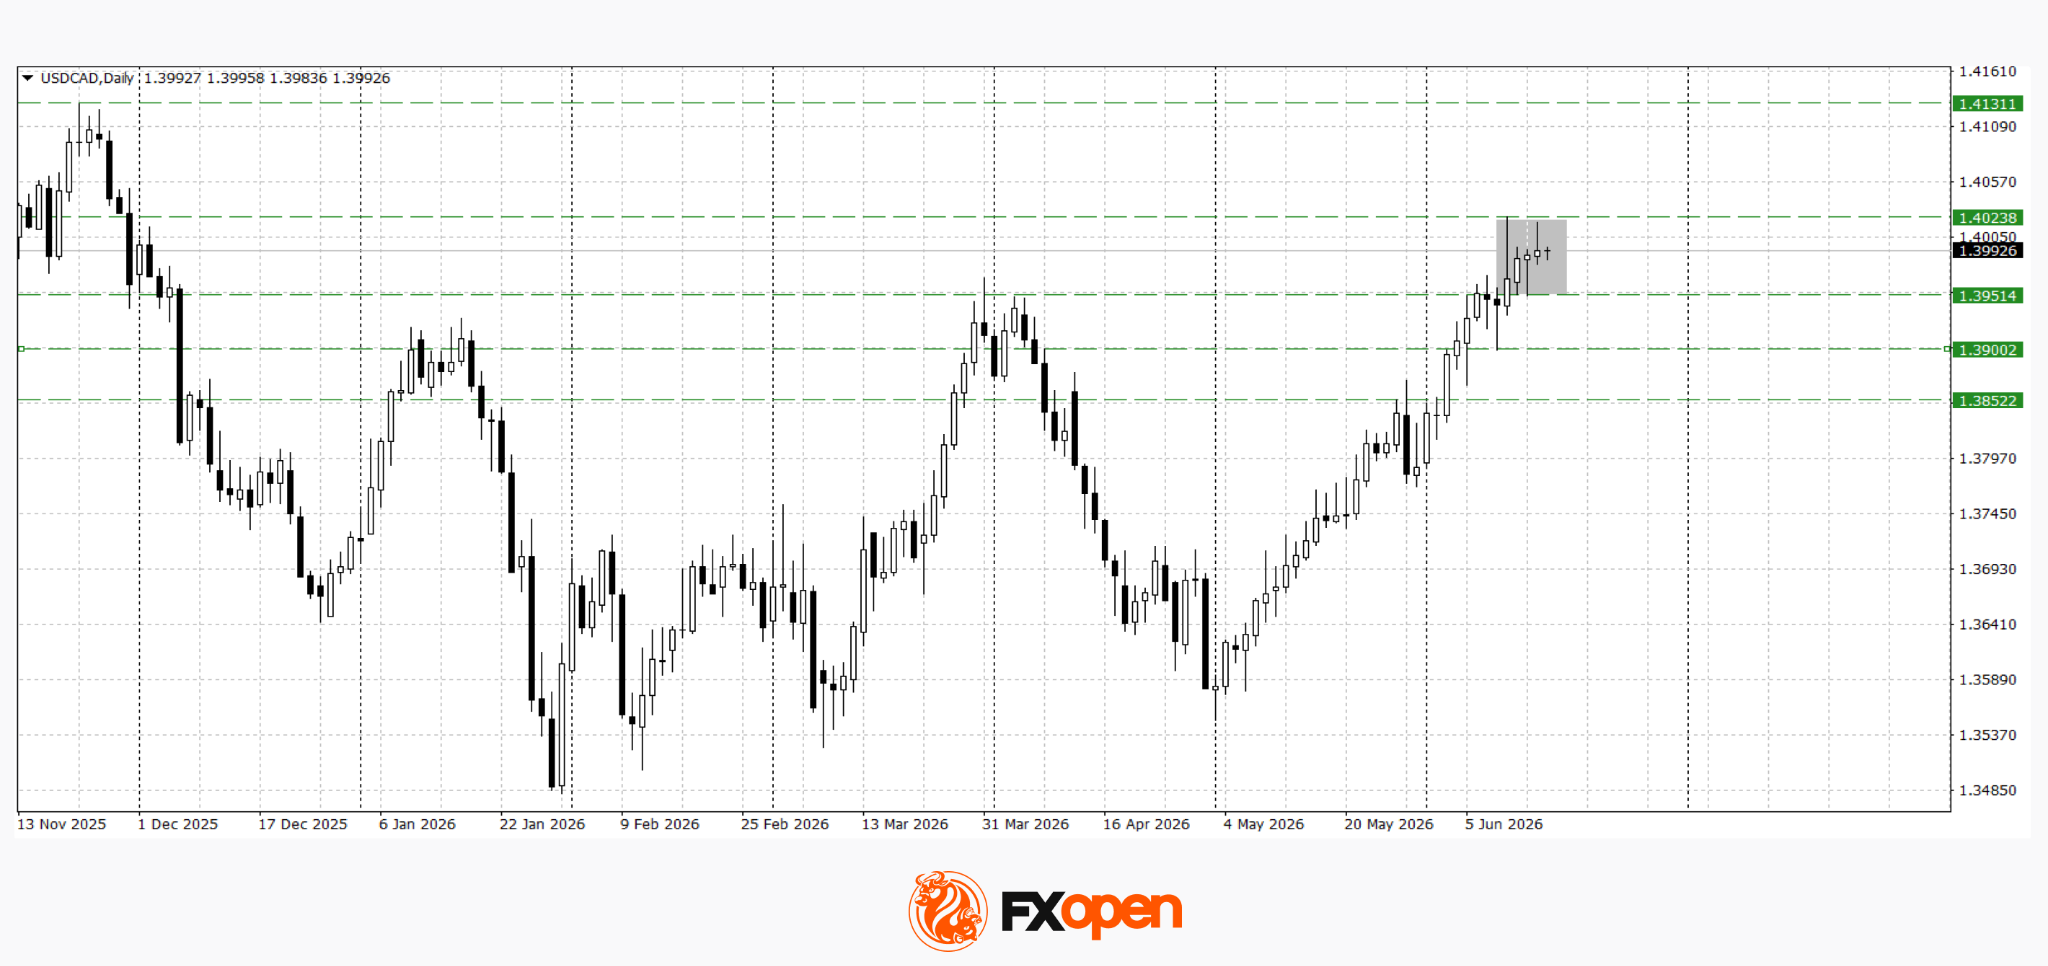
USD/CAD reached fresh yearly highs last week and tested the psychological resistance level at 1.4000. Following the breakout above the year’s previous peak, the pair has entered a consolidation phase within the 1.3950–1.4020 range. A sustained move below 1.3950 could trigger a corrective decline towards the 1.3850–1.3900 area. Conversely, a decisive break and close above 1.4000 could pave the way for further gains towards the next significant resistance zone near 1.4130.
Key events for USD/CAD:
- Today at 15:30 (GMT+3): Canada New Housing Price Index;
- Today at 17:30 (GMT+3): US Crude Oil Inventories;
- Tomorrow at 15:30 (GMT+3): Canada Raw Materials Price Index (RMPI).
The dollar remains close to important technical levels against both the Japanese yen and the Canadian dollar, but the next directional move is likely to be determined by the outcome of the Federal Reserve meeting. Should the Fed maintain a hawkish tone and reaffirm its cautious approach to rate cuts, USD/JPY and USD/CAD may extend their gains and attempt to break through current resistance levels. A more dovish message from Powell, however, could encourage profit-taking in the dollar and lead to a corrective pullback following the strong rally seen in recent weeks.
Trade over 50 forex markets 24 hours a day with FXOpen. Take advantage of low commissions, deep liquidity, and spreads from 0.0 pips (additional fees may apply). Open your FXOpen account now or learn more about trading forex with FXOpen.
This article represents the opinion of the Companies operating under the FXOpen brand only. It is not to be construed as an offer, solicitation, or recommendation with respect to products and services provided by the Companies operating under the FXOpen brand, nor is it to be considered financial advice.

Bitcoin (BTC) risked wiping out its Iran truce gains and returning toward the $60,000 psychological support as the Bank of Japan (BoJ) raised its interest rates to their highest level in 30 years.
Key takeaways:
- BTC has averaged a 5.74% decline in the 30 days after the last four BoJ rate hikes.
- A repeat of previous post-hike drawdowns puts Bitcoin’s downside range between $62,700 and $56,700.
Previous BOJ hikes warn of 30-day Bitcoin losses
On Tuesday, the BoJ raised its short-term policy rate by 25 basis points to 1.0% on June 16, marking Japan’s highest interest-rate level since 1995.
The move came as policymakers responded to persistent inflation risks from higher energy costs and lingering Middle East supply disruptions.
Bitcoin dropped by nearly 2.5% from its local high at $67,250, but was maintaining its June gains. Its historical performance after BoJ rate hikes, however, points to downside risks.
In the 30 days after the last four BOJ hikes, Bitcoin averaged a 5.74% decline. BTC fell 5.59% after the March 2024 hike, 10.89% after the July 2024 hike, and 14.77% after the January 2025 hike.
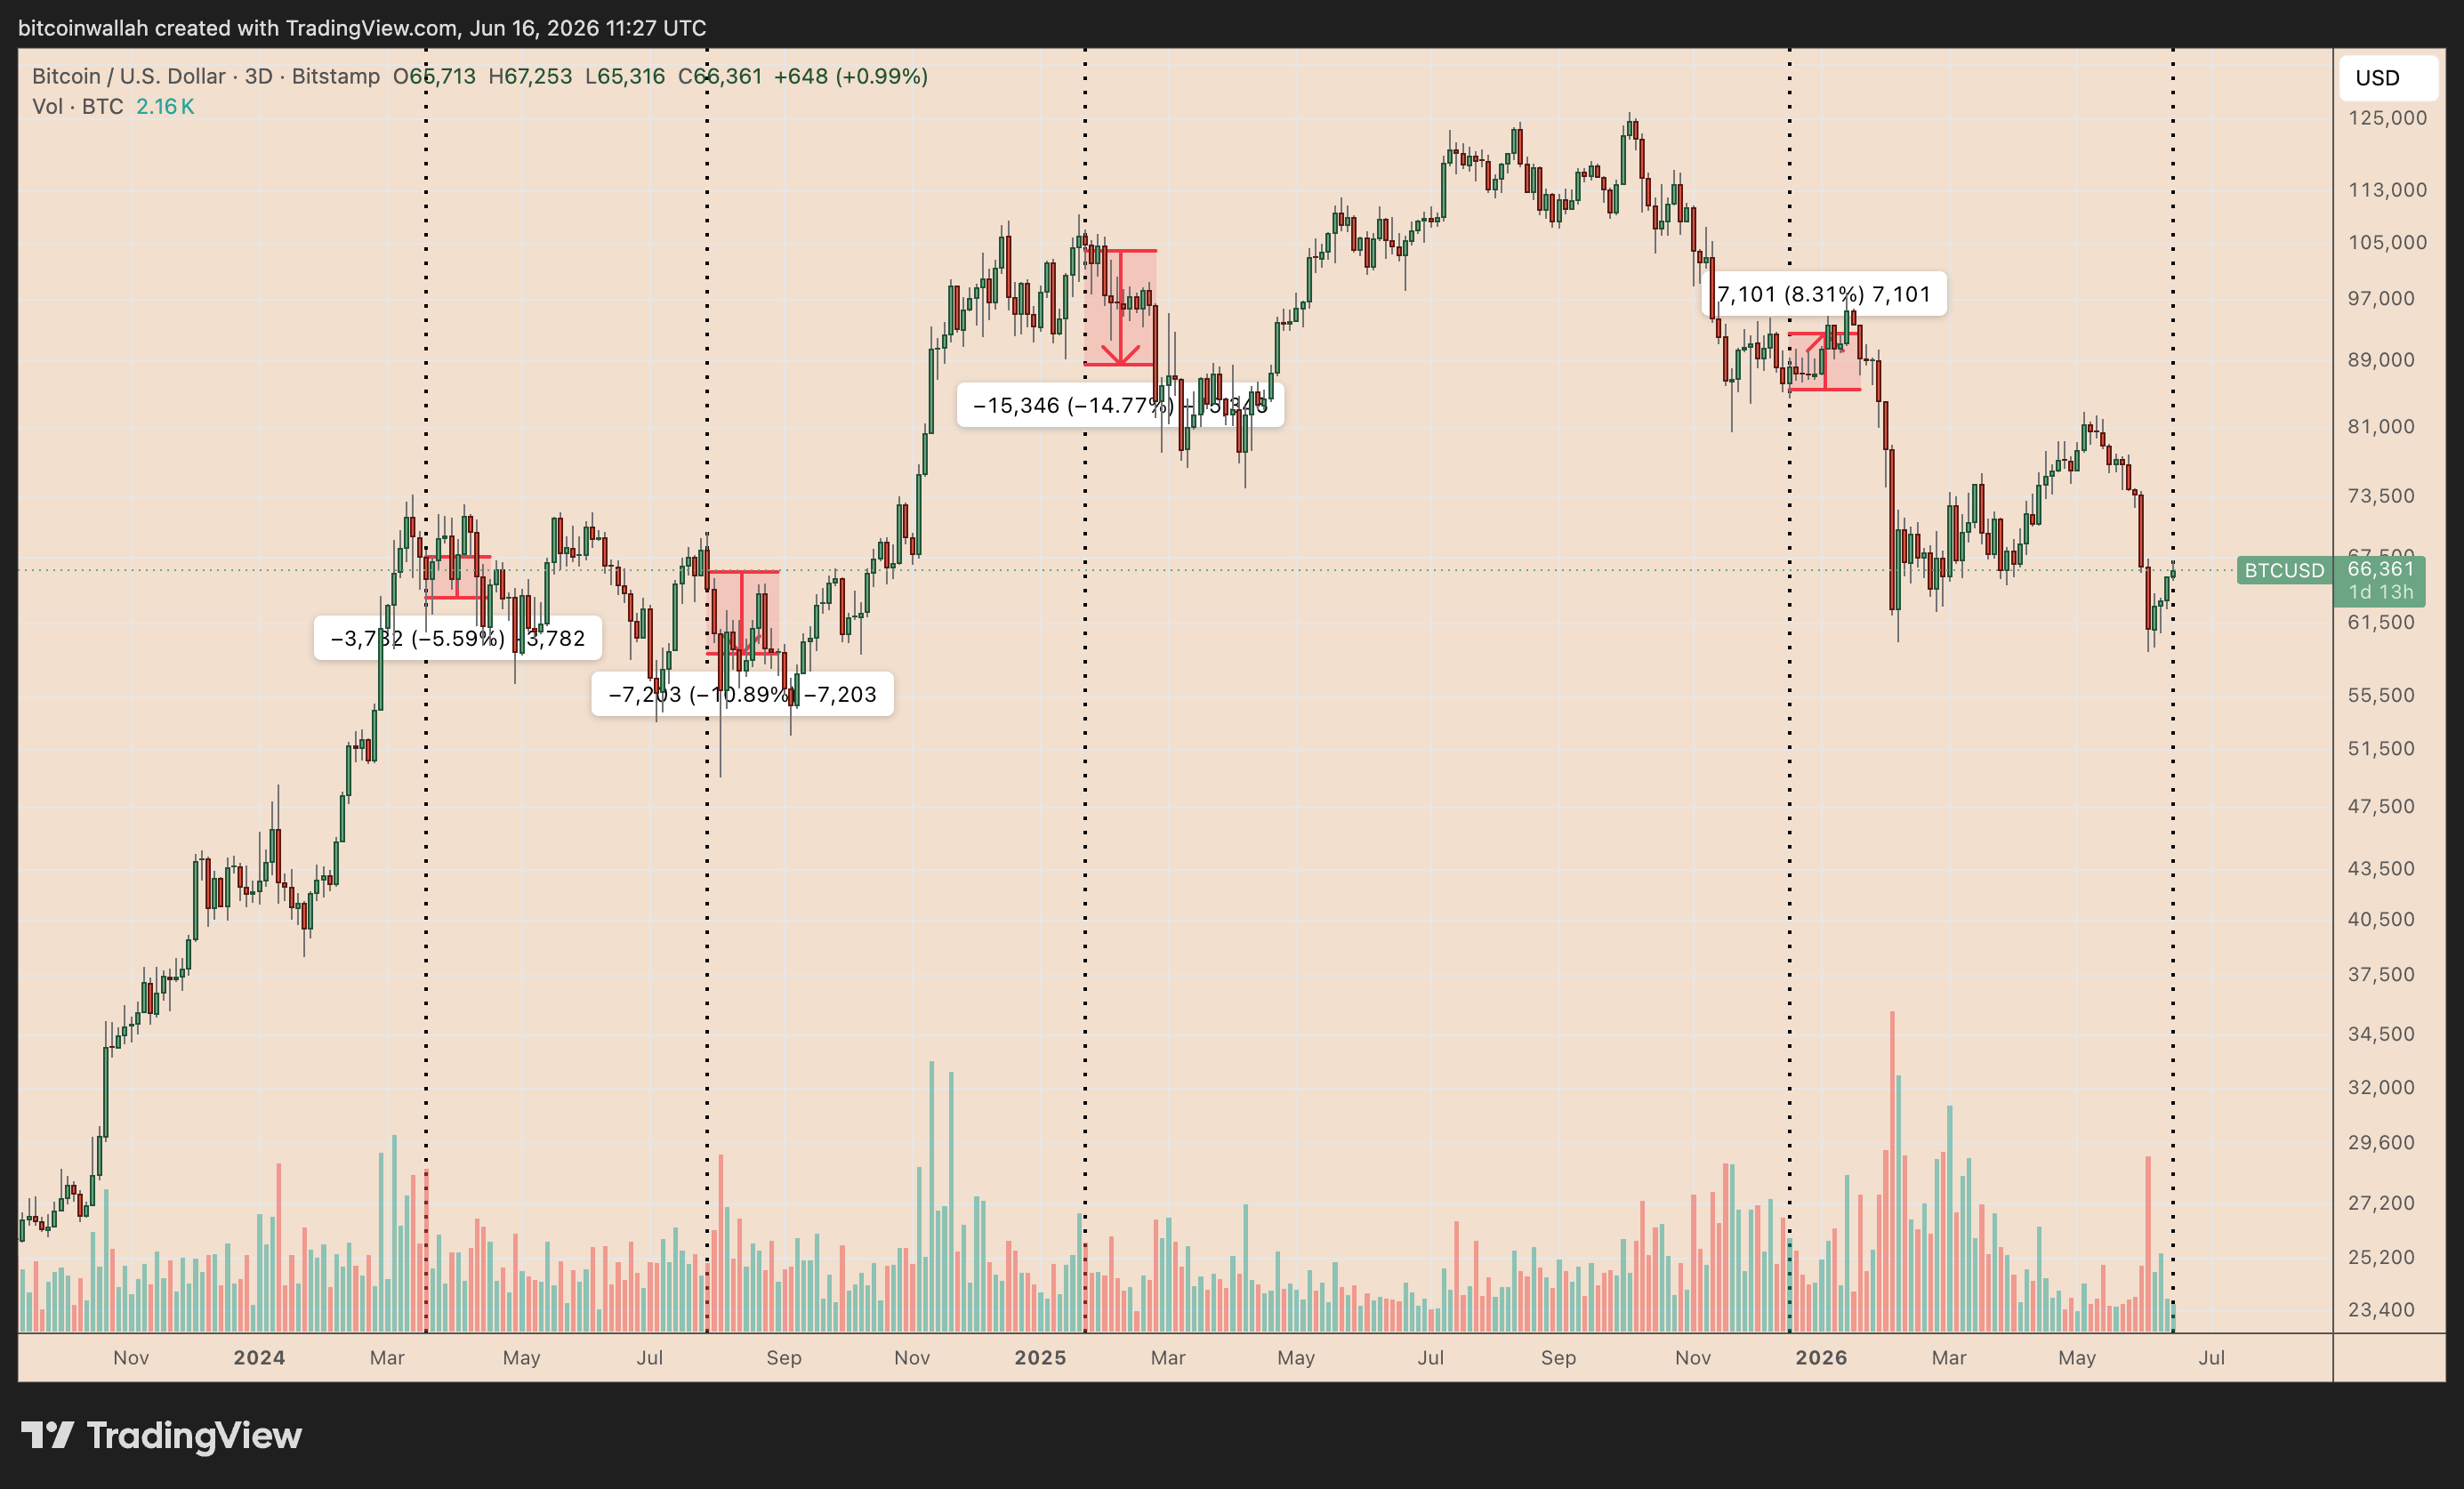
BTC/USD three-day chart. Source: TradingView
The only positive case came after the December 2025 hike, when BTC gained 8.31% over the following 30 days. However, that rebound followed Bitcoin’s sharp correction from its October 2025 peak, suggesting the market was already deeply oversold before the BoJ decision.
Applying Bitcoin’s average 5.74% post-BoJ decline to its current price near $66,500 puts the downside target near $62,700, just above the $59,000–$62,000 demand zone (red area in the chart below).
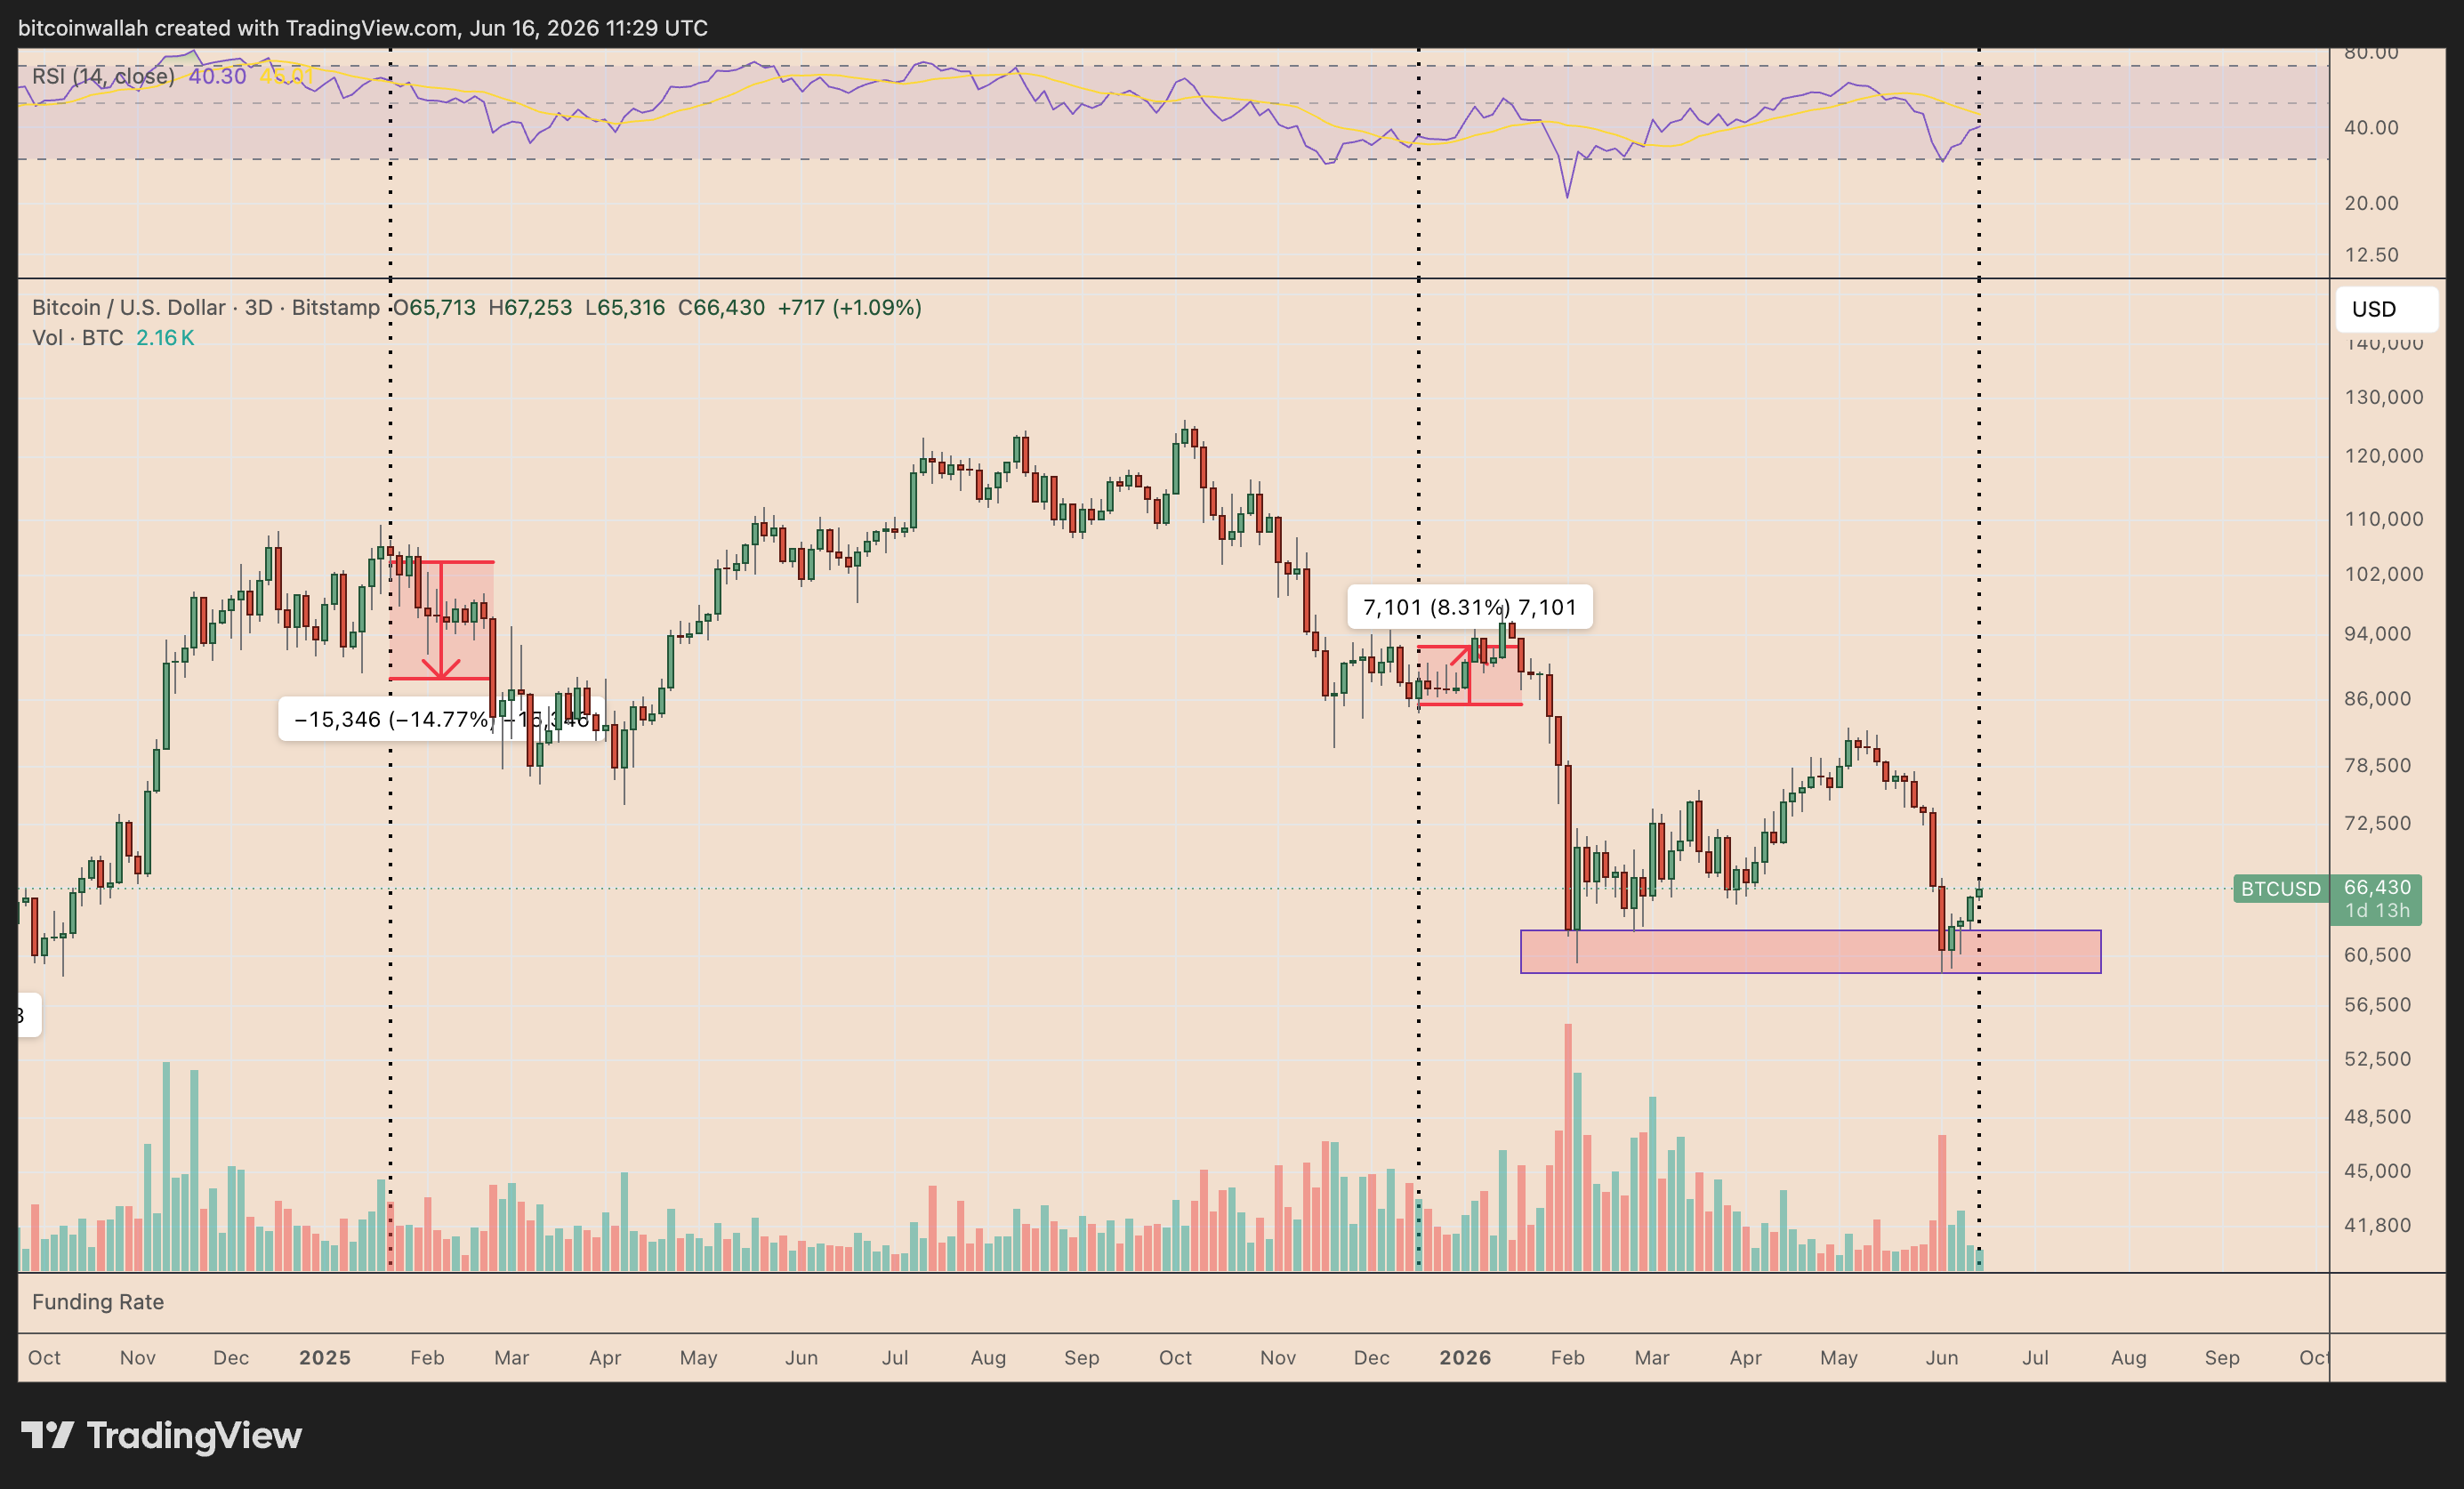
BTC/USD three-day chart. Source: TradingView
A sharper pullback matching the July 2024 post-hike drop would send BTC toward $59,200, while a repeat of January 2025’s decline would imply a fall to $56,700.
Broader post-BoJ drawdown phases have been even steeper, with Bitcoin losing between 26% and 38% after Japan’s rate decisions since March 2024, a chart shared by crypto analyst Gerla shows.
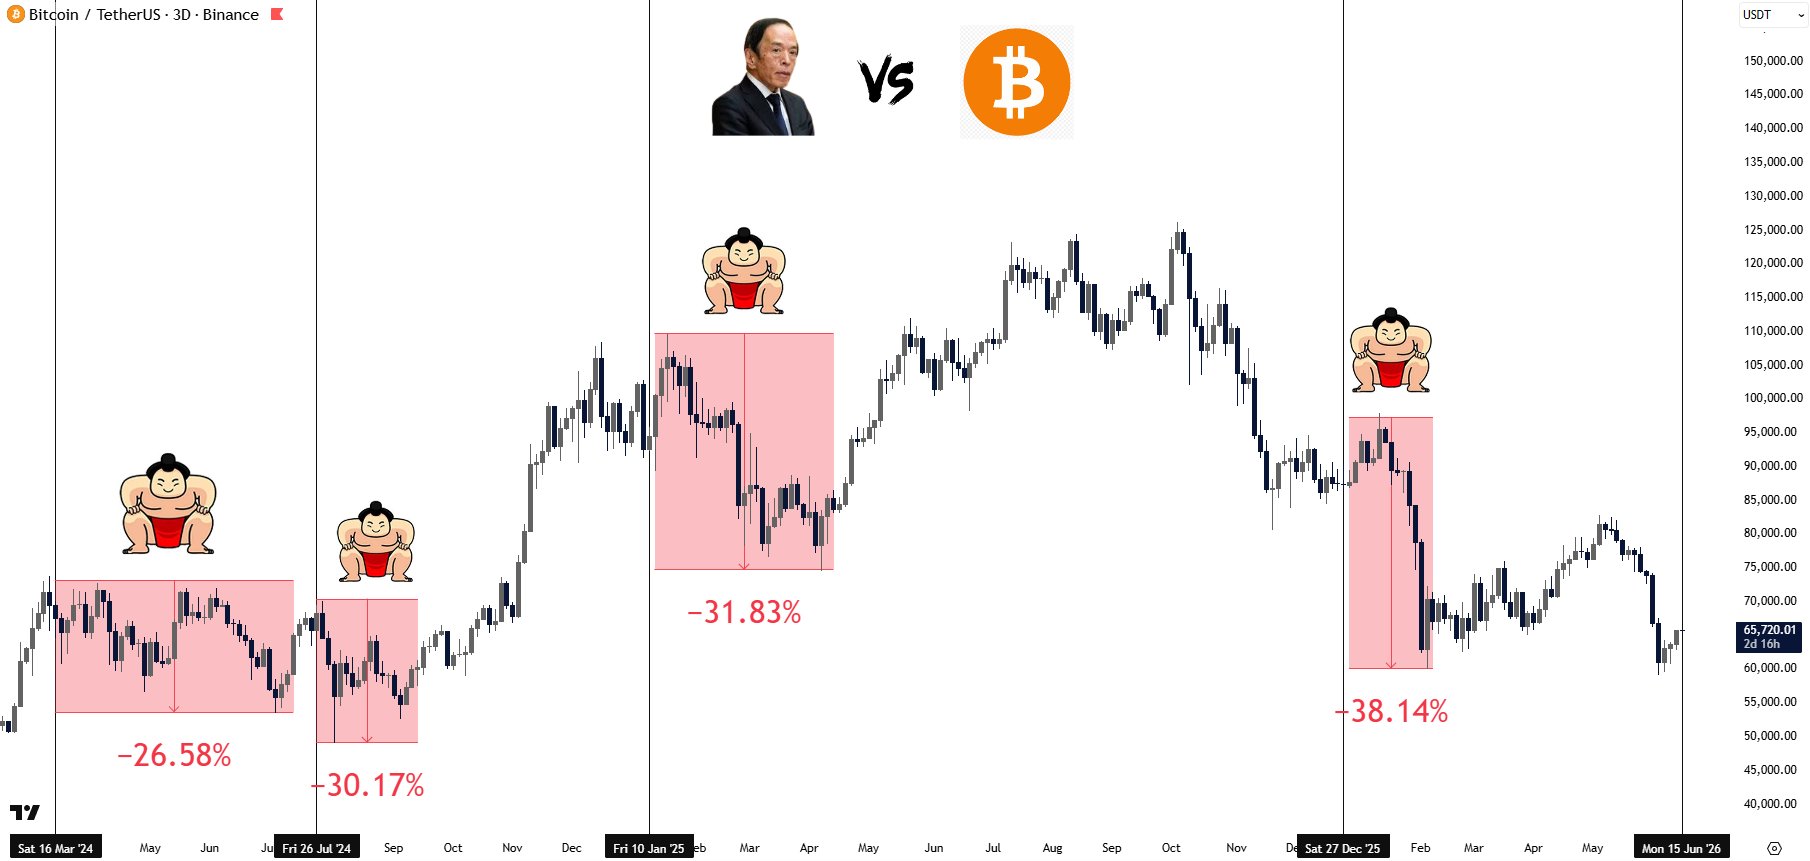
BTC/USDT three-day chart. Source: TradingView/Gerla
BOJ hikes have often arrived near US recessions
BoJ rate-hiking cycles have historically coincided with US recessions, with the COVID shock being the main exception, noted André Dragosch, European head of research at Bitwise, in a Tuesday post.
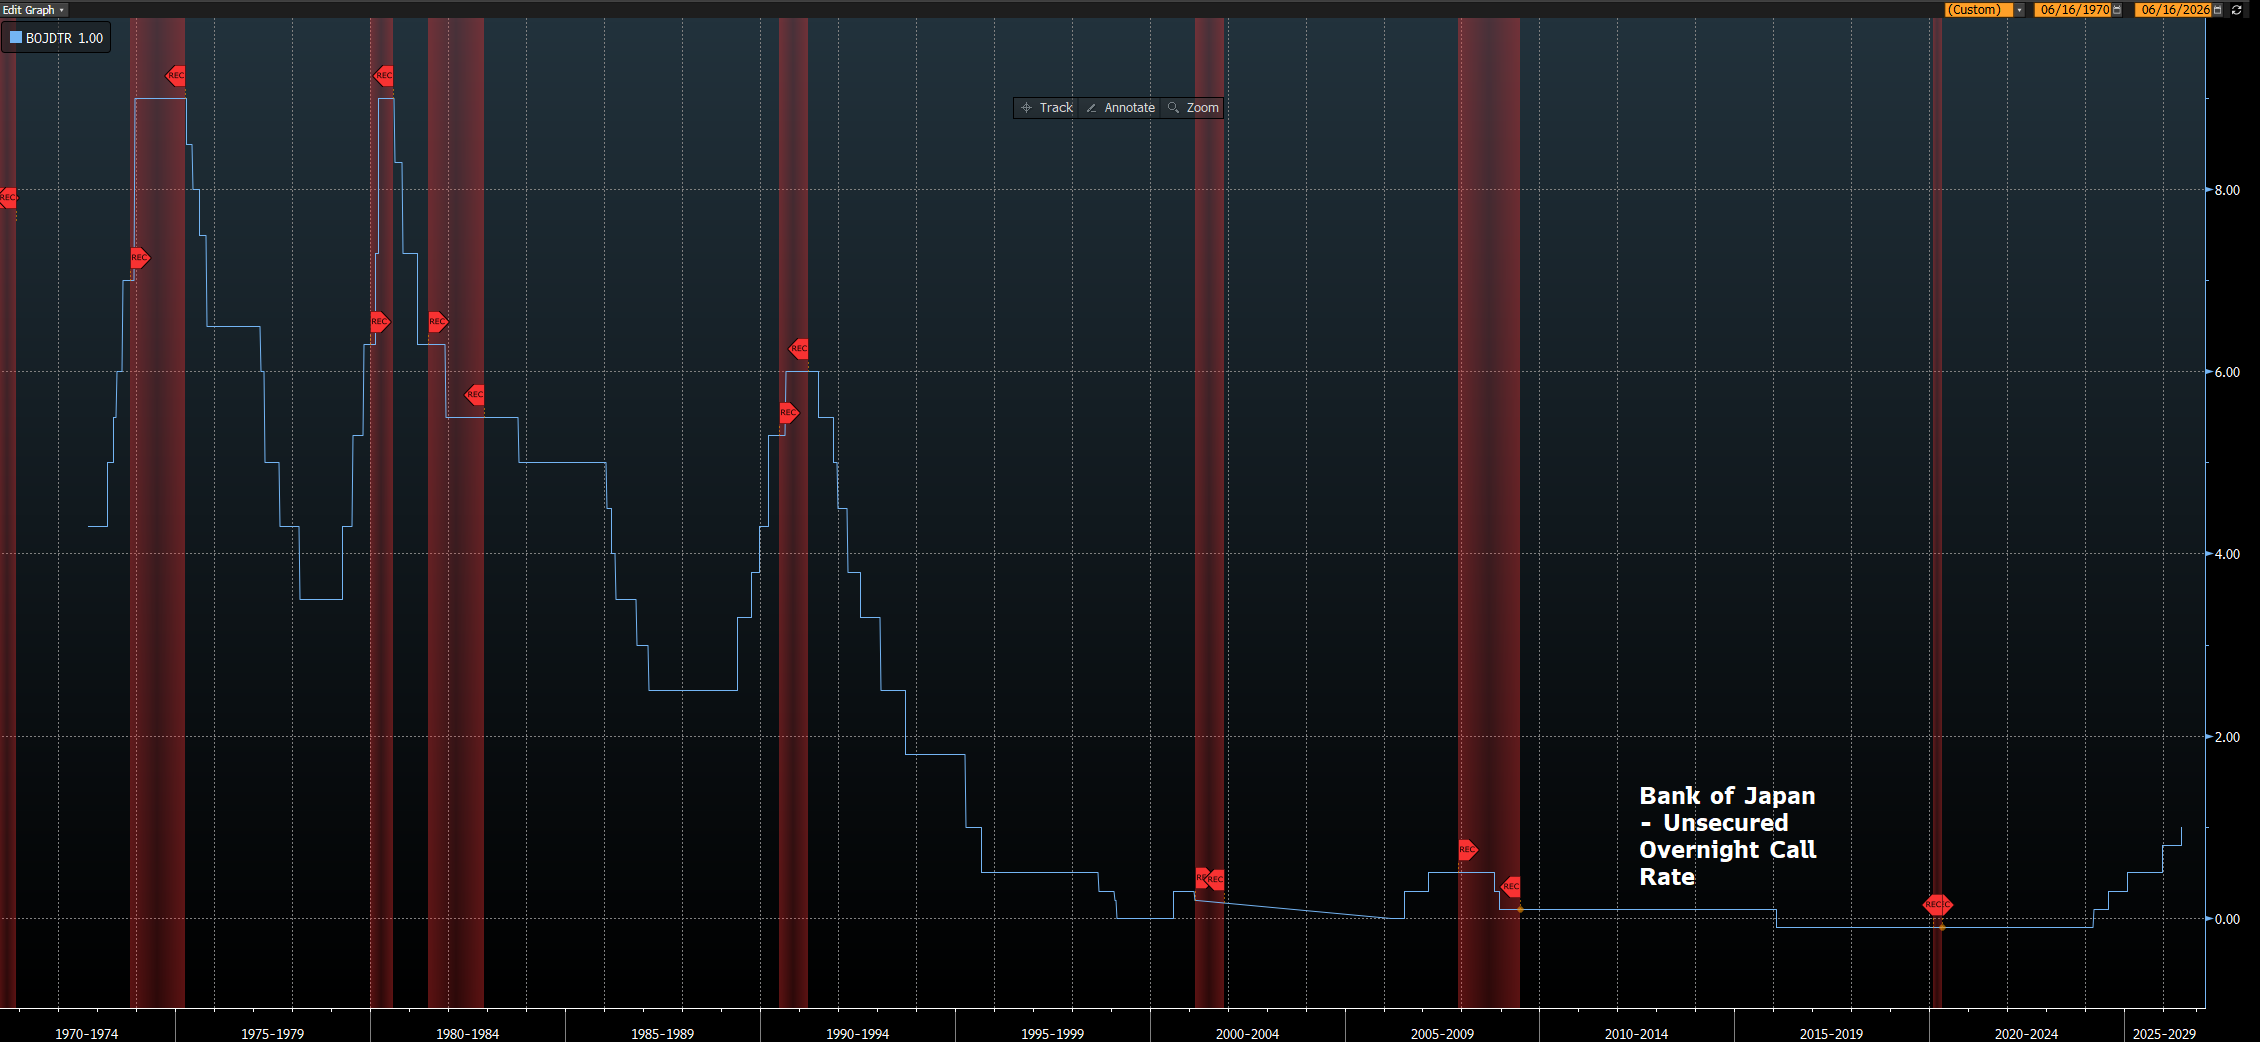
BoJ’s unsecured overnight call rate vs. US recession periods. Source: Bloomberg Terminal/André Dragosch
The pattern suggests the BoJ often tightens policy late in the global cycle, when inflation pressure is already high, and liquidity conditions are becoming less supportive for risk assets.
Japan has been a key source of cheap money for global markets for years.
When Japanese rates were near zero, traders could borrow yen at low cost and use that money to buy riskier assets elsewhere, including stocks and crypto. But as Japan raises rates, that trade typically becomes less attractive.
Related: Bitcoin recovery rests on US-Iran deal as momentum remains weak
Some traders may then cut their borrowed positions to reduce risk. That can hurt assets like Bitcoin, which often falls harder when global investors become more cautious.
The recent price uptick in the cryptocurrency market has given some traders, including Andrew Tate, wings.
Despite his rather unsuccessful history with futures trading, the British-American social media personality and businessman has opened another major long, according to data shared by Lookonchain.
The analysts at the monitoring resource have counted 107 times in which Tate has been liquidated in the past. His new bitcoin long position is for 57.36 BTC, worth around $3.76 million.
However, the potential liquidation price is close by, at $65,216. The cryptocurrency currently trades around $65,500, and if it dips by just $300, Tate would need to act fast and provide further collateral to avoid getting wrecked again.
Andrew Tate (@Cobratate), who’s been liquidated 107 times, is back!
He opened a 40x long on 57.36 $BTC($3.76M).
Liquidation price: $65,215.87https://t.co/qqJ28jICWS pic.twitter.com/Iyq3WIUSny
— Lookonchain (@lookonchain) June 17, 2026
Aside from his unsuccessful past with futures trading, which once left him wiped out within an hour of opening a BTC long, Tate has quite the controversial history with the broader cryptocurrency industry.
A few years ago, he launched his own meme coin called DADDY, which was a direct competition to Iggy Azalea’s MOTHER. However, reports quickly raised the alarm, suggesting that many of Tate’s claims about the token are incorrect and hinting at potential insider trading.
Current data from CoinGecko shows that DADDY trades at $0.0085, down by 97% from its all-time high.
The post After 107 Liquidations, Andrew Tate Is Back With Big Bitcoin Bet appeared first on CryptoPotato.

Hanging Man Candlestick Pattern Explained

The House | Regenerate the coast: let development corporations borrow outside the fiscal rules

LIVE: 2026 PBA Commissioner’s Cup Finals Game 7


-

 Business3 days ago
No Jackpot Winner as $257 Million Prize Rolls Over to $269 Million Monday Draw
-

 Crypto World6 days ago
Oppenheimer backs SpaceX as $70 billion retail frenzy builds
-

 Fashion5 days ago
Weekend Open Thread: Tuckernuck – Corporette.com
-

 Crypto World6 days ago
Markets Rally as SpaceX IPO Looms Amid Iran Tensions and Inflation Surge
-
 Crypto World2 days ago
Zimbabwe Requires Crypto Businesses to Register Annually Under New FIU Regulations
-

 Tech4 days ago
NanoClaw integrates JFrog registries to secure AI agent downloads
-

 Tech5 days ago
This Week In Security: Microsoft On Microsoft, Register Your Domains, Linux On ARM, And FreeBSD Joins The File Cache Club
-

 Crypto World4 days ago
Bitget enters Argentina’s regulated crypto market through PSAV registration
-
 Tech6 days ago
Dutton Ranch star claims they ‘didn’t see any disruption’ on set following Chad Feehan’s exit from Yellowstone spinoff fueled by Taylor Sheridan clash rumors
-

 NewsBeat5 days ago
El Nino has formed in the Pacific and could set records, forecasters say
-

 Politics6 days ago
Politics Home | Healey Resignation Is “Colossal Failure Of Government”, Says Former Labour Defence Secretary
-
 Entertainment6 days ago
Donnie Wahlberg & More Heat Up Las Vegas at Circa’s Barry’s Downtown Prime
-
 Tech6 days ago
Opendoor Ends India Operations, Fueling a Bigger Conversation About AI and Outsourcing
-

 Sports6 days ago
First Time Since 1971: Australia Register Historic Low In ODI Cricket
-

 Politics6 days ago
Belfast burns, while Met chief points finger at Iran and Russia
-

 Business6 days ago
AT&T: Verizon's 27% Outperformance Sets Up A Solid Entry Point
-

 NewsBeat5 days ago
FBI searches office of Ohio voter registration group
-
 Tech5 days ago
Anthropic is spending $150M to embed 1,000 AI fellows inside nonprofits. No degree required.
-

 Politics6 days ago
Modi thanks Trump for wishes as US attacks Indian seafarers
-
 Entertainment5 days ago
‘The Pitt’s Fan-Favorite Doctor Confirms Noah Wyle Gave His Blessing to Return [Exclusive]
You must be logged in to post a comment Login