

Crypto World
Fed Chair Warsh expected to withhold ‘dot’ from central bank’s interest rate outlook
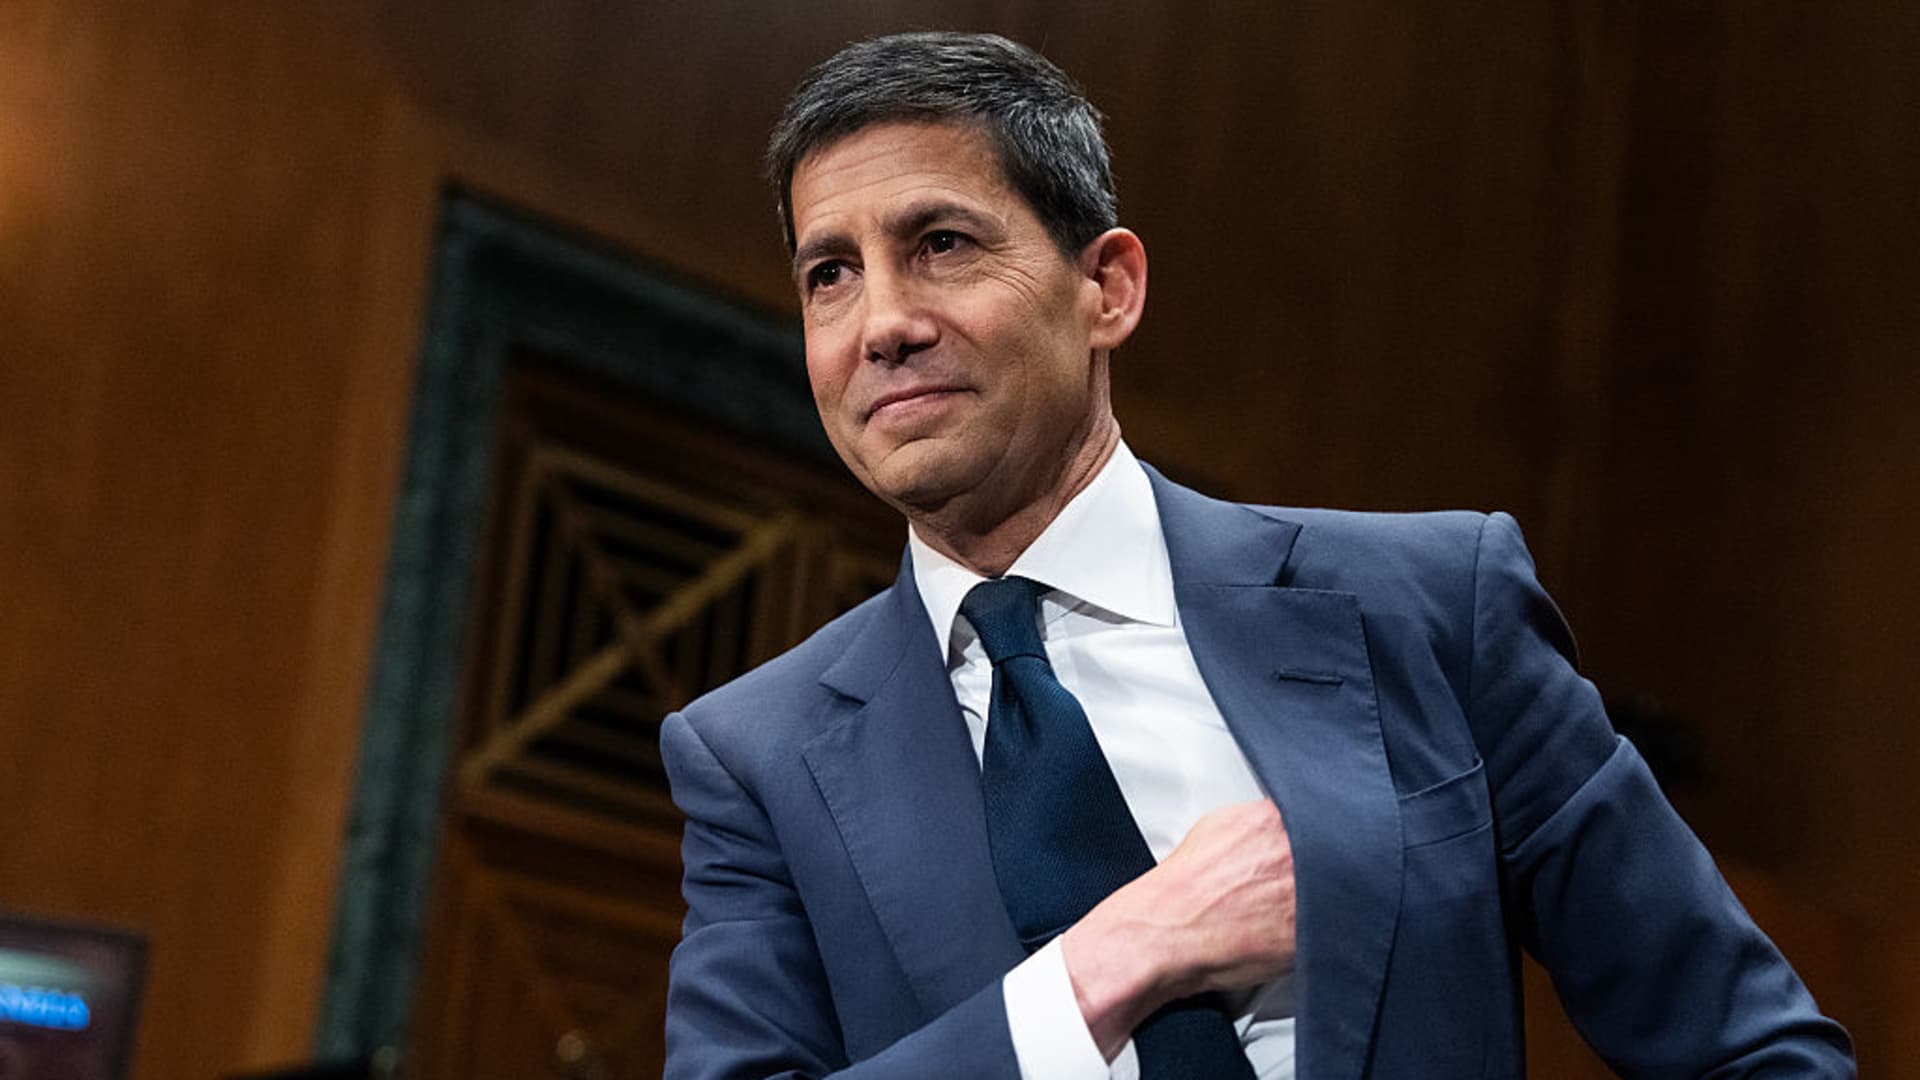
Kevin Warsh, nominee for chairman of the Federal Reserve, arrives for his Senate Banking, Housing and Urban Affairs Committee confirmation hearing in the Dirksen building, April 21, 2026.
Tom Williams | Cq-roll Call, Inc. | Getty Images
When the Federal Reserve wraps up its policy meeting Wednesday, one important thing could be missing — a dot.
The central bank’s Federal Open Market Committee is set to release its quarterly update of where individual officials expect interest rates to head this year and through 2028 and beyond. Markets closely parse the grid, known more commonly as the “dot plot,” for information on how Fed officials view the economy and its impact on monetary policy.
However, most Fed watchers on Wall Street expect new Chair Kevin Warsh won’t participate, either because he feels he’s not ready after having only been in office since May 22 — or simply because he doesn’t like the dot plot and its implications for “forward guidance.”
Declining to submit a dot would counter some 14 years of post-financial crisis practice for the Fed, and risk alienating other FOMC officials who favor the way it helps them communicate with the public. However, it also could be an effective first step for a central bank leader who has vowed fundamental changes for how the institution operates.
“It seems to me fairly likely that he doesn’t want to submit a rate forecast,” said Bill English, former head of monetary affairs at the Fed and now a professor at Yale. “There may be others on the committee who don’t particularly like the dot plot, who might be willing to do that, too.”
‘The Fed’s human’
Warsh objects to the dot plot and other methods of forward guidance because he believes they limit the Fed’s decision-making capabilities.
The dot plot belongs to a larger set of data called the Summary of Economic Projections, which also includes the outlook for unemployment, inflation and gross domestic product. The SEP is updated quarterly and includes the median outlook for each category and as such is not an official forecast but merely the midpoint of the range among FOMC meeting participants.
Bank of America economist Aditya Bhave expects Warsh won’t submit a dot, while Goldman Sachs economist David Mericle said in a note that, “We assume that Warsh will not submit dots in light of his past criticism of forward guidance, but we are not sure.”
During his confirmation hearing in April, Warsh cited the SEP as part of a broader problem at the Fed with overcommunication. Specifically, he cited the Fed’s mistaken “transitory” call on inflation in 2021-22 that led to a series of aggressive rate hikes to combat the biggest price surge in 40 years.
“The Fed tells the whole world what their dots are going to be, what their forecasts are going to be,” he said then. “Well, the Fed’s human. Then they hold onto those forecasts longer than they should. I think if the Fed were to wait until it gets into a meeting before making a decision, that incremental deliberation can keep the central bank from compounding its errors. I think these are big changes that are needed.”
Markets are watching
Still, markets hinge on the dot plot and the rest of the SEP, and may have to learn to live without it if Warsh has his way.
“To me it never made a lot of sense that [the SEP] at times was market moving, because its accuracy has been at best middling,” said Liz Ann Sonders, chief investment strategist at Charles Schwab. “But it is an avenue through which the Fed expresses a view, and the market tends to move on those views.”
Economist Claudia Sahm cautioned that should Warsh and others not participate, it could send the wrong message to markets. Specifically, she said investors could take the news to mean that Warsh is trying to “hide the hawkish shift” in the committee to fight inflation with elevated rates.
“Neutralizing the SEP this week might address some of Warsh’s concerns, but it would almost certainly create new ones,” wrote Sahm, chief economist at New Century Advisors. “A Fed that appears to be concealing its own debate could look complacent about inflation, which is exactly the credibility it can’t afford to lose.”
This meeting is expected to be an interesting test of Warsh’s new communications strategy.
In addition to his views on the dot plot and SEP, markets also will be watching for changes to the post-meeting statement and his views on whether he will continue to hold news conferences after each meeting.


Key Highlights
- CervoMed (CRVO) shares surged 32.3% during premarket hours Tuesday following disclosure of a significant director transaction
- Board member Joshua Boger acquired 955,414 shares priced at $3.14 each on June 11 through a private placement arrangement
- The investment totaled approximately $3 million, executed via the Joshua S. Boger 2021 Trust
- The placement structure included one common share plus two warrant series (B and C) per unit
- Wall Street firm H.C. Wainwright maintains a Buy recommendation with a $25.00 target price on CRVO shares
Shares of CervoMed (CRVO) experienced a dramatic 32.3% surge in premarket activity Tuesday morning following the disclosure of a substantial stock purchase by board director Joshua Boger in a Form 4 regulatory filing.
Acting through the Joshua S. Boger 2021 Trust, Boger acquired 955,414 shares priced at $3.14 each on June 11. The aggregate value of this transaction reached approximately $3 million.
Prior to this filing becoming public, the stock had faced significant headwinds. CRVO shares were changing hands at $2.48 before the announcement, representing a decline of roughly 15% during the previous week and a steeper 70% pullback over the trailing six-month period.
This acquisition formed part of a private placement offering that CervoMed anticipates will yield approximately $10.5 million in total gross proceeds. The arrangement was structured through a securities purchase agreement executed on June 9 involving Boger’s trust alongside additional accredited investors.
The placement’s unit structure featured one common stock share accompanied by one Series B warrant and one Series C warrant. Series B warrants feature a $3.32 strike price, become exercisable immediately, and remain valid through June 11, 2031. Series C warrants carry a $3.14 exercise price, are similarly exercisable right away, and expire on June 11, 2027.
Notably, Chief Executive Officer John J. Alam also took part in this financing round, making it a particularly significant insider-backed transaction at the executive level.
Updated Ownership Position
After completing this transaction, Boger’s total position includes 1,795,865 shares held indirectly via two separate trusts — the JSB 2021 Trust and The Amy S. Boger 2021 Trust — along with an additional 216,817 shares owned directly.
The warrant agreements contain an ownership limitation provision. Boger and related entities are restricted from exceeding 19.99% ownership of CervoMed’s total outstanding common stock when exercising these warrants. Should exercising approach this ceiling, he has the option to instead receive pre-funded warrants subject to identical restrictions.
Before Tuesday’s premarket rally, CervoMed carried a market capitalization of $23.42 million. According to InvestingPro’s valuation analysis, fair value stands at $3.40, indicating the stock had been trading beneath that benchmark entering Tuesday’s session.
Wall Street Perspective
H.C. Wainwright has reaffirmed its Buy rating on CRVO stock with a price objective of $25.00. This recommendation followed CervoMed’s presentation of findings from its Phase 2b RewinD-LB clinical study evaluating neflamapimod at the AD/PD 2026 Conference.
The ongoing trial is assessing neflamapimod’s effectiveness in treating dementia with Lewy bodies. Results from the study indicated that participants exhibiting reduced plasma pTau181 levels experienced more pronounced clinical improvements from the therapeutic intervention.
In separate corporate news, CervoMed stockholders granted approval to all measures presented at the company’s 2026 Annual Meeting, which included the selection of eight board directors. Boger secured re-election to his director position during this voting process.
According to the Form 4 disclosure, Boger’s trust maintains ownership of 1,600,117 shares, while The Amy S. Boger 2021 Trust controls 195,748 shares, with Boger serving as sole trustee for both entities.

Tokenized real-world assets (RWAs) are continuing to gain ground even as broader crypto markets show softness. Data compiled from onchain metrics points to a sharp increase in the value of tokenized financial products over the past six months, underscoring how incremental adoption by issuers and infrastructure providers is gradually expanding beyond a narrow “tokenized Treasuries” narrative.
According to Token Terminal, the market for tokenized financial assets has surpassed $43 billion, representing an increase of about 37% over the last 180 days. The same figures also show that tokenized funds remain the largest slice of the sector, while other categories—commodities and tokenized stocks—still trail by a wide margin.
Key takeaways
- Token Terminal estimates tokenized onchain financial assets now exceed $43 billion, up ~37% in 180 days.
- Other trackers, including RWA.xyz, report a lower combined market value (below $33 billion), likely due to methodology differences.
- Tokenized funds account for nearly 80% of the sector’s capitalization, with commodities at 16.6% and tokenized stocks at 3.8%.
- Ethereum is still the dominant network for tokenized assets at 57.8%, but several chains collectively account for meaningful share.
- Major institutions are increasingly framing tokenization as a shift from pilots toward regulated, mainstream issuance—though many market metrics exclude stablecoins.
Why tokenized asset totals differ across trackers
The headline growth in tokenized RWAs becomes even more notable when compared with alternative market estimates. Token Terminal’s reported market size is larger than figures compiled by RWA.xyz, which puts the combined RWA market at less than $33 billion. The gap appears rooted in how each dataset defines and counts tokenized financial products.
Token Terminal’s broader inclusion criteria likely help explain the higher total, especially given how tokenized ecosystems can blend categories such as funds, credit products, and other structured yield instruments. For investors and builders, this matters: differing scopes can change how quickly the “market cap” appears to expand and can influence how readily people compare performance across dashboards.
Tokenized funds lead; the sector’s asset mix is still concentrated
While tokenized RWAs are widening in attention, Token Terminal data suggests the sector’s capitalization remains heavily concentrated. Tokenized funds make up nearly 80% of the overall market value. Commodities rank second at 16.6%, while tokenized stocks account for about 3.8%.
That ranking highlights where demand and issuance infrastructure are currently strongest. Funds, by design, can package exposure into a standardized structure, making them easier to deploy across multiple investor bases. Meanwhile, stocks and other equity-like instruments generally require more complex regulatory, custody, and operational alignment—helping explain their smaller share today even as adoption progresses.
Networks: Ethereum stays on top, but momentum is spreading
Ethereum continues to be the central settlement and issuance chain for tokenized assets, with Token Terminal putting its share at 57.8%. Other networks contribute additional—if smaller—parts of the pie: BNB Chain at 8.5%, zkSync Era at 7.5%, XRP Ledger at 5.8%, and Stellar at 5.4%.
For market participants, the multi-chain distribution is an important signal. Tokenized RWAs are not only scaling in value; they are also extending across different technical ecosystems. That can affect liquidity venues, compliance tooling, and even investor accessibility, since different networks often come with distinct integration partners and user journeys.
Issuance concentration is also visible in the top providers. Token Terminal lists Sky as the largest issuer at $6.1 billion in tokenized assets, followed by Securitize and Ondo Finance, each at $3.6 billion.
From “Treasuries first” to a broader yield ecosystem
Institutional interest in tokenization continues to move beyond academic or pilot-era discussions. Earlier this week, Standard Chartered initiated coverage of Uniswap, arguing that the UNI token could appreciate significantly by 2030 as tokenized assets increasingly move onto blockchain rails. The bank also projected that decentralized finance could reach $2.7 trillion over the same period, with growth largely driven by the expansion of tokenized financial products. (See earlier coverage: Cointelegraph’s report on Standard Chartered’s thesis.)
Meanwhile, Citigroup has framed tokenization as an industry poised to scale with improving regulatory clarity. In a base-case outlook, Citi projected tokenization reaching $5.5 trillion by 2030, and in a bull scenario up to $8.2 trillion. Citi pointed to a shift from pilots toward integration into core issuance infrastructure, identifying potential catalysts including efforts around the Depository Trust & Clearing Corporation and major market operators such as the NYSE and Nasdaq incorporating tokenization into issuance processes. (For the report referenced in the original coverage, see Citi’s Tokenization 2030 PDF.)
Stablecoins are also expected to play a major role in sector growth, even though many tokenization-focused market dashboards exclude them. That creates an analytical blind spot for readers relying solely on RWA market-cap figures: the onchain settlement layer can be expanding even if specific token categories are measured differently.
Beyond funds and credit, tokenized equities are beginning to show clearer momentum through platforms such as Ondo Markets and xStocks, reflecting a diversification trend. Binance Research previously concluded that RWA growth is becoming more diversified, with its report noting that 2026 could represent maturation from a “Treasury-dominated narrative” into a more varied yield ecosystem (as described in Cointelegraph’s earlier coverage).
For investors, the practical takeaway is that tokenized RWAs are still dominated by a small number of asset types and issuers, but the direction of travel is widening. The sector is also increasingly tied to mainstream financial infrastructure and regulated processes—an evolution that could reshape how capital moves onchain over the next cycle.
Going forward, readers should watch whether tokenization metrics continue to converge across data providers as methodologies tighten, and whether more issuance pipelines and trading venues broaden access to non-fund products like equities and commodities—areas that currently account for smaller shares but may determine the next phase of growth.


A handful of tokens continued their run while bitcoin and the rest of the crypto market stalled after the early week bounce.
Many leading altcoins are well in the green today (June 16), but Bittensor (TAO) has failed to follow the overall upswing, posting a substantial daily decline.
Even so, several analysts think it could be gearing up for a rebound that might carry it back to multi-month highs.
Big Pump Incoming?
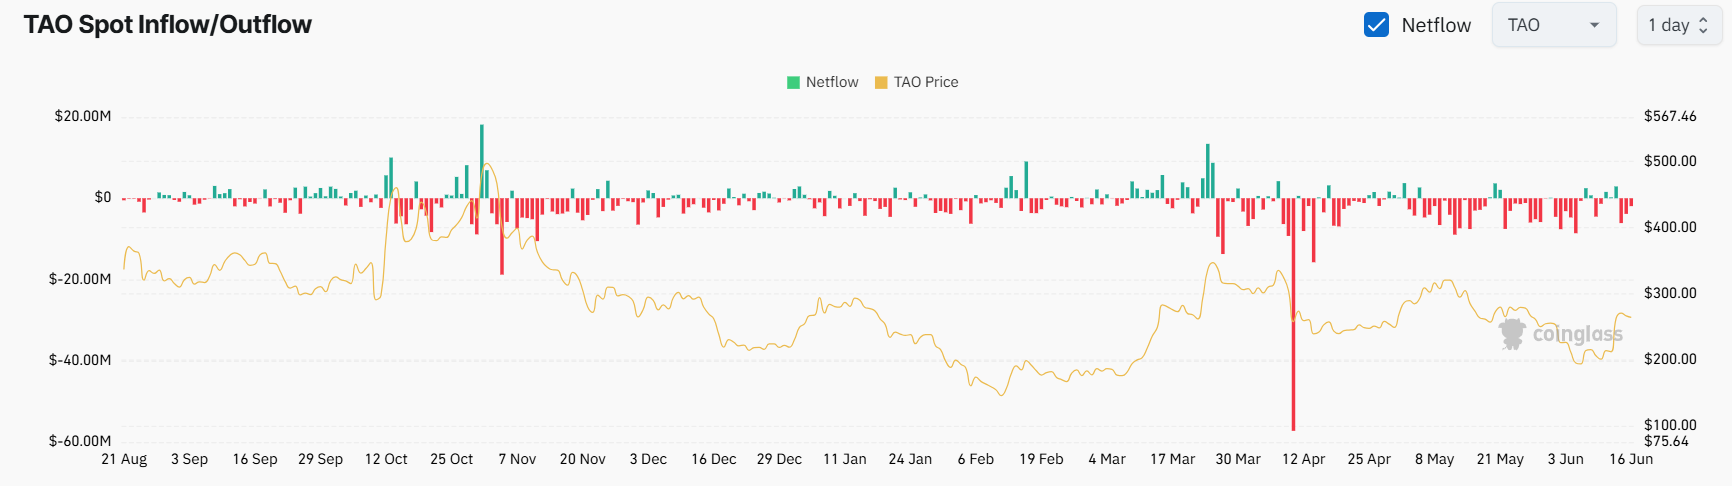
TAO currently trades at around $268, a 7% plunge over the past 24 hours. It is important to note that its decline occured despite Grayscale’s positive remarks. Just hours ago, the digital asset management company claimed that centralized companies like Anthropic are more vulnerable to government intervention and decentralized projects like Bittensor “offer an alternative.”
“Bittensor provides open-source, permissionless access to AI through a decentralized global network,” the firm posted on X.
X user Altcoin Sherpa noted that TAO has lagged behind numerous well-known cryptocurrencies, suggesting the weakness may stem from traders pre-positioning and many already being fully allocated. At the same time, the analyst said TAO still “looks good” and that they remain invested in it.
“This current area is a bit of a resistance spot, 200d EMA + S/R level, but if it can break here, I think the low $300s is my next area up,” the X user added.
Ali Martinez also gave his two cents. He argued that TAO is approaching the top of its descending channel and predicted that a decisive break could open the door to a jump to $350 and then $420.
The asset’s recent exchange netflow raises the possibility of a short-term revival. Over the past few weeks, outflows have surpassed inflows, suggesting that many investors have abandoned centralized trading venues in favor of self-custody solutions, thereby reducing immediate selling pressure.
How About $500?
Another analyst who seems very fond of TAO is Michael van de Poppe. A few days back, he described the token’s chart as “phenomenal” and envisioned a potential price explosion to $500.
Shortly after, he opined that the strongest altcoins from the previous months, including TAO, could extend their solid performance in the near term, provided Bitcoin (BTC) has already bottomed.
Recall that at the start of June, the primary cryptocurrency briefly collapsed to around $59,000 – its lowest point in 19 months. And while it has recovered well above $65,000 following the peace deal between Iran and the US, some analysts believe the worst for this cycle has yet to come.
The post Bittensor (TAO) Slips 7% Daily, Yet a Price Explosion May Come Next appeared first on CryptoPotato.


State regulators got sidelined in the U.S. Department of the Treasury’s effort to implement the new U.S. stablecoin law, according to several senators from both parties who insist that the states need to be given an explicit process for proving their supervision and standards are on par with federal regulators’.
The Guiding and Establishing National Innovation for U.S. Stablecoins (GENIUS) Act to regulate stablecoin issuers is being translated into regulations across several federal financial agencies, including the Treasury. But the opening effort may not have satisfied state regulators who are trying to push their own GENIUS-related regulations, according to a Tuesday letter from the lawmakers, led by Republican Senator Cynthia Lummis, chair of the Senate Banking Committee’s crypto subcommittee.
“Treasury’s finalized principles for assessing whether state regimes are substantially similar to the federal regulatory framework are critical in this process,” according to the letter, also signed by fellow Republicans and a few Democrats, including Angela Alsobrooks, Catherine Cortez Masto and Kirsten Gillibrand. “The proposed principles were published by Treasury but did not address the timeline and procedural requirements related to state certification.”

Bitcoin has fallen back toward $65,000 after renewed tensions involving Israel and Lebanon tempered optimism surrounding a potential U.S.-Iran agreement, while traders also reduced risk ahead of the Federal Reserve’s policy decision.
Summary
- Bitcoin fell from $66.9K to $65.4K as renewed Israel-Lebanon tensions dented optimism around a potential U.S.-Iran agreement.
- Technical indicators remain cautiously bullish, with BTC holding above a rising trendline and key support near $64K-$65K.
- Traders are closely watching the Fed decision, while liquidation clusters around $65K and $67K-$68.5K could drive the next major move.
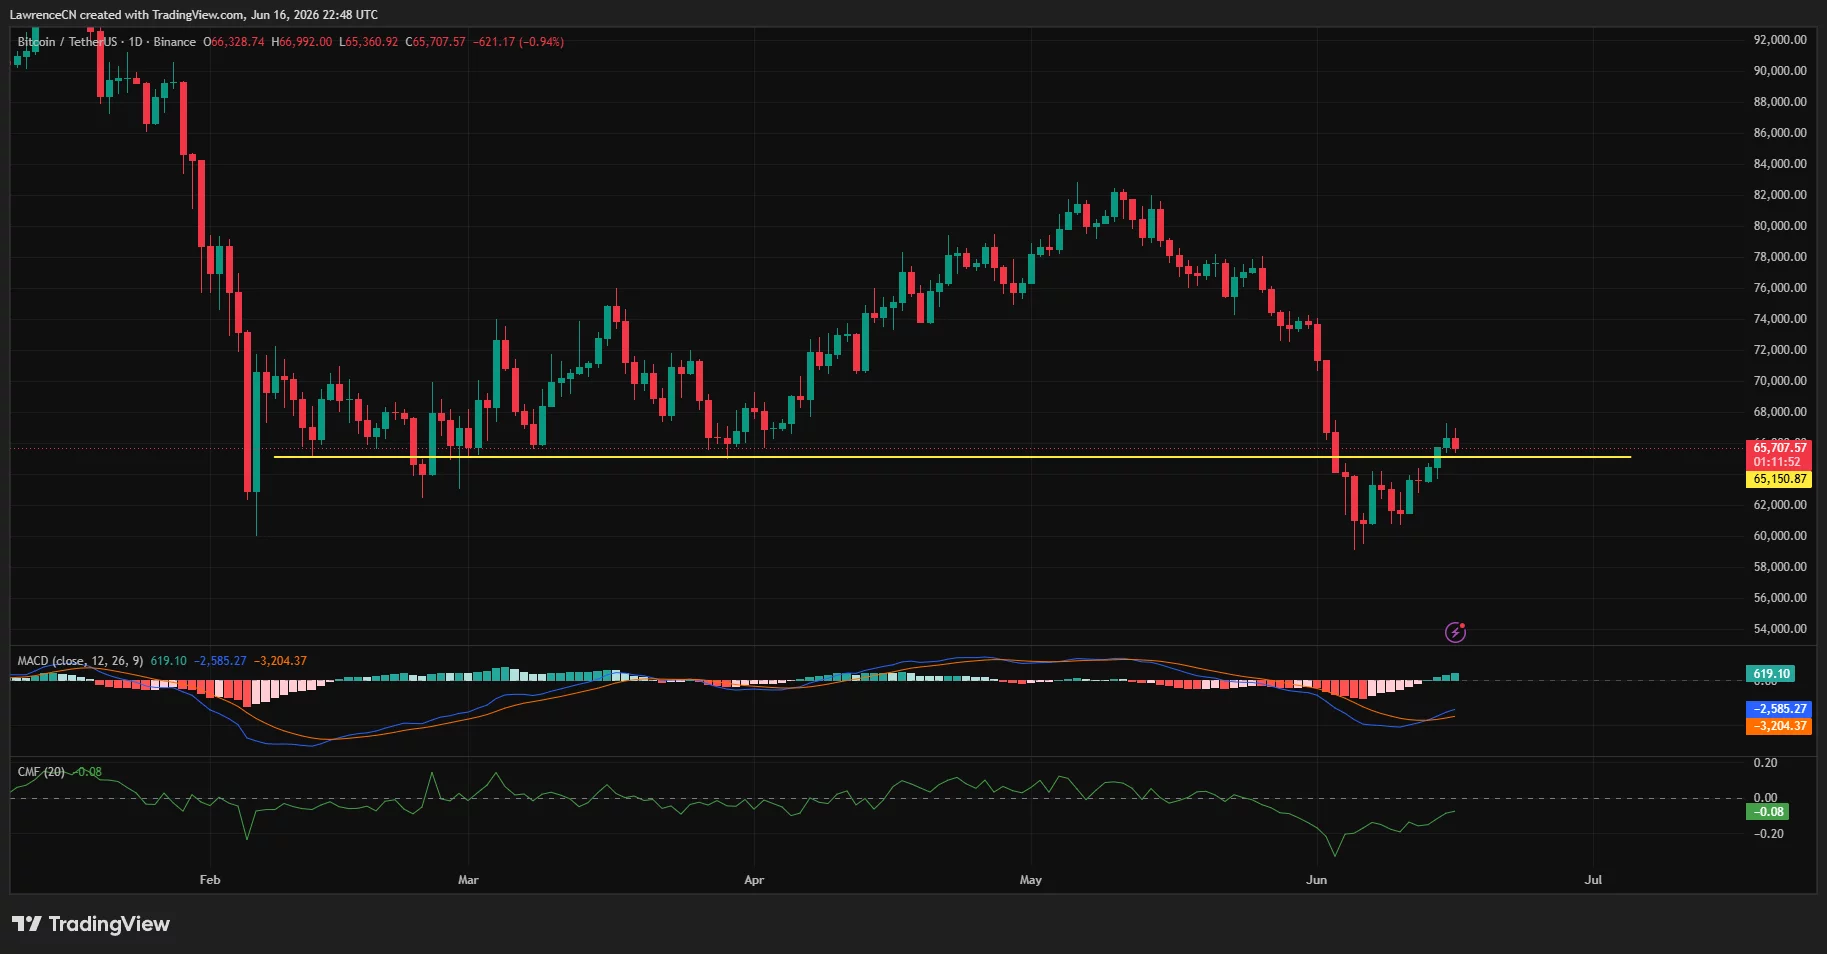
According to crypto.news market data, Bitcoin (BTC) price dropped from an intraday high near $66,900 on June 16 to a low around $65,400 before stabilizing near $65,700 at press time.
Bitcoin price retreated following reports that Iran’s military accused Israel of violating the ceasefire in southern Lebanon dozens of times since the U.S.-Iran deal was announced, warning of a “harsh response” if attacks continue.
The decline interrupted a rally that had gained momentum earlier in the session after reports suggested Washington and Tehran were preparing to sign a memorandum of understanding later this week. The agreement would reportedly allow tanker traffic through the Strait of Hormuz, a development that helped push crude oil prices down more than 6% to roughly $75.5 per barrel, their lowest level since early March.
Alongside the geopolitical headlines, traders remained focused on the Federal Reserve’s two-day policy meeting. Markets widely expect rates to remain unchanged, but uncertainty surrounding Fed Chair Kevin Warsh’s outlook has limited risk appetite after inflation accelerated to 4.2% year-over-year in the latest CPI report.
Bitcoin faces resistance near major technical inflection point
On the daily chart, Bitcoin is attempting to reclaim a key horizontal level near $65,150 that served as support throughout February and March before breaking during the early June sell-off. Bulls briefly pushed above that zone, but sellers emerged near $67,000 and forced a pullback.
The recovery has nevertheless improved the short-term technical structure. On the four-hour chart, Bitcoin remains above a rising trendline drawn from the June 6 low near $59,200. The move has also carried the asset above the descending trendline that capped prices throughout late May and early June.
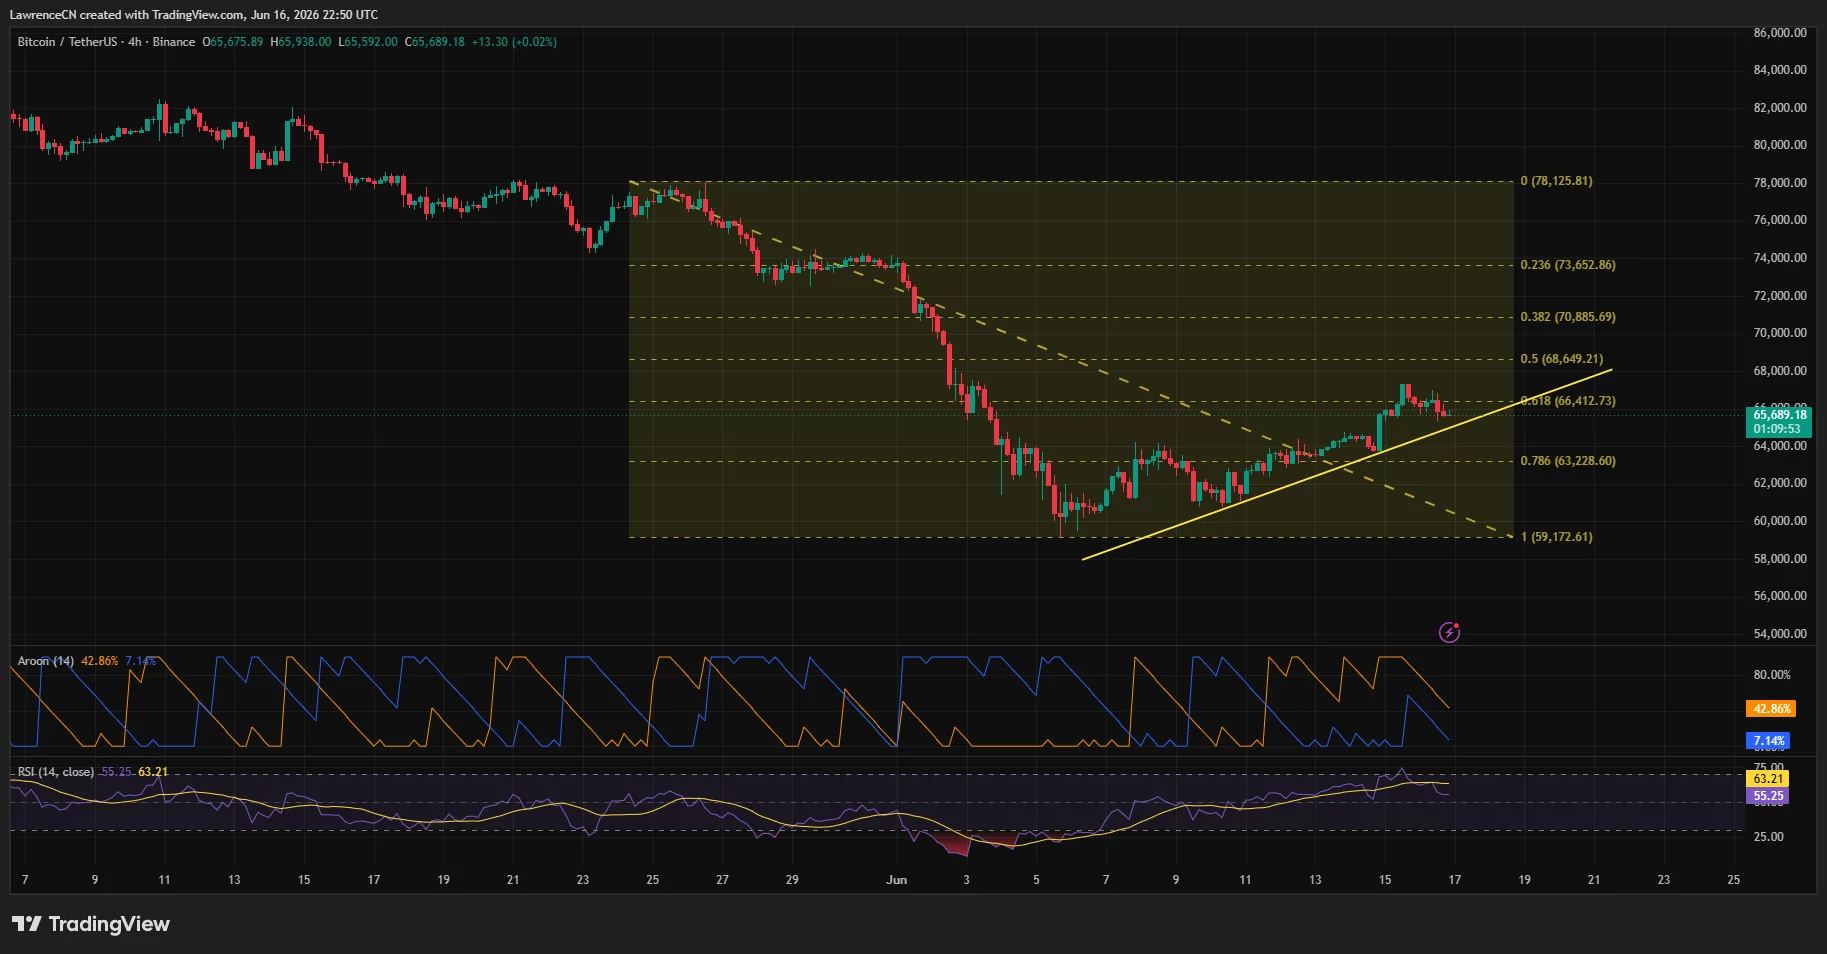
Fibonacci retracement levels place immediate resistance near $66,400, corresponding to the 61.8% retracement of the decline from roughly $78,100 to $59,200. A successful breakout could expose the 50% retracement level around $68,650, followed by resistance near $70,900.
Momentum indicators remain constructive despite the latest pullback. The four-hour RSI held above 55 while the Aroon Up indicator remained dominant over the Aroon Down reading, suggesting buyers still retain near-term control. On the daily timeframe, the MACD histogram has turned positive for the first time since the June breakdown, although Chaikin Money Flow remains slightly below zero, showing capital inflows have yet to fully recover.
Commenting on the market structure, crypto analyst Ardi noted that Bitcoin’s ability to defend the $64,000 region remains critical ahead of the Fed meeting.
“If price holds that level, then even with a typical post-FOMC correction, bulls can keep the local structure with a chance to extend the rally.”
Additional support comes from longer-term moving averages. According to crypto analyst Daan Crypto Trades, Bitcoin is currently trading between its weekly 200-day moving average and 200-day exponential moving average.
“Bulls want to close the weekly candle back above the 200EMA while holding the 200MA as support.”
Fed decision and geopolitical risks threaten Bitcoin recovery
CoinGlass liquidation data shows one of the largest nearby liquidity pools sits around $65,000, where leveraged long positions have accumulated over the past 24 hours. A break below that area could expose another concentration of liquidation interest near $64,500 and potentially accelerate downside volatility.
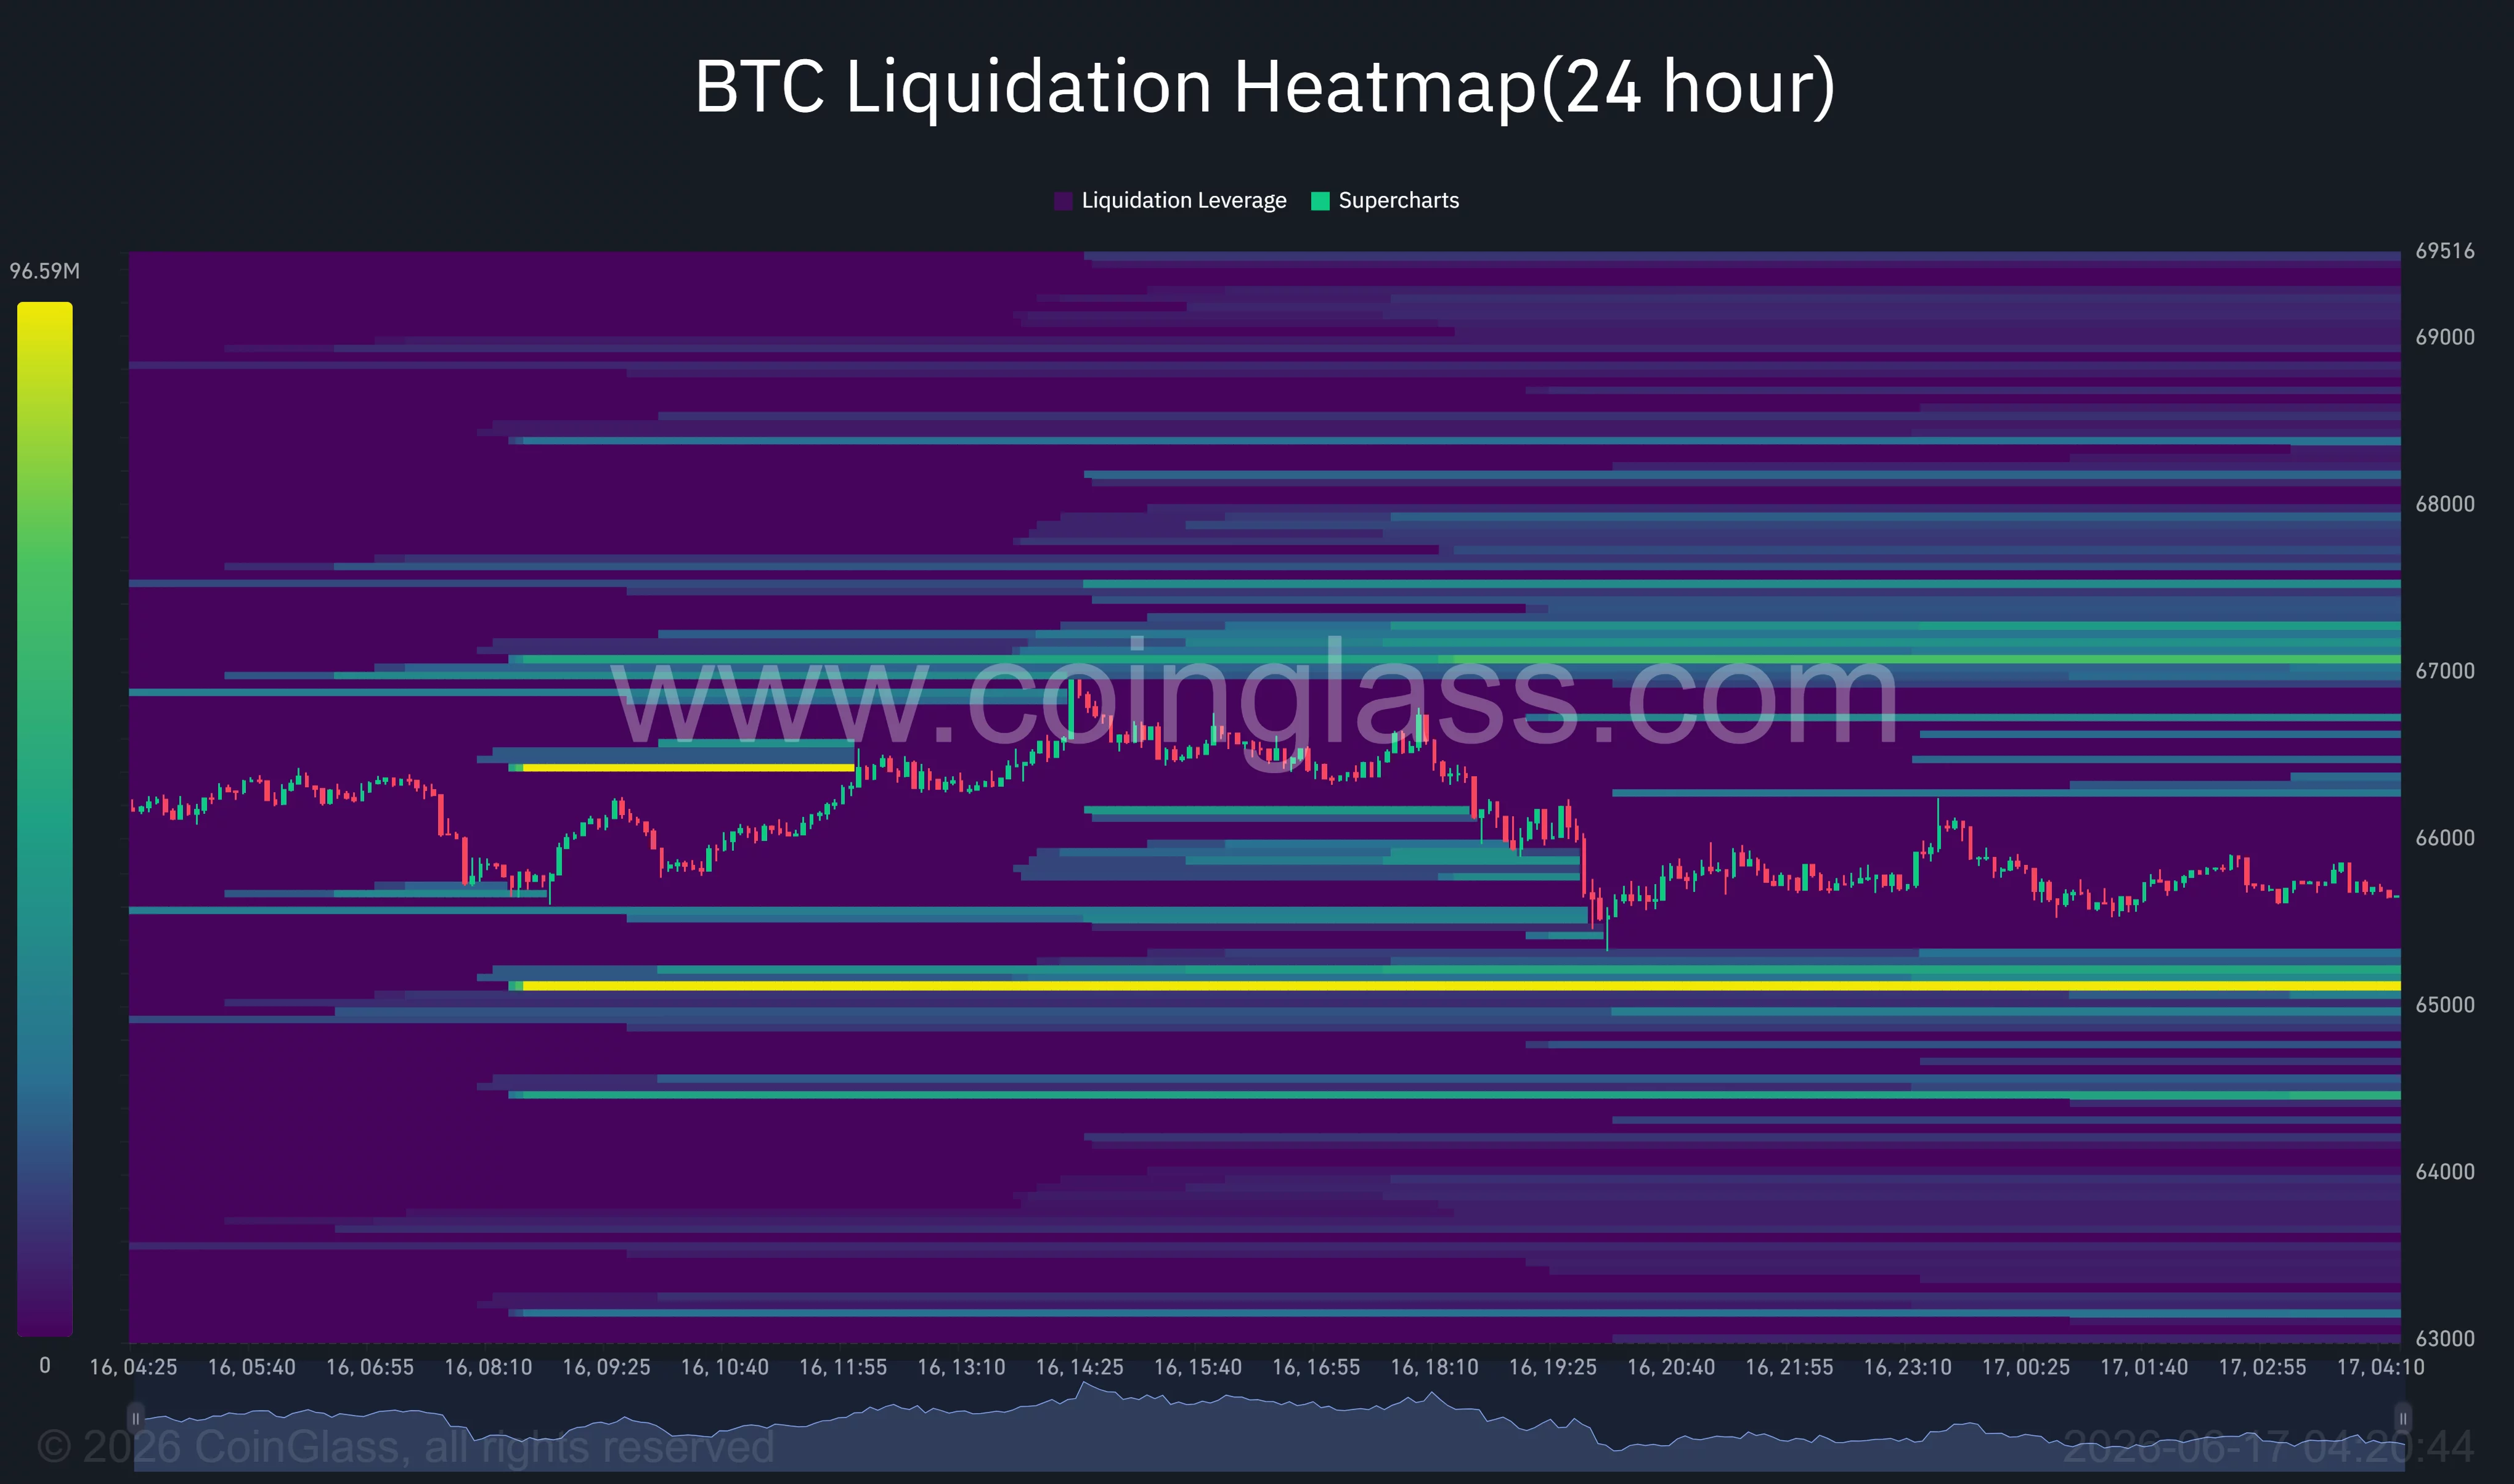
Meanwhile, substantial short liquidation clusters remain stacked between $67,000 and $68,500. Those levels could act as upside magnets if Bitcoin regains momentum following the Fed decision.
Geopolitical developments remain another source of risk. Israeli Prime Minister Benjamin Netanyahu has stated that Israeli forces will continue occupying southern Lebanon despite the U.S.-Iran agreement, while Iran has threatened retaliation if alleged ceasefire violations persist.
Any deterioration in regional stability could quickly reverse the market’s recent optimism surrounding the Strait of Hormuz and energy supplies.
Failure to hold the $64,000-$65,000 support zone would weaken the current recovery structure and shift attention back toward the June low near $59,200. Conversely, a break above $66,400 could open the door to a move toward $68,600 and potentially $71,000 as traders unwind short positions after the FOMC meeting.
Disclosure: This article does not represent investment advice. The content and materials featured on this page are for educational purposes only.
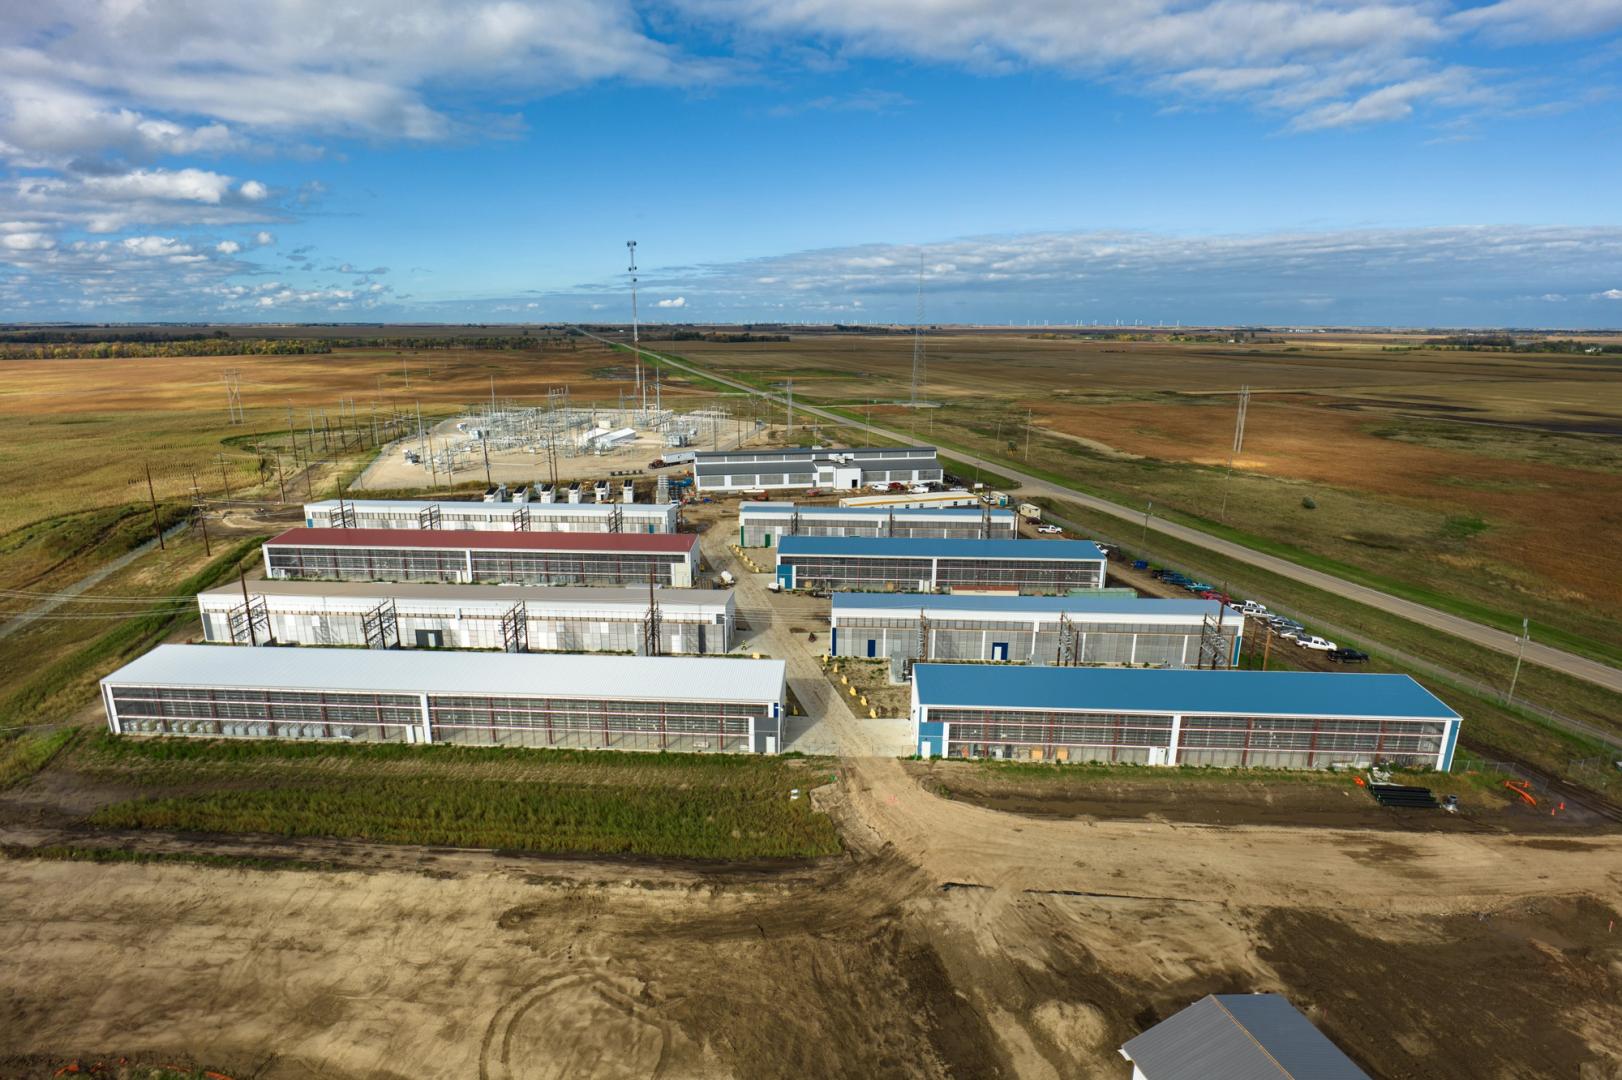

The report comes amid a dramatic shift in the bitcoin mining industry. Following the collapse in mining profitability after the 2024 halving, many operators began repurposing their power infrastructure to support AI workloads, betting that technology companies would pay significantly more for electricity and data center capacity than bitcoin miners.
Core Scientific (CORZ) signed a multibillion-dollar hosting agreement with AI startup CoreWeave, helping transform the company from a bitcoin miner into an AI infrastructure provider. TeraWulf (WULF), Hut 8 (HUT), Iren (IREN), and Cipher Mining (CIFR) have all announced plans to lease power and data center capacity to AI and high-performance computing customers, while Marathon Digital (MARA), Riot Platforms (RIOT) and CleanSpark (CLSK) are pursuing hybrid strategies that maintain bitcoin mining operations while exploring AI opportunities.
While bitcoin (down about 24% since January), along with other big public crypto names, have lost significant value so far this year as crypto prices continue to slide amid shifting investor focus to AI, bitcoin miners have seen largely green candles across the sector. RIOT is up nearly 94% year-to-date, while CIFR is 62% higher. Others are showing similar gains over the same period.
The fresh narrative has helped drive some of the biggest stock moves in the crypto sector over the past year, and investors have rewarded many of these companies with valuations that increasingly reflect their AI potential rather than their mining businesses.
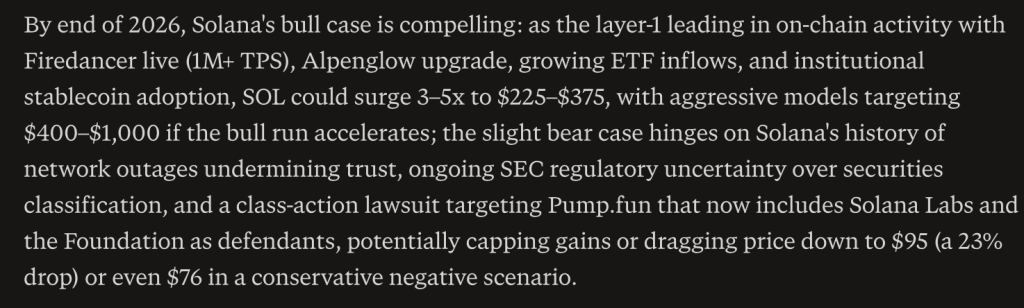
Perplexity AI is back with another Solana predicts, and this time it went further. The base case is $225 to $375 by end of 2026, a 3x to 5x from the current $74.93, with aggressive models stretching all the way to $400 to $1,000 if the bull run really accelerates.
That upper range is not a typo. Perplexity is genuinely entertaining the idea of a 13x Solana by year end, which puts it in a category of prediction that demands the underlying argument be airtight.
The foundation is Firedancer, going live at 1 million plus TPS alongside the Alpenglow upgrade, a combination that does not just make Solana faster but puts it in a performance tier no other Layer-1 can currently compete with.

Add growing ETF inflows and institutional stablecoin adoption building on top of a network already leading all chains in on-chain activity, and the bull case starts to feel less like optimism and more like a technology gap compounding.
When a chain is measurably ahead on throughput and real usage, and institutions start flowing capital in through regulated vehicles, the price tends to follow eventually.
What makes this prediction more interesting than a simple number is the specificity of the bear case.
Perplexity is not just saying macro could be bad. It names the Pump.fun class-action lawsuit that now includes Solana Labs and the Foundation as defendants as a genuine risk, alongside the network’s historical outage problem and ongoing SEC classification uncertainty.
A bear scenario landing at $76 to $95 is actually the most grounded part of this entire outlook, and notably, the current price of $74.93 sits right at the edge of that range, which tells you exactly how much risk the market has already priced in.
Solana Price Prediction: When The Tech Finally Catches The Price
SOL price is at $74.93 today after a textbook V-shaped recovery off the $60 low printed earlier this month, and the daily chart is doing something it has not done convincingly since March.
It is making a higher low. The June bottom at $60 sits above the February flash low near $65 on an intraday basis, and the recovery since then has been sharper and more sustained than any of the failed bounces between March and May.
That structural shift from lower lows to potential higher lows is the first technical ingredient any meaningful trend reversal needs.
The $80 level is now the critical short-term decision point, the same shelf that broke down in late May and where the overhead supply from that breakdown now sits.
Getting through $80 on a daily close and holding it would be the first genuine sign that this recovery has legs rather than just momentum.
Above it the $90 to $100 region becomes the next meaningful test, and clearing that opens the path toward the $120 to $140 zone where Perplexity’s base case starts to become visible on the chart.
The RSI is the most striking element of the current picture. At 51.62 with the signal line at 31.23, the gap between them is over 20 points, the widest divergence in this entire series of predictions today.
Momentum was absolutely buried during the June flush and has now rocketed all the way back to the midline, crossing neutral territory faster than at any point in the past several months. An RSI that recovers this aggressively from deeply oversold levels and crosses 50 without pausing tends to signal the beginning of a new directional phase rather than just a bounce.
Perplexity’s $225 to $375 target requires Solana to sustain that momentum for months. The RSI is suggesting the fuel is there. The chart just needs $80 to confirm it.
You Might Like What Perplexity AI Predicts About This New Layer 3 Called LiquidChain
Large caps are not in trouble. They are just out of the room. Bitcoin, Ethereum, and XRP have been testing the same ceilings for weeks with nothing breaking through.
Every macro catalyst has a new arrival date. Every institutional wave has a new quarter attached to it. Holding assets where the next leg depends entirely on someone else’s decision is not a trade. It is a waiting room.
The money that wins cycles never announces where it is going.
The capital that actually moves in cycles relocates before the destination has a name.
Small market cap infrastructure plays operate on physics that large caps simply cannot replicate. A rotation that would not register as a rounding error at Bitcoin’s scale can reprice an undiscovered project by multiples.
The opportunity lies in the distance between what something is genuinely worth and what the market has assigned it so far. That distance shrinks to zero the moment discovery happens. Before that moment, it is fully capturable.
Multi-chain fragmentation is one of the most consistently expensive problems in DeFi, and it has never been solved. Bitcoin, Ethereum, and Solana exist as completely isolated systems. No shared architecture. No native interoperability. Every time value moves between them, the disconnection extracts its cost in fees, slippage, and failed transactions. That cost hits every single crossing every single time.
LiquidChain makes the crossing free, as Perplexity AI predicts. All 3 networks inside one execution environment. Single deployment. Complete ecosystem access. No tax on any interaction.
The presale is at $0.01454 with just over $840,000 raised. Early and undiscovered.
Execution is unproven. Adoption is unknown. Established assets offer predictability toward a ceiling that the market already sees. LiquidChain is an entry point that does not exist once the market finds it.
Explore the LiquidChain Presale
The post Perplexity AI Predicts Explosive Solana Price Prediction by End of 2026 appeared first on Cryptonews.


US Senator Cynthia Lummis says the CLARITY Act would direct $150 million to law enforcement to track scammers and other bad actors across digital asset markets.
The money would bolster the Financial Crimes Enforcement Network (FinCEN), the Treasury bureau that tracks suspicious money flows, as the market structure bill advances through the Senate.
What the Funding Targets
Crypto fraud has reached record levels. Americans reported losing $9.3 billion to crypto-related internet crime in 2024, FBI data show.
Victims over 60 reported the heaviest toll, nearly $5 billion, across all online fraud.
Supporters, including Lummis and the Crypto Council for Innovation, say the bill provides an additional $150 million to FinCEN. That figure appears in advocacy materials rather than the committee’s official fact sheets.
Follow us on X to get the latest news as it happens
The money would back expanded anti-money laundering programs, suspicious activity reports from newly covered exchanges, and blockchain analytics tools.
It would also support a pilot that lets firms share threat data with federal investigators.
The bill further tightens rules on digital asset kiosks, a fast-growing fraud channel.
Losses at Bitcoin ATMs topped $65 million in the first half of 2024, and people 60 and older bore about 71% of that total, the FTC reported.
Providers would also gain a safe harbor to pause suspicious transactions at law enforcement’s request.
Readers can review the CLARITY Act explainer for the full framework.
Where the CLARITY Act Stands Now
The House passed the CLARITY Act in July 2025 by a vote of 294 to 134. The Senate Banking Committee then advanced it on May 14 in a 15-9 bipartisan vote.
It now moves to the full Senate, where supporters want action as soon as June. The bill had already survived earlier Senate scheduling delays, and lawmakers have floated a bipartisan follow-up bill.
Critics, including Senator Elizabeth Warren, warn that the framework could still leave gaps for illicit finance.
The $150 million surviving final negotiations may test how hard the bill can be sold as a crypto market structure rulebook when senators take it up.
The post US Wants to Spend $150 Million Hunting Crypto Scammers Under New CLARITY Act appeared first on BeInCrypto.
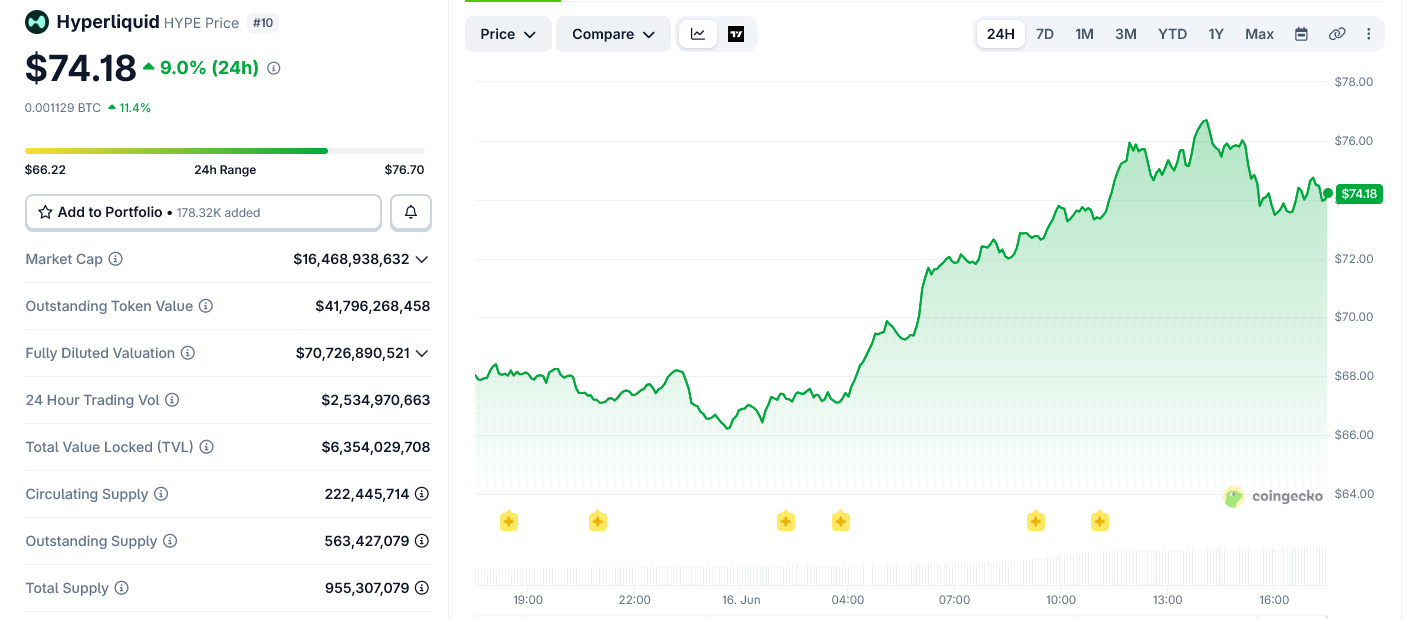
Hyperliquid (HYPE) printed a record high near $77 on June 16. HYPE hits an ATH, with the price climbing nearly 10% in a single day as spot exchange-traded fund (ETF) inflows accelerated.
The token now trades around $74.61, up roughly 67% over the past year. Its market capitalization sits near $16.57 billion, making it the tenth-largest cryptocurrency.

Institutional Money Rotates Into HYPE
The move arrives as institutional capital tilts toward HYPE. On June 15, spot Bitcoin funds bled while Hyperliquid products gained, part of a broader rotation across crypto ETFs.
Spot HYPE ETFs have drawn about $153 million in net inflows and nearly $900 million in volume since launch. Three products hold the token directly, namely 21Shares’ THYP, Bitwise’s BHYP, and Grayscale’s HYPG.
Efe “Crypto Kid” Kelemci, a member of the BeInCrypto Market Intelligence Experts Council, shared his exclusive comment. He ties that demand to the protocol’s economics.
“Hyperliquid’s revenue-generating business model stands out as especially attractive to institutions because its roughly $850 million in 2025 revenue saw 99% directed to buying and burning $HYPE tokens … pointing to even higher institutional inflows ahead.”
That utility helps explain the pull. Hyperliquid’s perpetual futures markets enable traders to access assets such as equities and pre-IPO names. That includes the SpaceX contract, which drew heavy volume before its public debut.
The flow timing reinforces the story. After a brief net outflow around June 5, ETF demand snapped back hard. One of the largest single-day inflows landed on June 15 as the price recovered.

Leverage Cuts Both Ways as Liquidations Spike
Strong inflows tell only half the story. Leverage on Hyperliquid has run hot since mid-May, and the data flags two-sided risk.
Long liquidations spiked in early June when prices pulled back from local highs. More recently, short liquidations have climbed as the token grinds higher, suggesting a squeeze is helping power the breakout.
The leverage backdrop also shaped a notable exit. Arthur Hayes sold his entire HYPE position above $72 in early June, then denied a reported buyback days later.
His departure offered a bearish counterweight to the bullish flows. Yet HYPE pushed to a record without him, a point traders have seized on.

What’s the Next Price Target for HYPE?
The daily chart frames the upside. HYPE reclaimed the 1.272 Fibonacci extension at $70.04 and now eyes the 1.618 extension near $83.55 as a first target.
A second target sits at the 2.0 extension around $98.47. The relative strength index is about 63, rising but not yet overbought, leaving room before momentum stretches.
One caution stands out. Volume has declined as price advanced, a divergence worth monitoring. The previous record at $59.41 now acts as support, with deeper backup near $51.05 along an ascending trendline.

Kelemci’s weekly chart shows HYPE trading in the upper half of an ascending channel since late 2024. That structure projects toward roughly $128 if the trend extends.
Kelemci also notes HYPE has gained 164% since the start of 2025. Over a similar span, Bitcoin fell 42%, and Ethereum dropped 57% from their peaks. He frames a far larger ceiling.
“If it scales to Tier-1 exchange volumes and launches spot trading, reaching a market capitalization similar to Robinhood’s roughly $70 billion would imply a token price well above $300, with the burn mechanism potentially allowing it to soar much higher.”

For now, the setup is binary. Hold the prior breakout above $59.41, and the path toward $83 and $98 stays open. Lose it, and the record run cools fast.
The post Hyperliquid’s HYPE Just Hit a New All-Time High: Experts Now Weigh $300 Target appeared first on BeInCrypto.

Donald Trump Is About To Crash Bitcoin Again | Mark Yusko’s 2026 Predictions

World Cup schedule, what to know June 17

Verve Group SE (MGIMF) Analyst/Investor Day Transcript


-

 Business2 days ago
No Jackpot Winner as $257 Million Prize Rolls Over to $269 Million Monday Draw
-

 Crypto World5 days ago
Oppenheimer backs SpaceX as $70 billion retail frenzy builds
-

 Fashion4 days ago
Weekend Open Thread: Tuckernuck – Corporette.com
-

 Crypto World5 days ago
Markets Rally as SpaceX IPO Looms Amid Iran Tensions and Inflation Surge
-
 Crypto World2 days ago
Zimbabwe Requires Crypto Businesses to Register Annually Under New FIU Regulations
-

 Tech4 days ago
NanoClaw integrates JFrog registries to secure AI agent downloads
-

 Business7 days ago
Thailand Ranks Second Worldwide for AI Adoption Growth, Microsoft Reports
-

 Tech4 days ago
This Week In Security: Microsoft On Microsoft, Register Your Domains, Linux On ARM, And FreeBSD Joins The File Cache Club
-

 Crypto World4 days ago
Bitget enters Argentina’s regulated crypto market through PSAV registration
-
 Tech5 days ago
Dutton Ranch star claims they ‘didn’t see any disruption’ on set following Chad Feehan’s exit from Yellowstone spinoff fueled by Taylor Sheridan clash rumors
-

 NewsBeat5 days ago
El Nino has formed in the Pacific and could set records, forecasters say
-

 Politics5 days ago
Politics Home | Healey Resignation Is “Colossal Failure Of Government”, Says Former Labour Defence Secretary
-
 Tech7 days ago
‘This is Seattle’s position on AI’: City Council votes unanimously to pause big new data centers
-
 Entertainment5 days ago
Donnie Wahlberg & More Heat Up Las Vegas at Circa’s Barry’s Downtown Prime
-
 Tech5 days ago
Opendoor Ends India Operations, Fueling a Bigger Conversation About AI and Outsourcing
-

 Sports5 days ago
First Time Since 1971: Australia Register Historic Low In ODI Cricket
-

 Politics5 days ago
Belfast burns, while Met chief points finger at Iran and Russia
-

 NewsBeat4 days ago
FBI searches office of Ohio voter registration group
-

 Business5 days ago
AT&T: Verizon's 27% Outperformance Sets Up A Solid Entry Point
-

 Politics5 days ago
Modi thanks Trump for wishes as US attacks Indian seafarers
You must be logged in to post a comment Login