

Crypto World
Bitcoin Falls to $58K as Bear Pressure Builds; $50K Key Level

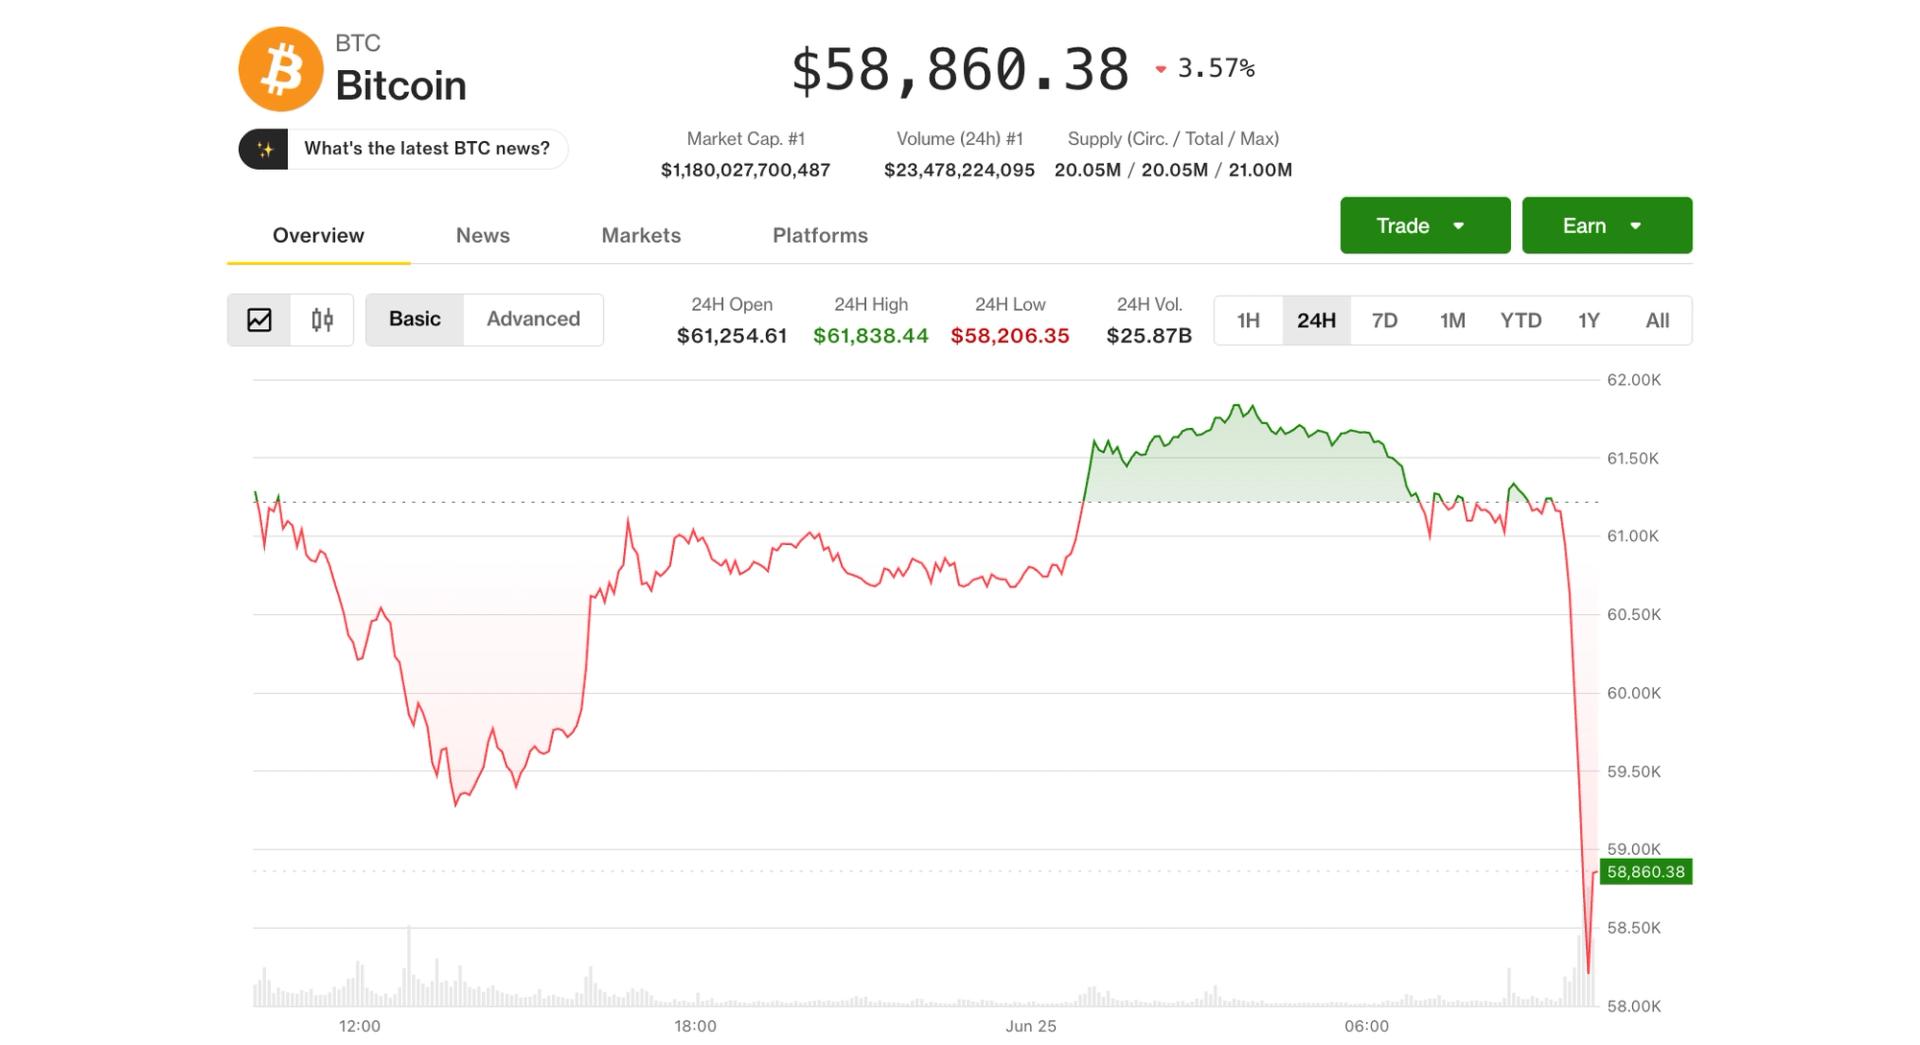
Bitcoin slid below the $60,000 mark on Thursday, a move that drew attention to fresh downside technical risk and underscored how sensitive crypto remains to swings in broader financial markets. The drop followed weakness in megacap technology stocks, which dampened overall risk appetite and added pressure to BTC as it approached another critical psychological level.
From a charting perspective, the selloff has also helped activate multiple bearish patterns. Analysts say the combination of a breakdown below $60,000 and the completion of two separate setups on lower timeframes increases the odds of a move toward—and potentially through—the $54,000 area in the coming days.
Key takeaways
- BTC’s break below $60,000 has wiped out its June gains and triggered fresh technical downside scenarios.
- A four-hour “rounded top” structure appears to have completed, with a projected target just under $54,000.
- On the daily chart, a bear-flag breakdown points to the same $54,000 zone, strengthening the bearish case.
- Glassnode’s MVRV pricing bands align with the $54,000 area as an important potential support level.
Why $60,000 losing momentum matters
On Thursday, BTC/USD fell as much as 4.8% and traded down to an intraday low near $58,000, according to the market moves referenced in coverage of Bitcoin’s weakness. Importantly for traders, that decline did not stop at a minor dip—by moving below $60,000, Bitcoin broke a widely watched psychological threshold.
With the broader market in a fragile posture, that kind of level loss often changes how participants position. Instead of treating the area as “support to defend,” many traders reframe it as a level that must now be reclaimed to prevent further downside follow-through.
Rounded top breakdown points to a repeat target
The most direct technical argument for additional selling comes from the four-hour chart. Coverage notes that the price action completed what appears to be a rounded top pattern on that timeframe. In technical analysis, a rounded top forms when upward momentum gradually weakens, eventually shifting the asset from an uptrend into a downtrend that resembles an inverse “U” shape.
The pattern’s signal becomes actionable when the market breaks below the structure’s “neckline,” the support area that marks the base of the formation. After that breakdown, analysts typically estimate a downside objective by measuring the distance from the top of the formation to the neckline and projecting that same distance downward from the breakdown point.
Using that method, the measured downside target for Bitcoin is described as sitting just under $54,000, implying roughly an 8.9% drop from current prices at the time of reporting. The key point for readers is not the exact precision of the number, but the directional clustering: if multiple independent setups converge on the same zone, traders often treat that area as the next likely “decision point” on the chart.
Daily bear-flag adds weight to the $54,000 zone
To make the bearish case stronger, the article also points to confirmation from the daily chart via a bear-flag breakdown. Bear flags generally emerge after a sharp decline, followed by a period of consolidation that resembles a flagpole-and-flag structure. When price later breaks out downward from that consolidation, the pattern is often treated as implying that the prior down-move can extend.
In this case, the bear-flag breakdown is stated to project an identical move toward the $54,000 zone. That matters because it reduces the probability that $54,000 is merely a one-off technical estimate. Instead, two different pattern frameworks—rounded top on one timeframe and bear flag on another—are both pointing to the same region, which tends to attract concentrated positioning from market participants who follow chart-based signals.
On-chain confirmation: MVRV bands highlight potential support
Beyond pure price patterns, the coverage also turns to on-chain analysis from Glassnode, focusing on MVRV pricing bands. MVRV compares Bitcoin’s current market price with its realized price—the average price at which coins last moved on-chain. Put simply, these bands are often used to gauge whether BTC is trading in unusual profit or loss territory relative to where holders last established their cost basis.
As of Wednesday, the article states that Bitcoin traded near $60,997, while the 1.0 MVRV band—shown in green—sat around $53,390. That level closely matches the technical downside target near $54,000. When on-chain bands and chart objectives overlap, it can suggest a confluence area where demand might emerge, particularly if sellers start to encounter holders sitting at less favorable positioning.
However, the same framework also warns that a deeper decline could bypass that support. The article notes that if selling intensifies, Bitcoin could test the 0.8 MVRV band (shown in blue) near $42,700. Historically, it says, major bear-market bottoms have tended to form around that lower band—where unrealized losses become more extreme and capitulation risk rises.
For investors and active traders, this creates a more structured “map” of scenarios: $54,000 is framed as a near-term target and potential support test, while the $42,700 area is presented as a lower-bound zone to watch if the market fails to stabilize before then.
Readers should watch for whether Bitcoin can reclaim and hold above $60,000 after the breakdown, since that would challenge the bearish pattern narratives. If BTC instead keeps pressing lower, the next key question becomes whether $54,000 holds as a confluence support area—or whether conditions deteriorate enough to push price toward the deeper MVRV band levels.


In 2022, Kraken began institutional cryptocurrency derivatives trading on PowerTrade, a company operated out of El Salvador and co-founded by Mario Gomez Lozada and Bernd Sischka.
In October 2025, when the price of bitcoin fell and markets declined, Kraken said it became concerned about PowerTrade’s liquidity and creditworthiness and tried to withdraw its funds, but was unable to, according to the filing.
Rather than returning the funds, the lawsuit claims that PowerTrade carried out a series of unauthorized transactions that moved Kraken’s account from holding more than $6 million to a negative balance of nearly $2 million.
This was done through a block of around 100 “corrections,” related to trades that had expired or settled months earlier, the filing said. Payward said in the filing that it was concerned that PowerTrade would rely on the “debt” it had artificially created to appropriate Payward’s bitcoin collateral.
PowerTrade did not respond to a request for comment by press time.
UPDATE (June. 25, 16:45 UTC): Updates amount of losses as per new filing, removes mention of DIFC freezing order


Jiang Zhuoer, one of China’s best-known bitcoin miners and founder of the LeBit mining pool, predicted that the current bear market will bottom in the fourth quarter at roughly $42,000-$44,000.
The forecast, made in Chinese on X, puts the low some 30% below bitcoin’s current level near $60,700, and rests less on the cryptocurrency’s performance than on Strategy, the largest corporate holder of the token, according to an automated translation.
Jiang analyzed Strategy’s market net asset value (mNAV), the ratio of the company’s stock price to the per-share value of the bitcoin it holds, which has dropped to 0.72. A number above 1 means investors value the company at a premium to its bitcoin stack; below 1 means they value it at less.
Jiang’s figure has the market pricing Strategy about 28% below the bitcoin it owns, a sign of deep pessimism toward the trade.
《对本轮BTC熊市 见底时间&价格 预测》
【重要长期预测贴】MSTR的mNAV已跌到0.72了【图1,图3】,
(mNAV=股价/每股含BTC价值 比值,代表美股资金对MSTR的市场情绪,高于1为泡沫高估,低于1为悲观低估)
接近上一轮牛市2022年5月11日的最低点0.7【图2】。
根据最近STRC大幅脱锚等市场情绪事件,… https://t.co/V5s0Q2S2Wy pic.twitter.com/o9fqE9U80z— 江卓尔_莱比特矿池 (@Jiangzhuoer2) June 24, 2026
That reading is close to the 0.7 low Strategy hit on May 11, 2022, during the last bull-to-bear turn, he said, which leads him to think mNAV is near its floor for this cycle.


OpenAI will reportedly stagger the GPT-5.6 release after the US government raised security concerns, limiting who can reach the model first.
Federal officials would gain a say over which customers receive early preview access, according to a new report.
What the GPT-5.6 Release Report Says
The Information reported that the Trump administration asked OpenAI to phase the launch rather than open it widely at once. The outlet said federal reviewers would approve preview access one customer at a time during the early window.
Staggered launches already sit in OpenAI’s playbook. The company withheld the full GPT-2 model for roughly nine months in 2019 over misuse fears. Its GPT-5.5 model launch on April 23 reached paid tiers before free users.
More directly, OpenAI shipped a cyber-focused version of GPT-5.5 only to vetted defenders under a trusted-access program. The GPT-5.6 plan would extend that template to Washington itself.
A Federal Review Framework Takes Shape
The reported request maps onto Executive Order 14409, which President Donald Trump signed on June 2. It asks developers to give the government up to 30 days of access to their most capable models before release.
Federal officials would also help choose which trusted partners get early access.
A classified benchmark led by the National Security Agency would decide which systems count as covered frontier models. The threshold turns on a model’s advanced cyber capabilities.
A separate Treasury-run clearinghouse would hunt and patch software flaws, extending the administration’s cyber defense doctrine.
The framework is voluntary and bars any licensing regime, part of a wider federal AI policy push. Officials cast it as a way to test frontier models for cyber risks. Some former advisers have criticized that case as overblown.
OpenAI has not officially confirmed GPT-5.6 or a firm launch date, and earlier timing has slipped toward July. How tightly Washington shapes early access could set a template for the next frontier releases from OpenAI and Anthropic.
The post OpenAI Will Reportedly Stagger GPT-5.6 Release at US Government Request appeared first on BeInCrypto.

Multicoin Capital has projected that Hyperliquid’s HYPE token could reach $319 by 2028 despite identifying several structural and market risks that could threaten its long-term outlook.
Summary
- Multicoin Capital has forecast a $319 HYPE price by 2028, citing Hyperliquid’s earnings growth and expanding market share.
- The firm pointed to HIP-3, token buybacks, and rising perpetual futures activity as key drivers behind its bullish outlook.
- Despite the optimistic target, Multicoin warned that regulation, competition, governance risks, and a bearish double-top pattern could pressure HYPE.
According to a new report from Multicoin Capital, the investment firm expects Hyperliquid (HYPE) to appreciate roughly fivefold from its current price near $64, based on a base-case scenario in which Hyperliquid generates about $8 billion in annual earnings by 2028 and trades at a 20-times earnings multiple.
Multicoin also disclosed that it began accumulating HYPE in February, making it one of the largest positions in its liquid fund, while adopting a three-day no-trade policy after publishing the report.
Why Multicoin believes Hyperliquid can justify a higher valuation
Much of the firm’s conviction comes from Hyperliquid’s rapid expansion during 2025. According to Multicoin, the decentralized exchange generated about $873 million in revenue from roughly $2.9 trillion in trading volume while growing its user base from around 301,000 to 923,000. During the same period, open interest climbed from approximately $2 billion to $6 billion.
Current market data cited in the report show Hyperliquid now accounts for more than 59% of decentralized perpetual futures open interest. Its outstanding open interest has also reached about $9.6 billion, exceeding that of its largest on-chain rivals combined.
Beyond decentralized markets, Multicoin argued that Hyperliquid has continued narrowing the gap with centralized exchanges. Monthly perpetual futures trading volume has reached roughly 17% of Binance’s level, while open interest stands at about 21% of Binance’s, figures the firm compared with Binance’s own early growth trajectory.
Another pillar of the investment case is HIP-3, an upgrade that allows third-party teams to launch perpetual markets tied to assets such as stocks, commodities, and equity indexes.
According to Multicoin, open interest linked to real-world assets has already surpassed $2.9 billion, while an officially licensed S&P 500 perpetual contract generated more than $100 million in average daily trading volume during its first week.
The report also expects options trading, prediction markets, portfolio margining, and deeper integration with HyperEVM applications to expand Hyperliquid’s revenue opportunities over the coming years. Multicoin argued these additions could help transform the platform into what it described as an “everything exchange” offering around-the-clock access to multiple asset classes.
What risks could prevent the $319 forecast
Even with its optimistic valuation, Multicoin acknowledged that several factors could derail its forecast. The report identified decentralization challenges, regulatory uncertainty, governance issues, increasing competition, and potential bad debt as the primary risks facing the protocol.
Value capture remains another reason behind the firm’s bullish outlook. According to the report, approximately 99% of Hyperliquid’s protocol revenue is used to repurchase HYPE, with those tokens effectively removed from circulation. Multicoin also noted that Hyperliquid has never raised outside capital and operates without a separate equity layer, allowing the protocol’s economics to accrue directly to token holders.
The report estimates Hyperliquid has generated about $869 million in trailing earnings for HYPE holders. Based on a token price near $63, Multicoin calculated that HYPE trades at roughly 36 times trailing earnings, or about 30 times after accounting for revenue associated with Hyperliquid’s Coinbase and USDC agreement.
Meanwhile, technical charts present a more cautious picture than the firm’s long-term forecast. On the four-hour timeframe, HYPE is forming a bearish double-top pattern, with a neckline near the $52.7 support level.
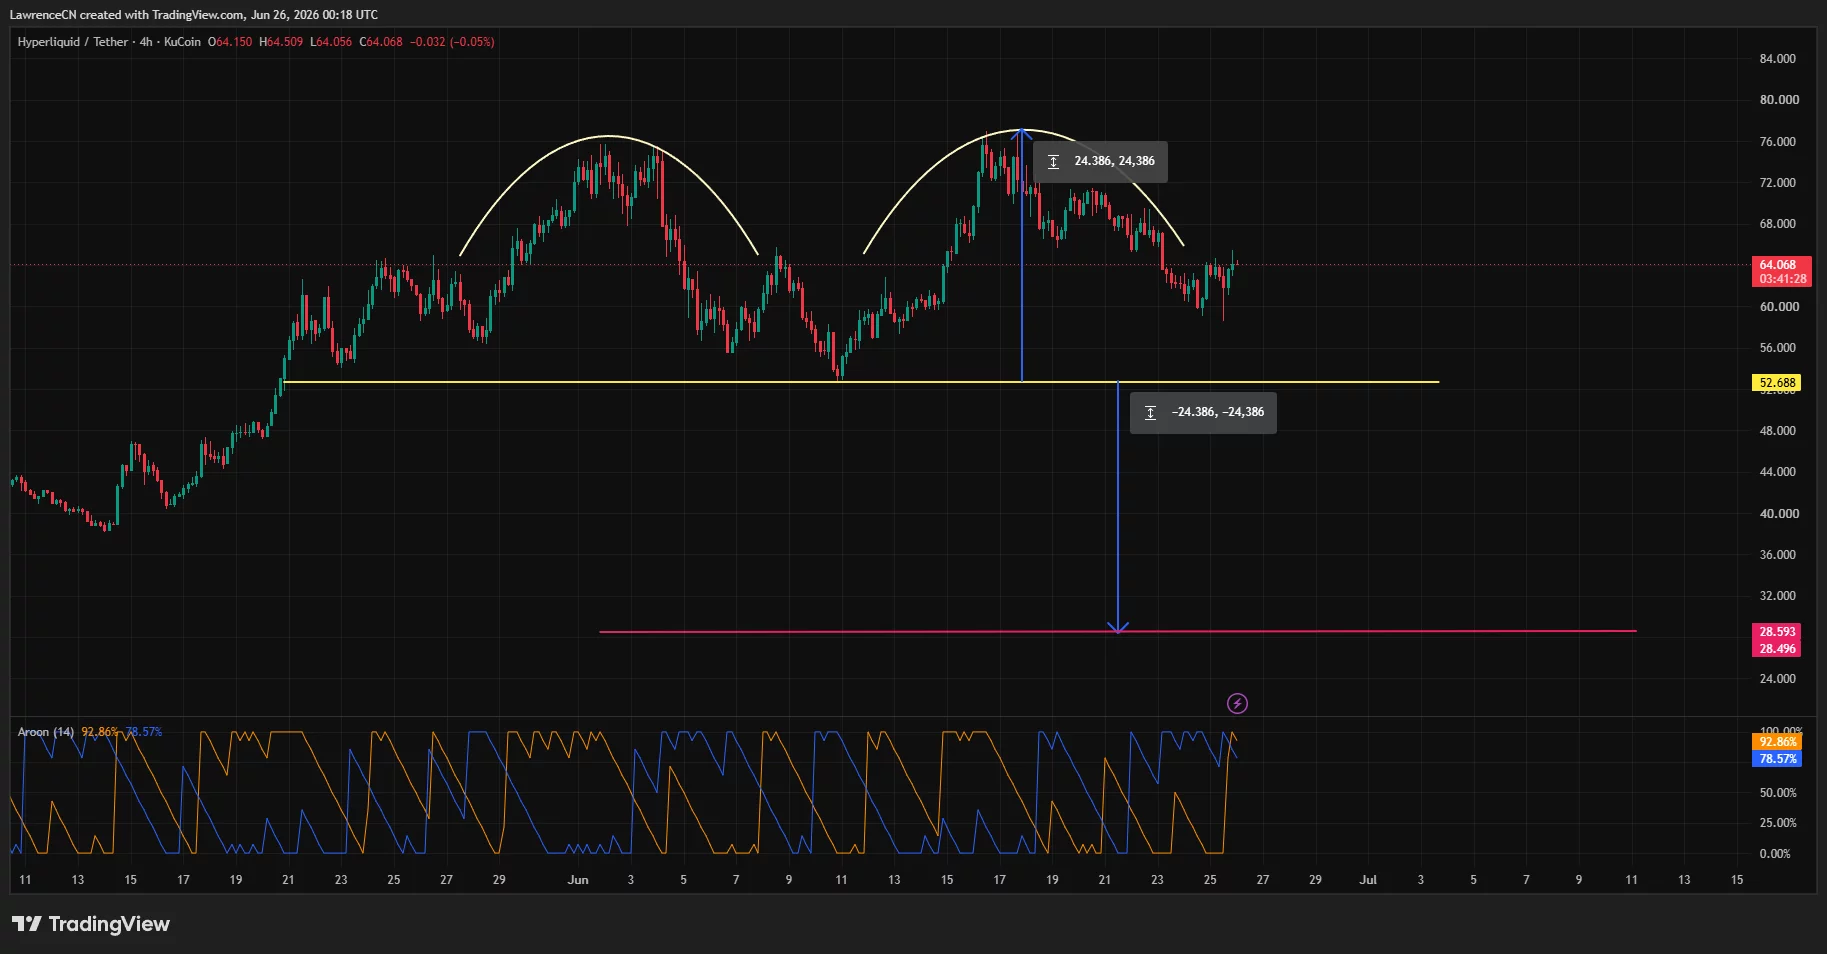
If sellers push the token below that support and confirm the pattern, the measured downside target points toward the $28.5 area, suggesting traders may continue watching technical risks alongside Multicoin’s longer-term fundamental outlook.
Disclosure: This article does not represent investment advice. The content and materials featured on this page are for educational purposes only.
Crypto infrastructure company BitGo Holdings laid off about 15% of its staff on Thursday as its CEO pledged to focus the company on areas including trading, stablecoins and artificial intelligence-powered infrastructure.
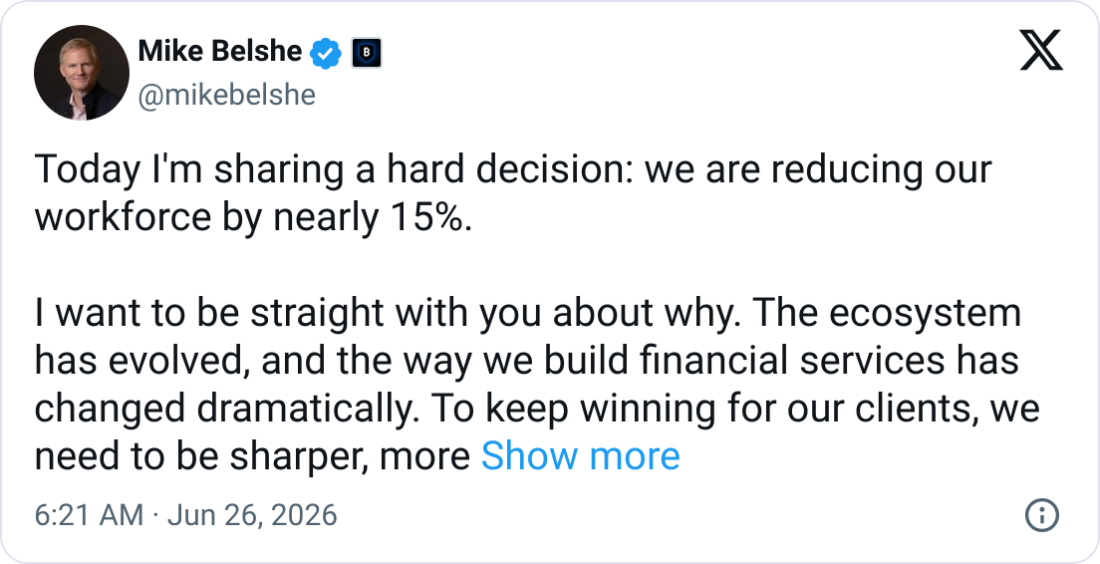
“Today I’m sharing a hard decision: we are reducing our workforce by nearly 15%,” BitGo co-founder and CEO Mike Belshe posted to X on Thursday. “The ecosystem has evolved, and the way we build financial services has changed dramatically.”
“We need to be sharper, more focused, and concentrate our people and energy on the areas that matter most: security, trading, stablecoins, settlement, and AI-powered infrastructure,” he added.
The layoffs add to the thousands of jobs lost in the crypto industry so far in 2026, with many companies citing efficiency gains from AI and a wide crypto market slump as the reason for the cuts.
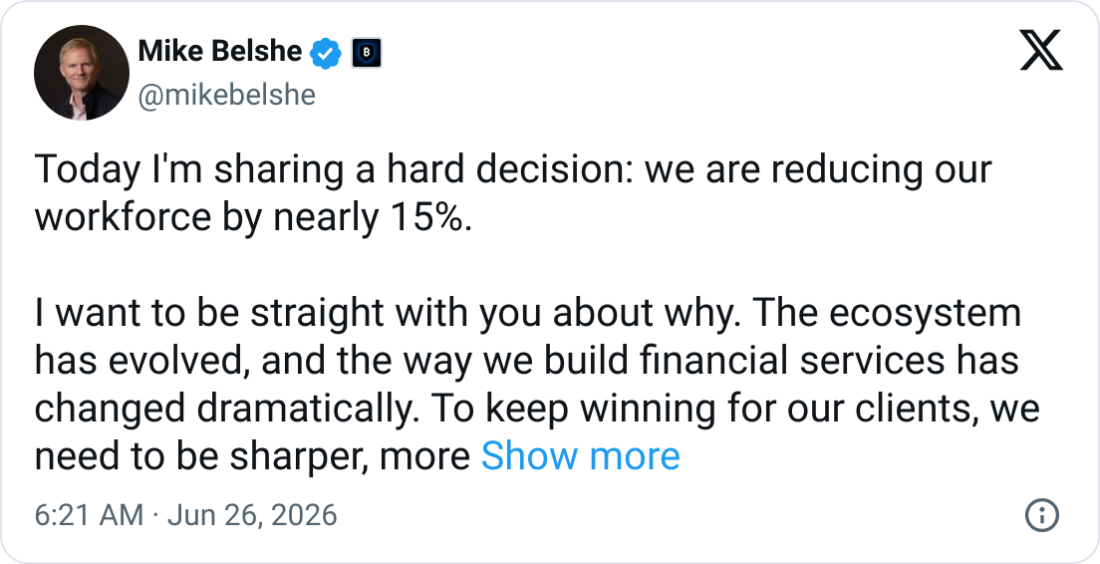
Source: Mike Belshe
BitGo did not confirm the number of staff affected in the layoffs. Its 2025 annual report published in March disclosed it had 603 full-time employees as of Dec. 31, 2025, meaning the layoffs could have impacted about 90 staff.
Belshe said the layoffs were “a one-time action” and BitGo does not “anticipate further reductions.” The company is still hiring for 51 roles across various regions, according to its job board.
BitGo did not immediately respond to a request for comment.
Related: Blockworks acquires Messari in crypto data consolidation push
Shares in BitGo (BTGO) closed Thursday down 4.67% at $4.80, extending a nearly 73% slide from its public debut at $18 on Jan. 22.
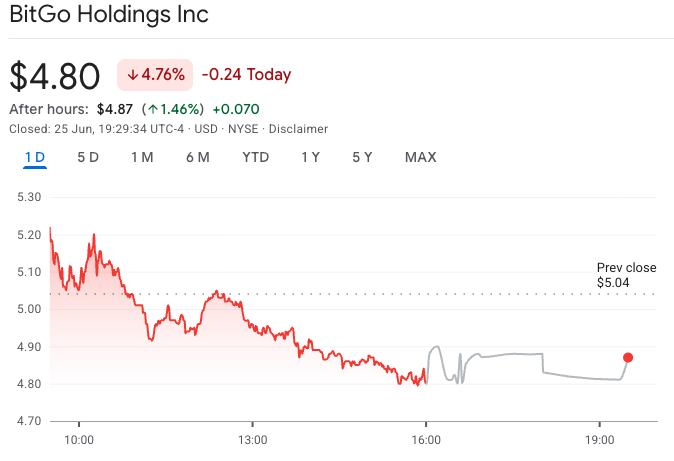
Shares in BitGo on Thursday slid more than 4.5% after the company announced it cut 15% of its staff. Source: Google Finance
Crypto companies have so far cut more than 5,000 jobs this year, with Block Inc. undertaking the biggest round of layoffs by cutting 4,000 staff or about half its workforce in February.
Robinhood cut 10% of its workforce on June 16, while in May, crypto exchange Kraken cut 150 staff, data company Dune cut 25% of its workforce and Coinbase cut 700 employees, or about 14% of its workforce.
Earlier this year, Gemini laid off 200 employees and Crypto.com also laid off about 180 staff, with both citing the rising use of AI.
So far this year, the wider US technology sector has seen over 121,500 layoffs from over 200 companies, according to Layoffs.fyi.
Magazine: Guide to the top and emerging global crypto hubs: Mid-2026


Crypto held in an IRA or 401(k) is treated differently. These accounts generally do not receive a step-up in value. Instead, they continue to follow the rules that apply to retirement assets. Distributions are typically taxed as ordinary income, and in many cases, non-spousal beneficiaries must withdraw the full account balance within 10 years. Mixing crypto’s volatility and forced liquidation can create financial planning considerations.
Q. Who should I choose to be in charge?
Careful consideration when choosing the person to manage your assets is vital to make sure your plan works as you envisioned. This can be a stressful and emotional period for families, and the person you choose will likely be making decisions under pressure.
In most estate plans, the person in charge is there to coordinate with institutions to carry out your wishes. Bitcoin can be different. If crypto is held in a wallet, the person you choose isn’t just overseeing the process; often, they are interacting with the system directly. There is no institution stepping in to move assets or correct mistakes. If something is entered incorrectly, it may not be fixable.
Someone who can follow instructions and be patient to avoid guesswork may be more important than a financial or technical background. Being capable of acting in emotional situations, rationally, is a quality to look for. When putting systems in place to ensure your crypto is accessible, also consider making sure someone with no experience can follow the steps without guessing. In traditional planning, there’s usually a backstop; there often isn’t with crypto.


Strategy turned a software company into the largest corporate Bitcoin holder on earth by exploiting a simple loop: trade above your Bitcoin’s value, issue stock, buy more Bitcoin, repeat. In June 2026, Bitcoin broke below $60,000, the stock fell under its own Bitcoin value, and the loop began running the other way. Here is how the machine works, why it reverses, and whether Saylor is actually trapped.
Summary
- Strategy’s mNAV fell to roughly 0.80, meaning its stock trades below the value of the Bitcoin it holds, which disables the premium-funded loop the company used to grow.
- The same reflexive flywheel that compounded gains on the way up now compounds pressure on the way down: at a discount, issuing equity destroys Bitcoin per share, and issuing preferred stock turns expensive, choking both funding taps at once.
- Annual dividend obligations across its preferred stack quadrupled to about $1.2 billion while cash reserves fell roughly 38%, collapsing dividend coverage from more than seven years to around 14 months.
- STRC, the key funding instrument, trades near $82 against a $100 par value, and a tiny 32-Bitcoin sale to fund a dividend broke Strategy’s long-standing never-sell narrative.
- Analysts are split between a “trap” thesis and a “strained but not broken” view, and the outcome hinges almost entirely on Bitcoin’s price, with a roughly $1 billion debt maturity in 2027 as the key deadline.
For five years, Michael Saylor ran one of the most effective financial machines in modern markets, a self-reinforcing loop that converted a mid-sized software company into the largest corporate holder of Bitcoin on earth, with more than 847,000 coins on its balance sheet.
The machine had a simple engine at its center: as long as Strategy’s stock traded at a premium to the value of the Bitcoin it held, the company could issue new shares or preferred stock above that value, use the cash to buy more Bitcoin, and increase the amount of Bitcoin backing each existing share, which justified the premium and let the loop run again. It was elegant, it was relentless, and for a long time, it worked spectacularly, turning Strategy into a Bitcoin proxy that often rose faster than Bitcoin itself.
In late June 2026, that engine threw itself into reverse. Bitcoin crashed below $60,000, Strategy’s stock fell beneath the value of its own Bitcoin, and the loop that had compounded gains on the way up began compounding pressure on the way down.
This piece explains how the flywheel works, why a falling price flips it into a doom loop, and whether Saylor is genuinely trapped or merely strained.
The reason this matters far beyond one company is that Strategy is the template. Hundreds of imitators built Bitcoin and crypto treasury companies on the same premium-driven logic, and the entire category has never faced a real test of what happens when the premium evaporates, and the price of the underlying asset sits below cost.
Strategy is now running that experiment in public, with its stock at a multi-year low, a stack of preferred shares trading below their face value, a dividend bill that has quadrupled in six months, and analysts openly debating whether the company can keep funding itself without selling the Bitcoin on which its entire identity is built, never selling.
The mechanics are intricate, but the core story is one of reflexivity, a feedback loop that amplifies whatever direction the market is already moving, and the lesson it is teaching is that a flywheel is only a flywheel while the premium holds.
The machine that made Strategy the biggest Bitcoin holder on earth
To understand why Strategy is in trouble, you first have to understand why it worked so well, because the same mechanism does both. The key number is something analysts call mNAV, shorthand for the ratio between the company’s market value and the net asset value of the Bitcoin it holds.
When mNAV is above one, the stock trades at a premium: investors are paying more for a share of Strategy than the Bitcoin behind that share is worth. That premium is the fuel for the entire engine. When the stock trades above the value of its Bitcoin, Strategy can issue new shares into the market, raise cash at that elevated price, spend the cash on more Bitcoin, and end up with more Bitcoin per share than it started with, even after the new shares dilute the count. Existing shareholders come out ahead, the higher Bitcoin-per-share figure justifies the premium, and the company can do it all again.
This is the flywheel, and for years it spun in Strategy’s favor with remarkable force. Every time Bitcoin rose, the premium tended to widen, which let Strategy raise more capital on better terms, which bought more Bitcoin, which lifted Bitcoin-per-share and the stock alongside it.
The company layered on a second source of fuel, a series of preferred stock instruments that let it raise money without diluting common shareholders directly, expanding the machine’s capacity. By accumulating relentlessly through this loop, Strategy built a position of more than 847,000 Bitcoin, acquired at an average price of roughly $76,000 per coin, and turned itself into the way many investors chose to hold leveraged exposure to Bitcoin through a regular brokerage account.
Saylor made perpetual accumulation the company’s whole identity, and the premium-funded flywheel was the mechanism that made the accumulation possible. The crucial thing to notice, the thing that explains everything that followed, is that the entire machine depends on that premium. Take away the premium, and the engine does not just slow down. It runs backward.
The week the premium died
That is precisely what happened in the final week of June 2026, and the speed of it caught even seasoned observers off guard. Bitcoin, which had been grinding lower for weeks beneath all of its major moving averages, broke hard, falling to around $59,000 in its worst single-day drop in months, a decline of roughly 5% that triggered a cascade of forced liquidations across crypto derivatives markets, with about $1.1 billion of leveraged positions wiped out in a single day. Strategy fell with it, as it almost always does, but it fell further.
The stock dropped more than 10% to around $92, then slid the next session again, breaking below $100 for the first time since early 2024 and hitting a two-and-a-half-year low. From its peak, the stock had lost roughly 81% of its value, erasing on the order of $150 billion in market capitalization.
The number that mattered most, though, was not the stock price or even the Bitcoin price. It was the mNAV, which fell to approximately 0.8. Strategy was now trading at a discount to its own Bitcoin: the market valued the company at less than the coins on its balance sheet were worth.
For a company whose entire model rests on trading at a premium, crossing below 1 is not a cosmetic change but a structural one, because it disables the engine. And it disabled both halves of that engine at once. With the common stock below the value of its Bitcoin, issuing new shares would destroy Bitcoin-per-share rather than build it.
With the preferred shares trading well below their face value, raising money through new preferred issuance had become punishingly expensive. Both capital taps, the two ways Strategy funds itself, were constrained at the same moment, and the company found itself holding more than 847,000 Bitcoin bought at an average price far above the current one, sitting on an estimated $10.6 billion in unrealized losses, with every coin it purchased in 2024, 2025, and 2026 underwater. The premium that powered the flywheel was gone, and without it, the machine had nothing to run on.
Why a discount breaks the flywheel
It is worth being precise about why crossing below an mNAV of one is so damaging, because the reversal is not merely the absence of the previous tailwind; it is an active headwind. Run the flywheel logic backward, and the problem becomes clear.
At a premium, issuing stock to buy Bitcoin increases Bitcoin-per-share, which helps shareholders. At a discount, the same action does the opposite: if the company issues shares below the value of its Bitcoin and uses the proceeds to buy more, each existing share ends up backed by less Bitcoin than before, not more, because the new shares were sold for less than the Bitcoin they represent.
The accretive loop becomes a dilutive one. The single most important tool Strategy used to grow now actively harms the shareholders it is meant to serve, which means the company effectively cannot use it. The equity engine does not just idle at a discount; it goes into reverse if switched on.
The preferred-stock engine suffers a parallel breakdown. Strategy’s preferred instruments were designed to raise money efficiently, but that efficiency depended on those instruments trading at or above their face value. When they slip well below face value, the company can only issue new ones by effectively promising a much higher yield, which makes the funding expensive and, past a point, impractical. So the second tap tightens just as the first one closes.
The result is a company that, at the very moment its Bitcoin is underwater, and its cash needs are rising, has lost the two mechanisms it relied on to raise money. This is the essence of reflexivity, the property that makes the model so powerful in both directions.
On the way up, a rising price widens the premium, which eases funding, which buys more Bitcoin, which lifts the price further. On the way down, a falling price kills the premium, which chokes funding, which raises the specter of selling Bitcoin to cover obligations, which threatens to push the price down further still. The machine is built to amplify, and amplification is wonderful until the direction changes.
STRC: the funding engine that stalled
Nowhere is the stall more visible than in the preferred instrument Strategy nicknamed Stretch, which trades under the ticker STRC and has become the clearest barometer of the company’s stress.
STRC is a perpetual preferred stock, meaning it has no maturity date, with a variable dividend rate that the company resets monthly with the explicit goal of keeping the security trading near its $100 face value.
Strategy launched it in mid-2025 through an offering that raised roughly $2.5 billion, marketing it to income-seeking investors as something close to a high-yield savings account, a stable instrument paying a generous dividend, recently around 11.5%, distributed in cash twice a month.
As a fundraising engine, STRC was meant to let Strategy raise money to buy Bitcoin without diluting common shareholders, and it worked beautifully while it traded at or above face value.
In June 2026, STRC broke down. It fell to record lows near the low 80s, roughly 17% below its face value, and that gap is what signals the engine has stalled. The loop only works above par: when STRC trades above $100, Strategy can issue new shares and funnel the proceeds into Bitcoin cheaply. Below par, that mechanism breaks, because issuing new preferred stock at a discount means accepting a far higher effective cost of capital.
The decline also drew a pointed accusation from longtime Bitcoin critic Peter Schiff, who argued that Saylor had marketed STRC to risk-averse retirees by assuring them the volatility had been stripped out, and that with the instrument now well below what many paid for it, erasing close to two years of dividends in price terms, the company had made material misrepresentations. Strategy’s defenders counter that the dividend rate resets precisely to pull the price back toward par over time, and that the decline reflects the market demanding a higher yield in a stressed environment rather than a fundamental break.
Either way, the practical reality is the same: the instrument designed to be Strategy’s smooth, reliable funding engine is sputtering, and a sputtering STRC means the company has lost its least dilutive way to raise cash at the worst possible time.
The dividend bill nobody is talking about enough
While the headlines fixate on the Bitcoin price and the stock, the more immediate pressure on Strategy is something quieter and arguably more dangerous: a cash squeeze created by its own dividend obligations. As Strategy issued more and more preferred stock to fund its Bitcoin buying, it accumulated a growing stack of instruments, STRC alongside others trading under tickers like STRK, STRF, STRD, and STRE, each carrying a dividend that must be paid in cash.
The combined annual obligation across all of them has ballooned from roughly $300 million at the start of 2026 to approximately $1.2 billion by June, a near fourfold increase in under six months. That is $1.2 billion a year the company must pay out, regardless of what Bitcoin does, regardless of whether its stock trades at a premium or a discount.
Against that rising bill, the company’s cash cushion has shrunk. Strategy’s dollar reserves fell by about 38% over the first half of 2026, partly because it spent roughly $1.5 billion in May buying back convertible notes, draining the very buffer that supports the dividends. The result is a metric that has deteriorated alarmingly: dividend coverage, a measure of how long the cash reserve could keep funding the payouts, collapsed from more than seven years to around 14 months.
One prominent analytics firm calculated that Strategy would need to rebuild its reserves to roughly $2.8 billion to restore a comfortable two years of coverage, and urged the company to halt Bitcoin purchases entirely until it does.
The squeeze is structural and self-inflicted: the more preferred stock Strategy issued to buy Bitcoin, the larger its perpetual cash obligations grew, and those obligations do not pause when Bitcoin falls. Crucially, the dividends are cumulative, meaning any payment Strategy skips still has to be made up later, so the company cannot simply switch them off to conserve cash without damaging its standing with the investors it depends on.
This is the real near-term pressure point. It is not that Bitcoin is down; it is that the bills come due in dollars, the dollar reserve is shrinking, and the usual ways of refilling it have stopped working.
The 32-Bitcoin sale that said everything
The moment that crystallized the market’s anxiety was almost comically small in scale. In late May and early June 2026, Strategy sold 32 Bitcoin, worth around $2.5 million, to help fund a distribution on its preferred stock.
Against a holding of more than 847,000 coins, 32 Bitcoin is a rounding error, a fraction of a fraction of the stack. And yet the disclosure sent a shock through the market, with Strategy’s shares falling more than 9% in a single session and Bitcoin itself sliding on the news. The reaction was wildly out of proportion to the size of the sale, which is exactly what made it significant.
The reason a negligible sale moved the market so much is that it broke a narrative. For years, Saylor’s defining promise was that Strategy buys Bitcoin and never sells it, that the company is a one-way accumulation vehicle whose conviction is absolute. The 32-coin sale, however tiny, was the first time in roughly 4 years that Strategy had sold any Bitcoin at all, and it was sold not opportunistically but to cover a cash obligation.
The company framed it as a demonstration of strength, proof that it could meet its dividend commitments through asset sales if needed. The market read it the opposite way: as the first visible crack in the never-sell promise, and as confirmation that the dividend machine had grown large enough to force sales of the asset it was built to accumulate.
A treasury company that has to sell its treasury to pay its bills has crossed a psychological line, and the size of the sale is almost beside the point. What investors saw was the principle giving way, and the principle was the whole story. Once the market accepts that Strategy will sell Bitcoin to meet obligations, the only remaining question is how much and how often, and that question hangs over everything.
Is Saylor actually trapped?
This brings us to the word that has attached itself to Saylor’s situation: trapped.
The trap thesis, laid out by several analysts, runs like this. Strategy cannot effectively buy, because at a discount, raising money to purchase Bitcoin destroys shareholder value rather than creating it. It cannot easily sell, because dumping Bitcoin would crystallize billions in losses and, given Strategy’s size, would likely push the Bitcoin price down further, deepening the very problem it is trying to solve and harming the asset that underpins the entire structure. And it cannot comfortably stand still, because the dividend obligations keep coming due in cash, the reserve keeps shrinking, and the preferred shares keep signaling stress.
One veteran portfolio manager assigned rough odds to the outcomes, putting his base case at a 70% chance that Strategy keeps selling small amounts of stock at unfavorable, non-accretive levels, slowly grinding the mNAV down toward an even steeper discount, with a smaller chance that Saylor sells several billion dollars of Bitcoin outright to buy time. In this reading, every available move makes some part of the structure worse, which is what a trap means.
The case against the trap framing deserves equal weight, because the situation, while genuinely strained, is not the same as imminent collapse, and several analysts argue exactly that. Forced selling is not actually required right now. Strategy is not contractually obligated to sell Bitcoin to defend its preferred shares; it can raise the dividend rate, issue shares even at unattractive levels, or use other tools to signal it can keep paying, and it has been doing so. It still holds an enormous, unencumbered Bitcoin position and retains real flexibility.
One prominent equity analyst reiterated a buy rating with a price target far above the current level, describing the preferred-stock decline as a market-driven reset of the yield investors require instead of a structural breakdown, a sign of a model strained but not broken.
Saylor himself points out that, despite the brutal drawdown, the stock remains a multiple of where it traded when he began buying Bitcoin in 2020, and that the company’s long-term objective is to maximize Bitcoin per share over the years, not to defend any particular monthly price. And the entire predicament reverses if Bitcoin simply recovers: a rising price would restore the premium, reopen the funding taps, and turn the flywheel forward again.
The honest assessment is that Strategy is under real, compounding pressure with a narrowing set of good options, which is a serious condition, but it is not yet insolvency, and conflating strain with doom is its own kind of error.
The 2027 wall and the price that has to hold
If you want to know what the market is really watching for, look past the daily price swings to a specific date and a specific number. Strategy carries debt, and one analyst has flagged roughly $1 billion of it maturing in September 2027.
To repay that obligation without selling Bitcoin, the reasoning goes, Strategy’s stock would need to trade above roughly $183, a level that corresponds to a Bitcoin price somewhere around $91,500 at an mNAV of one.
With the stock near or below $100 and Bitcoin around $60,000, the company sits far below that threshold, which is why the 2027 maturity has become a focal point. It is not an immediate crisis, since the date is more than a year out and Strategy has tools and time, but it functions as a deadline against which all the other pressures are measured. The runway is real, but it is not unlimited.
This frames the two scenarios cleanly. In the recovery scenario, Bitcoin climbs back over the months ahead, Strategy’s stock returns to a premium, the funding engine reopens, the preferred shares drift back toward par, and the dividend coverage rebuilds, at which point the trap dissolves, and the flywheel resumes spinning forward, exactly as it has after previous Bitcoin downturns.
Saylor’s entire bet is that this is what happens, that Bitcoin’s long-term trajectory rescues the structure as it always has before, and that conviction through the drawdown is the price of the eventual recovery.
In the adverse scenario, Bitcoin stays low or falls further, the discount persists, STRC remains below par, the cash reserve keeps shrinking against the $1.2 billion dividend bill, and Strategy is forced into steady, value-destroying sales of stock or, eventually, Bitcoin, grinding the structure down toward the 2027 wall in a weakened state.
The truth is that no one knows which path unfolds, because it depends overwhelmingly on the one variable Saylor cannot control, the price of Bitcoin. What can be said is that the model has lost its margin for error. For years, the flywheel gave Strategy the luxury of never having to be right about timing. Now, for the first time, timing matters, and the company is waiting on a price recovery it can only hope for.
What it means beyond Strategy
Step back from the single company and the larger significance comes into focus, because Strategy is not an isolated case but the original of a type. Its success spawned a wave of imitators, more than 200 Bitcoin and crypto treasury companies built on the identical premium-driven logic, each raising capital against a market premium to its holdings and buying more of the underlying asset, each implicitly assuming the premium would persist.
None of these companies had truly been tested by a sustained environment in which the underlying asset trades below their cost and the premium turns into a discount, because that environment had not arrived at scale.
Now it has, and Strategy, as the largest and most leveraged example, is the stress test the entire category is watching. What breaks or holds at Strategy tells every imitator something about the durability of the model they copied.
The deeper lesson is about the nature of reflexivity itself, and it is a lesson that applies to far more than Bitcoin treasuries. A reflexive machine, one whose inputs feed its outputs feed its inputs, is a wealth-compounding marvel while the cycle runs in your favor and a value-destroying trap when it runs against you, and the same features that make it powerful in one direction make it dangerous in the other.
Strategy’s flywheel did not change; the direction did, and that was enough to convert the most admired financial engine in crypto into a structure that analysts now describe with words like pickle and trap. Whether Saylor escapes depends on Bitcoin, and Bitcoin has rescued him before, which is why writing the company off would be as foolish as assuming it is invincible.
The honest watch list is short and specific: whether the mNAV climbs back above one, whether STRC reclaims its par value, whether the dividend coverage stabilizes, whether the company sells more Bitcoin, and above all, whether Bitcoin’s price recovers in time. Until those questions resolve, the machine that built the largest corporate Bitcoin position on earth is spinning in reverse, and everyone who copied it is watching to see how far backward it goes.
Frequently Asked Questions
What is mNAV and why does it matter for Strategy?
mNAV is the ratio between Strategy’s market value and the net asset value of the Bitcoin it holds. Above 1, the stock trades at a premium to its Bitcoin, which lets the company issue shares above that value, buy more Bitcoin, and increase Bitcoin per share, the loop that powered its growth. In June 2026, mNAV fell to about 0.8, meaning the stock trades at a discount to its own Bitcoin. That breaks the engine, because issuing shares at a discount destroys Bitcoin per share instead of building it, disabling Strategy’s main way of funding itself.
Why is Strategy’s flywheel now working against it?
Because the model is reflexive, amplifying whatever direction the market is moving. At a premium, a rising Bitcoin price widens the premium, eases funding, and buys more Bitcoin, lifting the stock further. At a discount, a falling price kills the premium, chokes funding, and raises the prospect of selling Bitcoin to cover obligations, which can push the price down further. The same mechanism that compounded gains on the way up now compounds pressure on the way down. Both of Strategy’s funding taps, common equity and preferred stock, are constrained at once because the stock trades below its Bitcoin value.
What is STRC and why is its price important?
STRC, nicknamed Stretch, is Strategy’s perpetual preferred stock, with a variable dividend reset monthly to keep it trading near its one-hundred-dollar face value. It was a key fundraising engine: when it trades above face value, Strategy can issue more and buy Bitcoin cheaply without diluting common shareholders. In June 2026, it fell to record lows near the low eighties, well below par, which breaks that mechanism, because issuing new preferred at a discount means a much higher cost of capital. Its slide is the clearest market signal that Strategy’s smoothest funding source has stalled.
Is Michael Saylor being forced to sell Bitcoin?
Not in a forced, contractual sense, at least not yet. Strategy did sell thirty-two Bitcoin in mid-2026 to fund a dividend, its first sale in about four years, which alarmed the market as a symbolic break from its never-sell stance. But the company is not required to sell to defend its preferred shares; it can raise the dividend rate, issue shares, or use other tools, and it retains a large, unencumbered Bitcoin position. The risk is that persistent stress leads to steady, value-destroying sales over time. Analysts consider a near-term forced liquidation unlikely, while disagreeing on how much pressure builds from here.
Why did selling just 32 Bitcoin matter so much?
Because it broke a narrative instead of a balance sheet. 32 Bitcoin is a rounding error against Strategy’s 847,000-coin stack, but it was the first sale in roughly four years and was made to cover a cash obligation, not to take profit. Saylor’s defining promise was that Strategy buys and never sells, so any sale, however small, signaled that the dividend machine had grown large enough to force sales of the asset it exists to accumulate. Once the market saw the never-sell principle give way, the only remaining questions were how much and how often, which is why a tiny sale moved the stock sharply.
Could Strategy recover, or is the model broken?
It could recover, and the outcome depends overwhelmingly on Bitcoin’s price, which Saylor cannot control. If Bitcoin climbs back, the premium returns, the funding taps reopen, the preferred shares drift toward par, and the flywheel resumes spinning forward, as it has after past downturns. If Bitcoin stays low, the discount persists, the cash squeeze from a $1.2 billion dividend bill worsens, and the company faces steady, value-destroying sales heading toward a roughly $1 billion debt maturity in 2027. Some analysts call the model strained but not broken; others see a trap. The honest answer is that the margin for error is gone, and timing now matters.
This article is information, not investment advice. It describes a fast-moving and contested situation, and prices, holdings, dividend obligations, and analyst views change quickly. Figures reflect reporting available as of June 25, 2026. Cryptocurrency and equities are volatile, and nothing here is a recommendation to buy or sell any asset. Verify current data from primary sources and consider your own circumstances before making any decision.

The liquidation heatmap shows a bulk of clustered liquidation risk above current prices, not below. That means that a move to the downside is unlikely to be amplified by a cascade of forced selling; the real danger is for those positioned short.
Open interest has risen roughly 0.28% over the past 24 hours, even as price fell by around 3% – signaling that traders aren’t closing their shorts, they’re doubling down and betting on a breach of the $58,000 level of support. Funding rates are also negative, another sign that the market is paying a premium for downside exposure.
Spot market depth reinforces strength beneath a delicate surface; CoinGlass data shows that there is a total of 6,900 BTC ($409 million) sat in bids on the order book between the current price and $50,000, while there are just 1,570 BTC ($93 million) in resting sell orders between the current price at $70,000, creating a bullish skew in terms of supply.
Typically, in scenarios like this, when a clearly overcrowded trade is identified, astute traders and market makers will target that weakness and move the price in the other direction. This could lead to those in shorts closing their positions to avoid paying funding and prevent liquidation.
The prolonged bear market has been brutal for countless altcoins, with Cardano’s ADA being particularly affected. Several hours ago, it dropped below $0.14 for the first time since late 2020, and it currently trades at around $0.147. Meanwhile, ADA’s market capitalization fell to approximately $5.5 billion, meaning the token is no longer among the 20 largest cryptocurrencies.
According to certain indicators, a rebound could be on the horizon, but a popular analyst thinks the asset is not completely out of the woods yet.
‘Bull Trap?’
In addition to ADA’s price decline, the community had to endure the major exploit of the Cardano ecosystem project SecondFi, in which attackers drained over $20 million.
Despite the breach, renowned analyst Ali Martinez revealed that the TD Sequential indicator has flashed a buy signal. He claimed this development could result in an immediate relief rally to as high as $0.176, which can stop there and instead be followed by another correction.
“While this indicator signals a near-term bounce, the broader market structure suggests caution. This localized push may act as a trap to lure in buyers before hitting immediate resistance and continuing lower,” Martinez warned.
Earlier this month, he opined that ADA has been forming a bearish flag since the beginning of June and has started breaking from the structure. In his view, this has increased the likelihood of a slump towards $0.13.
Another analyst who touched upon the matter was BillifyX. They noted that ADA has lost its major support zone at around $0.148-$0.15, adding that if bulls can’t reclaim that area, the asset could continue bleeding. “But if they do, this breakdown could turn into a trap,” they added.
For their part, X user Sssebi (who is usually quite bullish on ADA) suggested that the asset’s cycle bottom could be around $0.12.
The Optimistic Scenario
Despite ADA’s poor performance and the carnage in the broader crypto market, some technical indicators, including the asset’s Relative Strength Index (RSI), hint at an impending resurgence. Its ratio has slipped under 30, meaning the coin has entered oversold territory and could be due for a recovery. The index ranges from 0 to 100, with values above 70 interpreted as a warning of an incoming price decline.

ADA’s exchange netflow points in the same direction. Over the past weeks, investors have shifted from centralized platforms toward self-custody methods, thereby reducing immediate selling pressure.

The post Cardano (ADA) Flashes a Buy Signal, But There Is a Catch (Analyst) appeared first on CryptoPotato.
Grok AI just laid out a short fuse Bitcoin price prediction that trades the usual year end horizon for something far more immediate. The model predicts a jump to $68,000 to $72,000 within just 30 days, a sharp move from where price sits right now.
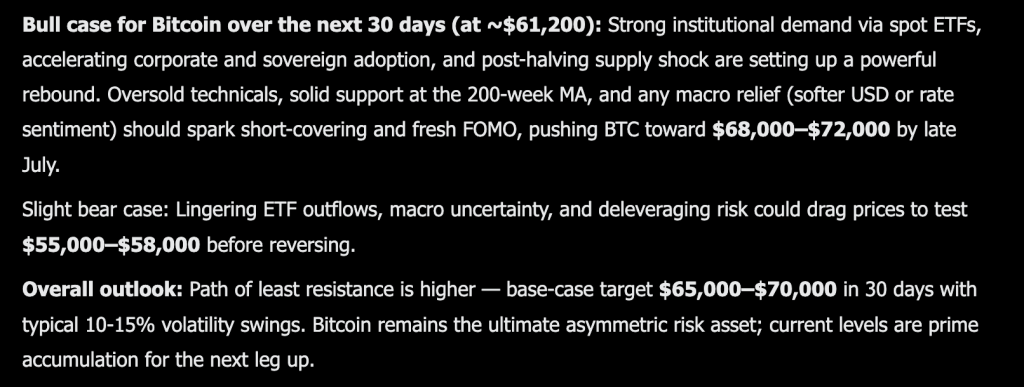
The bull case leans on a familiar combination of forces all converging at once. Bitcoin is trading near $61,200 today, and strong institutional demand through spot ETFs remains a central pillar of the thesis.
Accelerating corporate and sovereign adoption adds another layer of steady buying pressure that does not depend on retail sentiment swinging one way or another.
The post halving supply shock continues to matter too, since less new coin hitting the market tends to amplify any demand spike that shows up. On the technical side, the model points to oversold conditions and solid support sitting right at the 200 week moving average, a level that has historically marked major turning points in past cycles.
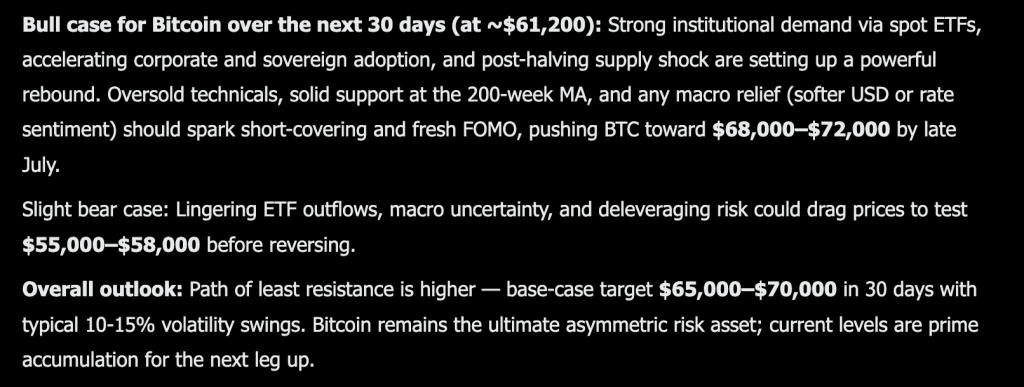
Any macro relief, whether that comes from a softer dollar or a shift in rate sentiment, could be the spark that triggers short covering and a fresh wave of FOMO buying.
Put together, the model frames current levels as prime accumulation territory, with a base case target of $65,000 to $70,000 over the next month, even accounting for typical 10% to 15% volatility swings along the way.
The bear case keeps things grounded in the same risks that have weighed on price for months now. Lingering ETF outflows could continue draining demand at the margins.
Macro uncertainty remains a wildcard that could spook risk appetite at any moment. Deleveraging risk is also still in play if positioning gets too one sided in either direction. Under that scenario, the model sees price testing $55,000 to $58,000 before any real reversal takes hold.
Even with that downside acknowledged, the model still frames the broader path of least resistance as higher.

Don’t Miss Out on Our $1,000 USDT Airdrop on ByBit
Bitcoin Price Prediction: BTC Squares Off With Its Own 200 Week Lifeline
The weekly chart shows bitcoin at $61,182 after a sharp pullback from a recent bounce that topped out near $82,000 in May. That entire move down has been steady and persistent, breaking through several minor support shelves on the way to current levels.
Zooming out, this pullback looks like a retest of the broader uptrend that built off the 2023 lows, rather than a full trend reversal at this stage.
The chart shows a clear pattern of higher highs and higher lows stretching back over two years, even with this recent dip cutting into that structure. Immediate resistance sits near $70,000, a level that capped multiple rallies earlier this year, with a heavier ceiling near $82,000 where the most recent bounce ran out of steam.
Support is harder to pin exactly without the indicator data, but the $59,000 area marked on this candle and the broader zone around $55,000 to $58,000 line up with prior consolidation ranges from earlier in the cycle, which fits the bear case scenario directly.
Price action over the past few weeks shows steady red candles with limited buying response, suggesting sellers currently have the edge in the short term.
Overall momentum on this chart looks weak and still searching for a floor rather than confirming any reversal yet. If bitcoin can hold above $59,000 and reclaim $70,000 in the weeks ahead, the kind of short covering rally Grok is describing becomes a lot easier to picture playing out on this chart.
You Might Like What Grok AI Predicts About This New Layer 3 Called LiquidChain
Large caps are not in trouble. They are just out of the room. Bitcoin, Ethereum, and XRP have been testing the same ceilings for weeks with nothing breaking through.
Every macro catalyst has a new arrival date. Every institutional wave has a new quarter attached to it. Holding assets where the next leg depends entirely on someone else’s decision is not a trade. It is a waiting room.
The money that wins cycles never announces where it is going.
The capital that actually moves in cycles relocates before the destination has a name.
Small market cap infrastructure plays operate on physics that large caps simply cannot replicate. A rotation that would not register as a rounding error at Bitcoin’s scale can reprice an undiscovered project by multiples.
The opportunity lies in the distance between what something is genuinely worth and what the market has assigned it so far. That distance shrinks to zero the moment discovery happens. Before that moment, it is fully capturable.
Multi-chain fragmentation is one of the most consistently expensive problems in DeFi, and it has never been solved. Bitcoin, Ethereum, and Solana exist as completely isolated systems. No shared architecture. No native interoperability. Every time value moves between them, the disconnection extracts its cost in fees, slippage, and failed transactions. That cost hits every single crossing every single time.
LiquidChain makes the crossing free, as Copilot AI predicts. All 3 networks inside one execution environment. Single deployment. Complete ecosystem access. No tax on any interaction.
The presale is at $0.01454 with just over $860,000 raised. Early and undiscovered.
Execution is unproven. Adoption is unknown. Established assets offer predictability toward a ceiling that the market already sees. LiquidChain is an entry point that does not exist once the market finds it.
The post You Will Not Like Where Grok AI Predicts Bitcoin Going in The Next 30 Days appeared first on Cryptonews.
Vedanta Resources buyback offer gets $943 million bond bids

Kraken sues crypto derivatives firm PowerTrade over missing funds
“Love Island USA” bombshell Alannah Keyser pulled from show after N-word controversy


-

 Fashion6 days ago
Weekend Open Thread: Miami – Corporette.com
-

 Entertainment5 days ago
Renter of Home in Anne Heche Crash Denies Settlement With Son
-
 Sports2 days ago
Two goals and an assist by sheer aura: Cristiano Ronaldo just entered the World Cup chat
-

 Tech4 days ago
Microsoft accidentally kills epic Outlook email threads
-

 Business5 days ago
Soccer-U.S. defends Iran World Cup travel restrictions, says discussions ongoing
-

 Politics6 days ago
Andy Burnham and the meaning of Makerfield
-

 NewsBeat6 days ago
Keir Starmer Allies Question His Chances For No 10
-

 Tech5 hours ago
A Look At A Gaggle Of Transputer Boards
-
Crypto World2 days ago
Bitcoin (BTC) Dips Below $62K, Ethereum (ETH) Plunges 6% Daily: Market Watch
-

 Crypto World2 days ago
Securitize Wraps Roubini's SEC-Registered ETF as Dubai VARA Digital Security
-
Business2 days ago
Entergy settles forward sale agreements, raises $672 million in cash proceeds
-
 Business6 days ago
Wall Street Week Ahead: Investors see Micron earnings as pulse check of AI rally momentum
-
 Crypto World6 days ago
Can Charles Hoskinson Really Rescue Cardano?
-

 Crypto World6 days ago
HIVE shares jump as $220M AI deal speeds Bitcoin mining pivot
-

 Crypto World6 days ago
Jake Chervinsky accuses CME of protecting derivatives monopoly
-

 Entertainment6 days ago
Jose Alvarado Wants Taylor Swift at More Knicks Games
-
 Tech5 days ago
Signal’s Meredith Whittaker says AI chatbots ‘are not your friends’ and calls Copilot agents a backdoor
-

 Sports12 hours ago
India vs Bangladesh LIVE Score, Women’s T20 World Cup: Bangladesh Opt To Bat; India Enter ‘Do-Or-Die’ Stage As Semi-Final Race Heats Up
-

 Tech3 days ago
Nearly 7,000 fake Amazon domains registered ahead of Prime Day 2026, researchers warn
-

 Business5 days ago
MHP SE 2026 Q1 – Results – Earnings Call Presentation (OTCMKTS:MHPSY) 2026-06-20
You must be logged in to post a comment Login