
Crypto World
Saylor’s Bitcoin Flywheel Is Now Spinning in Reverse



Strategy turned a software company into the largest corporate Bitcoin holder on earth by exploiting a simple loop: trade above your Bitcoin’s value, issue stock, buy more Bitcoin, repeat. In June 2026, Bitcoin broke below $60,000, the stock fell under its own Bitcoin value, and the loop began running the other way. Here is how the machine works, why it reverses, and whether Saylor is actually trapped.
Summary
- Strategy’s mNAV fell to roughly 0.80, meaning its stock trades below the value of the Bitcoin it holds, which disables the premium-funded loop the company used to grow.
- The same reflexive flywheel that compounded gains on the way up now compounds pressure on the way down: at a discount, issuing equity destroys Bitcoin per share, and issuing preferred stock turns expensive, choking both funding taps at once.
- Annual dividend obligations across its preferred stack quadrupled to about $1.2 billion while cash reserves fell roughly 38%, collapsing dividend coverage from more than seven years to around 14 months.
- STRC, the key funding instrument, trades near $82 against a $100 par value, and a tiny 32-Bitcoin sale to fund a dividend broke Strategy’s long-standing never-sell narrative.
- Analysts are split between a “trap” thesis and a “strained but not broken” view, and the outcome hinges almost entirely on Bitcoin’s price, with a roughly $1 billion debt maturity in 2027 as the key deadline.
For five years, Michael Saylor ran one of the most effective financial machines in modern markets, a self-reinforcing loop that converted a mid-sized software company into the largest corporate holder of Bitcoin on earth, with more than 847,000 coins on its balance sheet.
The machine had a simple engine at its center: as long as Strategy’s stock traded at a premium to the value of the Bitcoin it held, the company could issue new shares or preferred stock above that value, use the cash to buy more Bitcoin, and increase the amount of Bitcoin backing each existing share, which justified the premium and let the loop run again. It was elegant, it was relentless, and for a long time, it worked spectacularly, turning Strategy into a Bitcoin proxy that often rose faster than Bitcoin itself.
In late June 2026, that engine threw itself into reverse. Bitcoin crashed below $60,000, Strategy’s stock fell beneath the value of its own Bitcoin, and the loop that had compounded gains on the way up began compounding pressure on the way down.
This piece explains how the flywheel works, why a falling price flips it into a doom loop, and whether Saylor is genuinely trapped or merely strained.
The reason this matters far beyond one company is that Strategy is the template. Hundreds of imitators built Bitcoin and crypto treasury companies on the same premium-driven logic, and the entire category has never faced a real test of what happens when the premium evaporates, and the price of the underlying asset sits below cost.
Strategy is now running that experiment in public, with its stock at a multi-year low, a stack of preferred shares trading below their face value, a dividend bill that has quadrupled in six months, and analysts openly debating whether the company can keep funding itself without selling the Bitcoin on which its entire identity is built, never selling.
The mechanics are intricate, but the core story is one of reflexivity, a feedback loop that amplifies whatever direction the market is already moving, and the lesson it is teaching is that a flywheel is only a flywheel while the premium holds.
The machine that made Strategy the biggest Bitcoin holder on earth
To understand why Strategy is in trouble, you first have to understand why it worked so well, because the same mechanism does both. The key number is something analysts call mNAV, shorthand for the ratio between the company’s market value and the net asset value of the Bitcoin it holds.
When mNAV is above one, the stock trades at a premium: investors are paying more for a share of Strategy than the Bitcoin behind that share is worth. That premium is the fuel for the entire engine. When the stock trades above the value of its Bitcoin, Strategy can issue new shares into the market, raise cash at that elevated price, spend the cash on more Bitcoin, and end up with more Bitcoin per share than it started with, even after the new shares dilute the count. Existing shareholders come out ahead, the higher Bitcoin-per-share figure justifies the premium, and the company can do it all again.
This is the flywheel, and for years it spun in Strategy’s favor with remarkable force. Every time Bitcoin rose, the premium tended to widen, which let Strategy raise more capital on better terms, which bought more Bitcoin, which lifted Bitcoin-per-share and the stock alongside it.
The company layered on a second source of fuel, a series of preferred stock instruments that let it raise money without diluting common shareholders directly, expanding the machine’s capacity. By accumulating relentlessly through this loop, Strategy built a position of more than 847,000 Bitcoin, acquired at an average price of roughly $76,000 per coin, and turned itself into the way many investors chose to hold leveraged exposure to Bitcoin through a regular brokerage account.
Saylor made perpetual accumulation the company’s whole identity, and the premium-funded flywheel was the mechanism that made the accumulation possible. The crucial thing to notice, the thing that explains everything that followed, is that the entire machine depends on that premium. Take away the premium, and the engine does not just slow down. It runs backward.
The week the premium died
That is precisely what happened in the final week of June 2026, and the speed of it caught even seasoned observers off guard. Bitcoin, which had been grinding lower for weeks beneath all of its major moving averages, broke hard, falling to around $59,000 in its worst single-day drop in months, a decline of roughly 5% that triggered a cascade of forced liquidations across crypto derivatives markets, with about $1.1 billion of leveraged positions wiped out in a single day. Strategy fell with it, as it almost always does, but it fell further.
The stock dropped more than 10% to around $92, then slid the next session again, breaking below $100 for the first time since early 2024 and hitting a two-and-a-half-year low. From its peak, the stock had lost roughly 81% of its value, erasing on the order of $150 billion in market capitalization.
The number that mattered most, though, was not the stock price or even the Bitcoin price. It was the mNAV, which fell to approximately 0.8. Strategy was now trading at a discount to its own Bitcoin: the market valued the company at less than the coins on its balance sheet were worth.
For a company whose entire model rests on trading at a premium, crossing below 1 is not a cosmetic change but a structural one, because it disables the engine. And it disabled both halves of that engine at once. With the common stock below the value of its Bitcoin, issuing new shares would destroy Bitcoin-per-share rather than build it.
With the preferred shares trading well below their face value, raising money through new preferred issuance had become punishingly expensive. Both capital taps, the two ways Strategy funds itself, were constrained at the same moment, and the company found itself holding more than 847,000 Bitcoin bought at an average price far above the current one, sitting on an estimated $10.6 billion in unrealized losses, with every coin it purchased in 2024, 2025, and 2026 underwater. The premium that powered the flywheel was gone, and without it, the machine had nothing to run on.
Why a discount breaks the flywheel
It is worth being precise about why crossing below an mNAV of one is so damaging, because the reversal is not merely the absence of the previous tailwind; it is an active headwind. Run the flywheel logic backward, and the problem becomes clear.
At a premium, issuing stock to buy Bitcoin increases Bitcoin-per-share, which helps shareholders. At a discount, the same action does the opposite: if the company issues shares below the value of its Bitcoin and uses the proceeds to buy more, each existing share ends up backed by less Bitcoin than before, not more, because the new shares were sold for less than the Bitcoin they represent.
The accretive loop becomes a dilutive one. The single most important tool Strategy used to grow now actively harms the shareholders it is meant to serve, which means the company effectively cannot use it. The equity engine does not just idle at a discount; it goes into reverse if switched on.
The preferred-stock engine suffers a parallel breakdown. Strategy’s preferred instruments were designed to raise money efficiently, but that efficiency depended on those instruments trading at or above their face value. When they slip well below face value, the company can only issue new ones by effectively promising a much higher yield, which makes the funding expensive and, past a point, impractical. So the second tap tightens just as the first one closes.
The result is a company that, at the very moment its Bitcoin is underwater, and its cash needs are rising, has lost the two mechanisms it relied on to raise money. This is the essence of reflexivity, the property that makes the model so powerful in both directions.
On the way up, a rising price widens the premium, which eases funding, which buys more Bitcoin, which lifts the price further. On the way down, a falling price kills the premium, which chokes funding, which raises the specter of selling Bitcoin to cover obligations, which threatens to push the price down further still. The machine is built to amplify, and amplification is wonderful until the direction changes.
STRC: the funding engine that stalled
Nowhere is the stall more visible than in the preferred instrument Strategy nicknamed Stretch, which trades under the ticker STRC and has become the clearest barometer of the company’s stress.
STRC is a perpetual preferred stock, meaning it has no maturity date, with a variable dividend rate that the company resets monthly with the explicit goal of keeping the security trading near its $100 face value.
Strategy launched it in mid-2025 through an offering that raised roughly $2.5 billion, marketing it to income-seeking investors as something close to a high-yield savings account, a stable instrument paying a generous dividend, recently around 11.5%, distributed in cash twice a month.
As a fundraising engine, STRC was meant to let Strategy raise money to buy Bitcoin without diluting common shareholders, and it worked beautifully while it traded at or above face value.
In June 2026, STRC broke down. It fell to record lows near the low 80s, roughly 17% below its face value, and that gap is what signals the engine has stalled. The loop only works above par: when STRC trades above $100, Strategy can issue new shares and funnel the proceeds into Bitcoin cheaply. Below par, that mechanism breaks, because issuing new preferred stock at a discount means accepting a far higher effective cost of capital.
The decline also drew a pointed accusation from longtime Bitcoin critic Peter Schiff, who argued that Saylor had marketed STRC to risk-averse retirees by assuring them the volatility had been stripped out, and that with the instrument now well below what many paid for it, erasing close to two years of dividends in price terms, the company had made material misrepresentations. Strategy’s defenders counter that the dividend rate resets precisely to pull the price back toward par over time, and that the decline reflects the market demanding a higher yield in a stressed environment rather than a fundamental break.
Either way, the practical reality is the same: the instrument designed to be Strategy’s smooth, reliable funding engine is sputtering, and a sputtering STRC means the company has lost its least dilutive way to raise cash at the worst possible time.
The dividend bill nobody is talking about enough
While the headlines fixate on the Bitcoin price and the stock, the more immediate pressure on Strategy is something quieter and arguably more dangerous: a cash squeeze created by its own dividend obligations. As Strategy issued more and more preferred stock to fund its Bitcoin buying, it accumulated a growing stack of instruments, STRC alongside others trading under tickers like STRK, STRF, STRD, and STRE, each carrying a dividend that must be paid in cash.
The combined annual obligation across all of them has ballooned from roughly $300 million at the start of 2026 to approximately $1.2 billion by June, a near fourfold increase in under six months. That is $1.2 billion a year the company must pay out, regardless of what Bitcoin does, regardless of whether its stock trades at a premium or a discount.
Against that rising bill, the company’s cash cushion has shrunk. Strategy’s dollar reserves fell by about 38% over the first half of 2026, partly because it spent roughly $1.5 billion in May buying back convertible notes, draining the very buffer that supports the dividends. The result is a metric that has deteriorated alarmingly: dividend coverage, a measure of how long the cash reserve could keep funding the payouts, collapsed from more than seven years to around 14 months.
One prominent analytics firm calculated that Strategy would need to rebuild its reserves to roughly $2.8 billion to restore a comfortable two years of coverage, and urged the company to halt Bitcoin purchases entirely until it does.
The squeeze is structural and self-inflicted: the more preferred stock Strategy issued to buy Bitcoin, the larger its perpetual cash obligations grew, and those obligations do not pause when Bitcoin falls. Crucially, the dividends are cumulative, meaning any payment Strategy skips still has to be made up later, so the company cannot simply switch them off to conserve cash without damaging its standing with the investors it depends on.
This is the real near-term pressure point. It is not that Bitcoin is down; it is that the bills come due in dollars, the dollar reserve is shrinking, and the usual ways of refilling it have stopped working.
The 32-Bitcoin sale that said everything
The moment that crystallized the market’s anxiety was almost comically small in scale. In late May and early June 2026, Strategy sold 32 Bitcoin, worth around $2.5 million, to help fund a distribution on its preferred stock.
Against a holding of more than 847,000 coins, 32 Bitcoin is a rounding error, a fraction of a fraction of the stack. And yet the disclosure sent a shock through the market, with Strategy’s shares falling more than 9% in a single session and Bitcoin itself sliding on the news. The reaction was wildly out of proportion to the size of the sale, which is exactly what made it significant.
The reason a negligible sale moved the market so much is that it broke a narrative. For years, Saylor’s defining promise was that Strategy buys Bitcoin and never sells it, that the company is a one-way accumulation vehicle whose conviction is absolute. The 32-coin sale, however tiny, was the first time in roughly 4 years that Strategy had sold any Bitcoin at all, and it was sold not opportunistically but to cover a cash obligation.
The company framed it as a demonstration of strength, proof that it could meet its dividend commitments through asset sales if needed. The market read it the opposite way: as the first visible crack in the never-sell promise, and as confirmation that the dividend machine had grown large enough to force sales of the asset it was built to accumulate.
A treasury company that has to sell its treasury to pay its bills has crossed a psychological line, and the size of the sale is almost beside the point. What investors saw was the principle giving way, and the principle was the whole story. Once the market accepts that Strategy will sell Bitcoin to meet obligations, the only remaining question is how much and how often, and that question hangs over everything.
Is Saylor actually trapped?
This brings us to the word that has attached itself to Saylor’s situation: trapped.
The trap thesis, laid out by several analysts, runs like this. Strategy cannot effectively buy, because at a discount, raising money to purchase Bitcoin destroys shareholder value rather than creating it. It cannot easily sell, because dumping Bitcoin would crystallize billions in losses and, given Strategy’s size, would likely push the Bitcoin price down further, deepening the very problem it is trying to solve and harming the asset that underpins the entire structure. And it cannot comfortably stand still, because the dividend obligations keep coming due in cash, the reserve keeps shrinking, and the preferred shares keep signaling stress.
One veteran portfolio manager assigned rough odds to the outcomes, putting his base case at a 70% chance that Strategy keeps selling small amounts of stock at unfavorable, non-accretive levels, slowly grinding the mNAV down toward an even steeper discount, with a smaller chance that Saylor sells several billion dollars of Bitcoin outright to buy time. In this reading, every available move makes some part of the structure worse, which is what a trap means.
The case against the trap framing deserves equal weight, because the situation, while genuinely strained, is not the same as imminent collapse, and several analysts argue exactly that. Forced selling is not actually required right now. Strategy is not contractually obligated to sell Bitcoin to defend its preferred shares; it can raise the dividend rate, issue shares even at unattractive levels, or use other tools to signal it can keep paying, and it has been doing so. It still holds an enormous, unencumbered Bitcoin position and retains real flexibility.
One prominent equity analyst reiterated a buy rating with a price target far above the current level, describing the preferred-stock decline as a market-driven reset of the yield investors require instead of a structural breakdown, a sign of a model strained but not broken.
Saylor himself points out that, despite the brutal drawdown, the stock remains a multiple of where it traded when he began buying Bitcoin in 2020, and that the company’s long-term objective is to maximize Bitcoin per share over the years, not to defend any particular monthly price. And the entire predicament reverses if Bitcoin simply recovers: a rising price would restore the premium, reopen the funding taps, and turn the flywheel forward again.
The honest assessment is that Strategy is under real, compounding pressure with a narrowing set of good options, which is a serious condition, but it is not yet insolvency, and conflating strain with doom is its own kind of error.
The 2027 wall and the price that has to hold
If you want to know what the market is really watching for, look past the daily price swings to a specific date and a specific number. Strategy carries debt, and one analyst has flagged roughly $1 billion of it maturing in September 2027.
To repay that obligation without selling Bitcoin, the reasoning goes, Strategy’s stock would need to trade above roughly $183, a level that corresponds to a Bitcoin price somewhere around $91,500 at an mNAV of one.
With the stock near or below $100 and Bitcoin around $60,000, the company sits far below that threshold, which is why the 2027 maturity has become a focal point. It is not an immediate crisis, since the date is more than a year out and Strategy has tools and time, but it functions as a deadline against which all the other pressures are measured. The runway is real, but it is not unlimited.
This frames the two scenarios cleanly. In the recovery scenario, Bitcoin climbs back over the months ahead, Strategy’s stock returns to a premium, the funding engine reopens, the preferred shares drift back toward par, and the dividend coverage rebuilds, at which point the trap dissolves, and the flywheel resumes spinning forward, exactly as it has after previous Bitcoin downturns.
Saylor’s entire bet is that this is what happens, that Bitcoin’s long-term trajectory rescues the structure as it always has before, and that conviction through the drawdown is the price of the eventual recovery.
In the adverse scenario, Bitcoin stays low or falls further, the discount persists, STRC remains below par, the cash reserve keeps shrinking against the $1.2 billion dividend bill, and Strategy is forced into steady, value-destroying sales of stock or, eventually, Bitcoin, grinding the structure down toward the 2027 wall in a weakened state.
The truth is that no one knows which path unfolds, because it depends overwhelmingly on the one variable Saylor cannot control, the price of Bitcoin. What can be said is that the model has lost its margin for error. For years, the flywheel gave Strategy the luxury of never having to be right about timing. Now, for the first time, timing matters, and the company is waiting on a price recovery it can only hope for.
What it means beyond Strategy
Step back from the single company and the larger significance comes into focus, because Strategy is not an isolated case but the original of a type. Its success spawned a wave of imitators, more than 200 Bitcoin and crypto treasury companies built on the identical premium-driven logic, each raising capital against a market premium to its holdings and buying more of the underlying asset, each implicitly assuming the premium would persist.
None of these companies had truly been tested by a sustained environment in which the underlying asset trades below their cost and the premium turns into a discount, because that environment had not arrived at scale.
Now it has, and Strategy, as the largest and most leveraged example, is the stress test the entire category is watching. What breaks or holds at Strategy tells every imitator something about the durability of the model they copied.
The deeper lesson is about the nature of reflexivity itself, and it is a lesson that applies to far more than Bitcoin treasuries. A reflexive machine, one whose inputs feed its outputs feed its inputs, is a wealth-compounding marvel while the cycle runs in your favor and a value-destroying trap when it runs against you, and the same features that make it powerful in one direction make it dangerous in the other.
Strategy’s flywheel did not change; the direction did, and that was enough to convert the most admired financial engine in crypto into a structure that analysts now describe with words like pickle and trap. Whether Saylor escapes depends on Bitcoin, and Bitcoin has rescued him before, which is why writing the company off would be as foolish as assuming it is invincible.
The honest watch list is short and specific: whether the mNAV climbs back above one, whether STRC reclaims its par value, whether the dividend coverage stabilizes, whether the company sells more Bitcoin, and above all, whether Bitcoin’s price recovers in time. Until those questions resolve, the machine that built the largest corporate Bitcoin position on earth is spinning in reverse, and everyone who copied it is watching to see how far backward it goes.
Frequently Asked Questions
What is mNAV and why does it matter for Strategy?
mNAV is the ratio between Strategy’s market value and the net asset value of the Bitcoin it holds. Above 1, the stock trades at a premium to its Bitcoin, which lets the company issue shares above that value, buy more Bitcoin, and increase Bitcoin per share, the loop that powered its growth. In June 2026, mNAV fell to about 0.8, meaning the stock trades at a discount to its own Bitcoin. That breaks the engine, because issuing shares at a discount destroys Bitcoin per share instead of building it, disabling Strategy’s main way of funding itself.
Why is Strategy’s flywheel now working against it?
Because the model is reflexive, amplifying whatever direction the market is moving. At a premium, a rising Bitcoin price widens the premium, eases funding, and buys more Bitcoin, lifting the stock further. At a discount, a falling price kills the premium, chokes funding, and raises the prospect of selling Bitcoin to cover obligations, which can push the price down further. The same mechanism that compounded gains on the way up now compounds pressure on the way down. Both of Strategy’s funding taps, common equity and preferred stock, are constrained at once because the stock trades below its Bitcoin value.
What is STRC and why is its price important?
STRC, nicknamed Stretch, is Strategy’s perpetual preferred stock, with a variable dividend reset monthly to keep it trading near its one-hundred-dollar face value. It was a key fundraising engine: when it trades above face value, Strategy can issue more and buy Bitcoin cheaply without diluting common shareholders. In June 2026, it fell to record lows near the low eighties, well below par, which breaks that mechanism, because issuing new preferred at a discount means a much higher cost of capital. Its slide is the clearest market signal that Strategy’s smoothest funding source has stalled.
Is Michael Saylor being forced to sell Bitcoin?
Not in a forced, contractual sense, at least not yet. Strategy did sell thirty-two Bitcoin in mid-2026 to fund a dividend, its first sale in about four years, which alarmed the market as a symbolic break from its never-sell stance. But the company is not required to sell to defend its preferred shares; it can raise the dividend rate, issue shares, or use other tools, and it retains a large, unencumbered Bitcoin position. The risk is that persistent stress leads to steady, value-destroying sales over time. Analysts consider a near-term forced liquidation unlikely, while disagreeing on how much pressure builds from here.
Why did selling just 32 Bitcoin matter so much?
Because it broke a narrative instead of a balance sheet. 32 Bitcoin is a rounding error against Strategy’s 847,000-coin stack, but it was the first sale in roughly four years and was made to cover a cash obligation, not to take profit. Saylor’s defining promise was that Strategy buys and never sells, so any sale, however small, signaled that the dividend machine had grown large enough to force sales of the asset it exists to accumulate. Once the market saw the never-sell principle give way, the only remaining questions were how much and how often, which is why a tiny sale moved the stock sharply.
Could Strategy recover, or is the model broken?
It could recover, and the outcome depends overwhelmingly on Bitcoin’s price, which Saylor cannot control. If Bitcoin climbs back, the premium returns, the funding taps reopen, the preferred shares drift toward par, and the flywheel resumes spinning forward, as it has after past downturns. If Bitcoin stays low, the discount persists, the cash squeeze from a $1.2 billion dividend bill worsens, and the company faces steady, value-destroying sales heading toward a roughly $1 billion debt maturity in 2027. Some analysts call the model strained but not broken; others see a trap. The honest answer is that the margin for error is gone, and timing now matters.
This article is information, not investment advice. It describes a fast-moving and contested situation, and prices, holdings, dividend obligations, and analyst views change quickly. Figures reflect reporting available as of June 25, 2026. Cryptocurrency and equities are volatile, and nothing here is a recommendation to buy or sell any asset. Verify current data from primary sources and consider your own circumstances before making any decision.

Crypto World
Strategy Posts $8.33 Billion Operating Loss As Downturn Pushes Bitcoin Below Acquisition Cost
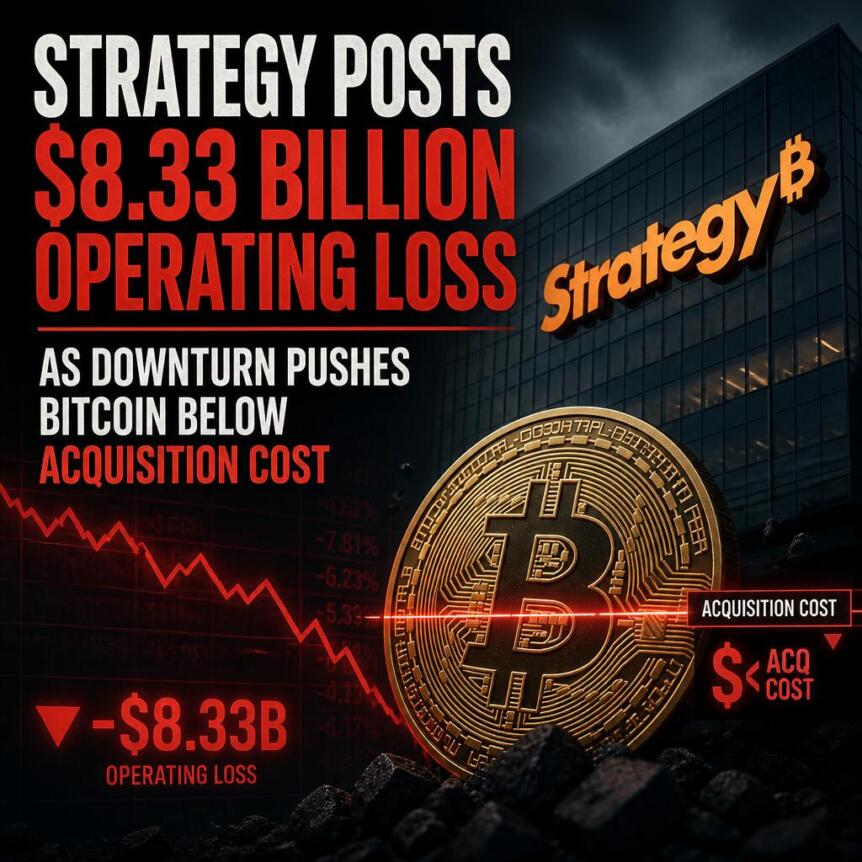
Bitcoin treasury company Strategy has reported a second-quarter operating loss of $8.33 billion, largely due to an unrealized loss of $8.32 billion on its Bitcoin (BTC) holdings. The company currently holds 843,775 BTC, worth $54.77 billion, significantly lower than the $63.69 billion acquisition cost.
Strategy has created a $3.75 billion cash reserve as part of its BTC monetization program to support interest and dividend obligations.
Strategy Losses Deepen
Strategy has reported an operating loss of $8.33 billion in Q2 as unrealized losses on its Bitcoin holdings climbed to $8.32 billion after Bitcoin prices declined substantially. The flagship cryptocurrency traded around $88,400 at the end of 2025 and was near $64,700 when Strategy announced its quarterly earnings. The decline pushed the value of Strategy’s Bitcoin holdings below their aggregate purchase cost of $63.69 billion.
The company recorded an operating loss of $8.33 billion, and a net loss of $8.22 billion, working out to $24.45 per diluted common share. In comparison, Strategy’s net income stood at $10.00 billion during Q2 2025. The quarterly earnings report did not have much impact on Strategy (MSTR) shares. MSTR rose 4.7% during regular trading hours before registering a marginal decline following the report.
Meanwhile, Strategy’s core software business reported quarterly revenue of $122.4 million, a 6.9% increase from a year earlier, and gross profit stood at $81.6 million.
Bitcoin Bet Weighs Heavy
Strategy’s Bitcoin holdings stood at 843,775 BTC as of July 26, with an acquisition cost of $63.69 billion. The company’s Bitcoin holdings are currently valued at $54.77 billion, putting them $8.92 billion underwater. However, this loss is unrealized and reflects the change in BTC’s market value rather than an actual loss from selling the position. Strategy has also sold a small portion of its Bitcoin holdings to fund its dividend obligations, as the company continues to monetize its portfolio when necessary.
Strategy Building Dollar Reserve
Strategy’s capital markets programs have helped raise $17.06 billion this year while reporting a Bitcoin yield of 4.5%. The company also repurchased $1.5 billion of its senior convertible notes at an 8% discount, cutting its convertible debt to $6.71 billion. The move reduces Strategy’s debt burden after declining Bitcoin prices put substantial pressure on its balance sheet. Strategy also expanded its US Dollar Reserve by $525 million to $3.75 billion. The company stated that the reserve can cover dividend obligations for 2.1 years under its current policy. However, it conceded that it cannot guarantee payments under changing or adverse market conditions.
Strategy has also initiated repurchase programs for its common shares and digital credit securities, giving the company the option to buy back securities without using the entire authorized amount.
Strategy Must Maintain Liquidity Phong Le
Strategy CEO Phong Le stressed the importance of maintaining liquid US Dollars to fund dividend obligations during the company’s earnings call. Le stated:
“We thought that liquid Bitcoin would be important, but what Mike [Michael Saylor] mentioned earlier is that the people who are holding these preferreds don’t look at Bitcoin the way they look at U.S. dollars.”
Le stressed that ensuring a Dollar reserve to cover two to three years of dividend obligations is a prudent strategy.
Market Impact
Strategy is the largest publicly traded holder of Bitcoin, giving US investors indirect exposure to the flagship cryptocurrency. The company’s shares reflect fluctuations in Bitcoin’s price and also respond to equity issuance, debt costs, preferred dividends, and any change to its capital structure.
Strategy’s cash reserve and lower convertible debt give the company some financial flexibility. However, the value of its Bitcoin holdings must recover above the acquisition cost. A further decline in Bitcoin prices could deepen unrealized losses and increase pressure on the company.
Disclaimer: This article is provided for informational purposes only. It is not offered or intended to be used as legal, tax, investment, financial, or other advice.

New York has filed a lawsuit against prediction market platform Kalshi, accusing the company of running an illegal, unlicensed gambling operation in the state. The case centers on Kalshi’s event contracts tied to outcomes such as sports results and elections.
In its filing, New York seeks an order stopping Kalshi’s alleged gambling activity, along with forfeiture of “illegal gains,” restitution to users, and civil penalties reportedly set at three times the amount of those gains. Attorney General Letitia James said prediction markets like Kalshi are gambling “plain and simple,” adding that the state is acting to enforce its laws and protect residents.
Key takeaways
- New York is pursuing injunctive relief and financial remedies against Kalshi, framing event contracts as unlicensed gambling.
- The lawsuit follows a cease-and-desist order from the New York State Gaming Commission issued in October 2025.
- Kalshi has challenged the regulator in federal court, but a judge denied its bid for a preliminary injunction in July 2026.
- The dispute escalates a wider fight over whether federally regulated prediction markets can be blocked under state gambling laws.
- Regulators have been increasingly scrutinizing the prediction market sector as it expands—both in mainstream visibility and blockchain-based infrastructure.
New York challenges Kalshi’s business model
The lawsuit targets Kalshi’s offering of contracts whose settlement depends on real-world outcomes, including sports and election-related events. New York’s position is that these products function as gambling and therefore require appropriate state licensing and compliance.
While Kalshi operates as a prediction market platform, New York’s complaint does not treat the platform as merely financial speculation. Instead, it argues that calling the contracts “prediction” does not change their practical nature as wagers on future results.
This action arrives after the New York State Gaming Commission issued a cease-and-desist order in October 2025. Kalshi responded by suing the regulator in federal court, and the immediate conflict has moved through multiple procedural steps.
Earlier this year, a judge denied Kalshi’s request for a preliminary injunction in July. An appeals court later rejected Kalshi’s attempt to halt enforcement while the appeal continues, meaning New York’s efforts can proceed even as the legal battle plays out.
Kalshi’s legal fight intersects with CFTC’s federal oversight
The New York case is part of a broader jurisdictional tug-of-war over prediction markets—specifically whether state gambling laws can restrict products that a federal regulator treats as within its own regulatory scope.
Just before New York filed, the U.S. Commodity Futures Trading Commission (CFTC) submitted an emergency motion in court seeking to block New York’s enforcement efforts. The CFTC argued that the state’s action interferes with the agency’s “exclusive authority” under the Commodity Exchange Act to regulate designated contract markets such as Kalshi.
The CFTC’s approach has been consistent in similar disputes involving other states. In those arguments, the commission has warned that if states can independently ban event contracts listed by federally regulated exchanges, it would create conflicting rules—undermining a uniform federal commodities framework.
That position has been cited in enforcement disputes the CFTC has taken against at least nine states, according to reporting that highlights how the agency frames state restrictions as a threat to federal oversight of commodities markets.
Prediction markets keep attracting mainstream attention
Prediction markets are built on a simple premise: users trade contracts tied to the outcome of future events, and the price of those contracts is intended to reflect market-implied probabilities. In theory, that mechanism helps participants aggregate information about what is likely to happen.
But as the sector grows, regulators across jurisdictions have increasingly treated certain prediction market products as gambling—especially when settlement depends on outcomes and participation mirrors typical wager-based behavior. The resulting legal uncertainty has encouraged closer scrutiny of how platforms structure their offerings and what regulatory category they fall under.
Kalshi is not the only high-profile operator to face regulatory pressure. Its competitor, Polymarket, has also encountered scrutiny from regulators abroad, with some authorities restricting or investigating operations over licensing and gambling-related concerns.
Beyond the regulatory front, prediction markets have also expanded technologically. Kalshi began broadening into blockchain-based infrastructure in December 2025, launching tokenized prediction markets on Solana and later adding support for multiple blockchain networks. That shift mirrors a wider trend in crypto markets, where trading venues seek faster settlement, greater programmability, and broader distribution.
Crypto analytics point to rapid growth in on-chain prediction activity
While the legal battles unfold, on-chain prediction markets have shown signs of growing participation. According to analytics firm Chainalysis, blockchain-based prediction markets processed about $20 billion in trading volume tied to the 2026 FIFA World Cup, with more than 400,000 wallets participating.
The implication for investors and builders is that even as regulators debate classification—commodities regulation versus gambling law—the user demand for outcome-trading continues to show up in measurable on-chain activity. That activity can raise the stakes for platforms that want to operate at scale without running afoul of differing legal interpretations.
For market participants, the tension is straightforward: platforms may market prediction markets as probability markets or informational tools, but regulators may focus on the wager-like economic structure and licensing requirements. The New York lawsuit against Kalshi is a direct test of how far state enforcement can go when a federal agency argues for exclusive jurisdiction under the Commodity Exchange Act.
What to watch next is whether the CFTC’s federal arguments continue to constrain or defeat New York’s enforcement, and whether Kalshi’s appeal of the preliminary-injunction denial changes the immediate timeline. The outcome could shape how other states pursue enforcement against prediction markets—and how platforms design their products to manage regulatory risk.

Japan’s central bank kept interest rates unchanged at 1.0% on Friday, according to a Bank of Japan (BoJ) statement issued after its policy decision. The meeting outcome landed in line with market expectations, even as the yen had just swung sharply following reports of intervention.
The BoJ’s decision came shortly after the Japanese currency strengthened quickly against the US dollar—moving up as much as 3.5% overnight, based on TradingView data—an advance many traders linked to coordinated or related foreign-exchange actions involving the yen. With Japan also flagging inflation pressures later in the year, investors are now watching how currency policy, yields, and global risk appetite intersect for crypto markets.
Key takeaways
- The BoJ held the uncollateralized overnight call rate at around 1.0% after an outcome supported by eight of nine Policy Board members.
- Recent yen volatility reportedly coincided with currency intervention activity involving Japan and South Korea, as the JPY briefly jumped versus the USD.
- The BoJ warned that CPI inflation may accelerate to clearly above 2% from the second half of fiscal 2026.
- Since the yen carry trade unwind in 2024, JPY moves have continued to influence Bitcoin and altcoin risk sentiment.
BoJ holds rates steady after yen turbulence
In its latest statement, the BoJ said it would “encourage the uncollateralized overnight call rate to remain at around 1.0 percent,” confirming a broadly shared view among officials for keeping policy unchanged. The decision was passed by eight of nine members of the Policy Board, with Hajime Takata the only dissenting vote, proposing a 0.25% rate hike.
Markets had largely expected this result ahead of the meeting, according to earlier coverage referenced by Cointelegraph. The policy decision also arrived just hours after the yen’s brief surge—an FX move that coincided with speculation about official action. While the BoJ did not comment directly on the reported intervention, the timing is likely to keep FX traders attentive to any future shifts in the currency’s direction.
Reported Japan–Korea involvement raises the stakes
Several reports tied the yen’s sharp move to intervention efforts. The BoJ did not confirm the details, but commentary in regional media pointed to alignment between Japan and South Korea’s policy priorities. At the time, the South Korean won was reportedly rising as well, suggesting traders were reacting to developments across both currencies.
Analyst Lee Min-hyuk of KB Kookmin Bank, as quoted by Straits Times, argued that cooperation could amplify the impact because the won and yen are closely linked. Separate reporting also noted that the US had conducted “rate checks”—a softer form of intervention that can precede stronger operations—during Thursday’s session, fueling speculation about a wider, multi-country FX response.
Traders typically treat intervention expectations as a constraint on how far a currency can move in either direction. If intervention remains a credible backstop, it can affect not only FX markets but also broader capital flows—an important link for assets like Bitcoin that have repeatedly shown sensitivity to liquidity conditions and global risk changes.
BoJ turns to inflation headwinds for fiscal 2026
Beyond the rate decision, the BoJ’s outlook for prices may carry longer-term significance. In its quarterly Outlook for Economic Activity and Prices, the central bank said the year-on-year rate of increase in the consumer price index (CPI) “is likely to accelerate to a level clearly above 2 percent from the second half of fiscal 2026.”
In the same report, the BoJ pointed to additional drivers of inflation such as durable goods prices. It also referenced the “waning of the effects of high crude oil prices,” tying this shift to factors including the ongoing US–Iran war and the closure of the Strait of Hormuz oil-transit route—elements that can influence energy costs and therefore the inflation trajectory.
For investors, this matters because inflation expectations can eventually pressure policymakers toward tighter conditions, or at minimum change the path of interest-rate expectations. Even though Friday’s decision was unchanged, the direction of the BoJ’s CPI outlook can affect longer-dated yields and, by extension, currency dynamics and carry-trade behavior.
Why yen moves still matter for crypto
FX volatility has remained a meaningful input for crypto traders since the “unwinding” of the yen carry trade in August 2024, when yen funding pressures and related liquidity shifts coincided with significant downside across Bitcoin and other major tokens. Since then, Japan-related rates and the yen’s direction have continued to serve as a proxy for risk conditions—especially when changes in JPY funding costs trigger broader adjustments in global portfolios.
Earlier this year, Arthur Hayes, former CEO of crypto exchange BitMEX, suggested that a weak yen combined with rising Japanese bond yields could encourage some investors to rotate away from low-yielding US bond exposures. In his framing, central bank liquidity interventions and related yield dynamics can flow through to crypto demand by shifting broader risk and liquidity availability.
Hayes also previously argued that USD/JPY could rise significantly—he predicted in December 2025 that the pair might reach as high as 200. While Friday’s BoJ decision does not validate that forecast on its own, the ongoing interplay between FX moves, yields, and policy signals remains central to how traders map macro conditions onto digital-asset positioning.
With the BoJ holding rates steady, the immediate question for markets is whether recent yen strength proves durable or fades—particularly given reports of intervention-linked volatility and the central bank’s warning that inflation pressures could strengthen later in fiscal 2026. Crypto traders will likely watch for follow-through in JPY/USD and Japanese yield expectations, because those variables continue to shape liquidity assumptions that underpin risk appetite.
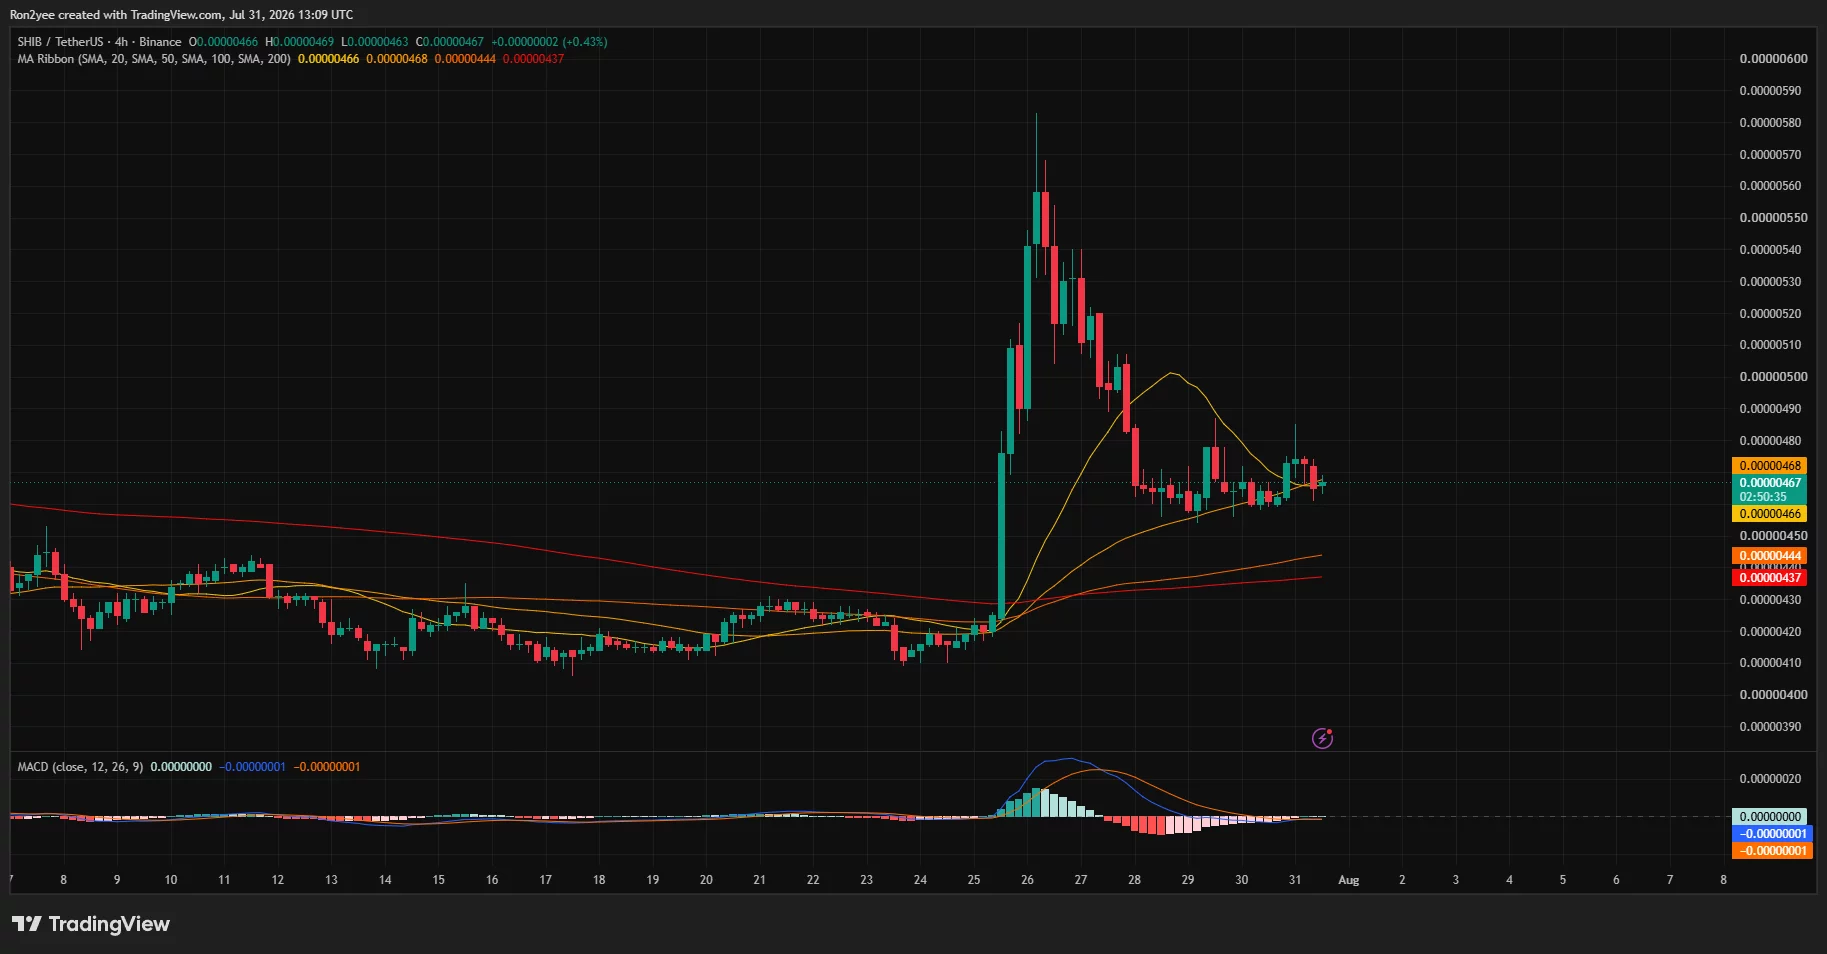
Shiba Inu price surrendered much of its 40% breakout after sellers rejected the meme coin near $0.0000058, leaving bulls to defend a newly established support zone around $0.0000045.
Summary
- SHIB price surged nearly 40% before retreating to approximately $0.0000047.
- Daily ADX climbed to 31.03, confirming that volatility has developed into a stronger directional trend.
- The 4-hour chart places immediate support between $0.00000444 and $0.00000466.
- Liquidation data shows dense leverage near $0.0000045, raising the risk of another volatility spike.
SHIB price rally loses momentum
According to data from crypto.news, SHIB price traded near $0.00000468 on July 31 after its vertical rally encountered heavy selling above $0.0000054. The token briefly reached approximately $0.0000058 during the breakout, marking a gain of nearly 40% from its pre-rally base around $0.0000041.
However, the long upper wick on the 4-hour chart showed that sellers quickly absorbed demand near the peak. SHIB subsequently formed a series of lower highs before stabilizing between $0.0000046 and $0.0000048.
The pullback leaves SHIB roughly 20% below its intraday peak, although the token remains above the range that contained its price through most of July. That distinction matters because the move has not yet completed a full round trip to its breakout point.
South Korean retail activity, a sharp increase in token burns and renewed whale participation reportedly accompanied the rally. However, the rapid reversal suggests that some traders used the sudden liquidity expansion to take profits rather than build longer-term positions.
Four-hour chart shows bulls defending support
SHIB’s 4-hour structure has shifted from a vertical advance into tight consolidation.
The token is trading around its 20-period and 50-period simple moving averages, located near $0.00000466 and $0.00000468, respectively. Holding this area would allow buyers to establish a higher base after the breakout.
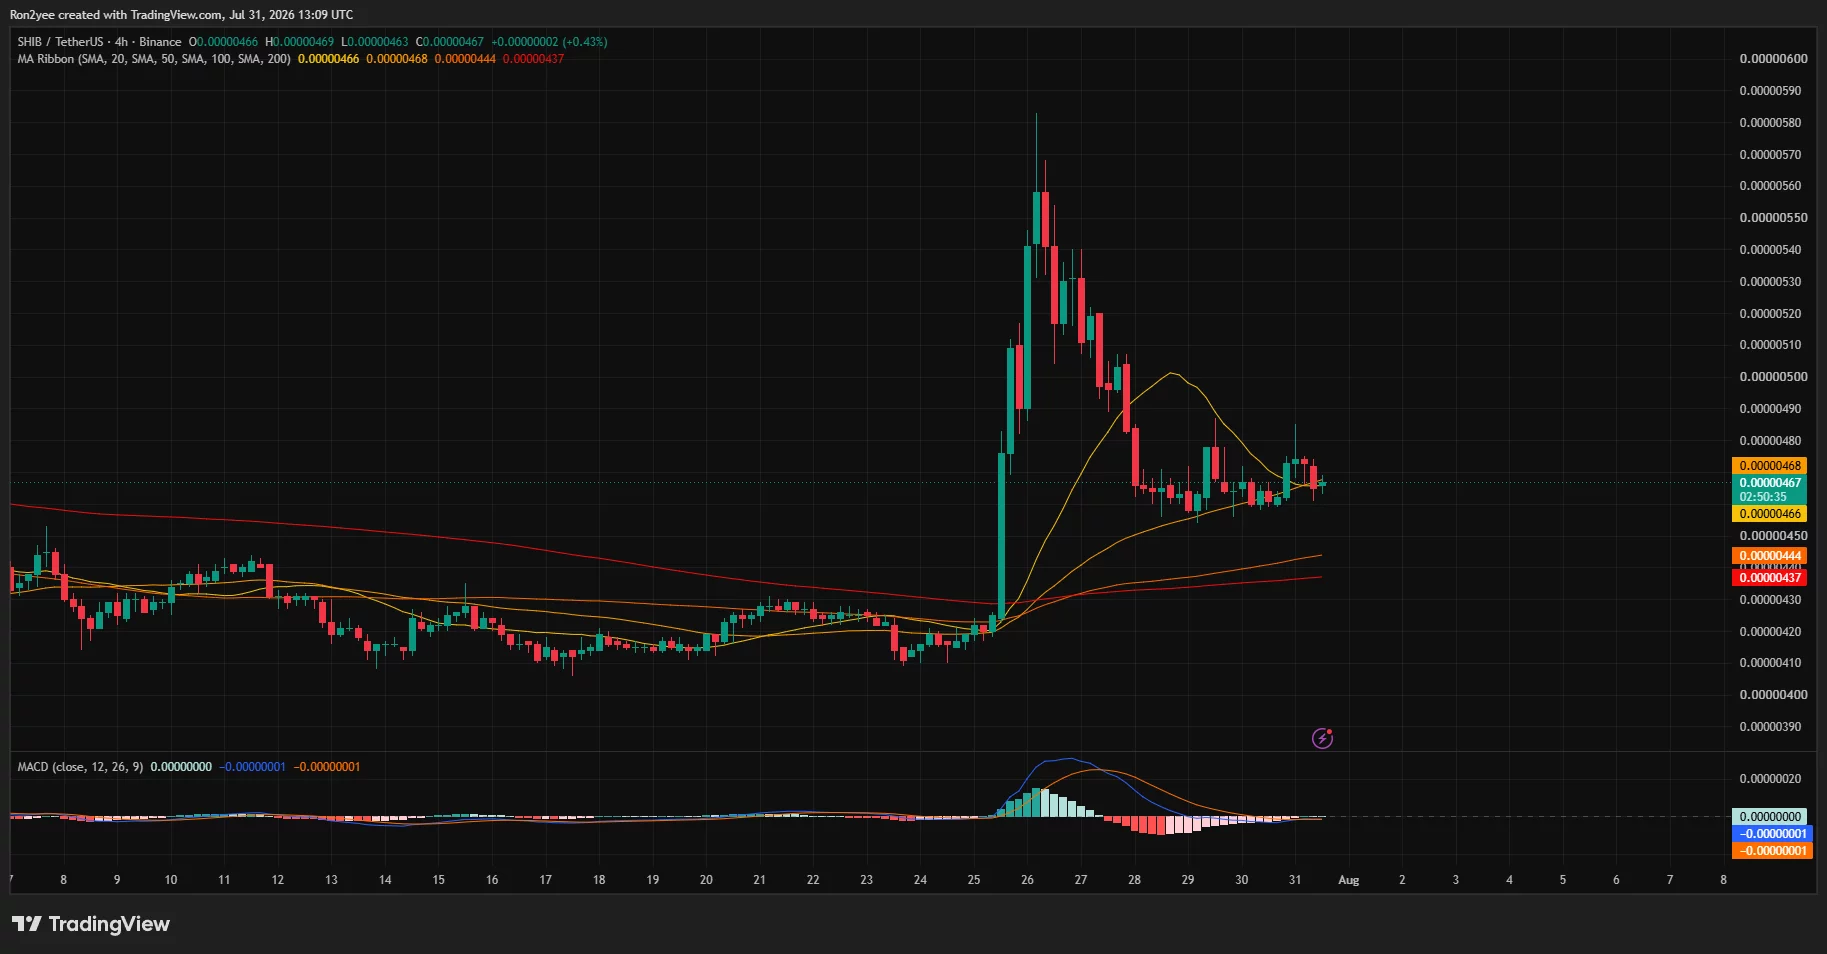
Stronger support sits at the 100-period SMA near $0.00000444 and the 200-period SMA around $0.00000437. Both averages are rising, and SHIB continues to trade above them, preserving the short-term recovery structure.
The moving average convergence divergence indicator is less decisive. Its MACD and signal lines have converged near zero after the earlier bullish impulse faded. This shows that selling momentum has slowed, but buyers have not yet regained enough strength to start another sustained advance.
A 4-hour close above $0.0000048 would be an early bullish signal. SHIB would then face resistance at $0.0000050, followed by the post-breakout supply zone between $0.0000052 and $0.0000054.
SHIB liquidation map warns of a sweep toward $0.0000045
The 3-day liquidation heatmap shows that SHIB is trading between two notable leverage clusters.
The largest nearby concentration sits below the market around $0.00000450 to $0.00000452. This bright liquidity band could attract price if SHIB loses the $0.0000046 floor, potentially triggering leveraged long liquidations.
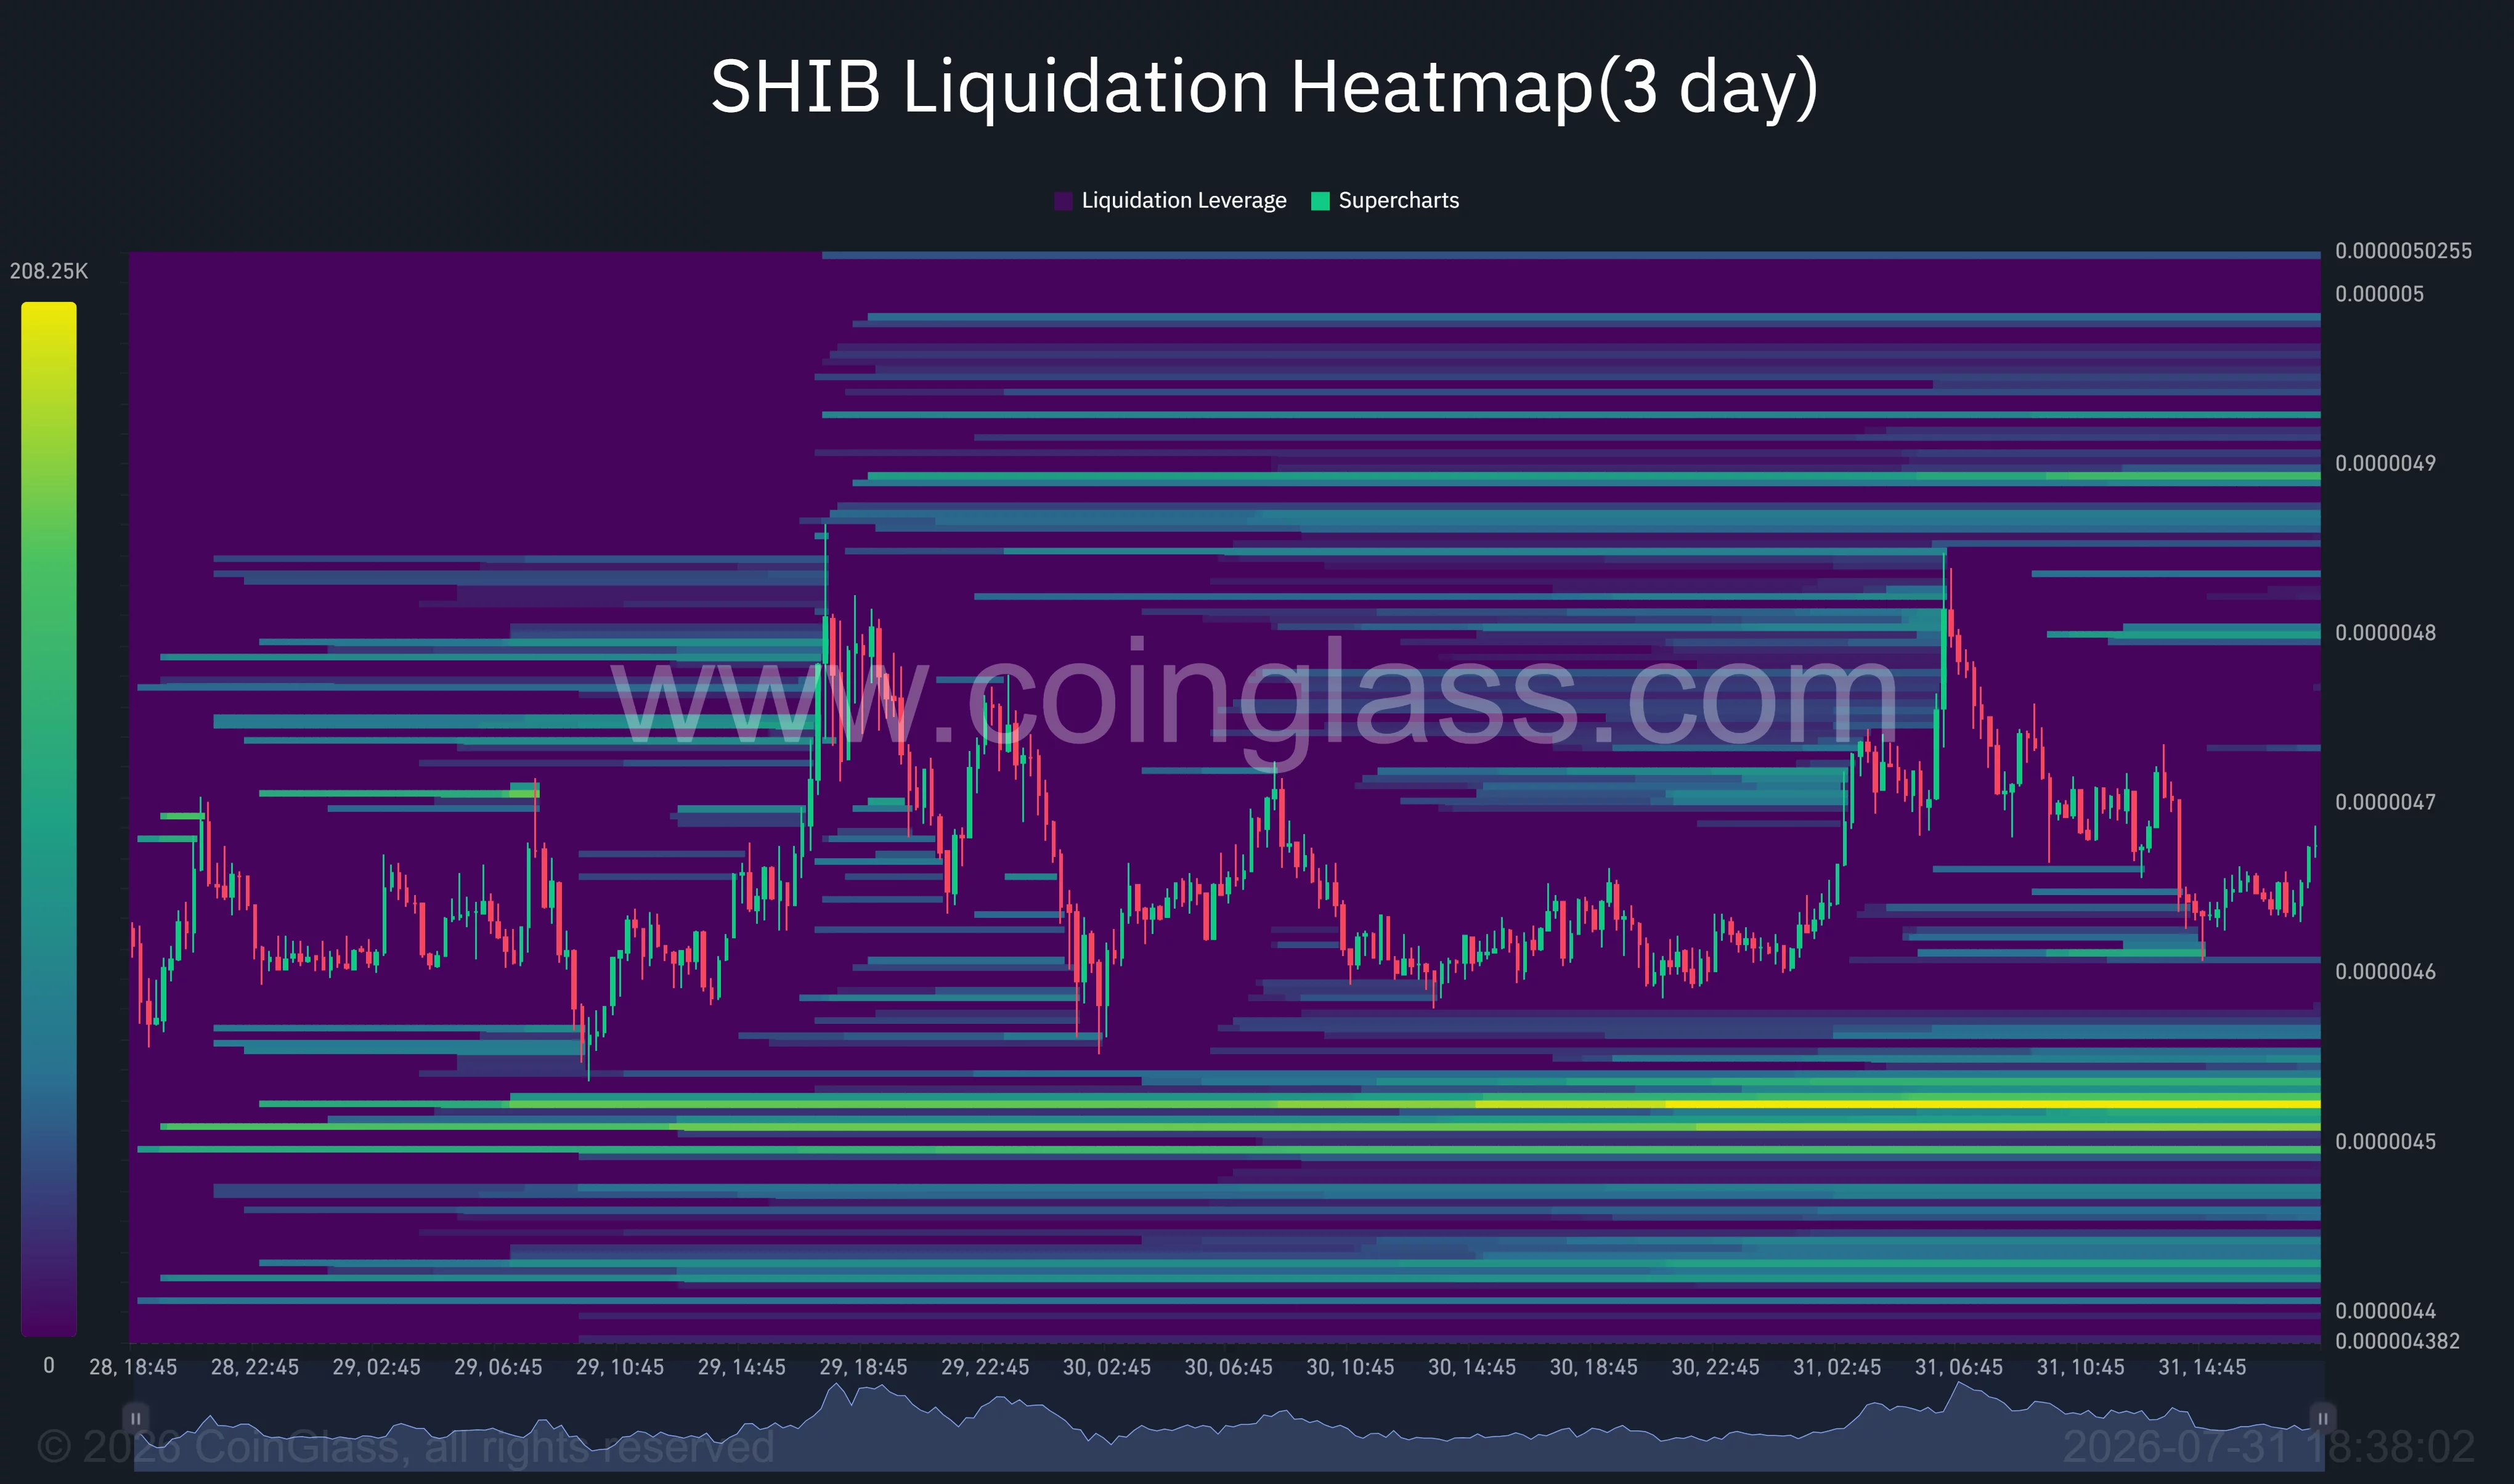
Below that area, additional liquidity appears around $0.0000044. A drop through both zones would erase most of the breakout and expose the July base near $0.0000041.
Upside liquidity is comparatively scattered. The first meaningful bands appear near $0.0000048 and $0.0000049, with another cluster around $0.0000050. Clearing these positions could produce a short squeeze, but SHIB must first overcome the moving-average congestion on its 4-hour chart.
The liquidation structure therefore favors continued volatility. A sweep toward $0.0000045 could occur before either side establishes control.
Daily indicators preserve SHIB’s recovery attempt
Despite the rejection, SHIB’s daily chart contains one constructive development that is price remains above the Supertrend support at approximately $0.00000444.
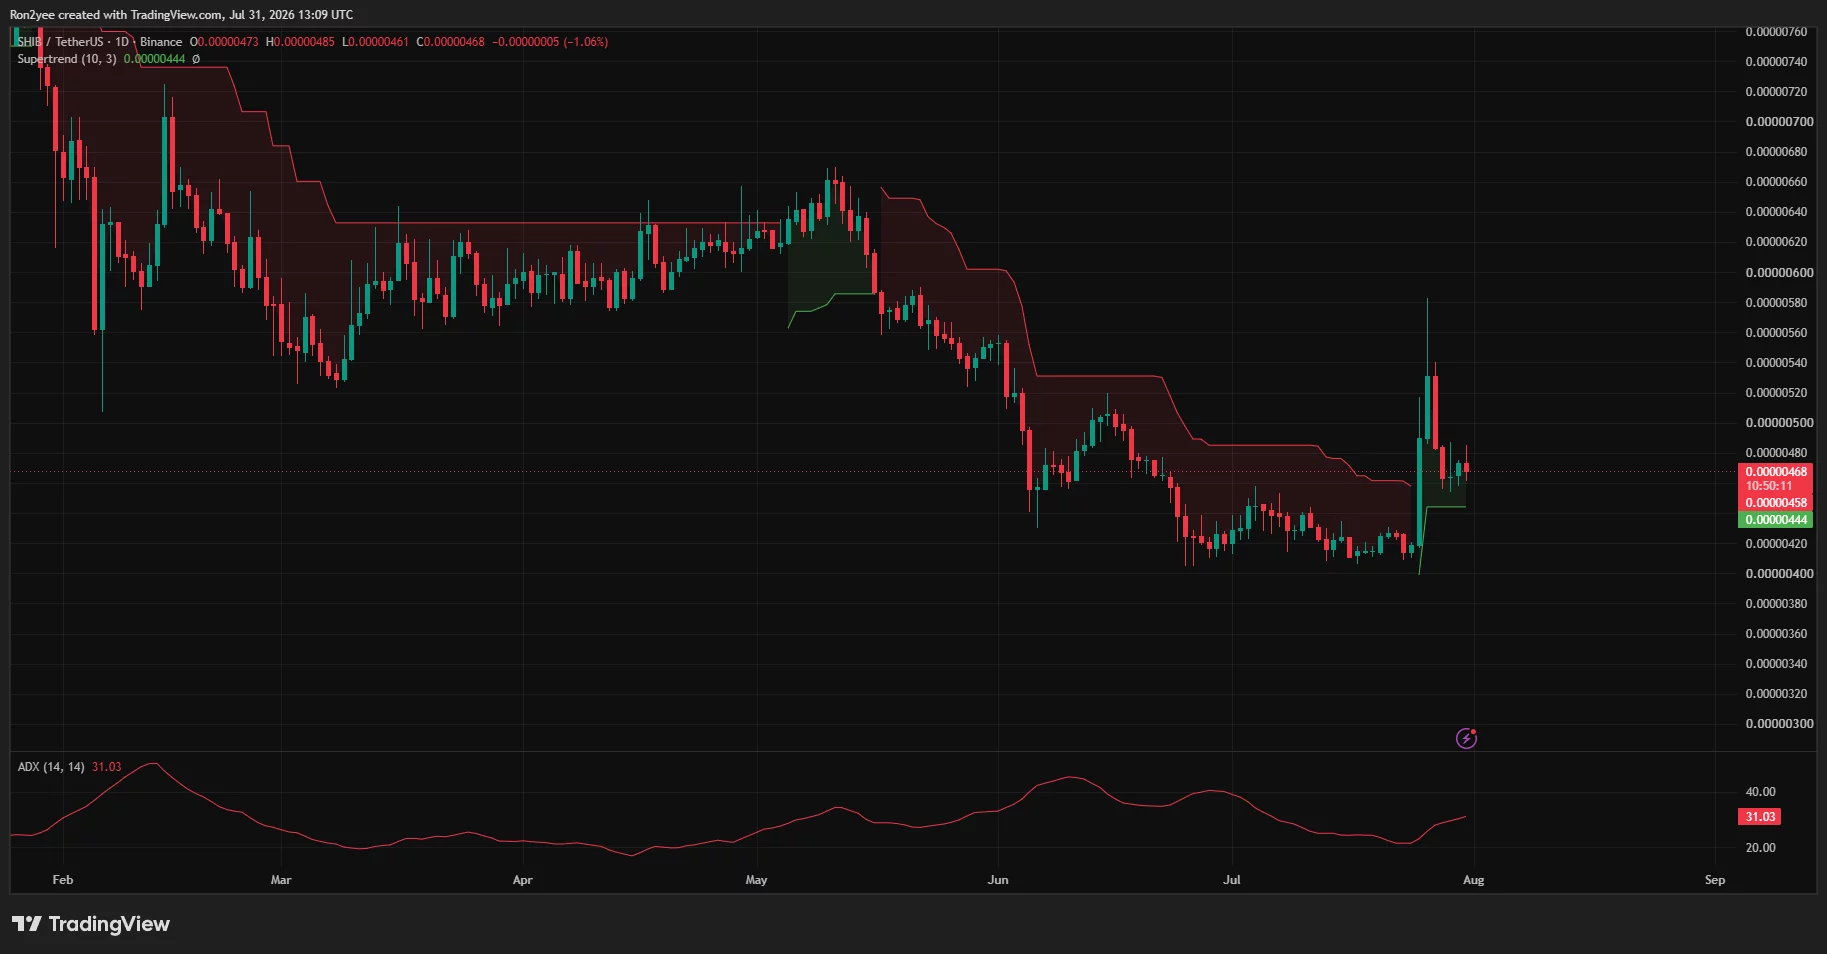
The indicator recently flipped from bearish to bullish following the breakout. Losing that level on a daily closing basis would reverse the improvement and increase the chance of a decline toward $0.0000042.
Average Directional Index, or ADX, has risen to 31.03 from below 20. An ADX reading above 25 generally points to a strengthening trend, although the indicator does not determine whether that trend will remain bullish or turn bearish.
For bulls, the next confirmation would require a move above $0.0000049, followed by a successful recovery of $0.0000052. Breaking the rally peak near $0.0000058 would reopen the path toward $0.0000060 and the May resistance zone around $0.0000064.
Commenting on SHIB’s broader structure, pseudonymous analyst SHIBMortal said:
“The floor seems to be holding (so far). We are not out of the woods yet.”
The analyst described the bounce as promising but said SHIB was still testing resistance through weekly price action and relative strength.
What the setup means for US traders
SHIB’s next move may also depend on wider risk appetite during US trading hours. Meme coins generally carry higher volatility than Bitcoin and large-cap altcoins, making them more sensitive to changes in interest-rate expectations and geopolitical risk.
The immediate setup remains neutral above $0.00000444 and turns more constructive if SHIB reclaims $0.0000049. A daily close below $0.00000444 would invalidate the short-term bullish structure and place the July lows back in focus.
Bulls have preserved part of the breakout, but the failed move above $0.0000054 shows that another rally will require stronger and more persistent demand.
Disclosure: This article does not represent investment advice. The content and materials featured on this page are for educational purposes only.


Circle has secured a New York trust charter to expand its state regulatory footprint.
Summary
- Circle has received a New York trust charter from the NYDFS for Circle New York Trust.
- The approval follows Circle’s recent federal trust bank authorization from the U.S. OCC under a separate regulatory framework.
- Circle said the charter strengthens oversight for its USDC business and extends its decade long relationship with the NYDFS.
According to an announcement from Circle on Friday, the stablecoin issuer has received a limited-purpose trust charter from the New York Department of Financial Services for Circle Internet Trust Company LLC, doing business as Circle New York Trust.
The approval gives Circle another regulatory authorization in New York, where the company says its global headquarters is located. Circle said the charter reinforces its compliance framework and builds on a relationship with the state regulator that began in 2015, when it became the first company to receive a BitLicense from the NYDFS.
The new authorization comes less than a month after Circle secured final approval from the U.S. Office of the Comptroller of the Currency to establish a federally supervised trust bank. While both approvals involve trust entities, they serve different regulatory roles within the U.S. financial system.
New York approval complements Circle’s federal trust bank
Earlier this month, the OCC approved the formation of First National Digital Currency Bank, N.A., which will operate as Circle National Trust under federal supervision for fiduciary digital asset custody. At the time, Circle said management of USDC reserves would remain outside the bank during its initial phase, with reserve activities expected to move later as the institution develops.
The New York charter follows a separate path. Circle had previously indicated that issuance of USDC would continue through a New York limited-purpose trust company rather than its federally chartered bank, making the latest approval an important part of its existing stablecoin structure.
In the official announcement, Circle co-founder, chairman and chief executive Jeremy Allaire said obtaining a New York trust charter had been a long-term objective because of the regulatory clarity associated with the state’s framework.
Allaire also described the NYDFS as an international standard setter for digital asset regulation and said the approval places USDC within what he called a strong and respected regulatory framework as digital dollars become more important in global finance.
Circle deepens decade-long relationship with NYDFS
Circle’s latest approval extends a regulatory relationship with the NYDFS that spans more than a decade.
The company noted that it became the first recipient of a BitLicense in 2015, making New York one of the earliest jurisdictions to supervise its digital asset business. The newly granted trust charter adds another license under the same regulator as Circle continues operating regulated stablecoin services.
Unlike the federal OCC approval, which established a national trust bank, the New York authorization is issued at the state level and governs Circle New York Trust under NYDFS oversight.
The two approvals together expand Circle’s regulatory footprint without replacing one another, as each operates under a different legal framework.
Circle continues expanding infrastructure around USDC
The trust charter arrives during a period of continued expansion across Circle’s payments and blockchain infrastructure.
As crypto.news previously reported, Circle announced on July 27 that it had acquired more than 680 IBM patent families covering nearly 1,000 issued patents worldwide. According to the company, the portfolio spans blockchain infrastructure, banking, payments, enterprise systems, insurance, supply-chain verification and secure cloud operations, with intended support for products including USDC, Circle Payments Network and Arc.
Circle did not disclose financial terms for the patent acquisition or identify which patents directly relate to stablecoin issuance or payment infrastructure.
Earlier in July, Circle also signed separate memorandums of understanding with South Korea’s Kakao Group and fintech operator Toss to explore blockchain payments, cross-border settlement and stablecoin infrastructure. According to the companies, the discussions include possible connections between future KRW-denominated digital assets, USDC and existing financial networks, although no commercial launch has been announced.
Circle has also said it does not plan to issue its own won-denominated stablecoin, instead positioning USDC as infrastructure that could connect local digital currencies with international payment networks.
The latest New York approval adds another regulatory milestone as Circle continues building its stablecoin and payments business across both U.S. regulatory frameworks and overseas partnerships.


Disclosure: This article does not represent investment advice. The content and materials featured on this page are for educational purposes only.
QuantPilot aims to simplify crypto market research by combining fragmented on-chain, market, and DeFi data into AI-assisted analysis workflows.
Summary
- QuantPilot brings AI research agents to crypto markets, combining live data, code execution, and automated analysis.
- Th platform uses AI agents and live data integrations to automate crypto market research and recurring analysis.
- QuantPilot expands AI-powered crypto research with live data connectors and scheduled analytics for traders.
Ask a crypto trader what they lack, and almost nobody says data. They have CoinGecko open in one tab, a Dune dashboard in another, DefiLlama for TVL, a Telegram channel for flow, Glassnode or CryptoQuant for on-chain, and a news feed they mostly skim. The raw material is abundant, and much of it is free.
Say someone wants to answer a fairly ordinary question: over the past two years, did stablecoin balances moving onto exchanges tend to precede rallies in mid-cap DeFi tokens, and did that relationship hold during the drawdowns? Every input needed to answer that exists publicly. Getting to an answer still means pulling exchange stablecoin flows from one API, TVL and token price history from another, aligning timestamps across sources that disagree on what a day is, deciding what counts as a mid-cap, running a correlation, and then checking whether the result survives outside the window you happened to pick.
QuantPilot, the platform 3Commas launched in April 2026 has built its crypto market research layer specifically around it. Whether the approach holds up is worth examining closely, because “AI for crypto research” is a phrase that has covered a lot of nonsense over the past two years.
Agents are not chatbots, and the difference is the whole point
A chatbot receives a question and produces text. Ask a general-purpose model about stablecoin flows, and it will write something fluent from training data that may be eighteen months stale, and it will do so with complete confidence. That is the failure mode that has made experienced traders rightly skeptical of AI research claims.
An agent works differently. It takes a goal, breaks it into steps, executes those steps against live tools, looks at what came back, and adjusts. QuantPilot’s research agents plan a task, create their own to-do lists, write and run code, work with files, and build charts. Applied to the stablecoin question above, that means the agent is not recalling anything. It is fetching current data, writing the analysis code, running it, and showing you the chart it produced.
The output is checkable. That matters more than any capability claim, because a research process you cannot audit is worthless in a market where being confidently wrong costs money.
The data layer is the part that determines quality
An agent with no data access is a chatbot with extra steps. What makes the research layer usable is what it can reach, and QuantPilot connects to its sources through MCP servers, an open standard for giving models structured access to external tools and data.
The current connectors cover CoinMarketCap for price and coin-level information, DefiLlama for DeFi metrics, CryptoQuant for on-chain Bitcoin and stablecoin data, CryptoNews API for current and historical news, and Tavily for agent-driven web search. The team has said more are being added.
The choice of MCP over bespoke integrations is a quiet but meaningful detail. It means adding a new data source is a connector, not a rebuild, which is the difference between a platform whose coverage grows and one that ships with a fixed list and stays there. If you have watched analytics tools in this space launch with impressive integrations and then stagnate, you will recognize why the architecture matters more than the launch-day feature list.
The practical effect is cross-source questions. Not “what is Bitcoin’s price”, which any tool answers, but questions that span data types. Did protocol revenue on a given chain track its token price, or diverge? Do news sentiment spikes lead or lag on-chain accumulation? Which DeFi protocols grew TVL while their token underperformed? These are the questions where an edge might actually live, precisely because they are annoying enough to compute that most people do not bother.
Scheduled research changes the shape of the work
One feature deserves more attention than it has received. QuantPilot supports scheduled automated research, so an agent can run a defined research task on a recurring basis and deliver findings without you being present.
Consider what that replaces. Most traders’ research is reactive. Something moves, they go look, they form a view, and by then the move is largely done. Scheduled research inverts that: a trader defines what they want monitored, and the analysis runs whether or not they are watching. The output arrives as a finding rather than a raw alert, which is the difference between “TVL on this protocol dropped 12%” and a note explaining that the drop tracks a single wallet’s exit rather than broad outflows.
Price alerts have existed forever and mostly train people to react to noise. A recurring analytical task is a different instrument. Whether traders actually use it well is another matter, since the discipline to define good monitoring questions is rarer than the tooling to answer them.
The line between research and a testable claim
Research that stops at “interesting” is entertainment. The reason QuantPilot’s research product sits alongside its strategy engine is that a finding can be handed to the backtesting side and turned into something with numbers attached.
That pipeline runs from an observation, to a hypothesis, to a strategy expressed in plain language, to a backtest with statistical metrics, to an optimization pass that checks whether the result holds across different market conditions, and finally to deployment. QuantPilot compiles strategies into QuantScript and deploys them to supported venues, with Hyperliquid as the first execution integration. Anyone tracking the growth of Hyperliquid and on-chain perpetuals generally will understand why that venue was chosen first.
It is worth separating this from the automated trading bots most traders already know. A DCA or grid bot is a template with parameters, and it executes a strategy someone else designed. The research pipeline is upstream of that. It is concerned with whether the trader’s particular idea has ever worked, not with running a standard pattern efficiently. Both have their place, and confusing them is how people end up running a grid bot into a trend and wondering why it bleeds.
The value of the pipeline is not automation. It is that it makes the honest step, testing the idea before risking money on it, the path of least resistance. Most retail losses come from skipping that step entirely.
Disclosure: This content is provided by a third party. Neither crypto.news nor the author of this article endorses any product mentioned on this page. Users should conduct their own research before taking any action related to the company.

US Treasury yields have been rising for months, and the market’s latest move has pushed 30-year rates to their highest level since 2007. While mainstream coverage has largely pinned the sell-off on inflation concerns tied to higher energy prices, analysis of inflation-protected bonds suggests the more important driver is the climb in real yields—an outcome that can be especially challenging for assets that don’t pay investors along the way, including Bitcoin.
The shift is also changing the trade-offs between traditional fixed-income strategies and crypto exposure. According to Glassnode’s latest research, government bond investments have become more profitable than certain cash-and-carry style trades in crypto markets for the first time since 2019.
Key takeaways
- 30-year Treasury yields have surged to the highest levels since 2007 amid a multi-month sell-off in government debt.
- Market pricing for a September rate hike is elevated, with CME FedWatch placing the probability at 63%.
- Treasury Inflation-Protected Securities point to falling five-year inflation expectations (around 2.2% and trending down since May), even as nominal yields rise.
- Data indicates the nominal yield increase is driven more by rising real yields than by higher inflation expectations—typically a headwind for non-yielding assets.
- Multiple potential transmission channels to crypto exist, but the direction is generally bearish if higher real rates reflect weaker growth or tighter liquidity.
Why Treasuries are selling off again
After US government debt yields hit local lows in early March, Treasuries have entered a prolonged period of selling. Following the most recent FOMC meeting, 30-year Treasury yields made headlines by reaching levels not seen since 2007. Within the same window, the two-year yield climbed by 76 basis points, and markets increasingly price another Fed move: a September rate hike is currently weighted at 63% according to CME FedWatch.
The higher the yield environment becomes, the more investors compare alternatives across asset classes. Glassnode’s research—published in its “The Week Onchain” series—notes that, for the first time since 2019, returns from government bond investments have become more attractive than cash-and-carry style trades involving crypto futures.
Inflation fears are loud, but TIPS tell a different story
Many observers have connected the bond sell-off to rising commodity and energy prices. The timing overlaps with the start of the Iran war and the resulting closure of the Strait of Hormuz, and the daily moves in oil and interest rates have tracked each other since March. In that framing, stronger crude prices feed directly into inflation expectations, pushing yields higher.
However, inflation-protected securities complicate that narrative. Treasury Inflation-Protected Securities (TIPS) are designed so their principal—and therefore their coupon payments—are adjusted to reflect the Consumer Price Index. Because TIPS exist alongside regular Treasuries of similar maturity, comparing their yields allows investors to estimate the market’s implied inflation path through the breakeven rate.
According to data referenced from FRED, the five-year breakeven inflation rate has dropped sharply since May and is currently around 2.2%. That figure suggests the market expects the Fed to achieve its 2% inflation target over the medium term. More importantly, the breakeven rate has been moving in the opposite direction to nominal Treasury yields: while nominal yields rise, the inflation component implied by TIPS declines.
In the dataset cited, a 33-basis-point increase in the five-year nominal yield is paired with an 84-basis-point rise in the real yield, partially offset by a 51-basis-point decline in expected inflation. In other words, the market’s “real yield” story is changing—and it is the real rate that appears to be doing the heavy lifting.
What higher real yields can mean for Bitcoin and other non-yielding assets
In general, when real returns on traditional investments rise—after adjusting for CPI—investors may prefer assets that offer carry rather than those that do not. Bitcoin is typically treated as a non-yielding asset in this framework, so the direction of travel in real rates can matter.
Still, the impact on crypto depends on why real yields are moving higher. The analysis outlines several mechanisms that can coexist, with different implications for liquidity and demand.
1) FX or reserve liquidation pressures: unclear for crypto
One possible explanation involves global currency and funding dynamics. Higher oil prices can worsen trade balances for energy importers in Asia because oil is priced and settled in US dollars. That can lead to pressure in offshore US-dollar funding markets and force central banks to intervene to defend exchange rates.
The discussion cites Cointelegraph coverage of yen defense and Bloomberg reporting on interventions involving the Philippine peso and Indian rupee. It also notes that these interventions can be funded by selling US Treasury reserves, which can increase upward pressure on yields. In this scenario, the bond sell-off may reflect external funding strain rather than a direct verdict on the dollar or inflation.
As a result, the direct implications for crypto are not automatic: if the driver is more about FX mechanics than about deteriorating growth expectations, crypto’s reaction could be muted or different from the classic “rates up, risk assets down” story.
2) Demand destruction and recession risk: bearish setup
Another pathway is growth damage. If an oil shock persists long enough, the argument goes, it stops being merely inflationary and begins to suppress economic output. Neuberger Berman’s fixed-income outlook—referenced in the analysis—suggests investors may be underpricing how sustained energy costs could hit output.
That matters because a recessionary environment typically tightens liquidity. In such conditions, both equities and Bitcoin can face pressure as credit conditions worsen and risk appetite declines. The analysis also points to the expectation of widening credit spreads as a sign that credit could deteriorate.
It further references Cointelegraph reporting on early signals of stress, connected to rising costs to insure AI-linked debt amid an Asian semiconductor pullback. While that example is specific, it underscores the broader theme: if credit markets begin to price higher risk, non-yielding and speculative assets often struggle.
3) Capital competition from AI issuance: another headwind
A third channel is that higher real rates may be tied to expected growth and capital demand—especially from the AI sector. The analysis argues that as corporate bond issuance, including from major AI-related players, becomes unusually large, government issuance competes more directly for investor capital.
Goldman Sachs Research is cited projecting roughly $755 billion of AI capex in 2026 and about $920 billion in 2027. UBS is also cited as raising its 2026 investment-grade issuance forecast to $1.8 trillion, with technology supply lifted to $360 billion based on hyperscaler guidance. In that environment, investors’ willingness to allocate incremental capital to crypto could be constrained, not necessarily because crypto is “bad,” but because the fundraising pipeline elsewhere is intense.
What to watch next
For crypto investors, the critical question is whether TIPS-implied breakevens stabilize while real yields remain elevated—or whether the market reinterprets the move as a growth scare. Watching the evolution of TIPS breakevens and real-yield dynamics, alongside credit conditions such as spreads, may provide the clearest signal on whether this bond sell-off turns into a sustained liquidity headwind or fades as a temporary funding/energy-driven episode.

Disclosure: This article does not represent investment advice. The content and materials featured on this page are for educational purposes only.
XRP ETF inflows surpass $1.5 billion as investors explore alternative digital asset strategies, including cloud mining and DeFi yield platforms.
Summary
- Rising XRP ETF inflows are boosting interest in EX DeFi as investors explore cloud mining and yield opportunities.
- As XRP ETF inflows top $1.5 billion, EX DeFi highlights cloud mining as an alternative way to earn on XRP holdings.
- Institutional demand lifts XRP ETF inflows past $1.5 billion, while EX DeFi promotes long-term crypto yield solutions.
The XRP-backed ETF has just surpassed a significant milestone in inflows, further boosting institutional investor confidence. Simultaneously, a growing number of investors are turning their attention to ex-DeFi, hoping to explore more long-term yield opportunities beyond simply waiting for XRP prices to rise.

The continued inflows into the XRP ETF further demonstrate the growing demand for XRP from institutional investors. While retail investors remain cautious due to market volatility and price uncertainty, institutional funds continue to allocate XRP through regulated financial products, keeping it one of the most watched mainstream digital assets in the market.
As the regulatory environment and funding conditions continue to improve, many investors are beginning to consider a practical question: are there more efficient and sustainable ways to participate in the long-term returns of XRP besides waiting for prices to rise?
The milestone of XRP ETF inflows surpassing $1.5 billion is significant.
As of the closing on July 29, the XRP spot ETF market has reached a significant milestone. According to data released by the analytics platform uToday, driven by continuous net inflows, XRP-related exchange-traded funds (ETFs) have seen cumulative inflows exceeding $1.5 billion.
Meanwhile, the overall market liquidity has continued to improve. Although secondary market trading activity has slowed somewhat, and retail investor sentiment remains relatively cautious, institutional investor allocation demand has remained stable, resulting in net inflows on most trading days.
A new option for XRP investors: The yield growth path of EX DeFi
In light of this trend, more and more XRP investors are turning their attention to EX DeFi, exploring more stable and sustainable yield models through cloud mining and yield aggregation mechanisms.
Compared to more volatile futures trading or ETF investment, EX DeFi offers a more intuitive and convenient way to participate in digital assets, helping users improve the efficiency of digital asset utilization while participating in the development of the XRP ecosystem. For users with a certain amount of capital, this model is expected to offer higher daily return potential.
About EX DeFi
EX DeFi is headquartered in the UK and operates within European regulatory frameworks such as MiCA and MiFID II, continuously improving its transparency, operational standards, and user protection mechanisms.
The platform employs a multi-layered security architecture, including:
- PwC’s annual financial and security compliance audit;
- Lloyd’s of London digital asset custody insurance;
- Cloudflare enterprise-grade network protection and McAfee® security system;
- Multi-layered encryption architecture, AI-powered intelligent risk control, and 2FA verification protection.
Currently, EX DeFi supports multiple mainstream digital assets such as XRP, BTC, ETH, USDT, USDC, DOGE, LTC, and SOL, providing users with a more flexible and convenient digital asset service experience.
Start earning daily yields easily in just three steps:
1. Register an account
Visit the EX DeFi official website and register using an email address to receive a $17 trial bonus.
2. Choose a Mining Package
Based on a person’s budget and needs, choose a cloud mining contract that suits their needs and start mining with one click.
3. Start Earning Profits
After the contract is activated, the system will automatically allocate computing power, and profits will be automatically settled 24 hours a day. Users can withdraw profits at any time or continue participating as needed, achieving long-term asset compounding.
Example DeFi Popular Contracts
BTC (Beginner Trial Contract): Investment of $100, Term: 2 days, Daily Yield: $4, Total Profit: $100 + $8
DOGE (Golden Shell Mini Dogecoin Pro): Investment of $500, Term: 6 days, Daily Yield: $6.5, Total Profit: $500 + $39
BTC (Canaan-Avalon-A1466): Investment of $1000, Term: 10 days, Daily Yield: $13.4, Total Profit: $1000 + $134
LTC (Bitmain Antminer L7): Investment of $5,000, Term: 20 days, Daily Yield: $73.5, Total Profit: $5,000 + $1,470
BTC (Bitmain S19K-Pro): Investment of $10,000, Term: 30 days, Daily Yield: $161, Total Profit: $10,000 USD + $4,830
For more details on the program, please visit the EX DeFi official website.
Summary
The continued inflow of funds into the XRP ETF, coupled with the improving regulatory environment, further reflects XRP’s gradual integration into the mainstream financial system. EX DeFi provides XRP investors with more diversified participation methods, shifting from “simply relying on price fluctuations” to “price growth and yield generation in parallel.”
As a new market cycle develops, investors are no longer just focused on price increases and decreases, but are paying more attention to stable and sustainable asset management strategies. This trend also reflects the maturing development of digital asset investment.
Still hesitating? Join EX DeFi now and earn daily passive income from digital assets.
Disclosure: This content is provided by a third party. Neither crypto.news nor the author of this article endorses any product mentioned on this page. Users should conduct their own research before taking any action related to the company.

A study from the Bank of Italy has challenged a common argument for crypto payments: that stablecoin-based remittances automatically deliver lower costs and faster settlement than traditional money transfer rails. After testing remittances funded and settled with USDC across multiple corridors, the researchers found that most of the expense and delay came from fiat conversion and payment-rail frictions—factors that blockchain networks alone do not control.
The findings are based on experiments moving 200 USDC across 10 bidirectional corridors connecting Italy with Brazil, Argentina, Japan, the United Arab Emirates, and South Africa. The study compared the end-to-end cost and settlement time to traditional remittance services, concluding that crypto network fees made up only a small portion of overall costs.
Key takeaways
- Fiat on- and off-ramp frictions dominated remittance costs: exchange fees and currency conversion accounted for most expenses, while blockchain transaction fees were comparatively minor.
- Speed depended on local payment rails: transfers settled in under 20 minutes where instant payment systems were available, but took one to two business days when they weren’t.
- Cost advantages were corridor-specific: total costs across stablecoin remittances ranged from 0.3% to nearly 9%, with savings versus some benchmarks not universal.
- Regulatory design influenced user behavior and efficiency: overly restrictive rules increased operational complexity, while prohibitionist approaches pushed users toward offshore and unregulated options.
Stablecoins don’t eliminate the biggest frictions
The Bank of Italy’s experiment was designed to isolate where the money-transfer pipeline spends time and money. Researchers reported that, across the stablecoin remittances tested, exchange fees and currency conversion were the primary cost drivers. By contrast, blockchain transaction fees were only a small share of total costs—meaning the core bottlenecks for cross-border transfers largely sit outside the chain.
In practical terms, the corridor matters because stablecoin remittances often still require converting value into local currency at the sending and receiving ends. Even when the transfer occurs on-chain, users may face fees and processing delays at the interfaces where fiat enters or leaves the system.
Costs and settlement times vary by corridor
According to the study, total costs for the stablecoin remittances ranged from 0.3% to nearly 9%, depending on the corridor. This wide spread underscores that stablecoin-based transfers are not a single “set it and forget it” alternative to traditional remittances; rather, they are shaped by the quality and pricing of the surrounding payment infrastructure.
Settlement times showed an even clearer relationship with local payment systems. The researchers found transfers were typically completed in less than 20 minutes when instant payment networks were available. Where those systems were not in place, settlement stretched to one to two business days.
To frame the results against a broader global benchmark, the study used the World Bank’s reported global average remittance cost of 6.65%. On that basis, stablecoin transfers were cheaper in most corridors examined. However, they were less expensive than Wise in only three of seven corridors where direct comparisons were possible—suggesting that established digital remittance providers can still outperform stablecoin routes in certain environments.
Why infrastructure investment matters more than token choice
The Bank of Italy argues that improving the competitiveness of stablecoin-based cross-border payments depends heavily on payment-rail upgrades—particularly domestic instant payment infrastructure. In other words, the study’s central implication is that stablecoin settlement can be fast only if the start and end points of the transfer process are equally efficient.
The authors also emphasized an important structural point: the potential benefits expand if stablecoins can be used in the real economy without repeated reconversion into local fiat. They wrote that:
If stablecoins could be spent directly in the real economy, for goods and services, rents, or school fees, without reconversion into local fiat currency, the economic advantages of stablecoin-based transfers would be substantially higher.
This framing highlights a key asymmetry in many cross-border use cases today. Even if blockchain rails reduce settlement friction, remittance economics can remain constrained when end users ultimately need local currency access and the process requires multiple conversions.
Regulation can either enable or complicate real-world use
The study also found that regulatory design plays a decisive role in shaping remittance efficiency. According to the authors, prohibitionist regimes have not fully eliminated stablecoin demand; instead, they can push users toward offshore platforms and other unregulated channels. Conversely, overly restrictive frameworks may increase operational complexity for retail users.
The analysis arrives as policy frameworks for crypto assets and stablecoins are taking shape in major jurisdictions. The European Union has implemented the Markets in Crypto-Assets (MiCA) framework, while the United States has enacted the GENIUS Act, which governs crypto assets and payment stablecoins, respectively.
In terms of broader market momentum, the stablecoin market has grown to about $307 billion, up roughly 16% over the past year, according to DefiLlama data on stablecoins.
That growth provides context for why regulators and payment operators are increasingly focused on remittance and tokenized payments. But the Bank of Italy’s results suggest that the route to efficiency is not purely about allowing stablecoin settlement—it’s also about aligning regulatory expectations with workable payment flows and infrastructure.
What readers should watch next
The study implies that the next meaningful improvements in stablecoin remittances will likely come from upgrades to instant payment rails and from reducing the need for repeated fiat conversion at either end of the transfer. Investors and builders should monitor how policy changes under MiCA in Europe and the GENIUS framework in the US translate into compliant on- and off-ramp experiences—because, according to the Bank of Italy, that’s where most of the cost and delay still lives.
Robinhood stock recovered more than 2% on Thursday after Bernstein maintained its $160 target, betting that tokenization and prediction markets can offset weaker crypto trading.
Summary
- Bernstein maintained an Outperform rating and $160 target, implying roughly 81% upside from Thursday’s close.
- Robinhood’s second-quarter net revenue rose 32% year over year to $1.31 billion.
- Event contracts generated $156 million, surpassing the company’s $100 million in crypto trading revenue.
- HOOD traded at $88.55, but remained below its 20-, 50- and 100-day moving averages.
Robinhood stock rebounds from $83.68
Robinhood Markets shares traded at $88.55 on Friday, up approximately 2.25% after moving between $83.68 and $89.48 during the session. Despite the rebound, HOOD remained about 26% below its July high near $120.
HOOD had closed Wednesday at $89.84 before coming under renewed selling pressure. Thursday’s recovery kept the stock above its 200-day simple moving average at approximately $86.52, a level that could determine whether the recent decline develops into a deeper correction.
Bernstein maintained its Outperform rating and $160 price target following Robinhood’s second-quarter results. From Thursday’s closing price, the target represents potential upside of about 81%.
Goldman Sachs also retained a Buy rating but reduced its 12-month target from $137 to $118. The revised target still implies more than 33% upside, though it reflects a more cautious outlook for near-term growth.
Robinhood reported second-quarter net revenue of $1.31 billion, up 32% from $989 million a year earlier. The result exceeded analysts’ consensus estimate of approximately $1.26 billion.
Prediction markets overtake crypto revenue
Bernstein’s bullish case rests partly on Robinhood’s expansion beyond conventional stock and cryptocurrency trading. The brokerage identified prediction markets, tokenized stocks and blockchain infrastructure as longer-term revenue drivers.
Robinhood’s Rothera exchange went live in June and has processed more than 3.5 billion contracts. Around 2.1 billion contracts changed hands during the second quarter, generating $17 million in revenue.
Total event-contract revenue reached $156 million during the quarter, exceeding the $100 million generated by crypto trading. Bernstein described Rothera as the third-largest U.S. exchange in its category.
The figures show that prediction markets are becoming a larger part of Robinhood’s business as weaker digital-asset activity weighs on transaction revenue. Bernstein cut its estimate for Robinhood’s 2026 crypto trading revenue by 49% to reflect lower market volumes.
Commenting on how Rothera could develop, Bernstein analysts said:
“Management expects a greater share of prediction market flow to migrate to Rothera over time, while continuing to distribute event contracts from third-party exchanges and retaining the longer-term optionality to offer Rothera as a B2B platform for other FCMs.”
That strategy would allow Robinhood to earn revenue from its own exchange while continuing to distribute contracts supplied by outside venues. A future business-to-business offering could also provide access to other futures commission merchants, though that remains a longer-term option rather than a confirmed source of revenue.
Tokenization becomes a second growth pillar
Bernstein also pointed to Robinhood Chain, Bitstamp, Robinhood Earn and tokenized stocks as evidence that the company is developing infrastructure beyond its retail brokerage.
Robinhood Chain has recorded more than $12 billion in decentralized exchange volume and processed over 150 million transactions since its launch. Robinhood Earn has attracted more than $200 million in deposits.
Stock Tokens are available through Robinhood Wallet in more than 120 countries, extending the company’s tokenization business outside the United States. The service gives eligible international users blockchain-based exposure to listed securities, while U.S. investors continue to access conventional shares through Robinhood’s regulated brokerage platform.
Robinhood has also opened its Agentic Trading platform to its full customer base. The system lets customers connect artificial intelligence agents through Robinhood’s Model Context Protocol server and assign specific investing tasks.
These products widen Robinhood’s addressable market, but they also introduce execution and regulatory risks. Tokenized securities can face different ownership, disclosure, and investor-protection rules across jurisdictions, while prediction markets remain under scrutiny from U.S. federal and state authorities.
HOOD must reclaim $96 to strengthen recovery
Robinhood’s daily chart remains technically weak despite Thursday’s rebound. HOOD is trading below its 20-day moving average at $103.79, its 50-day average at $96.67, and its 100-day average at $99.30.
The cluster between $96.67 and $103.79 creates a broad resistance area. A close above the 50-day average would be the first sign that buyers are regaining control, while a move above $103.79 could reopen a path toward the July range between $110 and $120.
Bear-bull power stood at minus 20.01, showing that sellers still hold the near-term advantage. Negative bars have also expanded during the latest retreat, suggesting that Thursday’s bounce has not yet reversed the broader loss of momentum.
On the downside, the 200-day moving average near $86.52 provides immediate support. HOOD briefly traded below that level before recovering, making the $83.68 intraday low the next level to watch if selling resumes.
A sustained break below $83.68 could expose the June consolidation area around $75 to $80. Conversely, holding above the 200-day average and reclaiming $96.67 would improve the technical outlook.
Bernstein’s $160 target depends on Robinhood converting newer products into durable revenue as crypto trading slows. For U.S. investors, the next test will be whether prediction markets and tokenization can continue expanding without tighter regulation limiting their contribution.
Disclosure: This article does not represent investment advice. The content and materials featured on this page are for educational purposes only.

2026 Rocket Classic Saturday tee times: Round 3

Questyle QCC Dongle Pro2 Brings Bluetooth 6.1 and Hi-Res Audio to iPhone, Mac, PCs and Consoles

The PS5 is going to be the last console and Sony know it – Reader’s Feature

Renter of Home in Anne Heche Crash Denies Settlement With Son

No Jackpot Winner as $257 Million Prize Rolls Over to $269 Million Monday Draw

Weekend Open Thread: Staud – Corporette.com

Crypto Trading LIVE: BTC Live Trading Bitcoin Analysis | 28 JULY #crypto #bitcoin #btc

Financial Mistake Most People Make Watch the Full : https://youtu.be/0Kn9TDPAHFc?si=7FP6D0OmsE1hi0uM

The Income Problem Nobody Wants to Talk About #finances #real
-
 Sports5 days ago
Commonwealth Games boxing: Jadumani Singh seals dominant 5-0 win over Pakistan’s Sumama Rehman to enter quarter-finals | Commonwealth Games News
-

 Business2 days ago
Why Trees Belong on the Risk Register
-

 Tech5 days ago
Intel is reversing course and bringing hyper-threading back to its server chips
-

 Fashion7 hours ago
Weekend Open Thread: Wit & Wisdom
-

 Politics3 hours ago
Meta enters AI-training agreement with far-right ‘propaganda rag’ Newsmax
-

 Crypto World6 days ago
Ripple bought a bank in pieces. The $4 billion audit
-

 Politics5 days ago
Luke Littler dismantles Gerwyn Price to retain title in Blackpool
-

 Politics4 days ago
The Part of the Electric Transition Nobody Wants to Discuss
-

 News Videos5 days ago
BITCOIN JUST ENTERED THIS CRITICAL ZONE…
-
 Entertainment3 days ago
‘Stargate’ Creator’s New Sci-Fi Series Returns for Season 3 Tomorrow
-

 Crypto World6 days ago
XRP Ledger adds $2.6B as RWA inflows rank second
-

 Business3 days ago
Major shareholder moves on Canyon
-

 Politics5 days ago
Spain sweeps the board at 2026 World Cup with individual awards
-

 News Videos2 days ago
Bitcoin Enters the 3rd Stage of the Bear Market
-

 Entertainment6 days ago
Sara Gilson Killed By Husband After Viral “Pedophile” TikTok Video
-

 Crypto World3 days ago
Kraken Enables Retail Access to Jersey Mike’s IPO via Tokenized Shares
-

 Tech7 days ago
Anthropic launches Claude Opus 5, a cheaper AI model for coding, agents and enterprise workflows
-

 Tech4 days ago
New macOS Sequoia & Sonoma security updates for older Macs
-

 News Videos3 days ago
Claude: Build Financial Dashboards in Minutes (2026)
-

 Politics1 day ago
Luke Littler’s dominance sparks GOAT debate
You must be logged in to post a comment Login