

Crypto World
Is the 4-Year Cycle Dead?

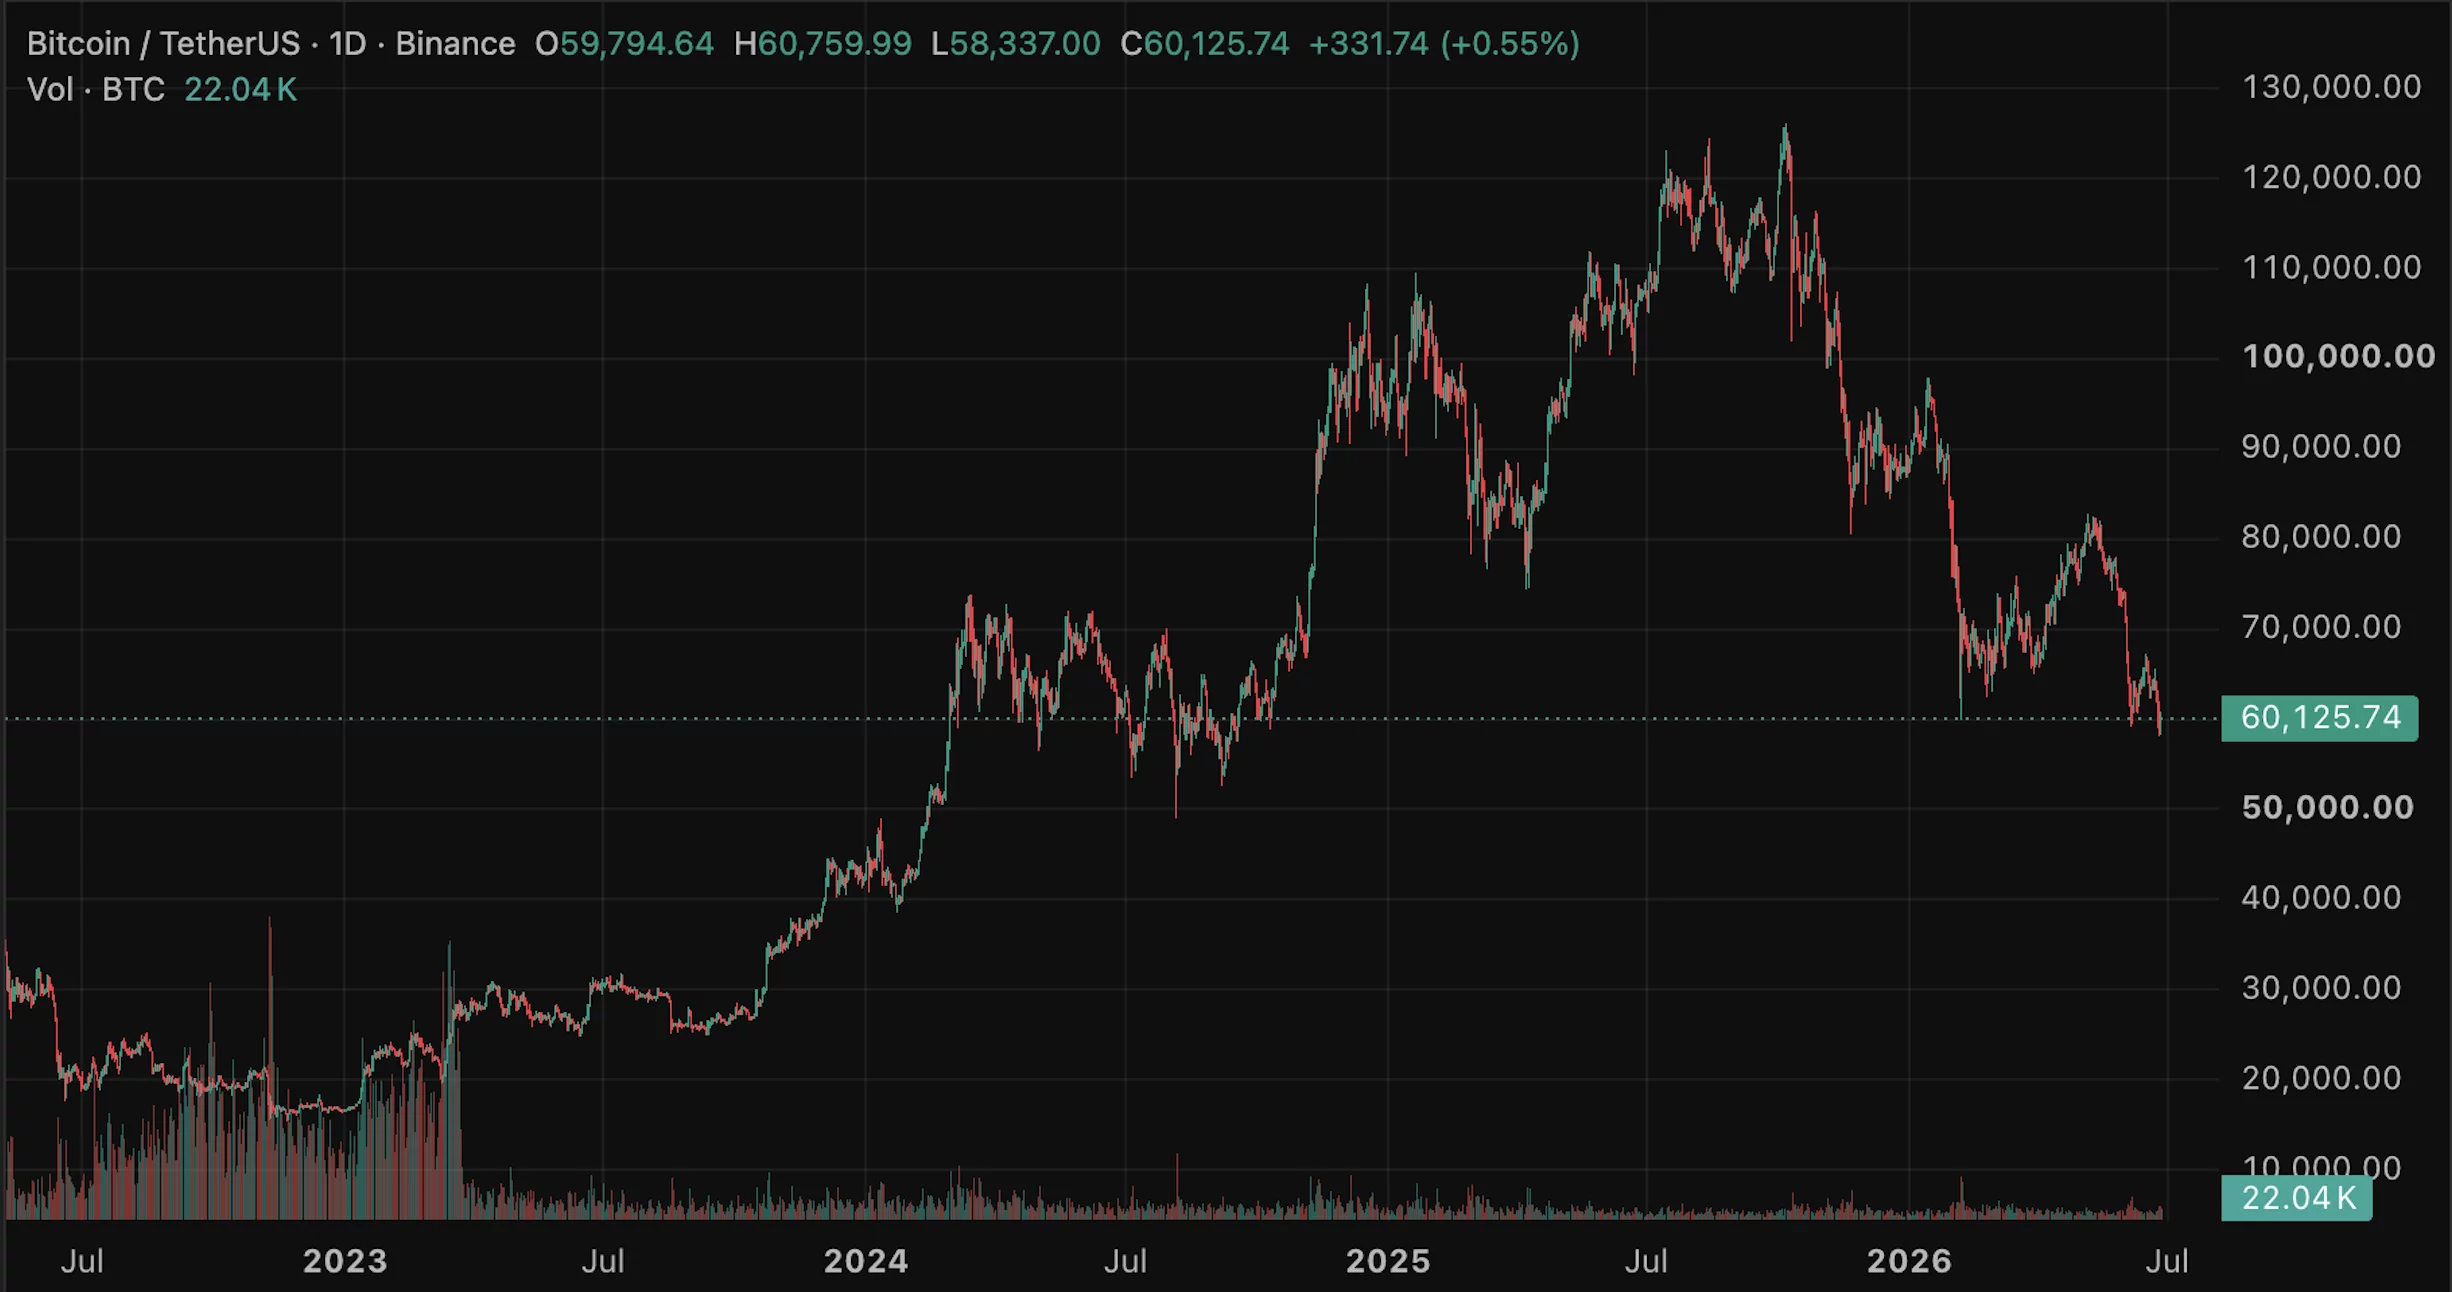
Bitcoin sits near $60,000, down more than half from its October peak, with traders in extreme fear and institutions pulling money out for six straight weeks. The single question that decides where it goes next is whether the famous four-year cycle still governs Bitcoin, or whether institutions have broken it for good.
Summary
- Bitcoin trades near $60,000, roughly 52% below its $126,000 October 2025 peak, sitting on its 200-week moving average with the Fear and Greed Index in extreme fear.
- The central debate is whether the four-year halving cycle is still in control, which would make this a textbook post-peak correction, or whether institutional demand has broken that cycle.
- The cycle-alive case fits the timing almost perfectly: Bitcoin peaked about 18 months after the 2024 halving and is now in the correction phase, the pattern predicts.
- The cycle-dead case argues that exchange-traded funds, corporate treasuries, and structural institutional demand have overridden the old retail-driven rhythm, pointing to a slow grind rather than a deep bear market.
- The crash is the test: a new low below the prior cycle bottom would vindicate the cycle, while holding here and grinding higher would suggest the pattern is broken. The outcome hinges on flows and the macro environment, not on any single price target.
Bitcoin is trading near $60,000, and depending on which framework you believe, that number is either the early stage of a painful but normal correction that ends with a familiar recovery, or the beginning of something the old playbook cannot explain.
The price is down roughly 52% from the all-time high near $126,000 set in October 2025. It is resting on a long-term technical line that traders watch closely. The sentiment gauge known as the Fear and Greed Index is buried in extreme fear, and institutions have pulled money out of Bitcoin exchange-traded funds for six consecutive weeks.
Every one of those facts can be read two ways, and the reading you choose depends almost entirely on a single question that now hangs over the entire market: is Bitcoin still governed by its famous four-year cycle, in which case this is the correction the cycle always brings, or have institutions broken that cycle, in which case the old rules no longer tell you what comes next.
This piece is built around that question, because it is the one that actually decides Bitcoin’s path through the rest of 2026, far more than any individual price level does.
The reason to frame a price prediction this way, rather than as a list of targets, is that the targets themselves flow from which thesis turns out to be right.
If the four-year cycle is alive, history points toward a deeper drawdown and a multi-quarter trough before the next halving-driven recovery. If the cycle is dead, the structural demand from funds and corporate treasuries could put a floor under the price well above where the old pattern would take it, turning a crash into a correction.
The honest work of a prediction, then, is not to pretend to know the number, but to lay out both frameworks clearly, weigh what the current evidence says about each, identify the levels and catalysts that would tip the balance, and translate all of it into concrete bull, bear, and base scenarios.
That is what follows: the cycle explained, the case for each side, what the crash is really signaling, the levels that matter, the scenarios, and the specific developments that would settle the debate.
Bitcoin at a crossroads
Start with where things actually stand, because the current picture is genuinely tense. Bitcoin fell hard through June, breaking down toward the $60,000 area in one of its worst stretches in months, with a single brutal session wiping out around $700 million in leveraged positions, the great majority of them bullish bets that were forced to close.
The drop brought Bitcoin to its 200-week moving average, a long-term trend line near $62,000 that has historically marked deep-cycle support, the kind of level that in past bear markets has roughly coincided with major bottoms.
Just below it, analysts flag the $59,000 area as the next test, and below that, the psychological $60,000 line gives way to genuine uncertainty about how far a breakdown could run.
The mood matches the chart. The Fear and Greed Index, which measures market sentiment on a scale from extreme fear to extreme greed, sits near the bottom of its range in extreme fear, a reading that reflects how thoroughly the recent decline has shaken confidence.
Institutional behavior tells a similarly cautious story, with spot Bitcoin exchange-traded funds posting six straight weeks of net outflows totaling close to $6 billion, described by analysts as the largest sustained institutional redemption wave since these funds launched.
Futures positioning has contracted sharply as traders cut leverage, a sign of de-risking rather than fresh conviction. And yet, woven through the gloom, are countervailing signals: a single day of positive fund flows late in the month, continued buying by corporate treasuries that view these levels as attractive, and the historical tendency of extreme fear to precede rebounds.
Bitcoin, in other words, is at a genuine crossroads, with the bearish evidence and the contrarian signals roughly balanced, and the cycle question is what tips the interpretation one way or the other.
The four-year cycle, explained
To weigh whether the cycle is alive or dead, you have to understand what the four-year cycle actually is, because it has been the dominant framework for understanding Bitcoin’s price for over a decade.
At the center of it sits the halving, a programmed event that occurs roughly every four years and cuts in half the rate at which new Bitcoin is created. Because Bitcoin’s supply growth slows abruptly at each halving while demand continues or grows, the halving has historically acted as a supply shock that, with a lag, drives the price upward.
The pattern that emerged across the first three cycles was remarkably consistent: in the 12-18 months following each halving, Bitcoin entered a powerful bull market and reached a new all-time high, after which it suffered a severe bear market, often falling seventy to 80% from the peak, before grinding through a recovery into the next halving and repeating the sequence.
This rhythm became almost a law in the minds of many investors. The halvings of 2012, 2016, and 2020 were each followed by a major price peak roughly a year to a year and a half later, and each peak was followed by a brutal drawdown and a multi-year trough.
The framework gave Bitcoin holders a kind of map: accumulate in the bear market, hold through the halving, ride the bull market to a new high, and brace for the crash that follows. The most recent halving occurred in April 2024, which places the present moment about 26 months into the current cycle, in what the framework would call the late-cycle or post-peak phase.
If the four-year cycle still governs Bitcoin, then the timing of the recent peak and the subsequent decline should look familiar, and the path ahead should rhyme with what happened after the previous three halvings. Whether it does is exactly what is now in dispute.
The case that the cycle is playing out exactly as it should
The argument that the four-year cycle is alive and well is, on the timing alone, strikingly persuasive. Bitcoin reached its all-time high near $126,000 in October 2025, which is roughly 18 months after the April 2024 halving, landing squarely inside the 12-18-month window in which the previous three cycles each topped out.
From the cycle’s perspective, that peak was the natural climax of the post-halving bull market, right on schedule. What has followed, a sharp decline that has now erased more than half the price, is precisely the kind of post-peak correction the pattern predicts, the opening phase of the bear market that historically arrives after each cycle high.
Seen this way, nothing about the current crash is surprising or anomalous; it is the cycle doing exactly what it has always done.
Respected voices in traditional finance hold this view. Some analysts have described 2026 as a likely correction year, the down phase of the cycle, pointing to support zones in the $60,000-$75,000 range as the kind of levels a cycle correction might test or breach.
Prominent cycle analysts have argued that the cycle bottom still lies ahead, with base cases placing a potential new low later in 2026, consistent with the historical pattern in which the trough comes well after the peak.
Under this framework, the extreme fear, the institutional outflows, and the technical breakdown are all expected features of the post-peak phase, not signs that something unprecedented is happening.
The cycle-alive case, therefore, implies real further downside: if Bitcoin follows the template of prior cycles, the current decline could deepen toward a trough materially below current levels before the next halving-driven recovery begins. It is a sobering view, but it has history and timing firmly on its side, which is what makes it so hard to dismiss.
The case that the cycle is dead
The opposing argument is that the four-year cycle was a feature of a Bitcoin market that no longer exists, and that the forces which created the cycle have been overwhelmed by something new.
The cycle, in this view, was largely a product of retail-driven speculation amplified by the halving narrative, a self-fulfilling rhythm that worked when Bitcoin was a small, speculative asset, moved mainly by individual traders and the four-year supply story.
What has changed is the arrival of institutions at scale. Spot exchange-traded funds have brought enormous, structural pools of capital into Bitcoin, corporate treasuries have adopted it as a reserve asset and accumulate it continuously, and large financial institutions now treat it as a portfolio allocation instead of a speculative flyer.
These holders do not buy and sell on the halving narrative; they respond to macro conditions, portfolio strategy, and long-term conviction, and their presence changes the market’s fundamental behavior.
Proponents of this view, including some prominent research shops, argue that Bitcoin has entered a slow bull phase more akin to a mature asset like gold than to its old boom-and-bust cycles, in which persistent institutional demand smooths out the violent four-year swings and replaces them with a steadier, longer grind higher.
In this framework, the halving still matters as a supply event, but it no longer dictates the price the way it once did, because the marginal buyer is now an institution instead of a retail speculator chasing the cycle.
The implication is that the deep, 70-80% bear markets of the past may not repeat, because structural demand provides a floor that did not exist before, turning what would once have been a cycle-ending crash into a more contained correction.
If this thesis is right, then the current decline, however painful, is a drawdown within an ongoing structural bull market instead of the start of a multi-year winter, and the $60,000 area could prove closer to a bottom than to a way station on the road down. The cycle-dead case, in short, says the old map no longer describes the territory.
What the crash is actually telling us
The natural question is whether the current crash settles the debate, and the honest answer is that it does not, because the evidence cuts both ways, which is itself revealing.
On the bearish side, the six straight weeks of exchange-traded fund outflows, totaling close to $6 billion, complicate the cycle-dead thesis, because they show that institutional demand, far from providing an unshakable floor, can reverse hard and become a source of selling pressure.
The slow-bull argument rests on institutions being steady, structural buyers, and a sustained redemption wave of this size shows that institutional money can flee risk just as retail money does, dragging the price down instead of cushioning it.
The extreme fear, the forced liquidations, and the breakdown to long-term support all fit comfortably within the cycle-alive interpretation of a post-peak correction gathering momentum.
On the other side, several signals support the cycle-dead reading. Even amid the outflows, corporate treasuries kept buying through the decline, with major holders adding to their positions at current levels and explicitly framing them as attractive entry points, behavior that reflects exactly the structural, conviction-driven demand the slow-bull thesis describes.
Late in the month, fund flows turned positive for a day, a tentative hint that the institutional selling may be exhausting itself. And the very depth of the extreme-fear reading, historically, has often preceded rebounds instead of further collapse, because it tends to mark the point of maximum pessimism where selling pressure runs out.
The takeaway is that the crash is genuinely ambiguous: it has features that fit both frameworks, and it has not yet produced the one piece of evidence that would be decisive, which is whether Bitcoin makes a new cycle low or holds here and recovers. Until that resolves, the data refuses to declare a winner, which is precisely why the cycle question remains open and why the next few months matter so much.
The levels that matter
While the big-picture debate plays out, the technical levels provide the concrete map traders are watching, and they are worth knowing because they will mark, in real time, which thesis is gaining the upper hand.
The most important support is the 200-week moving average near $62,000, the long-term trend line that has historically tracked deep-cycle bottoms; a decisive, sustained break below it would be a meaningful signal that the bearish, cycle-alive scenario is taking hold, because losing that level has in the past preceded extended declines.
Just beneath sit the $59,000 area and the round $60,000 psychological level, the latter being the line that prediction-market traders have heavily wagered Bitcoin will break to set a new yearly low, with a smaller but real probability assigned to a fall under $50,000.
On the upside, the levels that would suggest the decline is stabilizing run through the $64,000-$65,000 zone as immediate resistance, with the broader trading range capped near $66,000-$67,000. Reclaiming those levels with conviction would weaken the bearish case and lend support to the idea that structural demand is putting in a floor, while repeated rejection there would keep sellers in control.
The key point is that these levels are not just numbers but markers in the larger argument: holding the 200-week moving average and pushing back above resistance would be evidence for the cycle-dead, floor-is-holding thesis, whereas breaking down through support toward the fifties would be evidence for the cycle-alive, correction-deepening thesis.
The chart, in this sense, is where the abstract debate becomes concrete, and the next decisive move through one of these levels will tell observers a great deal about which framework is winning.
The bull, base, and bear cases for 2026
Translating all of this into scenarios means tying each outcome to the cycle question and to the levels and flows that would drive it. These are conditional ranges, not predictions, and each depends on which forces win out.
- Bull case: Bitcoin holds the 200-week moving average, the extreme fear marks a local bottom, institutional fund flows turn decisively positive, and a friendlier macro backdrop, such as signals of easier monetary policy, restores risk appetite. In this scenario, the cycle-dead, structural-demand thesis is vindicated, the $60,000 area proves to be a correction low, and Bitcoin recovers back toward and through its prior resistance, with more optimistic institutional targets pointing well into six figures over the following year as the slow bull resumes.
- Base case: the tension persists and Bitcoin chops within a wide range for an extended period, neither breaking down to a new cycle low nor mounting a clean recovery, as steady treasury buying offsets continued fund outflows and the market waits for macro clarity. In this scenario, the cycle question stays unresolved, Bitcoin grinds sideways to modestly lower around current levels, and direction depends on which flow trend wins out over the second half of the year.
- Bear case: Bitcoin loses the 200-week moving average decisively, the institutional outflows continue, and the four-year cycle reasserts itself in textbook fashion, driving a deeper correction toward the $50,000 area or below as the post-peak bear market plays out. In this scenario, the cycle-alive thesis wins, prediction-market bets on a sub-$50,000 print are realized, and Bitcoin works toward a cycle trough later in the year before any halving-driven recovery can begin.
What would settle the debate
For anyone trying to read Bitcoin’s direction over the coming months, the analysis points to a short list of developments that would actually settle the cycle question, and watching them is more useful than fixating on any single price. The first and most decisive is simply whether Bitcoin makes a new cycle low. If it breaks down through the 200-week moving average and the $60,000 area toward a materially lower trough, the four-year cycle will have shown that it still governs the market, and the bearish framework will have won.
If, instead, Bitcoin holds these levels and begins to recover, the case that structural demand has broken the cycle gains powerful support. That single binary, new low, or held floor, is the cleanest test available.
The second thing to watch is the institutional flow trend. The six-week outflow streak is the strongest evidence against the slow-bull thesis, so a durable reversal back to sustained net inflows would suggest the structural demand is reasserting itself, while a continuation or acceleration of outflows would reinforce the bearish, cycle-alive reading.
The behavior of corporate treasuries matters here too: continued accumulation through weakness supports the floor thesis, while any sign of treasuries slowing or reversing would be a serious warning.
The third factor is the macro environment, since Bitcoin now trades heavily as a risk asset, and a shift toward easier monetary policy or renewed risk appetite would support the bullish case, while tighter conditions and risk aversion would deepen the decline.
The honest conclusion is that Bitcoin’s path through 2026 is not yet written, because it depends on a genuine, unresolved question about whether the oldest pattern in crypto still holds. The cycle is either running late or it is dead, and the market is about to find out which, with the 200-week moving average, the flow data, and the macro backdrop serving as the scoreboard. Until those resolve, humility about any specific target is not weakness but accuracy.
Frequently Asked Questions
What is the four-year Bitcoin cycle?
It is the dominant framework for understanding Bitcoin’s price, built around the halving, a programmed event roughly every four years that cuts the rate of new Bitcoin creation in half. Historically, in the 12-18 months after each halving, Bitcoin entered a bull market and reached a new all-time high, then suffered a severe bear market, often falling 70-80%, before recovering into the next halving. The pattern held across the 2012, 2016, and 2020 halvings, giving investors a map of accumulation, bull run, peak, and crash that has shaped how the market thinks about Bitcoin for over a decade.
Where is Bitcoin in the cycle right now?
The most recent halving was in April 2024, which places the present moment about 26 months into the current cycle, in what the framework calls the late-cycle or post-peak phase. Bitcoin reached its all-time high near $126,000 in October 2025, roughly 18 months after the halving, squarely within the historical window for a cycle peak. The decline since then, now more than 50%, would be the post-peak correction the cycle predicts. If the cycle still governs, the trough would typically come well after the peak, potentially later in 2026.
Why do some analysts think the cycle is dead?
Because the market that created the cycle has changed. The four-year rhythm was largely driven by retail speculation amplified by the halving narrative, when Bitcoin was a small asset moved by individual traders. Now spot exchange-traded funds, corporate treasuries, and large institutions have brought structural capital that responds to macro conditions and portfolio strategy instead of the halving story. Proponents argue this has turned Bitcoin into a slow-bull asset more like gold, with steadier demand smoothing the violent four-year swings and providing a floor that could prevent the deep bear markets of the past from repeating.
What does the current crash tell us about the debate?
It does not resolve it, because the evidence cuts both ways. The six straight weeks of fund outflows show institutional demand can reverse and become selling pressure, undercutting the steady-floor thesis and fitting the cycle-alive correction view. But corporate treasuries kept buying through the decline, fund flows turned positive for a day, and extreme fear has historically preceded rebounds, all of which support the cycle-dead reading. The decisive evidence, whether Bitcoin makes a new cycle low or holds and recovers, has not yet arrived, which is why the debate remains open and the coming months are pivotal.
What price levels matter most?
The key support is the two-hundred-week moving average near $62,000, a long-term line historically tied to deep-cycle bottoms; a decisive break below it would signal the bearish scenario is taking hold. Beneath sit the $59,000 area and the $60,000 psychological level, with prediction markets heavily wagering on a break to new yearly lows and a smaller chance of a fall under $50,000. On the upside, 64,000-$65,000 is immediate resistance, with the range capped near $66,000-$67,000. Holding support and reclaiming resistance favors the bulls; breaking down favors the bears.
Could Bitcoin fall below $50,000?
It is possible, and prediction-market traders assign a real probability to it. In the bearish, cycle-alive scenario, Bitcoin loses its 200-week moving average, institutional outflows continue, and the post-peak bear market drives a deeper correction toward 50,000 or below as the cycle works toward a trough later in the year. This is not a certainty, and the bullish scenario, in which structural demand puts in a floor near current levels, is equally coherent. Which path unfolds depends on the cycle question, the flow data, and the macro environment, none of which has yet been settled, so a fall below $50,000 is a genuine risk instead of a forecast.
This article is information, not investment advice. The scenarios described are conditional ranges that depend on unresolved questions, not predictions, and Bitcoin is highly volatile. Prices, flows, and sentiment reflect reporting available as of June 26, 2026, and can change quickly. Nothing here is a recommendation to buy or sell. Verify current data from primary sources and consider your own circumstances before making any decision.


Canton Network, the privacy-enabled institutional blockchain built by Digital Asset, generated $60.2 million in fees over the trailing 30 days, placing it ahead of Tron and far above Ethereum by that measure, according to DefiLlama data. The DefiLlama fee-tracking dashboard logs Canton's 30-day… Read the full story at The Defiant


The Securities and Exchange Commission and Commodity Futures Trading Commission have launched a joint review of crypto derivatives regulations, opening a 60-day public comment period following the approval of U.S. crypto perpetual futures.
Summary
- SEC and CFTC have opened a 60-day public consultation on harmonizing crypto derivatives and portfolio margining rules.
- The review follows the approval of U.S. crypto perpetual futures and covers risk management and regulatory coordination.
- The consultation comes as the CFTC faces legal disputes over crypto perpetual futures and prediction market oversight.
According to a joint press release, the SEC and CFTC have requested public comment on possible ways to better align portfolio margining requirements across securities, security-based swaps, futures, swaps, and related positions.
The agencies said comments will remain open for 60 days after the proposal is published in the Federal Register.
Regulators seek feedback on derivatives oversight
As outlined by the two regulators, the review will help determine whether closer coordination on portfolio margining could improve risk management, reduce market fragmentation, and strengthen consumer protections. The request comes as crypto derivatives and tokenized financial products continue to expand in the United States.
The consultation follows the recent launch of regulated crypto perpetual futures. Kalshi received CFTC approval to list perpetual futures tied to Bitcoin, Ether, XRP, and HYPE, while platforms such as Hyperliquid have also expanded access to perpetual products linked to tokenized securities.
SEC Chair Paul Atkins said better coordination between the agencies can prevent overlapping regulatory responsibilities from slowing innovation or reducing market efficiency.
“Cross-margining offers a clear opportunity to unlock liquidity that remains frozen in separate accounts, and we encourage market participants to provide feedback on ideas that will help improve coordination between both agencies.”
CFTC Chair Michael Selig also supported the initiative, saying closer cooperation on portfolio margining “promises to unleash untapped capital while ensuring a more robust risk management framework and market protections.”
Earlier this week, the agencies separately asked the public to comment on how U.S. rules define swaps, security-based swaps, and related derivatives under Title VII of the Dodd-Frank Act.
According to the SEC and CFTC, market structure and trading practices have changed since those rules were first adopted, prompting questions about whether existing definitions still match today’s derivatives markets.
The earlier consultation also seeks feedback on swap exclusions, mixed swaps, jurisdictional issues, alternative compliance, and new financial products. According to the agencies, the responses will help build a common regulatory record that could guide future staff interpretations and court proceedings.
Court disputes continue over crypto derivatives
The latest consultation arrives as the CFTC faces multiple legal disputes tied to crypto derivatives and prediction markets.
Earlier this week, the CFTC sued Kentucky in federal court after the state sought to enforce its gaming laws against prediction market operators, including Kalshi and Polymarket. The regulator argued that the Commodity Exchange Act gives it exclusive authority over federally regulated futures, options, and swaps, while Kentucky maintains that sports-linked event contracts should remain subject to state gambling laws.
At the same time, CME Group continues its legal challenge against the CFTC over the approval of crypto perpetual futures.
As previously reported by crypto.news, CME argues that Kalshi’s perpetual crypto contracts should be regulated as swaps rather than traditional futures and alleges that the regulator approved the products without following the framework established under Dodd-Frank.
The classification question has become increasingly important because swaps and futures follow different rules for clearing, reporting, execution, and regulatory oversight.
The SEC and CFTC’s parallel consultations on derivatives definitions and portfolio margining may help shape how future crypto products are supervised as new trading models continue to enter regulated U.S. markets.
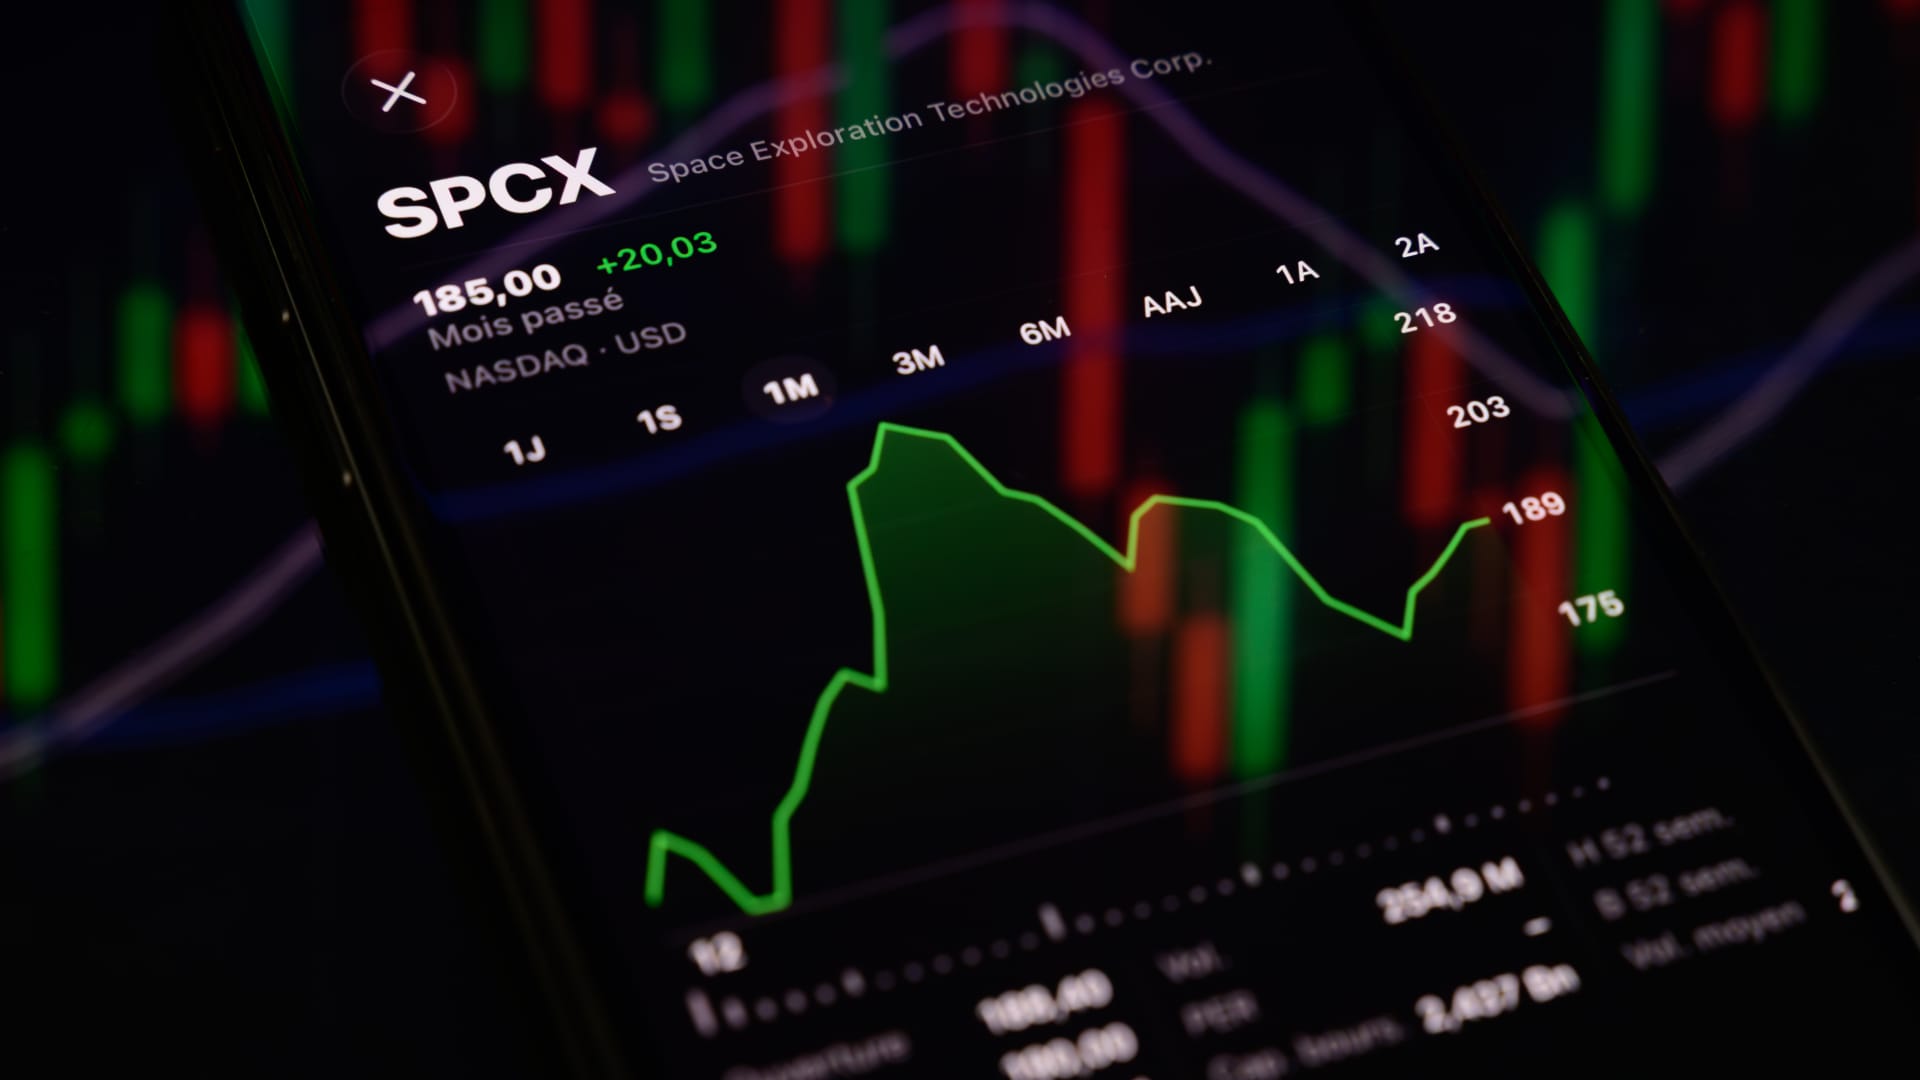
The stock of SpaceX continues its consolidation phase on the New York Stock Exchange one week after its Nasdaq listing.
Samuel Boivin | Nurphoto | Getty Images
SpaceX became one of the quickest additions ever to the Nasdaq-100 index, setting up a fresh wave of buying from passive investors less than a month after the company’s blockbuster public debut.
Nasdaq announced after the close Friday whether SpaceX qualifies for inclusion in the benchmark technology index. Assuming the company meets the requirements, index-tracking funds and other product sponsors would begin purchasing shares after the market closes on July 6, with SpaceX officially joining the Nasdaq-100 before trading begins on July 7.
More than $800 billion tracks the index, including the Invesco QQQ Trust (QQQ), which is one of the most popular securities traded each day and is seen as a barometer for the artificial intelligence bull market.
The aerospace and satellite company is expected to enter the index with a weighting of less than 1%.
Adding SpaceX this quickly would make the Elon Musk company one of the first beneficiaries of Nasdaq’s recently adopted fast-track inclusion framework for newly public companies. The changes allow some large IPOs to become eligible for the Nasdaq-100 after just 15 trading days, dramatically shortening what had historically been a far longer waiting period.
Under the previous framework, investors tracking the Nasdaq-100 could be forced to wait months before gaining exposure to newly listed market giants.
The inclusion could create another source of demand for SpaceX, which has been one of the most actively traded stocks since its June 12 debut. Index funds and exchange-traded funds tied to the Nasdaq-100 would need to buy shares to match the benchmark’s new composition, while active managers who track the index closely might also adjust positions.
Because SpaceX’s publicly tradable float remains small compared with its total market capitalization, even a modest index weighting could require meaningful purchases from passive investment vehicles.
Earlier this month, S&P Dow Jones Indices declined to create a similar fast-track process for the S&P 500. Therefore, SpaceX remains ineligible for inclusion in the S&P 500 because of that index’s separate profitability and seasoning requirements.
— CNBC’s Leslie Picker contributed reporting.
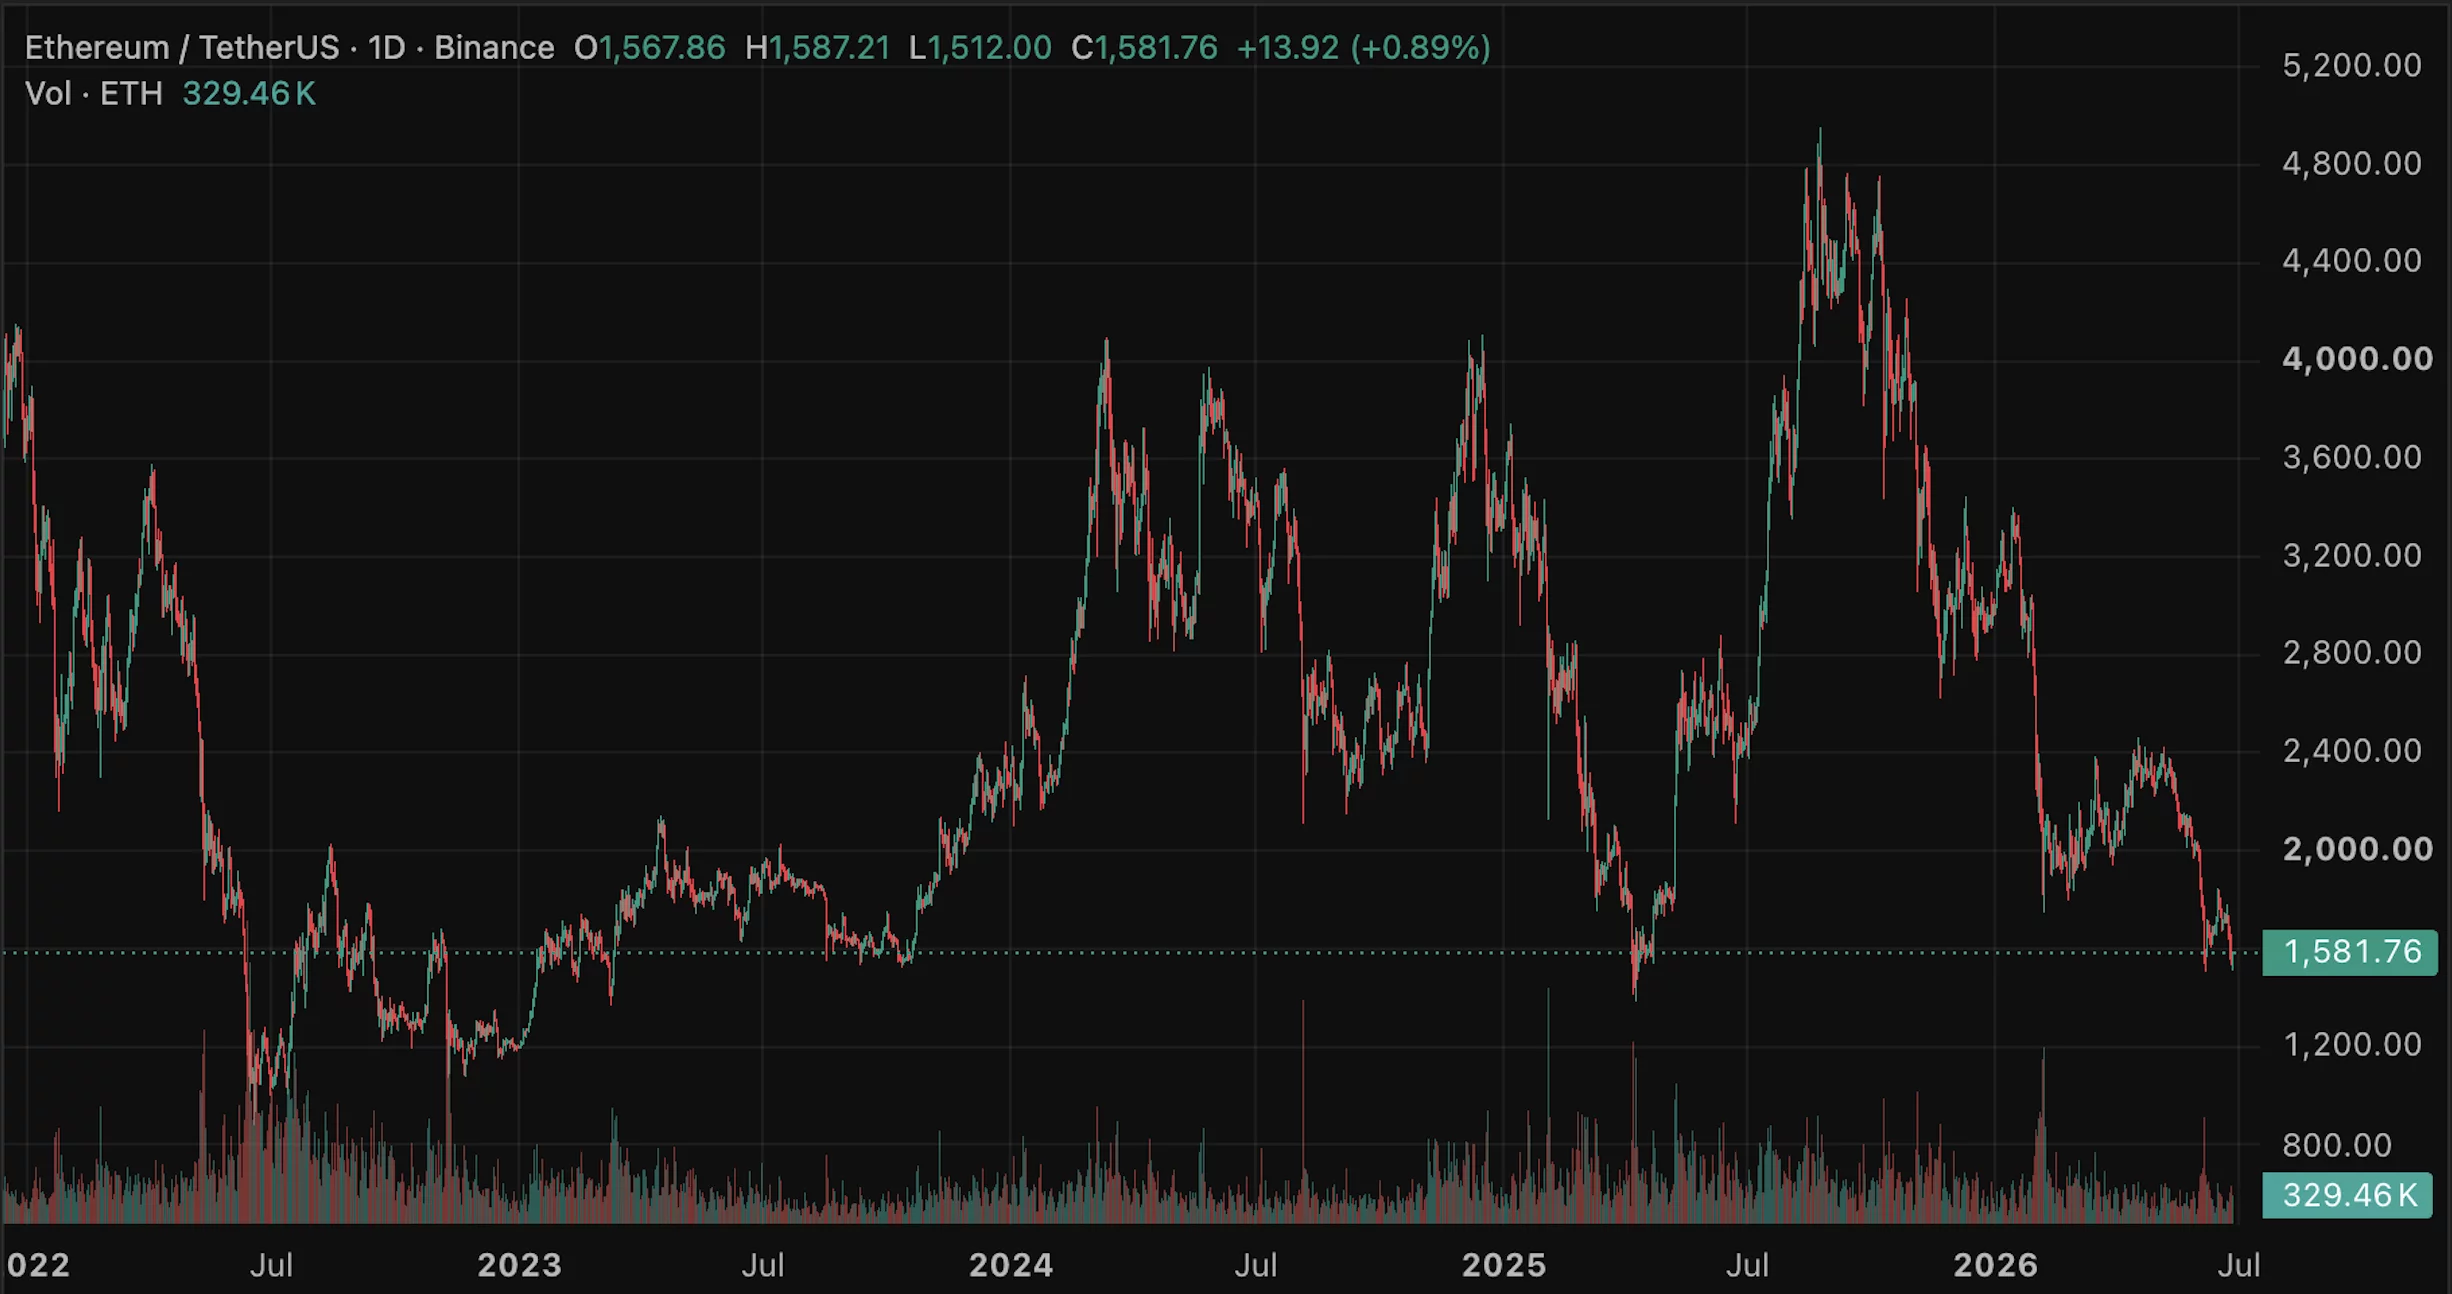
Ethereum trades around its 200-day moving average near $1,668, the line that has separated its bull markets from its bear markets for years. Above it lies a path back toward $3,000. Below it lies an accumulation zone, the charts put as low as $600. The strangest part is that Ethereum’s fundamentals have never been stronger.
Summary
- Ethereum trades around $1,650, hovering at its 200-day moving average near $1,668, a level that has historically divided its bull markets from its bear markets.
- The price is roughly 55-65% below its $4,953 August 2025 all-time high, in a year-long downtrend, even as Ethereum’s fundamentals reach record highs.
- About 35.8 million ETH, near 30% of supply, is staked, spot ETFs have drawn around $11.6 billion in cumulative inflows, and corporate treasuries hold over 6.2 million ETH, yet none of it has lifted the price.
- The $1,668 line is the pivot: holding above it keeps a recovery toward $2,300 to $3,000 alive, while losing the $1,580 to $1,600 floor opens a path toward a deep $1,039 to $603 accumulation zone.
- The catalyst that could flip the line is the Glamsterdam upgrade and a reversal in ETF and treasury flows, but until the macro tide turns, the strongest fundamentals in Ethereum’s history have not been enough.
Ethereum is trading around $1,650, which places it almost exactly on the one line that, more than any other, has historically decided whether it is in a bull market or a bear market: its 200-day moving average, currently near $1,668.
For years, this long-term trend line has acted as the dividing line for Ethereum, with sustained periods above it coinciding with recoveries and rallies, and breaks below it preceding extended downtrends.
Right now, Ethereum sits on the knife’s edge of that line, and the direction it breaks will go a long way toward determining its path through the rest of 2026. What makes the moment genuinely strange, and what separates this prediction from a simple chart reading, is the backdrop against which the line is being tested.
Ethereum’s price is down roughly 55-65% from its all-time high near $4,950 set in August 2025, and it has spent the better part of a year grinding lower, yet by almost every fundamental measure, the network has never been in better shape.
More ether is staked than ever, more institutional money has flowed into Ethereum products than ever, and corporate treasuries are accumulating it at a scale that did not exist a year ago. The result is one of the sharpest contrasts in the market: the strongest fundamentals in Ethereum’s history paired with some of its weakest price action since 2022.
This piece is organized around that contrast and around the line that sits at its center. The reason to build an Ethereum prediction this way, rather than as a list of targets, is that Ethereum’s situation is fundamentally a question about whether fundamentals will eventually matter, and the 200-day moving average is where that question gets answered in real time.
If Ethereum holds the line and reclaims the levels above it, the case that its record fundamentals will reassert themselves gains force, and a path back toward $3,000 opens. If it loses the floor beneath the line, the chart points toward a deep accumulation zone far below, and the fundamentals will have failed, for now, to matter.
What follows traces how Ethereum reached this point, why the $1,668 line carries so much weight, the genuinely record-setting fundamentals on one side of the ledger, the bearish forces that have overwhelmed them on the other, the catalysts that could tip the balance, and concrete bull, base, and bear scenarios tied to the line itself.
One line, two futures
Begin with why a single moving average deserves to anchor an entire prediction, because for Ethereum, the 200-day moving average has earned its significance. A moving average is simply the average price over a trailing period, in this case 200 days, and it smooths out short-term noise to reveal the underlying trend.
For Ethereum, the 200-day line has historically functioned as the boundary between bull and bear regimes: when the price trades and holds above it, Ethereum has tended to be in recovery or rally mode, and when it breaks decisively below it, extended downtrends have usually followed. That history is why traders treat this level with such respect, and why Ethereum, sitting right on it, near $1,668, is such a charged situation. The price is balanced precisely at the line that separates its two possible futures.
The levels around the line sharpen the stakes. Immediately below the current price, the $1,600-$1,650 area has held as the floor for 2026, the zone buyers have repeatedly defended, and a brief dip toward $1,580 during the June selloff was bought back. Above, the first resistance sits in the $1,700-$1,800 range, with a more significant barrier near $2,000 and the major structural hurdle at $3,000, where Ethereum would reclaim its long-term trend.
The asymmetry that worries bears is what lies beneath the floor. Technical analysts who map the downside warn that a decisive break below the $1,580 area and the broader monthly support could open a much deeper decline toward an accumulation zone they place between roughly $1,600, a drop of another 30-60% from current levels.

So the line is not merely a number; it is the hinge between a recovery path toward $3,000 and an abyss toward $600, which is what makes holding or losing it the central question for Ethereum in 2026.
How ETH got here
To understand why Ethereum is testing this line at all, you have to trace the decline from its peak, because the fall has been long and grinding rather than a single crash. Ethereum reached its all-time high near $4,950 in August 2025, lifted by enthusiasm around its newly launched exchange-traded funds and growing staking participation.
From that peak, the descent was relentless, with Ethereum closing out a long streak of red months, its worst such run in years, and sliding through the second half of 2025 and into 2026.
By early 2026, it had fallen below $3,000, and the weakness continued through the spring, with the price working steadily lower in a descending channel of lower highs and lower lows that defined the year.
The June selloff that brought Ethereum to its current levels near $1,600 was the latest leg of this extended downtrend, not a sudden break from an otherwise healthy trend.
The causes were a convergence of pressures rather than any single shock. Broader risk-off sentiment across crypto, driven by macroeconomic uncertainty and concerns about the path of interest rates, weighed on Ethereum as a high-risk asset. Persistent outflows from spot Ethereum exchange-traded funds removed a key source of demand and, during the worst stretches, became active selling pressure.
Selling attributed to Ethereum’s own co-founder added to the bearish narrative. And Ethereum’s tendency to amplify Bitcoin’s moves meant that as Bitcoin slid toward $60,000, Ethereum fell harder, because it typically rises faster in bull conditions and declines more sharply in risk-off periods.
The cumulative effect was a year-long erosion that has left Ethereum testing the line that separates recovery from a deeper bear market, with the price having given back the majority of its gains from the prior cycle. That is the chart context. The fundamental context, remarkably, points the other way.
Why $1,668 matters so much
It is worth dwelling on the significance of the line itself, because the entire technical case for Ethereum hinges on it, and the reasoning is not arbitrary. The 200-day moving average works as a regime indicator precisely because it filters out short-term volatility and captures the medium-to-long-term trend, which is why both technical traders and the algorithms that drive a large share of market activity pay close attention to it.
For Ethereum specifically, the historical record shows that this line has repeatedly marked the transition between bull and bear phases, so a sustained position above it tends to attract trend-following buyers and signal strength, while a decisive break below it tends to trigger trend-following selling and signal weakness. The line becomes partly self-fulfilling because so many participants treat it as meaningful that their collective behavior reinforces its importance.
Right now, the line is doing something subtle and worrying beneath the surface: even as the price hovers around it, the 200-day average itself has begun to slope downward, which technicians read as a sign of underlying long-term weakness instead of strength. A price clinging to a falling long-term average is in a more precarious position than one riding a rising average, because the trend line that is supposed to provide support is itself drifting lower.
This is why the current test is so consequential. If Ethereum can hold above the line, stabilize, and push back through the resistance levels above it, the long-term average can flatten and turn up, flipping the regime back toward recovery. If it loses the line and the floor beneath it, the falling average becomes overhead resistance, and the path of least resistance points toward the deep accumulation zone the bears identify.
The $1,668 line, in other words, is not just where the price happens to be; it is the level at which Ethereum’s medium-term fate is being decided.
The strongest fundamentals in Ethereum’s history
Here is the contrast that makes Ethereum’s situation so unusual, and it deserves to be laid out fully, because on fundamentals, the network is arguably in the best shape it has ever been.
Start with staking, the mechanism by which holders lock up ether to help secure the network and earn a yield. As of early 2026, roughly 35.8 million ether, close to 30% of the entire circulating supply, is staked, secured by around one point one million validators, with a staking yield in the range of 2.8-3.5% annually.
That staked proportion has nearly tripled since early 2023, when about 11% of supply was staked, reflecting steadily growing confidence and the popularity of liquid staking and restaking. A large and rising share of supply locked in staking reduces the ether available to sell on the open market, a structurally supportive dynamic.
The institutional picture is equally striking. Spot Ethereum exchange-traded funds have attracted roughly 11.6 billion dollars in cumulative net inflows since launching, with the largest single product holding well over $6 billion in assets, giving traditional investors regulated access to ether and, through the staking yield increasingly available, a competitive income component.
Beyond the funds, corporate treasuries have embraced ether as a reserve asset at a scale that did not exist a year earlier, collectively holding over 6.2 million ether, up from under 1 million in mid-2025, led by a treasury company that alone holds several million ether, a meaningful slice of the total supply.
Layered on top is an accelerating upgrade cadence, with major protocol improvements deployed in 2025 and a twice-yearly schedule of further upgrades designed to scale the network.
By every one of these measures, more staked, more institutional capital, more corporate adoption, more frequent upgrades, Ethereum’s fundamentals are at or near record strength. And none of it has stopped the price from falling, which is the puzzle the rest of the prediction has to confront.
The bear case: why the fundamentals have not mattered
The hard truth for Ethereum bulls is that strong fundamentals have, so far, been no match for the forces pushing the price down, and understanding why is essential to any honest prediction.
The first and most powerful force is the macro environment and Ethereum’s nature as a high-beta risk asset. Ethereum tends to amplify the broader market’s moves, so in a period of risk aversion, tightening financial conditions, and a sliding Bitcoin, Ethereum falls harder regardless of how strong its network fundamentals are, because the selling is driven by macro flows that do not care about staking ratios or upgrade schedules. When capital is fleeing risk, the quality of Ethereum’s fundamentals offers little protection.
The second force is the reversal of the very institutional demand that forms part of the bull case. The exchange-traded funds that brought billions into Ethereum have, during the downturn, seen persistent outflows, turning a source of demand into a source of selling and showing that institutional money can flee as readily as it arrived.
The third is a structural tension within Ethereum’s own design: the growth of layer-two networks, which handle transactions more cheaply by settling on Ethereum, expands the ecosystem’s usage but also reduces the fee pressure on the main chain, complicating the link between network activity and ether’s value.
The fourth is competition from other blockchains vying for the same developers, users, and capital, which caps the premium the market is willing to pay.
And the fifth is simply sentiment and narrative: with the price in a year-long downtrend and a co-founder seen selling, the story around Ethereum has soured, and narrative drives crypto prices more than fundamentals over any given stretch.
The bears’ summary is blunt: the ether trade may be structurally broken, with the token failing to capture the value its thriving network creates, and until the macro tide turns, the record fundamentals are a reason to watch instead of a reason the price must rise.
The catalysts that could flip the line
For the fundamentals to start mattering, something has to change the flow of money and the narrative, and several potential catalysts could do exactly that, which is where the bull case regains its footing.
The most specific is the network’s continued upgrade path. A major scaling upgrade expected in the first half of 2026, followed by another in the second half, is designed to deliver measurable improvements to the main chain, and a successful, well-received upgrade could refresh the narrative around Ethereum, reminding the market of the network’s technical leadership and giving institutional and retail buyers a concrete reason to re-engage.
Upgrades have historically been catalysts for Ethereum when they land well, and the twice-yearly cadence means there are regular opportunities for a positive surprise.
The second catalyst is a reversal in the institutional flows. The exchange-traded fund outflows have been a primary drag, so a durable shift back to sustained inflows, perhaps helped by the staking yield making the funds more competitive against fixed-income products, would remove that selling pressure and could turn the funds back into the demand engine the bull case envisions.
The continued accumulation by corporate treasuries is a related signal; if treasuries keep buying through the weakness and the whale wallets that have been adding to positions during the dip prove to be the leading edge of renewed institutional conviction, the resulting supply squeeze, with so much ether staked and locked, could lift the price sharply once demand returns.
The third catalyst is macro: a shift toward easier monetary policy or a broader return of risk appetite would lift high-beta assets like Ethereum, and given how much it has fallen, the rebound could be substantial. The honest framing is that Ethereum has loaded the spring, with record fundamentals and locked supply, and the catalysts above are what could release it, but each depends on forces, especially the macro backdrop, that are not yet in place.
The bull, base, and bear cases for 2026
Tying the scenarios to the line and the catalysts makes them concrete. These are conditional ranges, not predictions, and each hinges on whether Ethereum holds its pivotal level and whether the catalysts arrive.
- Bull case: Ethereum holds the $1,668 line, a well-received scaling upgrade refreshes the narrative, exchange-traded fund flows reverse back to sustained inflows, and a friendlier macro backdrop returns risk appetite. The locked supply from record staking amplifies the move as demand returns, and Ethereum recovers through resistance toward the $2,300-$3,000 zone, with the most bullish institutional targets pointing well above that over a longer horizon as the fundamentals finally reassert themselves
- Base case: Ethereum chops around the line for an extended period, holding the $1,580-$1,700 range as treasury accumulation offsets continued fund outflows, with the strong fundamentals preventing a collapse but the weak macro preventing a breakout. In this scenario, Ethereum grinds sideways near current levels, waiting for a catalyst, with direction deferred to the second half of the year.
- Bear case: Ethereum loses the $1,668 line and the $1,580 floor decisively, fund outflows continue, Bitcoin drags the market lower, and the falling long-term average becomes overhead resistance. The chart’s deep accumulation zone comes into play, and Ethereum declines toward the $1,000-$1,600 region the bears identify, with the record fundamentals failing, for this cycle, to matter against the macro tide.
What to watch
For anyone tracking whether Ethereum’s fundamentals will finally translate into price, the analysis points to a focused watchlist, and the first item is the line itself. Whether Ethereum holds the $1,668 200-day moving average and the $1,580 floor beneath it, or loses them decisively, is the single clearest signal of which scenario is unfolding, because that level marks the boundary between the recovery path and the deep-accumulation path.
A sustained reclaim of the resistance above the line would be powerfully bullish; a decisive break of the floor would be powerfully bearish. Everything else feeds into that binary.
The second item is the flow data. The exchange-traded fund outflows have been the primary drag, so a durable reversal to net inflows would be among the strongest possible signals that institutional demand is returning, while continued outflows would confirm the bearish reading. The behavior of corporate treasuries and large accumulating wallets matters alongside the funds; sustained buying through weakness supports the bull case, and any sign of treasuries slowing or selling would be a serious warning given how much of the supply-squeeze thesis rests on them.
The third item is the upgrade path and its reception, since a well-received scaling upgrade is the most concrete near-term catalyst that could refresh the narrative. And the fourth, as always, is the macro environment, because Ethereum’s high-beta nature means a shift in monetary policy or risk appetite would move it more than almost any network development.
The honest synthesis is that Ethereum is a coiled spring of record fundamentals and locked supply held down by a hostile macro tape, and the 200-day line is where the contest between the two is being decided.
Watch the line, watch the flows, and resist the temptation to assume that strong fundamentals must win quickly, because Ethereum’s entire recent history is a reminder that they have not.
Frequently Asked Questions
Why is the $1,668 level so important for Ethereum?
Because it is Ethereum’s 200-day moving average, a long-term trend line that has historically divided its bull markets from its bear markets. When Ethereum trades and holds above it, the network has tended to be in recovery or rally mode; when it breaks decisively below, extended downtrends have usually followed. Many traders and automated strategies treat the line as a regime indicator, which makes it partly self-fulfilling. With Ethereum sitting right on the line, the direction it breaks will signal whether a recovery toward $3,000 or a deeper decline toward the chart’s accumulation zone is more likely.
Why is Ethereum’s price falling when its fundamentals are so strong?
Because macro forces and Ethereum’s nature as a high-risk asset have overwhelmed the fundamentals. Ethereum amplifies the broader market’s moves, so in a period of risk aversion, tightening conditions, and a sliding Bitcoin, it falls hard regardless of staking ratios or upgrades. The exchange-traded funds that had bought billions in inflows have seen persistent outflows, turning demand into selling. Layer-two growth complicates the link between network usage and ether’s value, competition caps the premium, and a soured narrative drives sentiment. Over any given stretch, flows and narrative move crypto prices more than fundamentals, which is why record fundamentals have not lifted the price.
How strong are Ethereum’s fundamentals right now?
By most measures, the strongest in its history. Roughly thirty-five point eight million ether, near 30% of the supply, is staked, nearly triple the proportion of early 2023, which locks up supply. Spot exchange-traded funds have drawn around $11.6 billion in cumulative inflows, with the largest product holding over $6 billion. Corporate treasuries hold over 6.2 million ether, up from under 1 million in mid-2025. And the network is on an accelerating upgrade schedule. The contrast between these record fundamentals and the weak price is precisely what makes Ethereum’s current situation so unusual.
How low could Ethereum go?
If it loses the $1,668 line and the $1,580 floor decisively, technical analysts who map the downside identify a deep accumulation zone between roughly $1,600, which would be another 30-60% below current levels. This is the bear scenario, not a forecast, and it depends on continued fund outflows, a falling long-term average turning into resistance, and Bitcoin dragging the market lower. The bull scenario, in which Ethereum holds the line and recovers toward $3,000, is equally coherent. Which path unfolds depends on the line, the flows, the upgrades, and the macro environment.
What could turn Ethereum’s price around?
Several catalysts could flip the trend. A well-received scaling upgrade could refresh the narrative and give buyers a concrete reason to re-engage. A durable reversal of exchange-traded fund outflows back to sustained inflows would remove the primary drag and restore demand. Continued accumulation by corporate treasuries and large wallets, combined with the locked supply from record staking, could create a supply squeeze that lifts the price sharply once demand returns. And a shift toward easier monetary policy or renewed risk appetite would lift high-beta Ethereum substantially. Each depends on forces, especially the macro backdrop, that are not yet fully in place.
Is the “ETH trade” broken?
That is the bears’ core argument: that Ether, the token, is failing to capture the value its thriving network creates, because layer-two growth reduces main-chain fee pressure, institutional flows have reversed, and the price has fallen for a year despite record fundamentals. The bull rebuttal is that the fundamentals have built a coiled spring of locked supply and structural demand that will release once the macro tide turns and a catalyst arrives, and that the current weakness is macro-driven instead of a permanent break. The honest position is that the question is unresolved, and the 200-day line is where the market is deciding it.
This article is information, not investment advice. The scenarios described are conditional ranges that depend on unresolved questions, not predictions, and Ethereum is highly volatile. Prices, flows, staking figures, and fundamentals reflect reporting available as of June 26, 2026, and can change quickly. Nothing here is a recommendation to buy or sell. Verify current data from primary sources and consider your own circumstances before making any decision


The US government lifted its export block on Anthropic’s Claude Mythos 5 on Friday. The decision clears the model for release to more than 100 US institutions, including major companies and government agencies.
The move reverses a two-week standoff between the Trump administration and Anthropic. It rewards Mythos 5 while leaving Fable 5, the consumer version, offline.
Commerce Clears Claude Mythos 5 for Trusted Partners
Commerce Secretary Howard Lutnick set out the decision in a Friday letter to Anthropic compute chief Tom Brown. A license is no longer required to export Mythos 5 to the entities named in Annex A.
“I have determined that appropriate safeguards are in place to permit certain trusted partners to access the Claude Mythos 5 Model,” Commerce Secretary Howard Lutnick, Semafor
Follow us on X to get the latest news as it happens
Senior Anthropic staff had flown to Washington to meet administration officials during the dispute, according to CNBC.
The reversal frees the model behind the Mythos and Fable rollout from controls imposed this month. The block had forced both models offline after Amazon, one of Anthropic’s largest investors, raised the alarm. Its researchers had warned that Fable 5 could be jailbroken for harmful use.
Until then, Mythos sat inside Project Glasswing, a vulnerability-hunting program spanning about 150 organizations across more than 15 countries. The model had earlier found flaws in classified systems within hours of government testing.
Fable 5 Still Waits as a New AI Regime Forms
Sources near the talks said a Fable 5 release is advancing, even as the timeline stays unclear. Unlike Mythos, Fable 5 had been open to anyone with a subscription. It briefly stood as the most powerful AI tool available to the public.
The episode is hardening into a new gatekeeping system. A June 2 executive order set up a voluntary channel for federal review of frontier models. Developers can submit models for a cyber check up to 30 days before release. Washington has spent the past year tightening AI chip exports to China. Extending that authority to a model’s access marks a new front.
OpenAI followed the same path on Friday. It limited its most powerful GPT-5.6 tier, Sol, to about 20 government-approved partners. The weaker Terra and Luna versions went to the public.
The block first grew from fears over Chinese access. Reporting tied the concern to SK Telecom, a South Korean carrier added to Glasswing in early June before losing access. SK Telecom has denied any China ties.
Dozens of cybersecurity leaders had pressed the administration to drop the controls. The open letter, organized by former Facebook security chief Alex Stamos, drew signatures from firms including Nvidia, Adobe, and Zoom.
Allies in Europe and beyond have grown frustrated at suddenly depending on Washington for access. Whether Fable 5 wins the same clearance may become clear in the coming days.
The post Claude Mythos 5 Cleared for 100 US Institutions: Will Fable 5 Follow? appeared first on BeInCrypto.
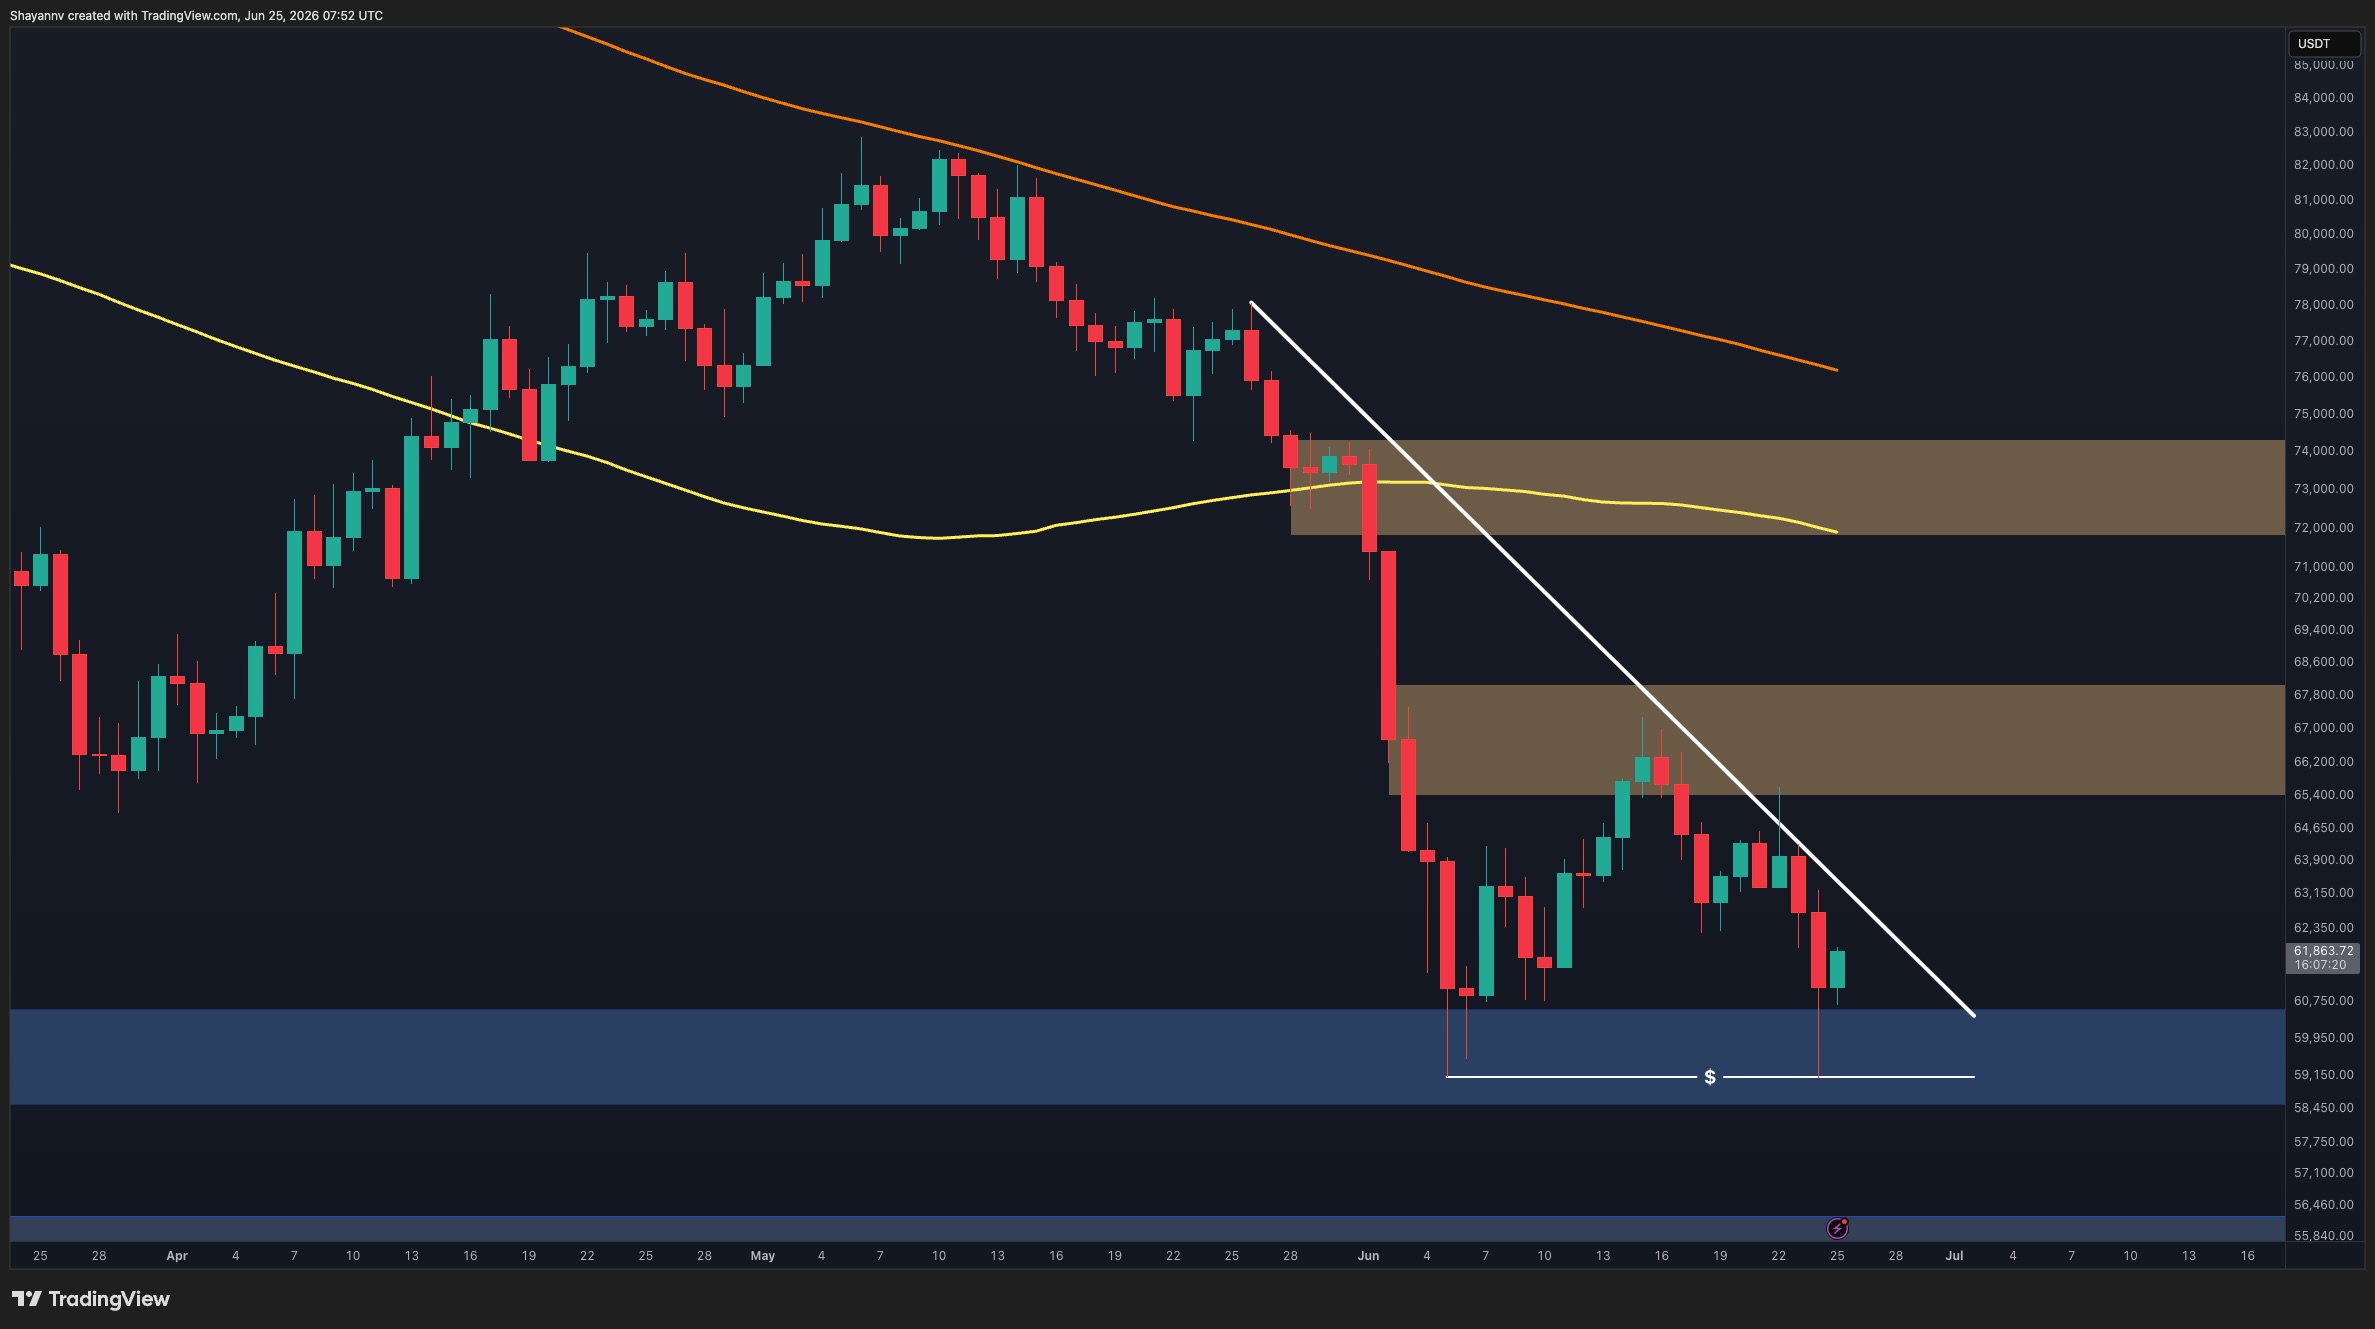
Bitcoin remains under pressure despite another strong reaction from the $58K to $60K demand zone. Although buyers once again stepped in after sweeping the recent lows, the recovery has so far been limited, with the price continuing to trade below key resistance levels.
Bitcoin Price Analysis: The Daily Chart
On the daily timeframe, Bitcoin continues to trade below both the 100-day moving average around $72K and the 200-day moving average near $76K, keeping the broader market structure bearish.
The most recent development is another successful defense of the $59K to $60K support zone. The asset briefly swept below the previous swing low before rebounding back into the range, suggesting that liquidity beneath support has been collected for now.
However, despite the bounce, Bitcoin remains trapped beneath the first supply zone between $65K and $68K. As long as this area caps the recovery, buyers remain on the defensive and the broader downtrend stays intact.
The recent liquidity sweep has improved the short-term picture, but Bitcoin still needs to reclaim the $65K to $68K resistance region to confirm that a more meaningful recovery is underway.
BTC/USDT 4-Hour Chart
The 4-hour chart shows that Bitcoin initially broke below the major support around $59K before quickly reversing higher, forming what appears to be a liquidity sweep beneath the previous lows.
Following that recovery, the price rallied toward the newly formed resistance zone around $61K to $62K but failed to establish a sustained breakout. Sellers defended the area and pushed Bitcoin back toward the $60K region, keeping the short-term sequence of lower highs intact.
For now, the immediate resistance remains at $61K to $62K, while the broader supply zone between $65K and $68K continues to represent the primary upside obstacle.
As long as Bitcoin holds above the $59K to $60K demand zone, another recovery attempt remains possible. However, failure to reclaim nearby resistance would leave the market vulnerable to another retest of support.

Sentiment Analysis
The Coinbase Premium Gap continues to trend deeply negative, indicating that buying activity from U.S. investors remains subdued despite Bitcoin revisiting a major support zone.
Although Bitcoin recently recovered after sweeping liquidity below $59K, the premium has not shown a meaningful improvement and continues to print negative readings. This suggests that the latest rebound has not been accompanied by strong spot demand from Coinbase participants, who are often viewed as a proxy for U.S. institutional investors.
As a result, the on-chain data remains cautious. While the recent liquidity sweep may support additional short-term relief, a sustained recovery will likely require the Coinbase Premium Gap to stabilize and begin moving back toward neutral territory, signaling renewed institutional accumulation.

The post Bitcoin Price Analysis: Is Another Leg Lower Coming After the $58K Drop? appeared first on CryptoPotato.
TLDR:
- Bitcoin still trades above its realized price, a level every major bear market bottom has historically tested first.
- CryptoQuant CEO Ki Young Ju warns BTC may need to fall further before a true cycle bottom is confirmed on-chain.
- Spot ETF flows and institutional demand have changed how Bitcoin absorbs sell pressure compared to previous cycles.
- CryptoQuant’s Bull-Bear Cycle Indicator turned green in May 2023, conflicting with Ju’s longer-term bearish PnL outlook.
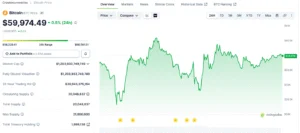
Bitcoin’s most pressing question right now is whether the market has finally reached its cycle bottom. CryptoQuant CEO Ki Young Ju says the answer, based on on-chain data, remains no.
His argument centers on realized price, the average acquisition cost of all circulating Bitcoin weighted by last on-chain movement.
At press time, BTC trades at $59,974.49, up 0.5% in 24 hours but down 5.46% over seven days, keeping the bottom debate very much alive.
What On-Chain Data Says About a Bitcoin Bottom
Realized price has historically served as the final checkpoint before Bitcoin confirms a bear market floor. During the 2015, 2018, and 2022 cycles, spot price approached or briefly fell below that level before any sustained recovery took hold.
Those moments marked peak unrealized losses across the network and preceded the most significant accumulation phases of each cycle.
Ki Young Ju notes that risk and reward tend to improve sharply as price nears investors’ cost basis, and that every major cycle has previously touched the realized price.
Bitcoin has pulled back hard from its 2025 highs, yet it still trades above that threshold. That gap is what Ju identifies as unfinished business within the current bear phase.
Ki Young Ju warned that unless “this time is different,” Bitcoin may still need to fall further before a true cycle bottom forms.
The phrase carries weight in crypto circles, where dismissing historical patterns has repeatedly cost market participants. His logarithmic chart analysis shows the current structure does not yet resemble previous confirmed bottoms.
Ju adds that if Bitcoin does not touch its realized price in the current cycle, it may indicate that market dynamics are shifting fundamentally.
That caveat is important. It leaves room for a new bottoming structure driven by forces that did not exist in prior cycles, including spot ETFs and institutional custody flows.
Why This Cycle May Bottom Differently
Today’s Bitcoin market carries far more institutional infrastructure than any previous bear phase. Spot ETFs, corporate treasury programs, and derivatives desks now absorb sell pressure in ways that can prevent the kind of capitulation seen in earlier cycles.
That structural change may be why realized price has not yet been tested despite months of declining prices.
Ki Young Ju noted that despite elevated selling pressure and growth in realized capitalization, Bitcoin’s price has fallen, suggesting only a shift in holdings among existing investors rather than genuine new demand entering the market.
That reading points to a market still working through distribution rather than one that has cleared its supply overhang.
CryptoQuant’s Bull-Bear Cycle Indicator did turn green on May 12 for the first time since March 2023, a signal that has historically aligned with the start of more constructive market conditions.
That reading runs counter to Ju’s longer-term PnL framework, showing conflicting signals even within the same analytical firm. The split reflects how difficult it is to time a bottom using any single metric.
Analysts tracking ETF flows, Coinbase Premium, stablecoin liquidity, and miner selling activity alongside realized price get a fuller picture of true demand.
Bitcoin’s recovery toward $61,000 has been treated as a relief bounce rather than a confirmed reversal, with market participants evaluating whether demand is strong enough to sustain the move or whether selling pressure will return around key liquidity zones. Until fresh capital visibly enters the market, the bottom question stays open.


Disclosure: This article does not represent investment advice. The content and materials featured on this page are for educational purposes only.
XRPPower has launched a free AI-powered system designed to help BTC and XRP holders automate digital asset management and portfolio strategies.
Summary
- XRPPower launches free AI platform for BTC and XRP asset management with automated tools and global access.
- XRPPower emphasizes security and compliance using encryption, 2FA, and risk controls aligned with global standards.
- The platform reports global expansion across 189 regions and 3M users, focusing on secure digital asset services.
The 2026 FIFA World Cup ignited a global sporting frenzy, bringing fintech and digital assets back into the spotlight. With the cryptocurrency market remaining volatile, holders of digital assets like BTC and XRP are facing pressure from the downturn, and more and more users are looking for diversified asset management and profit-generating methods while holding digital assets.
In response to this market trend, XRPPower has launched a new free AI-powered intelligent system, providing users of mainstream digital assets such as BTC and XRP with a more convenient new model for digital asset profit generation.
Free registration with XRPPower: Start the digital asset profit-generating experience
1. Create an account
2. Choose a suitable profit plan
The platform offers various profit periods and contract plans. Users can freely choose a plan that suits their financial planning and needs, and review the profit rules and contract details before purchasing.
3. Activate contracts with cryptocurrency
After selecting a plan, users can use mainstream cryptocurrencies such as XRP, BTC, ETH, and USDT to complete the payment and successfully activate the corresponding yield contract.
4. Automatic daily profit settlement
During contract operation, the system will automatically settle profits to the account balance daily according to the contract rules. Users can choose to withdraw funds or continue to purchase other contracts, flexibly planning their digital assets.
5. Invite friends, share rewards
Invite friends to join XRPPower and participate in platform services to receive long-term referral rewards according to the platform’s referral reward rules. Eligible referral programs can enjoy a 3% + 2% reward mechanism, allowing sharing to bring more extra income.
XRPPower partial profit contract period details
- Investment Amount: $500, Contract Period: 5 days, Daily Profit: $6.4, Total Profit: $32, Principal $500 returned upon maturity.
- Investment Amount: $1000, Contract Period: 7 days, Daily Profit: $13.2, Total Profit: $92.4, Principal $1000 returned upon maturity.
- Investment Amount: $5,000, Contract Period: 15 days, Daily Return: $70.50, Total Return: $1,057.50, Principal $5,000 returned upon maturity.
- Investment Amount: $10,000, Contract Period: 20 days, Daily Return: $153, Total Return: $3,060, Principal $10,000 returned upon maturity.
Click to view more different AI smart contracts.
XRPPower security, compliance, and protection
Security and trust are at the core of XRPPower’s continued development. Headquartered in the UK, the platform consistently adheres to improving its technical protection, risk management, and compliance, committed to creating a safe, stable, and transparent digital asset service platform for global users.
The platform employs SSL/TLS data encryption, two-factor authentication (2FA), separate storage for cold and hot wallets, and multi-layered security mechanisms to comprehensively protect user accounts, transaction data, and digital assets. Simultaneously, combined with real-time monitoring and intelligent risk control systems, it continuously identifies abnormal behavior, constantly improving the overall security and stability of the platform.
Regarding compliance, XRPPower consistently references relevant international financial industry standards, continuously improves its internal management processes and risk control systems, and draws on risk assessment and internal control concepts widely adopted by international professional auditing firms such as PwC to continuously enhance the platform’s transparency, operational standardization, and long-term service capabilities.
About XRPPower
Currently, XRPPower’s business covers 189 countries and regions worldwide, with over 3 million users. In the future, the platform will continue to uphold the development principles of security, compliance, transparency, and stability, continuously improving its global service network and digital financial ecosystem to provide global users with a more reliable and efficient digital asset service experience.
For more information, visit the official website.
Disclosure: This content is provided by a third party. Neither crypto.news nor the author of this article endorses any product mentioned on this page. Users should conduct their own research before taking any action related to the company.


Polymarket confirmed Friday that hackers drained approximately $3 million from users through a compromised third-party vendor that injected malicious code into the platform's website, according to PeckShield. The prediction-market platform said it had contained the breach and would refund affected… Read the full story at The Defiant
Testing Upper Resistance Levels Of Descending Channel As Bullish Momentum Gains Strength
AAVE is nearing a key technical resistance level, with a continued build-up of bullish momentum after the recent rally from June lows. The DeFi token has been trading within a descending channel for several months, and it is currently testing the upper resistance level of the same.
A descending channel has guided the price movements of AAVE since mid-2025, and it consists of lower lows and lower highs due to prevailing bearishness. Previously, all attempts at breaking above the descending channel have failed as buyers defended the upper trend line. However, there are indications that the latest breakout attempt could be more promising than previous ones.
Buyers Take Control After June Selloff
As reported by clifton_ideas, AAVE is once again testing channel resistance after rebounding from the lower end of the channel. This happened following a brief selloff as the broader market turned bearish in June.
The sell-off increased selling pressure, but buyers were quick to absorb all of the coins on offer without causing further damage to the price. The fast recovery signaled growing optimism and marked a shift in short-term momentum in favor of the bulls.
AAVE was last seen at $81.64, having gained about 7.48% in the daily session. Buyers used the rally to take back several short-term resistance levels, starting at $78 before going above $80. In the process, AAVE attempted to break out toward the $84-$85 region before profit booking started.
Increasing Volume Backs The Breakout Attempt
One of the most compelling bullish signals seen along with the recent move higher includes an impressive surge in volume. Daily volume for AAVE increased by well over 139% in the past 24 hours, signaling strong market participation.
Increased volume on the upside usually serves as a sign of increased investor confidence and helps build credibility around a possible breakout. An increased number of purchases is another factor that demonstrates growing market confidence in AAVE.
In addition to the technical aspects, AAVE shows impressive fundamental characteristics. The market cap for AAVE is around $1.25 billion, and the TVL for AAVE is currently close to $12.41 billion.
Technical Outlook Stays Focused On Confirming Breakout
As for the broader technical outlook, it is starting to show improvements as higher lows appear instead of the previous pattern of lower lows. This is generally an indication of increased demand from buyers and might be the first sign of reversing the prevailing trend.
At the same time, confirmation of any technical outlook is always necessary. Traders will be looking to see whether AAVE can achieve a decisive daily breakout from the descending channel’s resistance. A successful breakout would mean invalidating the bearish technical setup and establishing a new favorable long-term trend.
As seen in the technical projections presented in the chart below, if a decisive breakout from the resistance occurs and buying momentum continues, AAVE might move toward the $170-$190 price range. While it is too early to call these levels, they present possible upside targets in case of bullish developments.
For the moment, the focus stays on channel resistance. The next few trading days may reveal whether AAVE managed to make a breakout or failed once again near repeated price resistance.

New agentic memory framework uses 118K tokens per query. LangMem burns through 3.26M.
Footballer, 18, dies in Venezuela earthquake as ex-Premier League star leads tributes

Siemens Healthineers AG (SMMNY) Discusses Q3 Pre-Close Updates: Foreign Exchange and Tariff Impacts on Revenue and Earnings Prepared Remarks Transcript


-

 Entertainment6 days ago
Renter of Home in Anne Heche Crash Denies Settlement With Son
-
 Sports3 days ago
Two goals and an assist by sheer aura: Cristiano Ronaldo just entered the World Cup chat
-

 Tech5 days ago
Microsoft accidentally kills epic Outlook email threads
-

 Business6 days ago
Soccer-U.S. defends Iran World Cup travel restrictions, says discussions ongoing
-

 Fashion8 hours ago
Weekend Open Thread: Staud – Corporette.com
-

 Politics20 hours ago
The House | Manchesterism won’t survive the painful trade-offs unless it gets citizens on board
-

 Politics7 days ago
Andy Burnham and the meaning of Makerfield
-

 Politics24 hours ago
Potential 2028er World Cup attendee leaderboard
-

 Tech1 day ago
A Look At A Gaggle Of Transputer Boards
-
Crypto World3 days ago
Bitcoin (BTC) Dips Below $62K, Ethereum (ETH) Plunges 6% Daily: Market Watch
-

 Business18 hours ago
Asia stock markets slide as tech shares slump
-

 Crypto World3 days ago
Securitize Wraps Roubini's SEC-Registered ETF as Dubai VARA Digital Security
-
 Crypto World1 day ago
Dell (DELL) Shares Tumble Over 5% Following Analyst Downgrade to Hold
-
Business3 days ago
Entergy settles forward sale agreements, raises $672 million in cash proceeds
-
 Crypto World7 days ago
Can Charles Hoskinson Really Rescue Cardano?
-
 Business7 days ago
Wall Street Week Ahead: Investors see Micron earnings as pulse check of AI rally momentum
-

 Sports5 hours ago
FIH Pro League: India defeat Pakistan 7-1, register biggest win of campaign | Other Sports News
-

 Entertainment7 days ago
Jose Alvarado Wants Taylor Swift at More Knicks Games
-

 Crypto World9 hours ago
RTX holders must register wallets before token distribution begins
-

 Crypto World7 days ago
HIVE shares jump as $220M AI deal speeds Bitcoin mining pivot
You must be logged in to post a comment Login