
Crypto World
Is the 4-Year Cycle Dead?

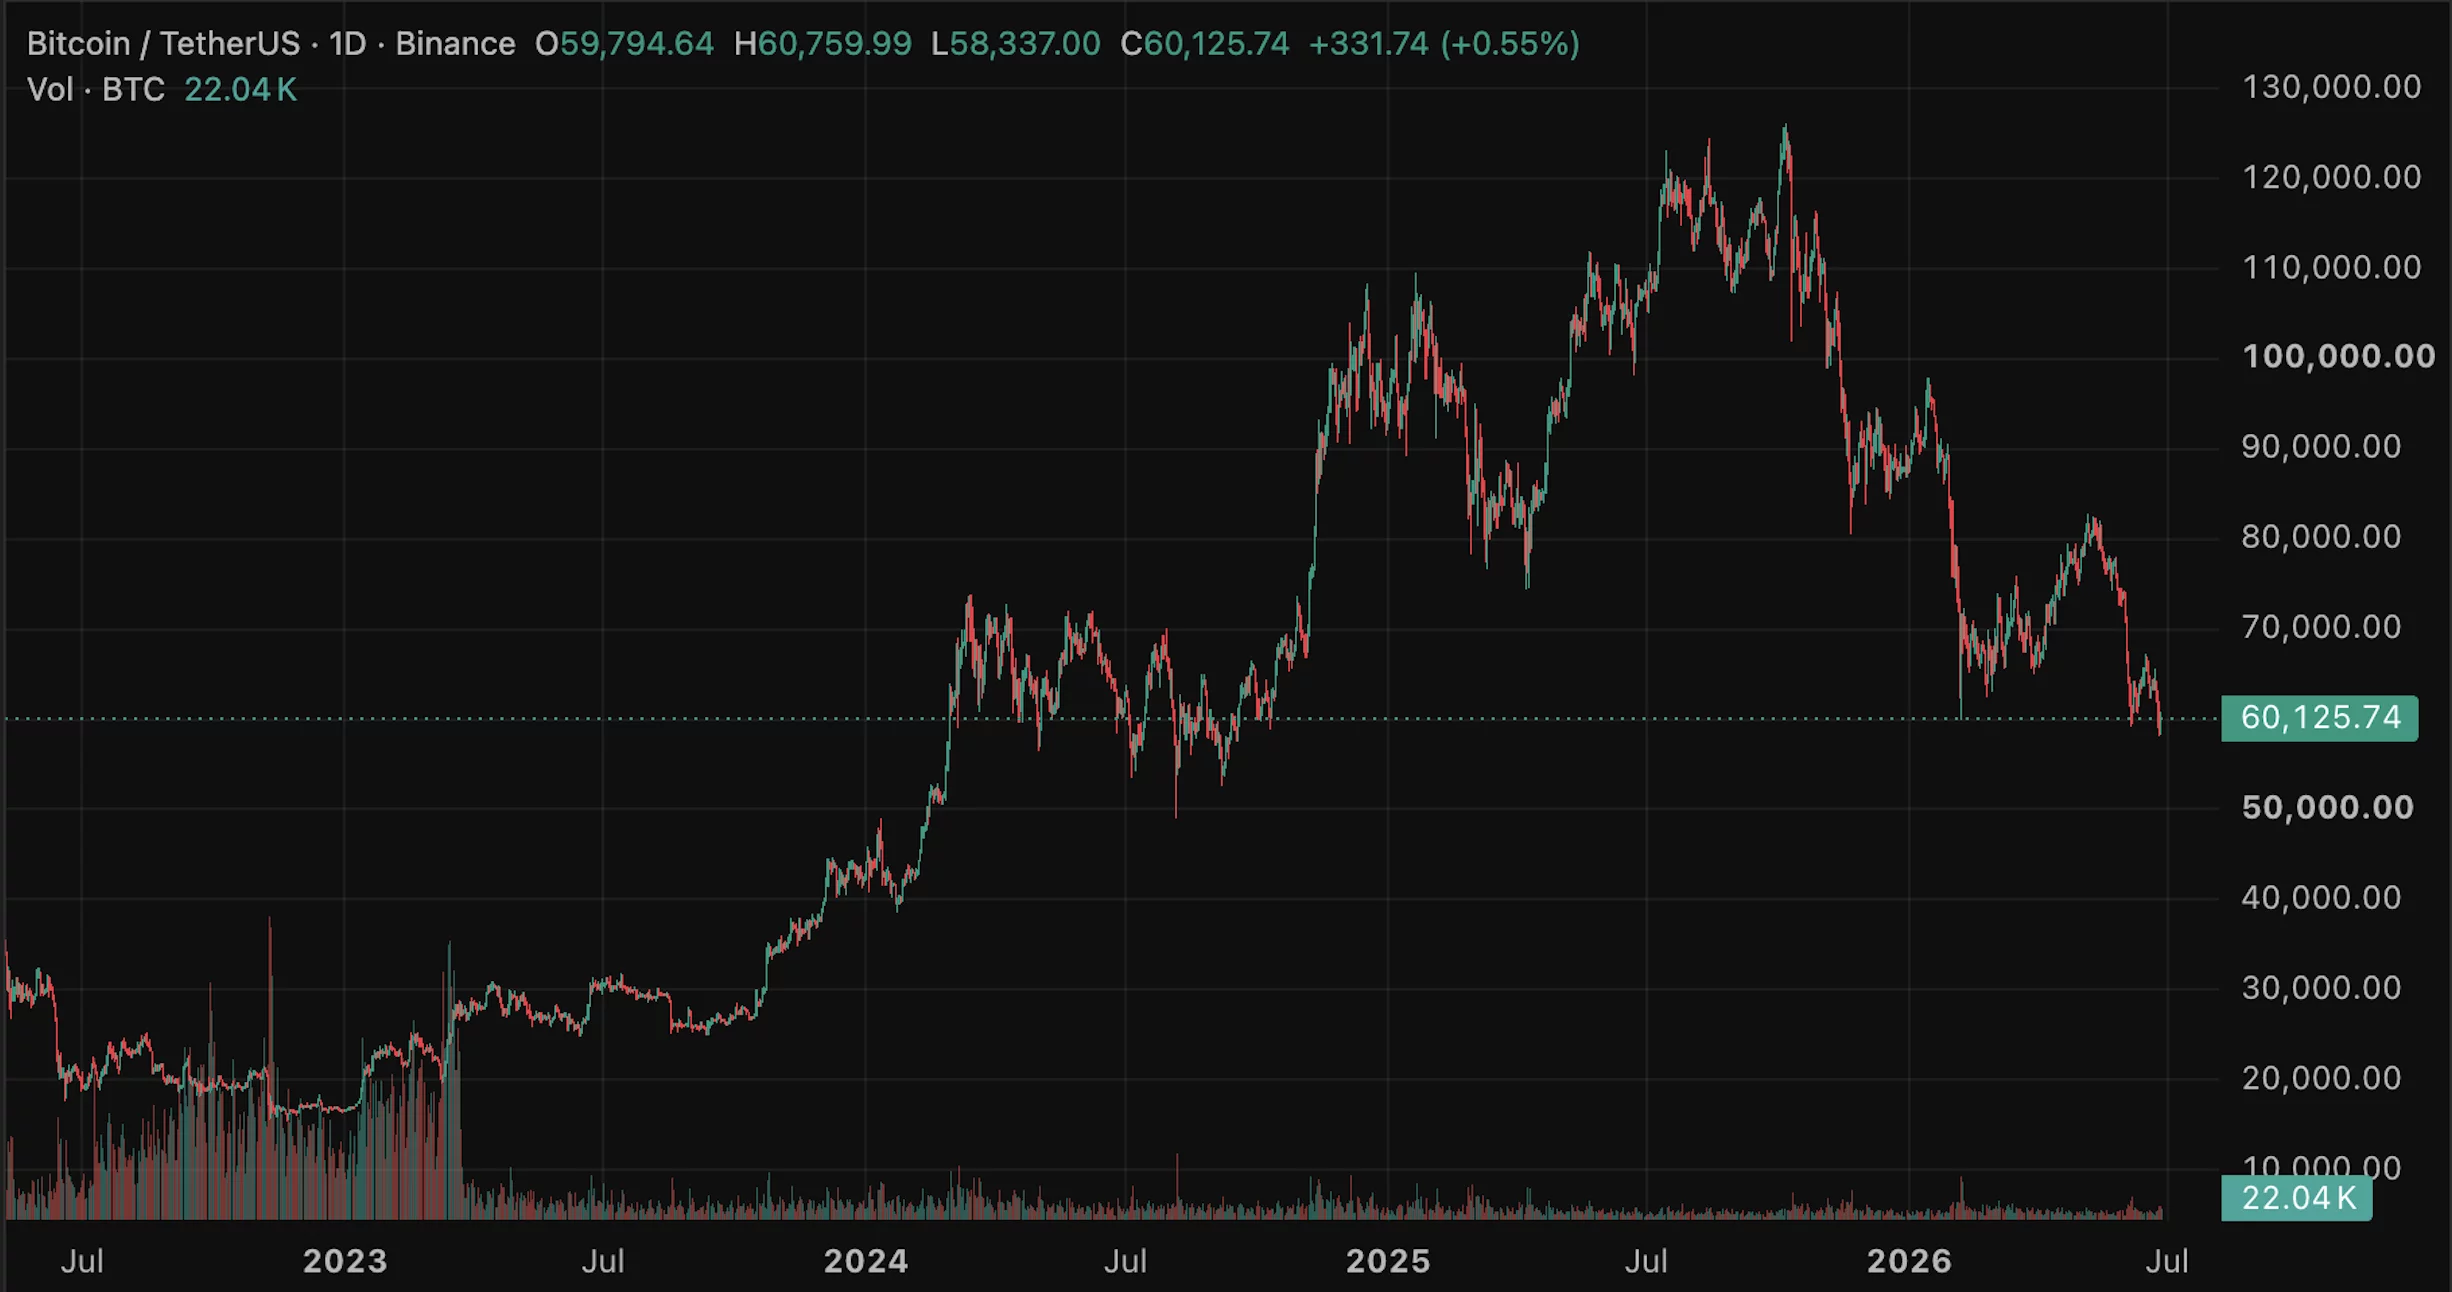
Bitcoin sits near $60,000, down more than half from its October peak, with traders in extreme fear and institutions pulling money out for six straight weeks. The single question that decides where it goes next is whether the famous four-year cycle still governs Bitcoin, or whether institutions have broken it for good.
Summary
- Bitcoin trades near $60,000, roughly 52% below its $126,000 October 2025 peak, sitting on its 200-week moving average with the Fear and Greed Index in extreme fear.
- The central debate is whether the four-year halving cycle is still in control, which would make this a textbook post-peak correction, or whether institutional demand has broken that cycle.
- The cycle-alive case fits the timing almost perfectly: Bitcoin peaked about 18 months after the 2024 halving and is now in the correction phase, the pattern predicts.
- The cycle-dead case argues that exchange-traded funds, corporate treasuries, and structural institutional demand have overridden the old retail-driven rhythm, pointing to a slow grind rather than a deep bear market.
- The crash is the test: a new low below the prior cycle bottom would vindicate the cycle, while holding here and grinding higher would suggest the pattern is broken. The outcome hinges on flows and the macro environment, not on any single price target.
Bitcoin is trading near $60,000, and depending on which framework you believe, that number is either the early stage of a painful but normal correction that ends with a familiar recovery, or the beginning of something the old playbook cannot explain.
The price is down roughly 52% from the all-time high near $126,000 set in October 2025. It is resting on a long-term technical line that traders watch closely. The sentiment gauge known as the Fear and Greed Index is buried in extreme fear, and institutions have pulled money out of Bitcoin exchange-traded funds for six consecutive weeks.
Every one of those facts can be read two ways, and the reading you choose depends almost entirely on a single question that now hangs over the entire market: is Bitcoin still governed by its famous four-year cycle, in which case this is the correction the cycle always brings, or have institutions broken that cycle, in which case the old rules no longer tell you what comes next.
This piece is built around that question, because it is the one that actually decides Bitcoin’s path through the rest of 2026, far more than any individual price level does.
The reason to frame a price prediction this way, rather than as a list of targets, is that the targets themselves flow from which thesis turns out to be right.
If the four-year cycle is alive, history points toward a deeper drawdown and a multi-quarter trough before the next halving-driven recovery. If the cycle is dead, the structural demand from funds and corporate treasuries could put a floor under the price well above where the old pattern would take it, turning a crash into a correction.
The honest work of a prediction, then, is not to pretend to know the number, but to lay out both frameworks clearly, weigh what the current evidence says about each, identify the levels and catalysts that would tip the balance, and translate all of it into concrete bull, bear, and base scenarios.
That is what follows: the cycle explained, the case for each side, what the crash is really signaling, the levels that matter, the scenarios, and the specific developments that would settle the debate.
Bitcoin at a crossroads
Start with where things actually stand, because the current picture is genuinely tense. Bitcoin fell hard through June, breaking down toward the $60,000 area in one of its worst stretches in months, with a single brutal session wiping out around $700 million in leveraged positions, the great majority of them bullish bets that were forced to close.
The drop brought Bitcoin to its 200-week moving average, a long-term trend line near $62,000 that has historically marked deep-cycle support, the kind of level that in past bear markets has roughly coincided with major bottoms.
Just below it, analysts flag the $59,000 area as the next test, and below that, the psychological $60,000 line gives way to genuine uncertainty about how far a breakdown could run.
The mood matches the chart. The Fear and Greed Index, which measures market sentiment on a scale from extreme fear to extreme greed, sits near the bottom of its range in extreme fear, a reading that reflects how thoroughly the recent decline has shaken confidence.
Institutional behavior tells a similarly cautious story, with spot Bitcoin exchange-traded funds posting six straight weeks of net outflows totaling close to $6 billion, described by analysts as the largest sustained institutional redemption wave since these funds launched.
Futures positioning has contracted sharply as traders cut leverage, a sign of de-risking rather than fresh conviction. And yet, woven through the gloom, are countervailing signals: a single day of positive fund flows late in the month, continued buying by corporate treasuries that view these levels as attractive, and the historical tendency of extreme fear to precede rebounds.
Bitcoin, in other words, is at a genuine crossroads, with the bearish evidence and the contrarian signals roughly balanced, and the cycle question is what tips the interpretation one way or the other.
The four-year cycle, explained
To weigh whether the cycle is alive or dead, you have to understand what the four-year cycle actually is, because it has been the dominant framework for understanding Bitcoin’s price for over a decade.
At the center of it sits the halving, a programmed event that occurs roughly every four years and cuts in half the rate at which new Bitcoin is created. Because Bitcoin’s supply growth slows abruptly at each halving while demand continues or grows, the halving has historically acted as a supply shock that, with a lag, drives the price upward.
The pattern that emerged across the first three cycles was remarkably consistent: in the 12-18 months following each halving, Bitcoin entered a powerful bull market and reached a new all-time high, after which it suffered a severe bear market, often falling seventy to 80% from the peak, before grinding through a recovery into the next halving and repeating the sequence.
This rhythm became almost a law in the minds of many investors. The halvings of 2012, 2016, and 2020 were each followed by a major price peak roughly a year to a year and a half later, and each peak was followed by a brutal drawdown and a multi-year trough.
The framework gave Bitcoin holders a kind of map: accumulate in the bear market, hold through the halving, ride the bull market to a new high, and brace for the crash that follows. The most recent halving occurred in April 2024, which places the present moment about 26 months into the current cycle, in what the framework would call the late-cycle or post-peak phase.
If the four-year cycle still governs Bitcoin, then the timing of the recent peak and the subsequent decline should look familiar, and the path ahead should rhyme with what happened after the previous three halvings. Whether it does is exactly what is now in dispute.
The case that the cycle is playing out exactly as it should
The argument that the four-year cycle is alive and well is, on the timing alone, strikingly persuasive. Bitcoin reached its all-time high near $126,000 in October 2025, which is roughly 18 months after the April 2024 halving, landing squarely inside the 12-18-month window in which the previous three cycles each topped out.
From the cycle’s perspective, that peak was the natural climax of the post-halving bull market, right on schedule. What has followed, a sharp decline that has now erased more than half the price, is precisely the kind of post-peak correction the pattern predicts, the opening phase of the bear market that historically arrives after each cycle high.
Seen this way, nothing about the current crash is surprising or anomalous; it is the cycle doing exactly what it has always done.
Respected voices in traditional finance hold this view. Some analysts have described 2026 as a likely correction year, the down phase of the cycle, pointing to support zones in the $60,000-$75,000 range as the kind of levels a cycle correction might test or breach.
Prominent cycle analysts have argued that the cycle bottom still lies ahead, with base cases placing a potential new low later in 2026, consistent with the historical pattern in which the trough comes well after the peak.
Under this framework, the extreme fear, the institutional outflows, and the technical breakdown are all expected features of the post-peak phase, not signs that something unprecedented is happening.
The cycle-alive case, therefore, implies real further downside: if Bitcoin follows the template of prior cycles, the current decline could deepen toward a trough materially below current levels before the next halving-driven recovery begins. It is a sobering view, but it has history and timing firmly on its side, which is what makes it so hard to dismiss.
The case that the cycle is dead
The opposing argument is that the four-year cycle was a feature of a Bitcoin market that no longer exists, and that the forces which created the cycle have been overwhelmed by something new.
The cycle, in this view, was largely a product of retail-driven speculation amplified by the halving narrative, a self-fulfilling rhythm that worked when Bitcoin was a small, speculative asset, moved mainly by individual traders and the four-year supply story.
What has changed is the arrival of institutions at scale. Spot exchange-traded funds have brought enormous, structural pools of capital into Bitcoin, corporate treasuries have adopted it as a reserve asset and accumulate it continuously, and large financial institutions now treat it as a portfolio allocation instead of a speculative flyer.
These holders do not buy and sell on the halving narrative; they respond to macro conditions, portfolio strategy, and long-term conviction, and their presence changes the market’s fundamental behavior.
Proponents of this view, including some prominent research shops, argue that Bitcoin has entered a slow bull phase more akin to a mature asset like gold than to its old boom-and-bust cycles, in which persistent institutional demand smooths out the violent four-year swings and replaces them with a steadier, longer grind higher.
In this framework, the halving still matters as a supply event, but it no longer dictates the price the way it once did, because the marginal buyer is now an institution instead of a retail speculator chasing the cycle.
The implication is that the deep, 70-80% bear markets of the past may not repeat, because structural demand provides a floor that did not exist before, turning what would once have been a cycle-ending crash into a more contained correction.
If this thesis is right, then the current decline, however painful, is a drawdown within an ongoing structural bull market instead of the start of a multi-year winter, and the $60,000 area could prove closer to a bottom than to a way station on the road down. The cycle-dead case, in short, says the old map no longer describes the territory.
What the crash is actually telling us
The natural question is whether the current crash settles the debate, and the honest answer is that it does not, because the evidence cuts both ways, which is itself revealing.
On the bearish side, the six straight weeks of exchange-traded fund outflows, totaling close to $6 billion, complicate the cycle-dead thesis, because they show that institutional demand, far from providing an unshakable floor, can reverse hard and become a source of selling pressure.
The slow-bull argument rests on institutions being steady, structural buyers, and a sustained redemption wave of this size shows that institutional money can flee risk just as retail money does, dragging the price down instead of cushioning it.
The extreme fear, the forced liquidations, and the breakdown to long-term support all fit comfortably within the cycle-alive interpretation of a post-peak correction gathering momentum.
On the other side, several signals support the cycle-dead reading. Even amid the outflows, corporate treasuries kept buying through the decline, with major holders adding to their positions at current levels and explicitly framing them as attractive entry points, behavior that reflects exactly the structural, conviction-driven demand the slow-bull thesis describes.
Late in the month, fund flows turned positive for a day, a tentative hint that the institutional selling may be exhausting itself. And the very depth of the extreme-fear reading, historically, has often preceded rebounds instead of further collapse, because it tends to mark the point of maximum pessimism where selling pressure runs out.
The takeaway is that the crash is genuinely ambiguous: it has features that fit both frameworks, and it has not yet produced the one piece of evidence that would be decisive, which is whether Bitcoin makes a new cycle low or holds here and recovers. Until that resolves, the data refuses to declare a winner, which is precisely why the cycle question remains open and why the next few months matter so much.
The levels that matter
While the big-picture debate plays out, the technical levels provide the concrete map traders are watching, and they are worth knowing because they will mark, in real time, which thesis is gaining the upper hand.
The most important support is the 200-week moving average near $62,000, the long-term trend line that has historically tracked deep-cycle bottoms; a decisive, sustained break below it would be a meaningful signal that the bearish, cycle-alive scenario is taking hold, because losing that level has in the past preceded extended declines.
Just beneath sit the $59,000 area and the round $60,000 psychological level, the latter being the line that prediction-market traders have heavily wagered Bitcoin will break to set a new yearly low, with a smaller but real probability assigned to a fall under $50,000.
On the upside, the levels that would suggest the decline is stabilizing run through the $64,000-$65,000 zone as immediate resistance, with the broader trading range capped near $66,000-$67,000. Reclaiming those levels with conviction would weaken the bearish case and lend support to the idea that structural demand is putting in a floor, while repeated rejection there would keep sellers in control.
The key point is that these levels are not just numbers but markers in the larger argument: holding the 200-week moving average and pushing back above resistance would be evidence for the cycle-dead, floor-is-holding thesis, whereas breaking down through support toward the fifties would be evidence for the cycle-alive, correction-deepening thesis.
The chart, in this sense, is where the abstract debate becomes concrete, and the next decisive move through one of these levels will tell observers a great deal about which framework is winning.
The bull, base, and bear cases for 2026
Translating all of this into scenarios means tying each outcome to the cycle question and to the levels and flows that would drive it. These are conditional ranges, not predictions, and each depends on which forces win out.
- Bull case: Bitcoin holds the 200-week moving average, the extreme fear marks a local bottom, institutional fund flows turn decisively positive, and a friendlier macro backdrop, such as signals of easier monetary policy, restores risk appetite. In this scenario, the cycle-dead, structural-demand thesis is vindicated, the $60,000 area proves to be a correction low, and Bitcoin recovers back toward and through its prior resistance, with more optimistic institutional targets pointing well into six figures over the following year as the slow bull resumes.
- Base case: the tension persists and Bitcoin chops within a wide range for an extended period, neither breaking down to a new cycle low nor mounting a clean recovery, as steady treasury buying offsets continued fund outflows and the market waits for macro clarity. In this scenario, the cycle question stays unresolved, Bitcoin grinds sideways to modestly lower around current levels, and direction depends on which flow trend wins out over the second half of the year.
- Bear case: Bitcoin loses the 200-week moving average decisively, the institutional outflows continue, and the four-year cycle reasserts itself in textbook fashion, driving a deeper correction toward the $50,000 area or below as the post-peak bear market plays out. In this scenario, the cycle-alive thesis wins, prediction-market bets on a sub-$50,000 print are realized, and Bitcoin works toward a cycle trough later in the year before any halving-driven recovery can begin.
What would settle the debate
For anyone trying to read Bitcoin’s direction over the coming months, the analysis points to a short list of developments that would actually settle the cycle question, and watching them is more useful than fixating on any single price. The first and most decisive is simply whether Bitcoin makes a new cycle low. If it breaks down through the 200-week moving average and the $60,000 area toward a materially lower trough, the four-year cycle will have shown that it still governs the market, and the bearish framework will have won.
If, instead, Bitcoin holds these levels and begins to recover, the case that structural demand has broken the cycle gains powerful support. That single binary, new low, or held floor, is the cleanest test available.
The second thing to watch is the institutional flow trend. The six-week outflow streak is the strongest evidence against the slow-bull thesis, so a durable reversal back to sustained net inflows would suggest the structural demand is reasserting itself, while a continuation or acceleration of outflows would reinforce the bearish, cycle-alive reading.
The behavior of corporate treasuries matters here too: continued accumulation through weakness supports the floor thesis, while any sign of treasuries slowing or reversing would be a serious warning.
The third factor is the macro environment, since Bitcoin now trades heavily as a risk asset, and a shift toward easier monetary policy or renewed risk appetite would support the bullish case, while tighter conditions and risk aversion would deepen the decline.
The honest conclusion is that Bitcoin’s path through 2026 is not yet written, because it depends on a genuine, unresolved question about whether the oldest pattern in crypto still holds. The cycle is either running late or it is dead, and the market is about to find out which, with the 200-week moving average, the flow data, and the macro backdrop serving as the scoreboard. Until those resolve, humility about any specific target is not weakness but accuracy.
Frequently Asked Questions
What is the four-year Bitcoin cycle?
It is the dominant framework for understanding Bitcoin’s price, built around the halving, a programmed event roughly every four years that cuts the rate of new Bitcoin creation in half. Historically, in the 12-18 months after each halving, Bitcoin entered a bull market and reached a new all-time high, then suffered a severe bear market, often falling 70-80%, before recovering into the next halving. The pattern held across the 2012, 2016, and 2020 halvings, giving investors a map of accumulation, bull run, peak, and crash that has shaped how the market thinks about Bitcoin for over a decade.
Where is Bitcoin in the cycle right now?
The most recent halving was in April 2024, which places the present moment about 26 months into the current cycle, in what the framework calls the late-cycle or post-peak phase. Bitcoin reached its all-time high near $126,000 in October 2025, roughly 18 months after the halving, squarely within the historical window for a cycle peak. The decline since then, now more than 50%, would be the post-peak correction the cycle predicts. If the cycle still governs, the trough would typically come well after the peak, potentially later in 2026.
Why do some analysts think the cycle is dead?
Because the market that created the cycle has changed. The four-year rhythm was largely driven by retail speculation amplified by the halving narrative, when Bitcoin was a small asset moved by individual traders. Now spot exchange-traded funds, corporate treasuries, and large institutions have brought structural capital that responds to macro conditions and portfolio strategy instead of the halving story. Proponents argue this has turned Bitcoin into a slow-bull asset more like gold, with steadier demand smoothing the violent four-year swings and providing a floor that could prevent the deep bear markets of the past from repeating.
What does the current crash tell us about the debate?
It does not resolve it, because the evidence cuts both ways. The six straight weeks of fund outflows show institutional demand can reverse and become selling pressure, undercutting the steady-floor thesis and fitting the cycle-alive correction view. But corporate treasuries kept buying through the decline, fund flows turned positive for a day, and extreme fear has historically preceded rebounds, all of which support the cycle-dead reading. The decisive evidence, whether Bitcoin makes a new cycle low or holds and recovers, has not yet arrived, which is why the debate remains open and the coming months are pivotal.
What price levels matter most?
The key support is the two-hundred-week moving average near $62,000, a long-term line historically tied to deep-cycle bottoms; a decisive break below it would signal the bearish scenario is taking hold. Beneath sit the $59,000 area and the $60,000 psychological level, with prediction markets heavily wagering on a break to new yearly lows and a smaller chance of a fall under $50,000. On the upside, 64,000-$65,000 is immediate resistance, with the range capped near $66,000-$67,000. Holding support and reclaiming resistance favors the bulls; breaking down favors the bears.
Could Bitcoin fall below $50,000?
It is possible, and prediction-market traders assign a real probability to it. In the bearish, cycle-alive scenario, Bitcoin loses its 200-week moving average, institutional outflows continue, and the post-peak bear market drives a deeper correction toward 50,000 or below as the cycle works toward a trough later in the year. This is not a certainty, and the bullish scenario, in which structural demand puts in a floor near current levels, is equally coherent. Which path unfolds depends on the cycle question, the flow data, and the macro environment, none of which has yet been settled, so a fall below $50,000 is a genuine risk instead of a forecast.
This article is information, not investment advice. The scenarios described are conditional ranges that depend on unresolved questions, not predictions, and Bitcoin is highly volatile. Prices, flows, and sentiment reflect reporting available as of June 26, 2026, and can change quickly. Nothing here is a recommendation to buy or sell. Verify current data from primary sources and consider your own circumstances before making any decision.



Strategy (MSTR), the world’s largest corporate bitcoin holder, reported Thursday an $8.2 billion second-quarter net loss after the cryptocurrency’s price decline erased billions of dollars from the value of its digital asset holdings.
The quarterly loss was driven almost entirely by an $8.32 billion unrealized markdown on its bitcoin holdings under fair-value accounting.
The company held 843,775 bitcoin as of July 26, up 25% from the start of the year. At current prices, the stash is worth roughly $54.8 billion, compared with an acquisition cost of $63.7 billion.
The report came after a period of growing investor scrutiny on the firm over whether it can sustain an increasingly complex capital structure built around multiple classes of preferred stock, common equity and convertible debt.
The company raised $17.06 billion through at-the-market stock offerings this year, repurchased $1.5 billion of convertible notes at an 8% discount and expanded its U.S. dollar reserve to $3.75 billion, enough to cover more than two years of preferred dividend payments and interest expenses.


Amazon shares surged in after-hours trading on Thursday after the company delivered a blowout second-quarter earnings report, beating Wall Street expectations across revenue, AWS sales, operating income, and earnings per share.
The results reinforced investor confidence that Amazon’s massive AI infrastructure spending is translating into accelerating cloud growth and stronger profitability.
Follow us on X to get the latest news as it happens
Amazon Beats Wall Street Across Key Metrics
Amazon reported Q2 net sales of $200.6 billion, comfortably above analyst estimates of approximately $197 billion. The company also posted operating income of $27.46 billion, exceeding expectations of around $23.6 billion, while operating margin expanded to 13.7%, above the expected 12%.
Perhaps the biggest surprise came from earnings. Amazon reported earnings per share of $5.75, far ahead of the consensus estimate of $1.82, highlighting significantly stronger profitability than analysts anticipated.
The earnings release immediately fueled investor optimism, sending Amazon shares from a regular-session close of $235.50 to roughly $251 in after-hours trading, representing a gain of more than 6.5% after the closing bell.
AWS Growth Shows Amazon’s AI Spending Is Paying Off
The strongest signal from the report came from Amazon Web Services.
AWS generated $42.23 billion in revenue during the quarter, surpassing expectations of roughly $40.57 billion. Cloud revenue grew approximately 37% year-over-year, marking AWS’s fastest expansion in roughly 18 quarters.
For investors, AWS remains Amazon’s most closely watched business because it serves as the company’s primary AI infrastructure engine.
Chief Executive Andy Jassy has repeatedly defended Amazon’s aggressive capital investment strategy, maintaining plans to spend roughly $200 billion during 2026 to expand AI data centers, networking infrastructure, and custom silicon capabilities.
The latest earnings suggest those investments are beginning to translate into accelerating customer demand rather than simply higher expenses.
Investors Reward Amazon’s AI Strategy
Heading into earnings, investors questioned whether Amazon could match the strong cloud performance recently reported by Microsoft while justifying its enormous AI capital expenditures.
Instead, Amazon exceeded expectations across nearly every major operating metric.
The combination of stronger AWS growth, expanding operating margins, and better-than-expected profitability eased concerns that AI spending would pressure near-term earnings. Investors instead viewed the results as evidence that Amazon’s infrastructure investments are already supporting faster revenue growth.
Although some of the earnings benefit included non-operating gains, the company’s underlying operating performance remained well ahead of Wall Street forecasts.
What’s Next for Amazon?
Attention now shifts toward Amazon’s second-half execution as management continues rolling out AI infrastructure and expanding AWS services.
Investors will closely monitor whether AWS can maintain its accelerated growth trajectory while Amazon continues one of the largest capital investment programs in corporate history. Future earnings will also provide a clearer picture of whether AI-driven demand can continue supporting margin expansion and justify the company’s long-term spending plans.
If AWS momentum remains intact, Amazon could further strengthen its position in the increasingly competitive AI cloud market alongside Microsoft and Google.
The report also arrives at a pivotal moment for the AI investment race, with Microsoft and other tech giants raising the bar on cloud performance. Amazon’s latest numbers suggest its AI strategy is beginning to generate tangible financial returns.
The post Amazon AI Bet Pays Off as Q2 Earnings Crush Expectations: How Will Stock React? appeared first on BeInCrypto.

When Liz Gumbinner first noticed a twinge in her right shoulder, she assumed she’d pulled a muscle. It was during the pandemic, when many exercise studios were closed, and Gumbinner, a writer who teaches advertising at Boston University, had been doing a lot of yoga and dance at home.
But the pain, mild at first, gradually became excruciating, shooting down her arm whenever she extended it. “We’re talking worse than labor contractions,” she says.
Pretty soon, Gumbinner couldn’t zip up a dress, turn off a light switch on the wall, or even hold hands with her boyfriend. The only way she could sleep was flat on her back with her arms at her sides. “That’s when I realized it wasn’t a pulled muscle,” she says.
A few months later, she was diagnosed with adhesive capulitis, colloquially known as “frozen shoulder,” a condition in which the shoulder capsule—a fibrous sheath which surrounds the joint—becomes thick and inflamed. It usually develops in three phases: the freezing stage, which can last several months and cause severe pain; the frozen stage, during which the shoulder becomes stiffer and difficult to use, often for up to a year; and the thawing stage, when mobility finally begins to improve.


Hyperscale Data has sold about 100 Bitcoin and secured a BTC-backed credit facility to finance construction of its artificial intelligence data center in Michigan.
Summary
- Hyperscale Data sold about 100 BTC to fund construction and equipment purchases.
- Its Bitcoin-backed credit facility carries a variable rate of approximately 4.5% to 5%.
- A 10-year AI services agreement could generate more than $1.2 billion if fully exercised.
- Hyperscale Data retains about 1,006 BTC, ranking 44th among public corporate holders.
Hyperscale Data converts Bitcoin into AI funding
Hyperscale Data disclosed the Bitcoin sale and financing agreement on Thursday as it accelerated work on its Michigan AI campus.
Proceeds from the sale will fund construction and purchases of critical infrastructure and equipment with long delivery times. The company did not disclose the dollar value of the transaction or the lender behind its Bitcoin-backed credit line.
Its new facility is expected to provide financing at a variable interest rate of roughly 4.5% to 5%. The arrangement allows Hyperscale Data to raise additional capital against its remaining Bitcoin rather than selling a larger share of its holdings immediately.
Bitcoin Treasuries data shows the company retains approximately 1,006 BTC after the sale. That position makes it the 44th-largest publicly traded corporate Bitcoin holder tracked by the platform.
Formerly called Ault Alliance, Hyperscale Data adopted its current name in 2024 as it shifted more attention toward AI infrastructure. However, the company has continued operating its Bitcoin mining business.
Michigan AI contract could exceed $3 billion
Construction at the Michigan campus supports an earlier master services agreement with an unnamed AI infrastructure provider. The initial phase covers approximately 20 megawatts of computing capacity.
The agreement has a 10-year term and includes two optional five-year extensions. Hyperscale Data estimates the contract could produce more than $1.2 billion in revenue if the customer exercises all options attached to the initial capacity.
The customer can also request another 32 MW within the first two years. If that expansion proceeds and remains active throughout both extension periods, Hyperscale Data expects the contract’s total value to exceed $3 billion.
These projections depend on the customer taking the available capacity and exercising its extension rights. Hyperscale Data has not identified the customer or provided a final timeline for completing the full 52 MW buildout.
Bitcoin miners expand into US AI infrastructure
Hyperscale Data’s financing decision adds to a wider shift among U.S.-listed Bitcoin miners seeking revenue from AI computing and data centers.
Hut 8 recently signed a second 15-year lease valued at $9.8 billion for its Beacon Point AI campus in Nueces County, Texas. IREN separately announced $2.8 billion in new multi-year cloud contracts and increased its year-end 2026 annualized revenue target to more than $4 billion.
Mining companies already control power connections, land and data center infrastructure that can be adapted for high-performance computing. AI contracts may offer steadier revenue than Bitcoin mining, where income depends on network difficulty, energy costs and the market price of BTC.
The transition is not without risk. Poolin filed for Chapter 11 protection in the U.S. on July 22 with roughly $173 million in prepetition obligations. The Singapore-based mining company and two U.S. subsidiaries plan to sell their Texas assets through a court-supervised process rather than restore the business.
Hyperscale Data’s Michigan investment gives the trend a direct U.S. infrastructure angle while also showing how corporate Bitcoin reserves can serve as a source of construction capital.
GPUS shares rise after financing announcement
Hyperscale Data shares, traded on NYSE American under the GPUS ticker, gained more than 5% in late-morning trading Thursday, according to Yahoo Finance data.
The market reaction followed the company’s financing update and its projections for the Michigan contract. Investors will now watch construction progress, the AI customer’s expansion decision and any further changes to Hyperscale Data’s Bitcoin holdings.
Using BTC as both a saleable reserve and loan collateral exposes the company to Bitcoin price movements while it funds a capital-intensive data center project. Future disclosures on the facility’s collateral requirements and the campus delivery schedule may provide a clearer view of that risk.

This is what makes the current moment so difficult to read. Transitions do not move neatly through the categories we use to manage the world; pressure crosses them, changing role as it goes, and by the time the official language catches up, people may already have been living with the change for years.
The next transition is forming through that movement. It is not an artificial intelligence story alone, or a climate story alone, or a demographic story alone. Each of those matters, but none explains the whole moment by itself. What matters most is how these forces begin to interact, and how much load they place on systems built around older assumptions. When enough pressure moves at once, the operating and organizing logic of an age begins to lose its fit.
Every age has such a logic. Most people do not experience it as a theory. They experience it as the background of life: how work is organized, how families are supported, how knowledge is trusted, how institutions make decisions, how risk is absorbed, and how people are expected to build a life. For a long time, that background can feel natural. Then the world changes around it, and what once made life manageable begins to show its limits.
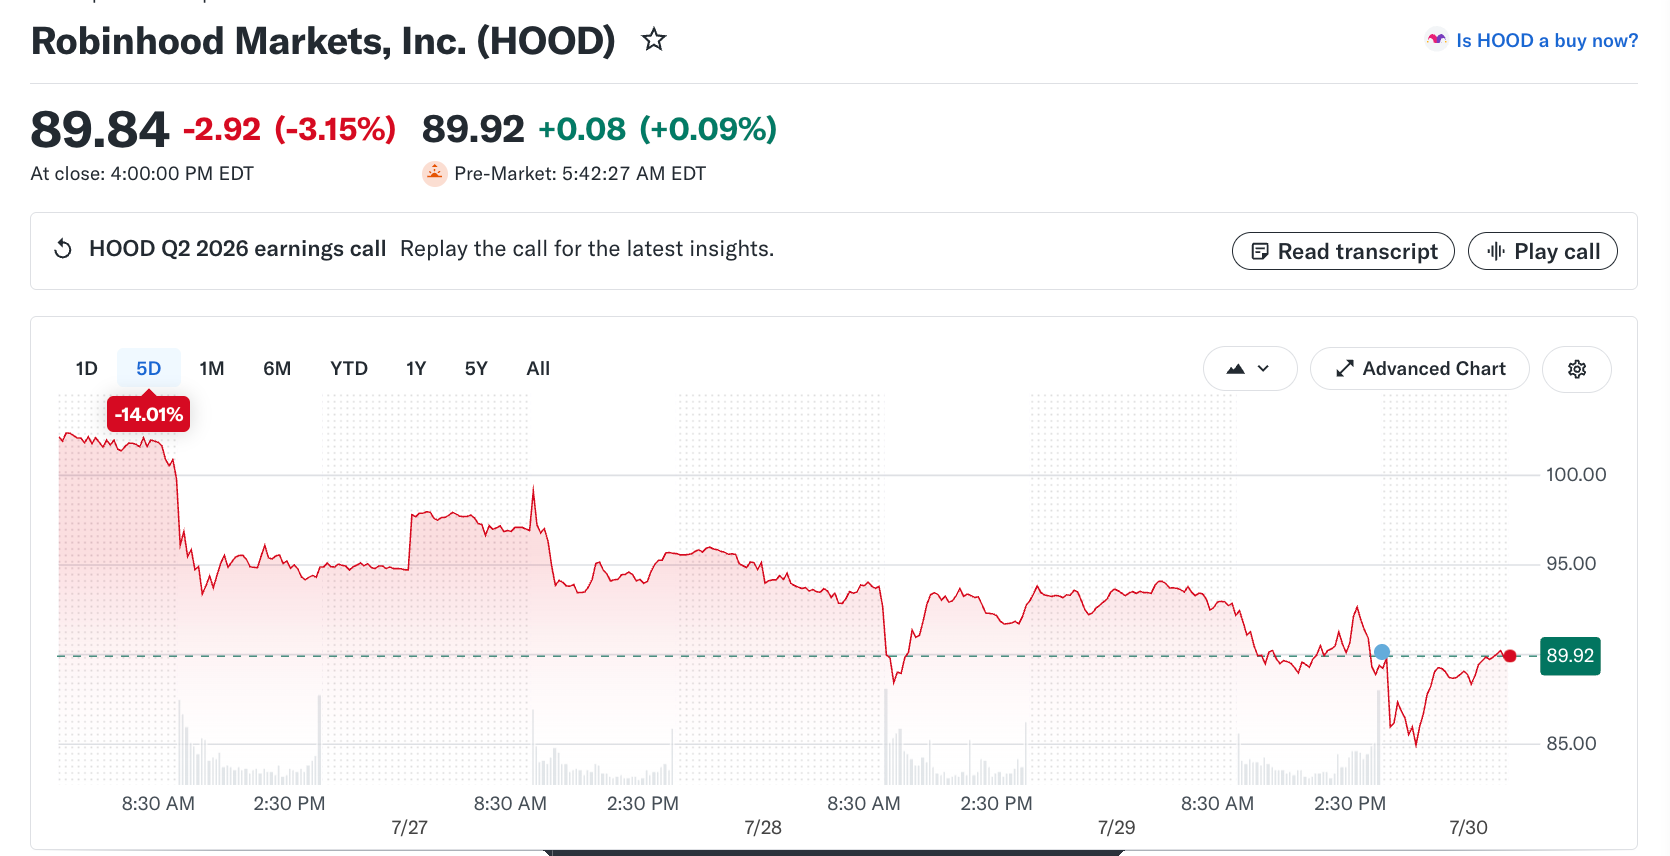
Robinhood (HOOD) stock closed at $89.84 on July 29, down 3.15%, slipping under $90 even after the company posted its best quarter ever.

The drop was not really about the numbers. HOOD has fallen about 14% in five days and roughly 20% this year, so the weakness runs deeper than one earnings report.
HOOD Earnings Beat, but the Market Sold the News
Robinhood reported record revenue of $1.31 billion, up 32% from a year earlier.
Adjusted earnings came in at $0.62 per share, far above the roughly $0.42 that analysts expected.
The mix told the real story. Prediction markets generated $156 million, overtaking both equities at $129 million and crypto at $100 million for the first time.
That shift matters because crypto revenue fell 38% year over year, after an even sharper crypto revenue slide in the prior quarter, yet total revenue still hit a record. However, the year-to-date stock price weakness persisted.

Robinhood now runs 13 businesses above $100 million in annual revenue, far from its meme-broker image. One markets account said Robinhood “proved it’s more than a crypto stock.” And that outlook is now visible in the analysts’ calls.
In the days before the report, the latest analyst calls stayed split but constructive. Barclays and Truist both reiterated buy ratings, with a Barclays Robinhood price target of $122, while JP. Morgan and Morgan Stanley kept hold ratings at $99 and $124.
Want more insights like this? Sign up for Editor Harsh Notariya’s Daily Newsletter here.
Each target still sat near or above the price, so Wall Street was not braced for a collapse. The company also kept buying back stock under a buyback plan it authorized earlier this year.

Part of the profit came from a one-time gain, which invites some caution on earnings quality. Even so, a double beat could not lift the shares.
Options Traders Are Still Hedging for Downside
Robinhood’s options market shows lingering caution. The put-call ratio, which weighs bearish put bets against bullish calls, sits near 0.66 in open interest, a high reading that favors puts.
The volume ratio has climbed toward 0.60 as well. That rise suggests desks kept adding downside hedges around the earnings date rather than betting on a pop.

Hedging shows fear, however, and not always where cash is truly flowing.
Money Flow Improves as Selling Pressure Fades
Deeper data hints the selling may be cooling. Chaikin Money Flow (CMF), a gauge of whether institutional money is buying or selling, reads -0.09 and tried to cross above zero around July 24.
It failed, so institutions are likely still net sellers. Yet, CMF rose between July 27 and July 28 while the price fell, a small bullish divergence. This shows that the big institutional money is bleeding less as compared to the price. However, the CMF needs to move above zero for the HOOD stock to show price-specific positivity.

Volume backs that up. Selling volume has thinned since early July even as the stock dropped, which suggests that even retail sellers are losing steam.
None of this confirms a bottom, though, so the HOOD price chart has to settle the argument.
Robinhood Stock Price Levels That Decide the Next Move
The chart still looks weak. Since June 9, Robinhood has traced a head and shoulders pattern, a topping shape where a high sits between two lower peaks, and it broke down on July 24, days before earnings. The breakdown structure still remains intact, which now explains why the options traders lean bearish.
The breakdown has stalled at $89.87, which also marks the 0.786 Fibonacci retracement. If that floor holds, the roughly 21% target near $76.53 may not fill, especially after a near 10% drop.

A hold above $89.87 and a reclaim of $93.84 would open room back toward the analyst targets. Real strength, however, only returns above $108.45, the right shoulder, which looks distant for now.
For now, $89.87 separates a possible rebound from a deeper slide toward $76.53.
The post Robinhood Sank After a Blowout Quarter: Rebound, or a Slide to $76? appeared first on BeInCrypto.

Telegram founder Pavel Durov said Russian authorities designated him a “terrorist” after he refused government demands for mass surveillance and censorship on the messaging platform, responding publicly a day after Russia announced charges against him.
In a Telegram post on Thursday, Durov also said Russia had barred him from “publishing information on the Internet,” adding that authorities had “got confused about who can ban whom from the Internet.”

Source: Telegram, Pavel Durov
The comments came a day after Russia’s Federal Security Service accused Durov of facilitating terrorist activity, alleging Telegram failed to remove channels used by terrorist groups and Ukrainian intelligence services.
The case builds on a criminal investigation Russia launched in February, when regulators accused Telegram of leaving nearly 155,000 channels, chats and bots online despite claims they violated Russian laws covering extremist content, terrorism, drug trafficking and other illicit activity.
Related: Pavel Durov says Telegram to roll out native Gram crypto wallet
Durov’s legal battles extend beyond Russia
The Russian case adds to Durov’s legal challenges abroad. Durov was arrested in France in August 2024 and remains under judicial investigation over allegations that Telegram facilitated criminal activity by failing to adequately moderate illegal content and respond to law enforcement requests.
Durov has denied wrongdoing, arguing that French authorities failed to follow due process in seeking information from Telegram. His arrest also prompted a TON Community-backed campaign that collected more than 9 million signatures on an open letter urging French authorities to release him.
French authorities initially allowed Durov to temporarily return to Dubai in March 2025 before lifting his travel restrictions entirely later that year.
Telegram is also facing fresh legal pressure in Australia, where regulators this week launched court proceedings alleging the platform failed to remove terrorism-related content.
Durov has cast himself as a defender of free speech and digital privacy. In April, he warned the European Union’s proposed age-verification app could pave the way for broader online surveillance. The same month, he blamed alleged tax data leaks for a wave of crypto-related kidnappings in France and said Telegram would leave the country rather than grant authorities access to users’ private messages.
Magazine: A quantum roadmap would push Bitcoin much higher: Charles Edwards
Tokenized asset specialist Ondo Finance is evaluating a potential acquisition of between $250 million and $500 million, according to a person with knowledge of the matter.
The New York-based company is considering wealthtech targets, among other subsectors, said the person, who spoke on condition of anonymity because the matter is private.
Ondo has not yet appointed any formal advisers, the person said.
Founded in 2021 by former Goldman Sachs executives, Ondo Finance is a tokenization platform that brings traditional financial assets onchain. The company issues tokenized U.S. Treasuries and stocks and has become one of the largest providers of tokenized real-world assets, with more than $3.5 billion across its products.
“As a fast-growing company, Ondo regularly evaluates the market as part of normal business operations. We are not in conversations with any party at this time,” an Ondo representative said in emailed comments to CoinDesk.
Crypto dealmaking has remained strong in 2026 as traditional financial firms and larger digital-asset companies use acquisitions to add licenses, technology and distribution.


FTX begins its fifth creditor distribution on Friday, moving roughly $900 million to holders of allowed claims. The round is the smallest of the five the estate has paid since repayments began.
The shrinking size points to a bankruptcy in its closing phase. The harder problem now is not raising cash but reaching creditors who have never collected.
FTX Fifth Distribution Is the Smallest of Five Rounds
FTX moved more than $5 billion in its second distribution in May 2025, then about $1.6 billion that September. The fourth creditor distribution round came to roughly $2.2 billion in March 2026.
Friday’s payment is under half that. Allowed Class 5A Dotcom customer claims pick up another 9%, reaching 105% cumulatively, while Class 5B U.S. customer claims add 5% to reach the same level. General unsecured and digital asset loan claims each gain 3%, taking both to 103%.
Convenience class holders sit at a 120% cumulative recovery, though FTX cautioned that final percentages may shift slightly on rounding. Those figures count dollars, not coins, and the real value of repayments has trailed what the same assets would fetch today.
A separate $18 million payment goes to preferred equity holders on the same date, lifting that trust’s running total to $95 million.
Some Creditors Still Cannot Be Paid
Claims that are not yet allowed stay marked as disputed. FTX lists three common reasons, including:
- Proofs of claim still under reconciliation
- Jurisdictions still under review, and
- Customers who took partial payments through the Australian proceedings.
The Bahamas track runs on its own terms. Joint official liquidators of FTX Digital Markets set the same June 16 record date and July 31 start, but the distribution rate is still to be confirmed.
Creditors living in jurisdictions the liquidators flag as potentially restricted stay excluded while the legality of paying them is reviewed.
For everyone else, Friday starts a countdown. Holders of allowed claims who have not onboarded with BitGo, Kraken or Payoneer within six months may forfeit the right to be paid at all.
Tax forms carry a separate deadline under the plan with the same consequence. FTX said the class-by-class totals will reach the court docket shortly after July 31.
The post FTX Fifth Distribution Is Its Smallest Yet: Who Still Cannot Get Paid? appeared first on BeInCrypto.


Canadians’ ownership of cryptocurrencies increased to 25% in 2026 from 10% in 2023, new data from the Ontario Securities Commission (OSC) shows.
In the results of a survey released on Tuesday, the OSC found that crypto ownership and awareness among Canadians had increased from that a few years ago. The survey polled 2,360 individuals age 18 and over between December 2025 and January 2026, finding that 59% of the respondents were aware of crypto assets and 25% held them.
“Crypto markets continue to evolve, and Canadians are participating in them more than ever before,” said Naizam Kanji, executive vice president of strategic regulation at the OSC. “By identifying emerging trends and behaviors with our research, we can look around corners, anticipate potential opportunities and risks, and ensure our regulatory approach supports investor protection while fostering fair and efficient markets.”
According to the survey, the results also suggested an increasing awareness of risk, though it was still based on a limited understanding of the industry. About 50% of crypto owners reported checking whether a platform was registered before using it, but many investors “had some misunderstanding around regulation, insurance protections and transaction capabilities.”
Lawmakers in Ottawa have proposed various measures to address different uses of cryptocurrency in the country. In April, the federal government advanced a bill that could ban political donations using crypto, and proposed banning digital asset ATMs, citing concerns about fraud.

Award-winning breastfeeding festival marking 10th anniversary with Belfast celebration

Chipotle CEO says chain making ‘meaningful progress’ on affordability

books $8.2 billion in Q2 loss amid bitcoin (BTC) price decline

Renter of Home in Anne Heche Crash Denies Settlement With Son

No Jackpot Winner as $257 Million Prize Rolls Over to $269 Million Monday Draw

Weekend Open Thread: Staud – Corporette.com

FASE Keuangan 20an ke 40an Yang Jarang Orang Bahas! | SUARA BERKELAS #86

CRYPTO CLARITY ACT DEAD?! ALL XRP HOLDERS! ALL CRYPTO HOLDERS! BREAKING CRYPTO NEWS!

TIPS FINANCIAL FREEDOM #moneymanagement #financialfreedom #keuangan #samasamabelajar
-

 Fashion6 days ago
Weekend Open Thread: Brooks Brothers
-
 Sports4 days ago
Commonwealth Games boxing: Jadumani Singh seals dominant 5-0 win over Pakistan’s Sumama Rehman to enter quarter-finals | Commonwealth Games News
-

 Business1 day ago
Why Trees Belong on the Risk Register
-

 Tech4 days ago
Intel is reversing course and bringing hyper-threading back to its server chips
-

 Crypto World5 days ago
Ripple bought a bank in pieces. The $4 billion audit
-

 Politics3 days ago
Luke Littler dismantles Gerwyn Price to retain title in Blackpool
-
 Entertainment6 days ago
A New Post-Apocalyptic Gundam Anime Series Blasts Into SDCC
-

 Politics2 days ago
The Part of the Electric Transition Nobody Wants to Discuss
-

 News Videos4 days ago
BITCOIN JUST ENTERED THIS CRITICAL ZONE…
-

 Fashion7 days ago
16 Dresses for the High Summer Event
-

 Sports7 days ago
2026 3M Open leaderboard: Scottie Scheffler finds putter in Round 1, sits three back
-

 Business2 days ago
Major shareholder moves on Canyon
-

 Crypto World5 days ago
XRP Ledger adds $2.6B as RWA inflows rank second
-

 News Videos9 hours ago
Bitcoin Enters the 3rd Stage of the Bear Market
-

 Politics4 days ago
Spain sweeps the board at 2026 World Cup with individual awards
-
 Entertainment2 days ago
‘Stargate’ Creator’s New Sci-Fi Series Returns for Season 3 Tomorrow
-

 Tech6 days ago
Anthropic launches Claude Opus 5, a cheaper AI model for coding, agents and enterprise workflows
-

 Crypto World2 days ago
Kraken Enables Retail Access to Jersey Mike’s IPO via Tokenized Shares
-

 Entertainment5 days ago
Sara Gilson Killed By Husband After Viral “Pedophile” TikTok Video
-

 News Videos2 days ago
Claude: Build Financial Dashboards in Minutes (2026)
You must be logged in to post a comment Login