
Crypto World
The $1,668 line for 2026
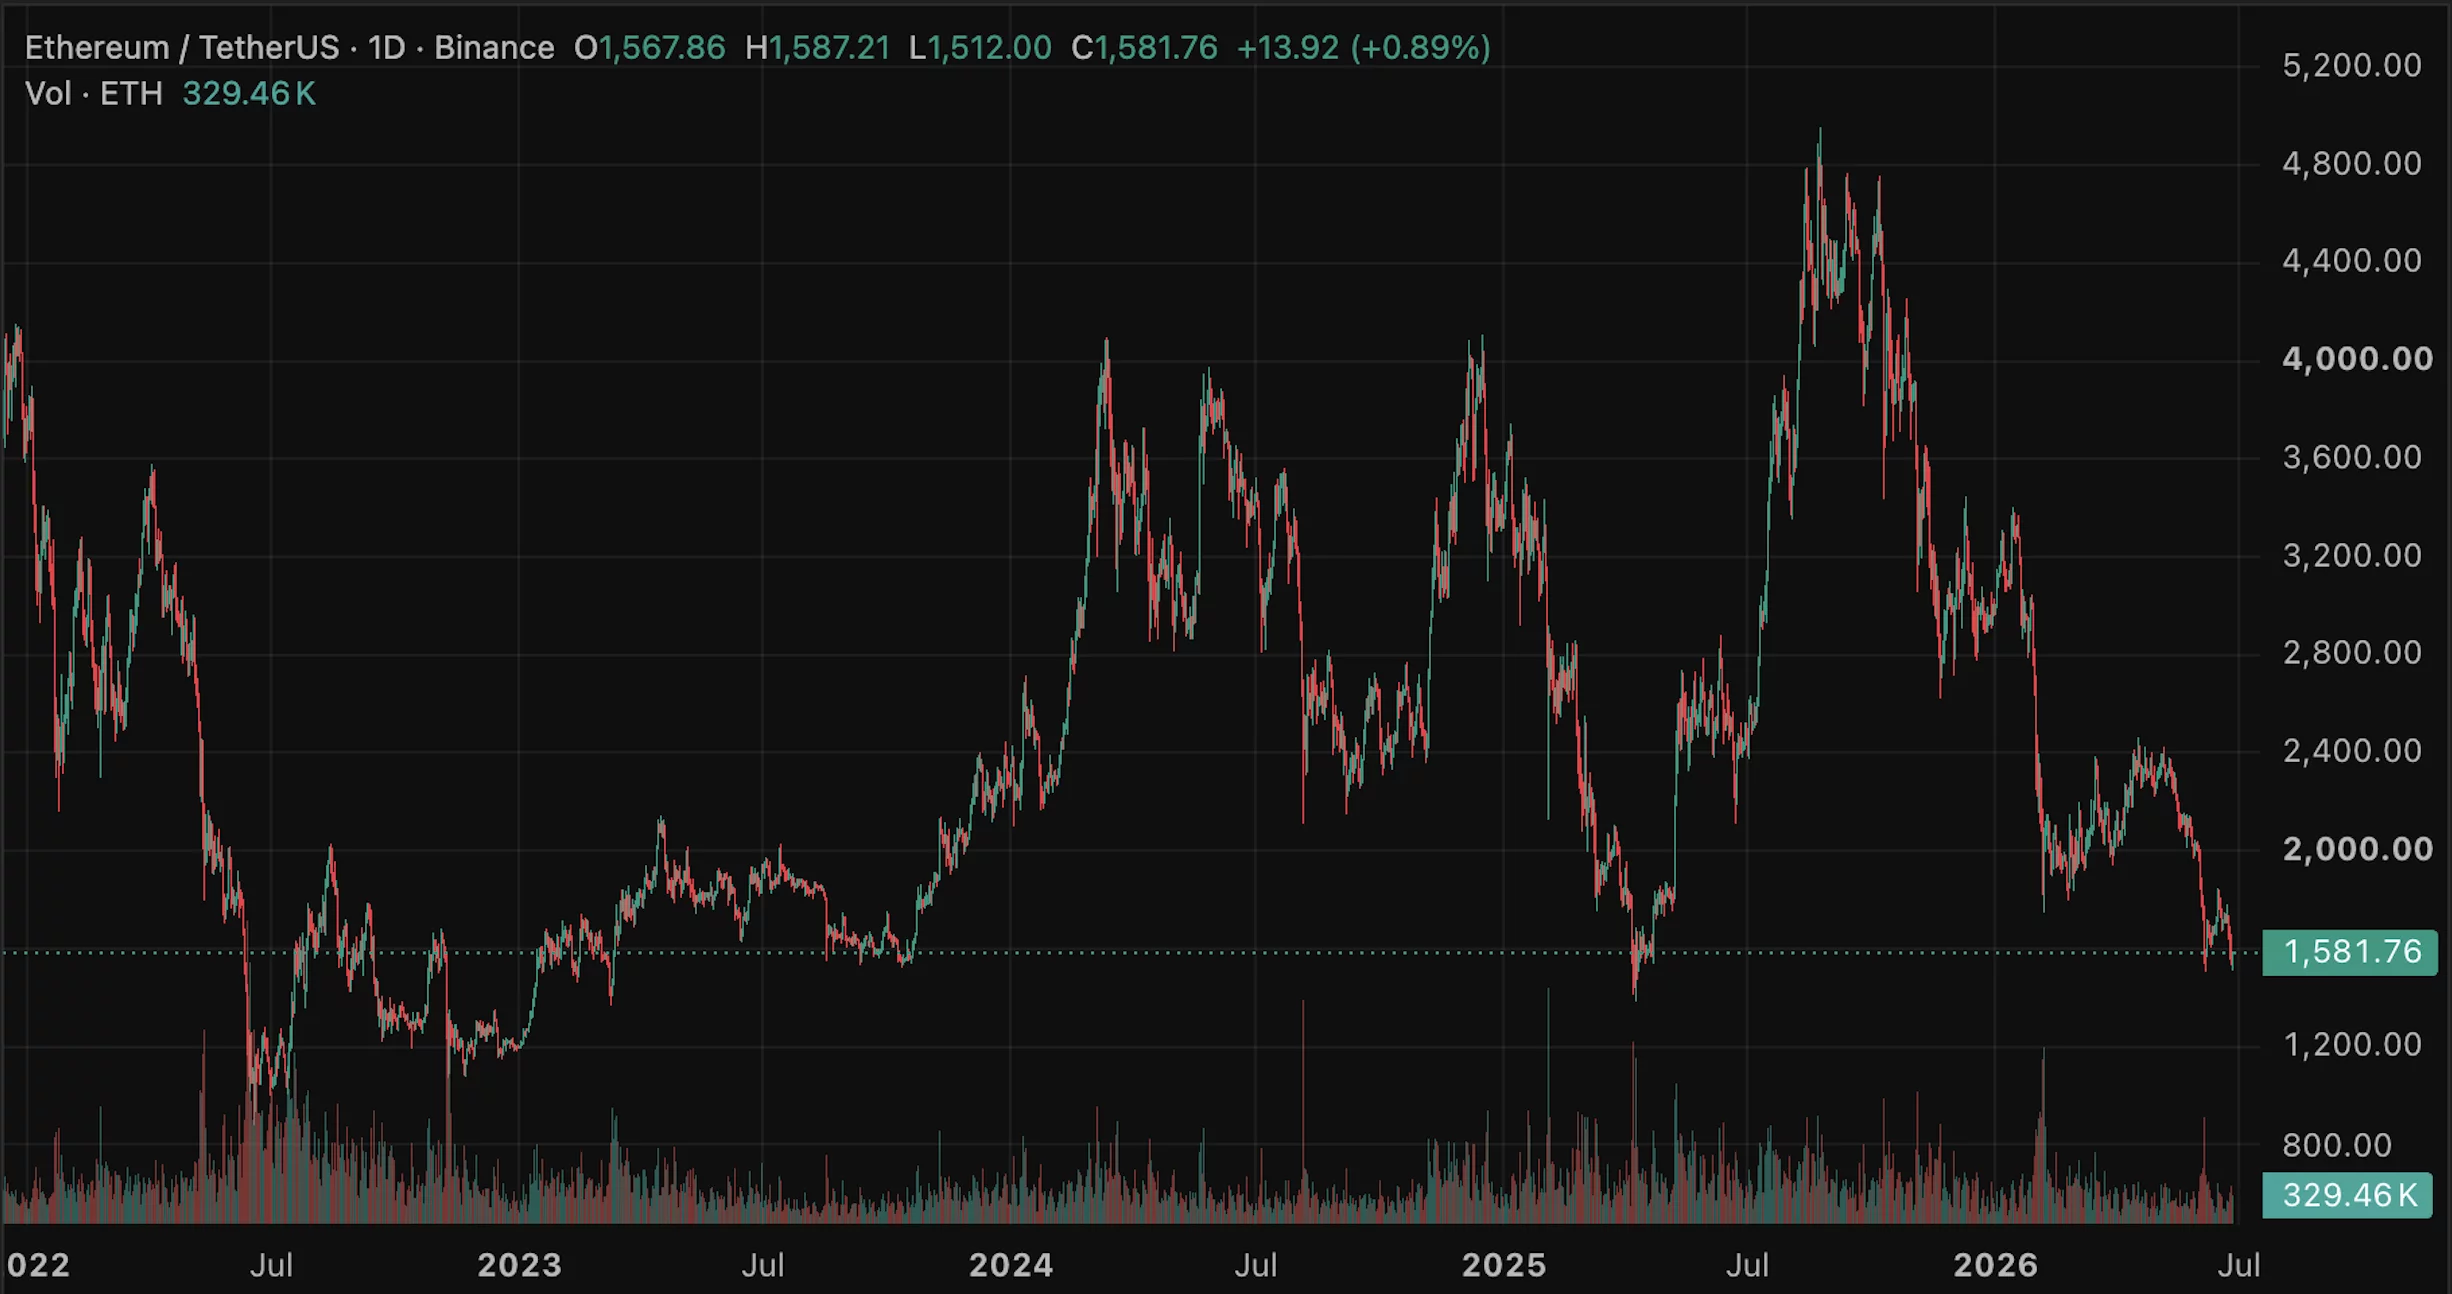
Ethereum trades around its 200-day moving average near $1,668, the line that has separated its bull markets from its bear markets for years. Above it lies a path back toward $3,000. Below it lies an accumulation zone, the charts put as low as $600. The strangest part is that Ethereum’s fundamentals have never been stronger.
Summary
- Ethereum trades around $1,650, hovering at its 200-day moving average near $1,668, a level that has historically divided its bull markets from its bear markets.
- The price is roughly 55-65% below its $4,953 August 2025 all-time high, in a year-long downtrend, even as Ethereum’s fundamentals reach record highs.
- About 35.8 million ETH, near 30% of supply, is staked, spot ETFs have drawn around $11.6 billion in cumulative inflows, and corporate treasuries hold over 6.2 million ETH, yet none of it has lifted the price.
- The $1,668 line is the pivot: holding above it keeps a recovery toward $2,300 to $3,000 alive, while losing the $1,580 to $1,600 floor opens a path toward a deep $1,039 to $603 accumulation zone.
- The catalyst that could flip the line is the Glamsterdam upgrade and a reversal in ETF and treasury flows, but until the macro tide turns, the strongest fundamentals in Ethereum’s history have not been enough.
Ethereum is trading around $1,650, which places it almost exactly on the one line that, more than any other, has historically decided whether it is in a bull market or a bear market: its 200-day moving average, currently near $1,668.
For years, this long-term trend line has acted as the dividing line for Ethereum, with sustained periods above it coinciding with recoveries and rallies, and breaks below it preceding extended downtrends.
Right now, Ethereum sits on the knife’s edge of that line, and the direction it breaks will go a long way toward determining its path through the rest of 2026. What makes the moment genuinely strange, and what separates this prediction from a simple chart reading, is the backdrop against which the line is being tested.
Ethereum’s price is down roughly 55-65% from its all-time high near $4,950 set in August 2025, and it has spent the better part of a year grinding lower, yet by almost every fundamental measure, the network has never been in better shape.
More ether is staked than ever, more institutional money has flowed into Ethereum products than ever, and corporate treasuries are accumulating it at a scale that did not exist a year ago. The result is one of the sharpest contrasts in the market: the strongest fundamentals in Ethereum’s history paired with some of its weakest price action since 2022.
This piece is organized around that contrast and around the line that sits at its center. The reason to build an Ethereum prediction this way, rather than as a list of targets, is that Ethereum’s situation is fundamentally a question about whether fundamentals will eventually matter, and the 200-day moving average is where that question gets answered in real time.
If Ethereum holds the line and reclaims the levels above it, the case that its record fundamentals will reassert themselves gains force, and a path back toward $3,000 opens. If it loses the floor beneath the line, the chart points toward a deep accumulation zone far below, and the fundamentals will have failed, for now, to matter.
What follows traces how Ethereum reached this point, why the $1,668 line carries so much weight, the genuinely record-setting fundamentals on one side of the ledger, the bearish forces that have overwhelmed them on the other, the catalysts that could tip the balance, and concrete bull, base, and bear scenarios tied to the line itself.
One line, two futures
Begin with why a single moving average deserves to anchor an entire prediction, because for Ethereum, the 200-day moving average has earned its significance. A moving average is simply the average price over a trailing period, in this case 200 days, and it smooths out short-term noise to reveal the underlying trend.
For Ethereum, the 200-day line has historically functioned as the boundary between bull and bear regimes: when the price trades and holds above it, Ethereum has tended to be in recovery or rally mode, and when it breaks decisively below it, extended downtrends have usually followed. That history is why traders treat this level with such respect, and why Ethereum, sitting right on it, near $1,668, is such a charged situation. The price is balanced precisely at the line that separates its two possible futures.
The levels around the line sharpen the stakes. Immediately below the current price, the $1,600-$1,650 area has held as the floor for 2026, the zone buyers have repeatedly defended, and a brief dip toward $1,580 during the June selloff was bought back. Above, the first resistance sits in the $1,700-$1,800 range, with a more significant barrier near $2,000 and the major structural hurdle at $3,000, where Ethereum would reclaim its long-term trend.
The asymmetry that worries bears is what lies beneath the floor. Technical analysts who map the downside warn that a decisive break below the $1,580 area and the broader monthly support could open a much deeper decline toward an accumulation zone they place between roughly $1,600, a drop of another 30-60% from current levels.

So the line is not merely a number; it is the hinge between a recovery path toward $3,000 and an abyss toward $600, which is what makes holding or losing it the central question for Ethereum in 2026.
How ETH got here
To understand why Ethereum is testing this line at all, you have to trace the decline from its peak, because the fall has been long and grinding rather than a single crash. Ethereum reached its all-time high near $4,950 in August 2025, lifted by enthusiasm around its newly launched exchange-traded funds and growing staking participation.
From that peak, the descent was relentless, with Ethereum closing out a long streak of red months, its worst such run in years, and sliding through the second half of 2025 and into 2026.
By early 2026, it had fallen below $3,000, and the weakness continued through the spring, with the price working steadily lower in a descending channel of lower highs and lower lows that defined the year.
The June selloff that brought Ethereum to its current levels near $1,600 was the latest leg of this extended downtrend, not a sudden break from an otherwise healthy trend.
The causes were a convergence of pressures rather than any single shock. Broader risk-off sentiment across crypto, driven by macroeconomic uncertainty and concerns about the path of interest rates, weighed on Ethereum as a high-risk asset. Persistent outflows from spot Ethereum exchange-traded funds removed a key source of demand and, during the worst stretches, became active selling pressure.
Selling attributed to Ethereum’s own co-founder added to the bearish narrative. And Ethereum’s tendency to amplify Bitcoin’s moves meant that as Bitcoin slid toward $60,000, Ethereum fell harder, because it typically rises faster in bull conditions and declines more sharply in risk-off periods.
The cumulative effect was a year-long erosion that has left Ethereum testing the line that separates recovery from a deeper bear market, with the price having given back the majority of its gains from the prior cycle. That is the chart context. The fundamental context, remarkably, points the other way.
Why $1,668 matters so much
It is worth dwelling on the significance of the line itself, because the entire technical case for Ethereum hinges on it, and the reasoning is not arbitrary. The 200-day moving average works as a regime indicator precisely because it filters out short-term volatility and captures the medium-to-long-term trend, which is why both technical traders and the algorithms that drive a large share of market activity pay close attention to it.
For Ethereum specifically, the historical record shows that this line has repeatedly marked the transition between bull and bear phases, so a sustained position above it tends to attract trend-following buyers and signal strength, while a decisive break below it tends to trigger trend-following selling and signal weakness. The line becomes partly self-fulfilling because so many participants treat it as meaningful that their collective behavior reinforces its importance.
Right now, the line is doing something subtle and worrying beneath the surface: even as the price hovers around it, the 200-day average itself has begun to slope downward, which technicians read as a sign of underlying long-term weakness instead of strength. A price clinging to a falling long-term average is in a more precarious position than one riding a rising average, because the trend line that is supposed to provide support is itself drifting lower.
This is why the current test is so consequential. If Ethereum can hold above the line, stabilize, and push back through the resistance levels above it, the long-term average can flatten and turn up, flipping the regime back toward recovery. If it loses the line and the floor beneath it, the falling average becomes overhead resistance, and the path of least resistance points toward the deep accumulation zone the bears identify.
The $1,668 line, in other words, is not just where the price happens to be; it is the level at which Ethereum’s medium-term fate is being decided.
The strongest fundamentals in Ethereum’s history
Here is the contrast that makes Ethereum’s situation so unusual, and it deserves to be laid out fully, because on fundamentals, the network is arguably in the best shape it has ever been.
Start with staking, the mechanism by which holders lock up ether to help secure the network and earn a yield. As of early 2026, roughly 35.8 million ether, close to 30% of the entire circulating supply, is staked, secured by around one point one million validators, with a staking yield in the range of 2.8-3.5% annually.
That staked proportion has nearly tripled since early 2023, when about 11% of supply was staked, reflecting steadily growing confidence and the popularity of liquid staking and restaking. A large and rising share of supply locked in staking reduces the ether available to sell on the open market, a structurally supportive dynamic.
The institutional picture is equally striking. Spot Ethereum exchange-traded funds have attracted roughly 11.6 billion dollars in cumulative net inflows since launching, with the largest single product holding well over $6 billion in assets, giving traditional investors regulated access to ether and, through the staking yield increasingly available, a competitive income component.
Beyond the funds, corporate treasuries have embraced ether as a reserve asset at a scale that did not exist a year earlier, collectively holding over 6.2 million ether, up from under 1 million in mid-2025, led by a treasury company that alone holds several million ether, a meaningful slice of the total supply.
Layered on top is an accelerating upgrade cadence, with major protocol improvements deployed in 2025 and a twice-yearly schedule of further upgrades designed to scale the network.
By every one of these measures, more staked, more institutional capital, more corporate adoption, more frequent upgrades, Ethereum’s fundamentals are at or near record strength. And none of it has stopped the price from falling, which is the puzzle the rest of the prediction has to confront.
The bear case: why the fundamentals have not mattered
The hard truth for Ethereum bulls is that strong fundamentals have, so far, been no match for the forces pushing the price down, and understanding why is essential to any honest prediction.
The first and most powerful force is the macro environment and Ethereum’s nature as a high-beta risk asset. Ethereum tends to amplify the broader market’s moves, so in a period of risk aversion, tightening financial conditions, and a sliding Bitcoin, Ethereum falls harder regardless of how strong its network fundamentals are, because the selling is driven by macro flows that do not care about staking ratios or upgrade schedules. When capital is fleeing risk, the quality of Ethereum’s fundamentals offers little protection.
The second force is the reversal of the very institutional demand that forms part of the bull case. The exchange-traded funds that brought billions into Ethereum have, during the downturn, seen persistent outflows, turning a source of demand into a source of selling and showing that institutional money can flee as readily as it arrived.
The third is a structural tension within Ethereum’s own design: the growth of layer-two networks, which handle transactions more cheaply by settling on Ethereum, expands the ecosystem’s usage but also reduces the fee pressure on the main chain, complicating the link between network activity and ether’s value.
The fourth is competition from other blockchains vying for the same developers, users, and capital, which caps the premium the market is willing to pay.
And the fifth is simply sentiment and narrative: with the price in a year-long downtrend and a co-founder seen selling, the story around Ethereum has soured, and narrative drives crypto prices more than fundamentals over any given stretch.
The bears’ summary is blunt: the ether trade may be structurally broken, with the token failing to capture the value its thriving network creates, and until the macro tide turns, the record fundamentals are a reason to watch instead of a reason the price must rise.
The catalysts that could flip the line
For the fundamentals to start mattering, something has to change the flow of money and the narrative, and several potential catalysts could do exactly that, which is where the bull case regains its footing.
The most specific is the network’s continued upgrade path. A major scaling upgrade expected in the first half of 2026, followed by another in the second half, is designed to deliver measurable improvements to the main chain, and a successful, well-received upgrade could refresh the narrative around Ethereum, reminding the market of the network’s technical leadership and giving institutional and retail buyers a concrete reason to re-engage.
Upgrades have historically been catalysts for Ethereum when they land well, and the twice-yearly cadence means there are regular opportunities for a positive surprise.
The second catalyst is a reversal in the institutional flows. The exchange-traded fund outflows have been a primary drag, so a durable shift back to sustained inflows, perhaps helped by the staking yield making the funds more competitive against fixed-income products, would remove that selling pressure and could turn the funds back into the demand engine the bull case envisions.
The continued accumulation by corporate treasuries is a related signal; if treasuries keep buying through the weakness and the whale wallets that have been adding to positions during the dip prove to be the leading edge of renewed institutional conviction, the resulting supply squeeze, with so much ether staked and locked, could lift the price sharply once demand returns.
The third catalyst is macro: a shift toward easier monetary policy or a broader return of risk appetite would lift high-beta assets like Ethereum, and given how much it has fallen, the rebound could be substantial. The honest framing is that Ethereum has loaded the spring, with record fundamentals and locked supply, and the catalysts above are what could release it, but each depends on forces, especially the macro backdrop, that are not yet in place.
The bull, base, and bear cases for 2026
Tying the scenarios to the line and the catalysts makes them concrete. These are conditional ranges, not predictions, and each hinges on whether Ethereum holds its pivotal level and whether the catalysts arrive.
- Bull case: Ethereum holds the $1,668 line, a well-received scaling upgrade refreshes the narrative, exchange-traded fund flows reverse back to sustained inflows, and a friendlier macro backdrop returns risk appetite. The locked supply from record staking amplifies the move as demand returns, and Ethereum recovers through resistance toward the $2,300-$3,000 zone, with the most bullish institutional targets pointing well above that over a longer horizon as the fundamentals finally reassert themselves
- Base case: Ethereum chops around the line for an extended period, holding the $1,580-$1,700 range as treasury accumulation offsets continued fund outflows, with the strong fundamentals preventing a collapse but the weak macro preventing a breakout. In this scenario, Ethereum grinds sideways near current levels, waiting for a catalyst, with direction deferred to the second half of the year.
- Bear case: Ethereum loses the $1,668 line and the $1,580 floor decisively, fund outflows continue, Bitcoin drags the market lower, and the falling long-term average becomes overhead resistance. The chart’s deep accumulation zone comes into play, and Ethereum declines toward the $1,000-$1,600 region the bears identify, with the record fundamentals failing, for this cycle, to matter against the macro tide.
What to watch
For anyone tracking whether Ethereum’s fundamentals will finally translate into price, the analysis points to a focused watchlist, and the first item is the line itself. Whether Ethereum holds the $1,668 200-day moving average and the $1,580 floor beneath it, or loses them decisively, is the single clearest signal of which scenario is unfolding, because that level marks the boundary between the recovery path and the deep-accumulation path.
A sustained reclaim of the resistance above the line would be powerfully bullish; a decisive break of the floor would be powerfully bearish. Everything else feeds into that binary.
The second item is the flow data. The exchange-traded fund outflows have been the primary drag, so a durable reversal to net inflows would be among the strongest possible signals that institutional demand is returning, while continued outflows would confirm the bearish reading. The behavior of corporate treasuries and large accumulating wallets matters alongside the funds; sustained buying through weakness supports the bull case, and any sign of treasuries slowing or selling would be a serious warning given how much of the supply-squeeze thesis rests on them.
The third item is the upgrade path and its reception, since a well-received scaling upgrade is the most concrete near-term catalyst that could refresh the narrative. And the fourth, as always, is the macro environment, because Ethereum’s high-beta nature means a shift in monetary policy or risk appetite would move it more than almost any network development.
The honest synthesis is that Ethereum is a coiled spring of record fundamentals and locked supply held down by a hostile macro tape, and the 200-day line is where the contest between the two is being decided.
Watch the line, watch the flows, and resist the temptation to assume that strong fundamentals must win quickly, because Ethereum’s entire recent history is a reminder that they have not.
Frequently Asked Questions
Why is the $1,668 level so important for Ethereum?
Because it is Ethereum’s 200-day moving average, a long-term trend line that has historically divided its bull markets from its bear markets. When Ethereum trades and holds above it, the network has tended to be in recovery or rally mode; when it breaks decisively below, extended downtrends have usually followed. Many traders and automated strategies treat the line as a regime indicator, which makes it partly self-fulfilling. With Ethereum sitting right on the line, the direction it breaks will signal whether a recovery toward $3,000 or a deeper decline toward the chart’s accumulation zone is more likely.
Why is Ethereum’s price falling when its fundamentals are so strong?
Because macro forces and Ethereum’s nature as a high-risk asset have overwhelmed the fundamentals. Ethereum amplifies the broader market’s moves, so in a period of risk aversion, tightening conditions, and a sliding Bitcoin, it falls hard regardless of staking ratios or upgrades. The exchange-traded funds that had bought billions in inflows have seen persistent outflows, turning demand into selling. Layer-two growth complicates the link between network usage and ether’s value, competition caps the premium, and a soured narrative drives sentiment. Over any given stretch, flows and narrative move crypto prices more than fundamentals, which is why record fundamentals have not lifted the price.
How strong are Ethereum’s fundamentals right now?
By most measures, the strongest in its history. Roughly thirty-five point eight million ether, near 30% of the supply, is staked, nearly triple the proportion of early 2023, which locks up supply. Spot exchange-traded funds have drawn around $11.6 billion in cumulative inflows, with the largest product holding over $6 billion. Corporate treasuries hold over 6.2 million ether, up from under 1 million in mid-2025. And the network is on an accelerating upgrade schedule. The contrast between these record fundamentals and the weak price is precisely what makes Ethereum’s current situation so unusual.
How low could Ethereum go?
If it loses the $1,668 line and the $1,580 floor decisively, technical analysts who map the downside identify a deep accumulation zone between roughly $1,600, which would be another 30-60% below current levels. This is the bear scenario, not a forecast, and it depends on continued fund outflows, a falling long-term average turning into resistance, and Bitcoin dragging the market lower. The bull scenario, in which Ethereum holds the line and recovers toward $3,000, is equally coherent. Which path unfolds depends on the line, the flows, the upgrades, and the macro environment.
What could turn Ethereum’s price around?
Several catalysts could flip the trend. A well-received scaling upgrade could refresh the narrative and give buyers a concrete reason to re-engage. A durable reversal of exchange-traded fund outflows back to sustained inflows would remove the primary drag and restore demand. Continued accumulation by corporate treasuries and large wallets, combined with the locked supply from record staking, could create a supply squeeze that lifts the price sharply once demand returns. And a shift toward easier monetary policy or renewed risk appetite would lift high-beta Ethereum substantially. Each depends on forces, especially the macro backdrop, that are not yet fully in place.
Is the “ETH trade” broken?
That is the bears’ core argument: that Ether, the token, is failing to capture the value its thriving network creates, because layer-two growth reduces main-chain fee pressure, institutional flows have reversed, and the price has fallen for a year despite record fundamentals. The bull rebuttal is that the fundamentals have built a coiled spring of locked supply and structural demand that will release once the macro tide turns and a catalyst arrives, and that the current weakness is macro-driven instead of a permanent break. The honest position is that the question is unresolved, and the 200-day line is where the market is deciding it.
This article is information, not investment advice. The scenarios described are conditional ranges that depend on unresolved questions, not predictions, and Ethereum is highly volatile. Prices, flows, staking figures, and fundamentals reflect reporting available as of June 26, 2026, and can change quickly. Nothing here is a recommendation to buy or sell. Verify current data from primary sources and consider your own circumstances before making any decision


The United States has sanctioned Iranian exchanges, frozen nearly $1 billion in cryptocurrency, and traced $3.84 billion in Iran-linked flows through a single offshore exchange, exposing the scale of sanctions evasion through digital assets.
Summary
- The US Treasury has sanctioned four Iranian cryptocurrency exchanges, including Nobitex, which handles approximately 50% of Iran’s crypto trading volume, as part of Operation Economic Fury launched in April 2026.
- Treasury has seized or frozen nearly $1 billion in cryptocurrency from Iranian exchanges and wallets since the US-Israeli strikes on Tehran in February, including a $344 million USDT freeze in April and a $131 million freeze in July.
- The Wall Street Journal reported that Iran-linked entities moved more than $3.84 billion through crypto exchange CoinEx since 2019, with investigators tracing flows from Central Bank of Iran wallets that connected to the North Korean Bybit hack.
- Chainalysis estimated that Iranian crypto outflows reached $4.18 billion in 2025, a 70% year over year increase, as the rial collapsed and citizens sought alternatives to the sanctioned banking system.
- The enforcement campaign reveals both the capabilities and limitations of crypto sanctions: centralized stablecoins like USDT can be frozen by issuers, but decentralized protocols and cross chain transactions continue to provide routes for moving value beyond government control.
The numbers tell the story before the analysis begins. Nearly $1 billion in Iranian cryptocurrency seized by the US Treasury. More than $3.84 billion in Iran-linked flows traced through a single offshore exchange. Iranian crypto outflows of $4.18 billion in a single year. Four domestic Iranian exchanges sanctioned. Executives added to the OFAC list. Central Bank of Iran wallets frozen on the Tron network.
These figures, accumulated over the first half of 2026, describe the largest and most technically sophisticated sanctions enforcement campaign ever conducted through blockchain infrastructure. The US government is not merely identifying Iranian crypto activity. It is actively seizing, freezing, and blocking it at multiple points in the financial chain. The question is whether the campaign is working or whether it is simply documenting the scale of a problem it cannot contain.
The answer is probably both. The United States has developed meaningful new tools for sanctions enforcement on public blockchains, and it is deploying them at unprecedented scale. At the same time, the gap between what investigators can see and what they can stop is wide and growing. Iranian crypto activity grew 70% year over year in 2025 even as US surveillance capabilities expanded. Every enforcement action generates a public record of Iranian evasion methods, which Iranian operators then adapt against. The cat-and-mouse dynamic is running faster than the enforcement side can respond.
Operation Economic Fury
The enforcement campaign has a name: Economic Fury. Treasury Secretary Scott Bessent introduced it on April 14, 2026, as the financial arm of the US response to the military conflict that began with joint US and Israeli strikes on Tehran in February. The campaign targets Iran’s use of cryptocurrency exchanges, wallets, and traditional financial networks that officials accuse of supporting sanctions evasion and military financing.
The campaign followed months of intelligence gathering that began before the military strikes. Treasury officials had been tracking Iranian crypto networks since at least 2024, when Chainalysis and TRM Labs began publishing research on the scale of Iranian stablecoin adoption. The strikes accelerated the timeline from monitoring to action.
The first major crypto action came in April, when Tether froze approximately $344 million in USDT across two Tron wallets after US authorities linked the addresses to Iranian networks. One wallet held about $213 million; the other contained roughly $131 million. Blockchain analysis found transaction patterns associated with wallets linked to Iran’s Islamic Revolutionary Guard Corps and intermediaries connected to the Central Bank of Iran.
In June, Treasury escalated by sanctioning four Iranian cryptocurrency exchanges: Nobitex, Wallex, Bitpin, and Ramzinex. Nobitex, the largest, handles approximately 50% of Iran’s cryptocurrency trading volume according to Chainalysis and claims to serve 11 million users. Treasury also added Nobitex CEO Seyed Ali Khoee and chairman Amir Hossein Rad to the OFAC sanctions list, making them personally subject to asset freezes and travel restrictions.
In July, Treasury froze an additional $131 million in USDT held in four Tron wallets tied to the Central Bank of Iran. Bessent said on X that Treasury remained “committed to disrupting and degrading Iran’s illicit financial activities, including its abuse of digital assets.”
By late July, Bessent disclosed that the cumulative total of cryptocurrency seized or frozen from Iranian sources since the conflict began had approached $1 billion. The figure, while significant, represents assets identified by investigators and does not include Iranian-linked cryptocurrency that moved through compliant exchanges and was not captured in enforcement actions.
The CoinEx connection
While Treasury focused on domestic Iranian exchanges, a parallel investigation exposed the offshore dimension of Iran’s crypto network. On June 24, the Wall Street Journal reported that Iran-linked entities had moved more than $3.84 billion through crypto exchange CoinEx since 2019.
The investigation, citing TRM Labs and public on-chain data, found that CoinEx had become one of the primary routes for moving funds outside US sanctions. More alarmingly, investigators traced activity from two wallets controlled by the Central Bank of Iran and found links to assets stolen from Bybit by North Korean hackers in what was one of the largest thefts in crypto history, involving approximately $1.5 billion in virtual assets.
CoinEx denied any knowledge of Iran-linked activity. The exchange said that on-chain fund flows through a platform do not prove knowledge, support, or participation. It also said it had strengthened Iran-related risk reviews, geo-fencing, sanctions screening, and transaction monitoring. CoinEx has not been subject to new US sanctions as of this writing, but the WSJ report placed it under heightened regulatory scrutiny.
The $3.84 billion figure is notable not just for its size but for its duration. The flows spanned seven years, from 2019 through 2026, covering periods when international attention to Iranian crypto activity was already high. The Financial Action Task Force had placed Iran on its blacklist for most of that period. The fact that billions in Iranian linked flows continued through a single exchange for seven years without triggering enforcement action until journalists reported it raises questions about the gap between blockchain transparency and operational enforcement.
TRM Labs data cited in the WSJ report also showed that CoinEx was not the only offshore exchange processing Iranian flows. Several smaller platforms with limited compliance infrastructure handled significant volumes. The concentration at CoinEx reflects the exchange’s combination of low fees, minimal identity verification requirements during the relevant period, and availability in jurisdictions where Iranian users could access the platform without VPN restrictions.
The CoinEx case illustrates a fundamental challenge in crypto sanctions enforcement. Centralized exchanges operate as choke points where authorities can intervene, but only if the exchange cooperates or is within jurisdictional reach. CoinEx is based outside US jurisdiction. Its compliance response, strengthening internal controls after public reporting, is the kind of reactive posture that allows billions in flows before any intervention occurs.
The scale of Iranian crypto adoption
The enforcement actions unfold against a backdrop of massive and growing cryptocurrency adoption within Iran. Chainalysis estimated that Iranian crypto outflows reached $4.18 billion in 2025, a 70% increase over the previous year. The surge coincided with the collapse of the Iranian rial, which lost approximately 40% of its value against the dollar during the same period, and intensifying sanctions that cut Iran further from the global banking system.
For ordinary Iranians, cryptocurrency serves the same function it serves in other countries experiencing currency devaluation and capital controls: a way to preserve savings and move value across borders. The distinction between legitimate civilian use and sanctions evasion is difficult to draw at scale, and US enforcement actions have not attempted to make the distinction. When Treasury sanctions an exchange like Nobitex that serves 11 million users, the action affects both the IRGC operative moving military funds and the shopkeeper converting rials to USDT to protect against inflation.
Reuters reported that Nobitex was founded in 2018 by brothers Ali and Mohammad Kharrazi, who used the surname Aghamir, and that the pair belong to a politically connected Iranian family. Nobitex rejected the characterization, describing itself as a private and independent company with no relationship to the IRGC, Iran’s central bank, or other state institutions.
The platform’s scale suggests that Iranian crypto activity is not a marginal phenomenon. If Nobitex alone handles 50% of Iran’s crypto trading and processes volumes proportional to the $4.18 billion in outflows that Chainalysis tracked, the total Iranian crypto economy is likely larger than what any single data provider captures.
Tron is the dominant blockchain for Iranian USDT activity, but on-chain analysis shows significant use of Ethereum-based assets and bitcoin for larger transactions. Iran’s geographic position as a major energy producer gives it access to cheap electricity that has long sustained domestic bitcoin mining. Even under US pressure, Iran’s mining industry continues to produce bitcoin that is then sold through non-compliant channels, mixing mined coins with purchased ones in ways designed to obscure provenance.
What the $4.18 billion Chainalysis figure captures is primarily exchange-mediated activity. Peer-to-peer crypto transactions, informal hawala-style networks that use crypto as a settlement layer, and government-level transactions that go through diplomatic channels are not fully reflected in the data. The total Iranian crypto economy, combining formal exchange activity with informal flows, is likely substantially larger than the $4 billion headline figure cited by US officials.
How stablecoin controls enable enforcement
The most effective tool in Treasury’s crypto sanctions arsenal is not blockchain analysis or traditional intelligence. It is the freeze function built into centralized stablecoins. USDT, issued by Tether on various blockchains including Tron, contains issuer level controls that allow Tether to freeze specific addresses, preventing the stablecoins from being transferred regardless of who holds the private keys.
Every major freeze in the Iran campaign has involved USDT on Tron. The $344 million April action and the $131 million July action both targeted Tron wallets holding USDT. The pattern is not coincidental. Tron’s low transaction fees and fast settlement have made it the preferred blockchain for USDT transfers in emerging markets, including Iran. That same preference concentrates Iranian stablecoin holdings in a token that the issuer can freeze on demand.
This creates an asymmetry that favors enforcement. Iranian entities using USDT accept a counterparty risk that bitcoin users do not face: Tether can render their holdings inaccessible with a single transaction. The $475 million in USDT freezes during the Economic Fury campaign shows that this risk is not theoretical.
Tether’s cooperation with US authorities is not legally required in the traditional sense. Tether is incorporated offshore and is not subject to direct US regulatory jurisdiction. But the company has consistently complied with US law enforcement freeze requests, a pattern that reflects both the practical reality of wanting US banking relationships and the risks of being designated as a sanctions violator under OFAC regulations. Tether’s voluntary compliance with freeze requests is one reason why USDT on Tron became the enforcement mechanism of choice in the Iran campaign.
The limitation is that the freeze mechanism only works for centralized stablecoins. Iran has also adopted bitcoin and other decentralized assets for cross border transactions, including accepting cryptocurrency for weapons sales. Bitcoin cannot be frozen by any issuer. Decentralized exchanges and cross chain bridges provide routes that do not pass through compliant intermediaries. The freeze function addresses the largest and most visible flows but not the entire ecosystem.
The Bybit hack connection
The WSJ’s discovery that Central Bank of Iran wallets were linked to assets from the North Korean Bybit hack adds a dimension that extends beyond Iran sanctions. It suggests that the networks facilitating Iranian sanctions evasion overlap with the infrastructure used for state sponsored cybercrime.
The FBI attributed the Bybit hack to North Korean actors who stole approximately $1.5 billion in virtual assets. The hackers converted stolen funds into bitcoin and other tokens across many wallets, using decentralized protocols including THORChain to obfuscate the trail. THORChain processed almost $3 billion in trading volume from swaps tied to stolen Bybit assets, according to on-chain tracking.
The intersection of Iranian sanctions evasion and North Korean cybercrime through a common exchange infrastructure raises questions about whether these networks are coordinated or simply convergent. Two sanctioned states using similar crypto channels to evade financial restrictions could reflect shared operational methods, shared intermediaries, or merely the natural tendency of illicit actors to gravitate toward the same low compliance venues.
For regulators, the connection strengthens the argument for applying comprehensive sanctions screening and transaction monitoring requirements to all centralized exchanges, regardless of jurisdiction. For the crypto industry, it highlights the reputational and regulatory risk of operating exchanges that attract illicit flows through weak compliance.
The Bybit connection also matters for how crypto exchanges frame their role in global financial crime. For years, exchanges in non-US jurisdictions argued that sanctions compliance was a US issue, not a global one. The discovery that the same wallets connected both Iranian government funds and North Korean cybercrime proceeds changes the argument. State-sponsored actors from multiple sanctioned countries are using the same infrastructure, which pushes exchanges into a position where choosing not to comply with US sanctions implicitly means becoming a service provider for state-level threat actors.
FinCEN and OFAC have signaled in recent regulatory correspondence that they intend to pursue secondary sanctions against offshore exchanges that knowingly or negligently process flows from sanctioned jurisdictions. Whether CoinEx, which handled $3.84 billion in Iran-linked flows, faces secondary sanctions action will be a test case for how aggressively that posture is applied in practice.
The enforcement paradox
The Iran crypto sanctions campaign reveals a paradox at the heart of blockchain based enforcement. The same transparency that allows investigators to trace $3.84 billion in flows through CoinEx or identify Central Bank of Iran wallets on Tron also shows the scale of activity that proceeded without intervention for years.
Treasury’s ability to freeze USDT, sanction exchanges, and trace on chain activity represents a significant expansion of sanctions enforcement capabilities compared to the traditional banking system. But the $4.18 billion in Iranian crypto outflows in 2025 alone suggests that enforcement is capturing a fraction of total activity. The actions are significant in dollar terms but may represent less than 25% of annual Iranian crypto flows based on available estimates.
Critics of the campaign argue that sanctioning exchanges like Nobitex primarily harms ordinary Iranians who have no alternative to crypto for preserving savings. Proponents argue that the distinction between civilian and military use cannot be drawn cleanly when the Iranian government uses the same financial networks as the civilian population, and that targeting the infrastructure is the only viable method at scale.
The campaign also faces a structural limitation: as enforcement increases on centralized platforms, activity migrates to decentralized alternatives. Each successful USDT freeze teaches Iranian operators to diversify into bitcoin, privacy coins, or decentralized stablecoins that cannot be frozen. The enforcement action itself accelerates the adaptation that makes future enforcement harder.
What to watch
- Additional exchange sanctions. CoinEx has not been sanctioned despite the WSJ report. Whether Treasury acts against offshore exchanges that process Iranian flows will test the limits of US jurisdictional reach.
- The total seized figure. Treasury’s $1 billion in seized crypto is a running total. Whether it continues to grow at the current pace or plateaus will indicate whether enforcement is keeping up with the flow.
- Migration to decentralized platforms. If Iranian entities shift from USDT on Tron to bitcoin, decentralized stablecoins, or privacy focused protocols, the freeze mechanism that has powered most seizures will become less effective.
- Regulatory response to the Bybit-Iran link. The connection between Iranian sanctions evasion and North Korean cybercrime through shared exchange infrastructure may drive new compliance requirements for exchanges globally.
- Impact on Iranian civilians. The sanctions affect both government entities and ordinary citizens who use crypto as an inflation hedge. How the humanitarian dimension is addressed, or not addressed, will influence the political sustainability of the campaign.
Frequently asked questions
How much Iranian cryptocurrency has the US seized?
The US Treasury has seized or frozen nearly $1 billion in cryptocurrency from Iranian exchanges and wallets since the military conflict began in February 2026. Major actions include a $344 million USDT freeze in April and a $131 million freeze in July, both involving wallets on the Tron network.
What is Operation Economic Fury?
Operation Economic Fury is a US Treasury campaign launched on April 14, 2026, targeting Iran’s financial networks including cryptocurrency exchanges, wallets, and traditional banking channels. The campaign is the financial arm of the US response to the military conflict with Iran.
Which Iranian crypto exchanges were sanctioned?
Treasury sanctioned four Iranian exchanges in June 2026: Nobitex, Wallex, Bitpin, and Ramzinex. Nobitex, the largest, handles approximately 50% of Iran’s crypto trading volume and claims 11 million users. Two Nobitex executives were also added to the OFAC sanctions list.
How much money flowed through CoinEx from Iran?
The Wall Street Journal reported that Iran-linked entities moved more than $3.84 billion through crypto exchange CoinEx since 2019, based on TRM Labs data and public on chain analysis. CoinEx denied knowledge of Iran-linked activity and said it strengthened compliance controls.
How does the US freeze cryptocurrency?
The US leverages the freeze function built into centralized stablecoins like USDT. Tether can freeze specific wallet addresses, preventing tokens from being transferred. This mechanism does not work for decentralized assets like bitcoin, which cannot be frozen by any issuer.
What is the connection between Iran and the Bybit hack?
Investigators traced activity from Central Bank of Iran wallets to assets stolen from Bybit by North Korean hackers, who took approximately $1.5 billion in virtual assets. The connection suggests that Iranian sanctions evasion networks and North Korean cybercrime infrastructure may share common exchange intermediaries.
How much crypto do Iranians use?
Chainalysis estimated that Iranian crypto outflows reached $4.18 billion in 2025, a 70% increase year over year. The surge coincided with the collapse of the Iranian rial and intensifying sanctions that cut Iran from the global banking system.
Can Iran avoid crypto sanctions?
Centralized stablecoins can be frozen, but decentralized assets like bitcoin cannot. As enforcement increases on centralized platforms, Iranian entities are expected to migrate toward decentralized protocols, privacy coins, and cross chain bridges that operate beyond the reach of issuer level controls.
Disclaimer: This article is for informational purposes only and does not constitute financial or investment advice. The information presented reflects publicly available data as of August 1, 2026. Readers should conduct their own research and consult qualified professionals before making financial or legal decisions.

US-listed spot Bitcoin exchange-traded funds (ETFs) finished July with net inflows, even after a late-month pullback that underscored how cautious investors remained going into August. According to SoSoValue, the funds brought in $172.4 million in net inflows during July—enough to reverse two straight months of outflows.
The month’s positive result was tempered by volatility in the final stretch. On the final Friday of July, spot Bitcoin ETFs logged a $265.4 million net outflow, the largest single-day withdrawal since July 13, suggesting the rebound in demand was not fully sustained.
Key takeaways
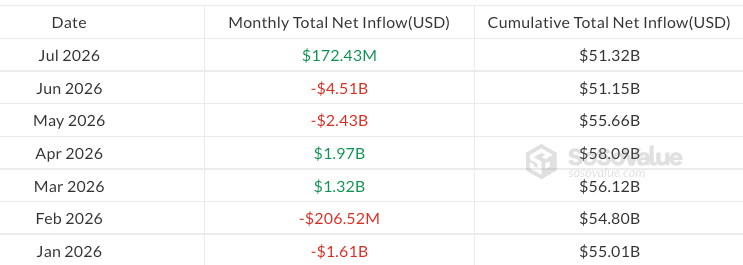
- Spot Bitcoin ETFs took in $172.4 million in net inflows in July, reversing two consecutive months of outflows, according to SoSoValue.
- Despite the monthly gain, the last Friday of July saw a $265.4 million net outflow—Bitcoin ETFs’ biggest daily withdrawal since July 13.
- Year-to-date flows remain negative: US spot Bitcoin ETFs have recorded about $5.29 billion in net outflows in 2026.
- Ether ETFs were steadier, ending July with $365.2 million in net inflows and a four-week inflow run, per SoSoValue.
- XRP ETFs also posted continued demand, adding $27.3 million in net inflows in July while recording their fifth positive month of 2026.
Bitcoin ETFs return to inflows—weak finish signals caution
SoSoValue data indicates July’s net inflow improved the outlook for spot Bitcoin ETF investors after a difficult stretch. The article notes that investors pulled nearly $7 billion in aggregate outflows over the previous two months, including what earlier reporting described as the largest monthly outflow of 2026 in June, totaling $4.5 billion (coverage referenced in the original piece: Cointelegraph).
Still, the late-month selling pressure matters for how traders may read positioning. The $265.4 million outflow on the final Friday of July not only flipped daily flows negative, but also marked the largest daily withdrawal since mid-July. In practical terms, that pattern suggests July’s inflows were vulnerable to sudden risk-off behavior—important for anyone tracking ETF flow-driven momentum.
On a broader time frame, weekly flows also turned negative at the end of the month. For the week ending July 31, Bitcoin ETFs recorded a $61.53 million outflow after three consecutive weeks of inflows. That shift reinforces the message that demand improved during parts of July, but participation thinned as the month closed.
Where 2026 stands: cumulative outflows stay elevated
Even with a positive July, the year-to-date picture for US-listed spot Bitcoin ETFs remains firmly in the red. Based on the figures cited from SoSoValue, Bitcoin ETFs have accumulated roughly $5.29 billion in net outflows in 2026.
The monthly distribution shows a market that has not found consistent footing. March, April, and July are the only months reported as positive so far this year, bringing total inflows of $3.46 billion. Meanwhile, the remaining months—January, February, May, and June—accounted for outflows totaling about $8.75 billion.
Despite that imbalance, the products have still attracted meaningful long-term net capital since launch. The article states that US spot Bitcoin ETFs have drawn $51.32 billion in cumulative net inflows, and that total net assets reached $76.29 billion at the end of July.
Ether ETFs keep the momentum going
While Bitcoin ETFs faced renewed selling pressure at the end of July, Ether-related products showed comparatively steadier demand. According to SoSoValue, US spot Ether ETFs ended July with $365.2 million in net inflows and maintained four consecutive weeks of inflows.
That marks a second month of positive flows for Ether ETFs in 2026 after April’s $356 million inflow. Yet, the recovery is not enough to fully erase earlier weakness: despite this improvement, the article notes Ether ETFs are still around $1.1 billion in net outflows year to date.
For investors, the contrast between Bitcoin and Ether flows can be informative. It suggests that even if market-wide sentiment is cautious, some capital has been willing to rotate into Ether exposure—at least at the ETF level—rather than staying entirely risk-off.
XRP ETFs post another positive month
Other altcoin ETF categories also appear to have avoided the same late-month stress seen in Bitcoin. XRP ETFs, in particular, maintained steadier activity. The article reports that XRP ETFs recorded $27.3 million in inflows during July and marked their fifth positive month of 2026.
Year-to-date, XRP ETFs have generated about $343 million in net inflows, positioning them as one of the stronger-performing crypto ETF segments in the market this year, at least based on the net flow figures cited.
In a market where ETF flows can swing quickly with broader macro conditions and crypto price action, continued positive monthly demand for XRP products can serve as a signal that some investors are still finding specific altcoin exposure compelling—even when Bitcoin faces repeated episodes of volatility.
Going forward, traders and long-term holders will likely watch whether Bitcoin ETF demand can withstand similar end-of-month selling pressure, especially since weekly flows flipped negative as July closed. At the same time, the relative stability in Ether and XRP inflows may keep comparing as a useful read on whether the next wave of capital concentrates in Bitcoin or broadens across the rest of the crypto ETF complex.


Trading volume across South Korea’s five major won-based crypto exchanges fell 54.6% year over year in the first half of 2026 as liquidity became increasingly concentrated on market leader Upbit.
Summary
- Five major exchanges recorded $366.58 billion in first-half trading volume.
- Combined volume fell 54.6% year over year, according to NexBlock.
- Upbit expanded its July market share to 67.4% despite lower trading activity.
- South Korea will introduce a 22% crypto gains tax on Jan. 1, 2027.
South Korea crypto volume drops below $367B
Upbit, Bithumb, Coinone, Korbit and Gopax generated about $366.58 billion in combined trading volume during the first six months of the year, NexBlock reported. That represented a 54.6% decline from the corresponding period in 2025.
The contraction continued in July. From July 1 through July 27, the five exchanges recorded cumulative trading volume of approximately 17.34 trillion won, down 16.9% from the same period in June.
The figures point to weaker activity across South Korea, one of Asia’s most active retail crypto markets. They also show that lower overall volume has not affected all exchanges equally.
Upbit processed about 11.69 trillion won during the July period. Its trading volume fell 10%, but its market share increased from 62.3% to 67.4% as competing platforms suffered steeper declines.
Bithumb recorded approximately 4.71 trillion won in volume. Its share of the five-exchange market dropped from 30.7% to 27.1%, widening the gap between Upbit and Bithumb to 40.3 percentage points.
Upbit gains as liquidity becomes concentrated
NexBlock attributed the changing competitive landscape to liquidity moving toward the largest platforms during the broader market slowdown.
Deep liquidity can attract more traders by supporting larger orders with less price slippage. That advantage can reinforce the position of leading exchanges when overall activity declines, leaving smaller platforms with fewer trades and thinner order books.
Coinone, Korbit and Gopax now face growing pressure to differentiate themselves beyond retail spot trading. According to NexBlock, smaller exchanges are exploring partnerships with securities firms, institutional services and internal restructuring.
Future competition could therefore depend less on headline trading volume and more on stablecoin liquidity, regulatory compliance, institutional access and cooperation with traditional financial companies.
For US investors, South Korean exchange data can provide insight into retail demand in a major Asian market, although the won-based platforms primarily serve domestic users. Reduced Korean volume may weaken one source of global altcoin liquidity and price discovery, particularly for tokens that historically attracted strong local trading interest.
Crypto tax could reshape trading activity in 2027
The volume decline comes as South Korea prepares to implement its long-delayed cryptocurrency tax.
Finance Minister Koo Yun-cheol confirmed on July 29 that the government will begin taxing crypto gains on Jan. 1, 2027, as previously scheduled.
“We are pushing forward with the plan to tax cryptocurrency starting next year as scheduled,” Koo said.
Income generated by transferring or lending virtual assets will be classified as other income. Annual gains exceeding 2.5 million won, or about $1,740, will face a 20% national tax, while a local income tax will raise the combined rate to 22%.
Investors who remain below the annual threshold will not owe tax under the framework. Taxpayers are expected to file their first returns in May 2028 for gains earned during 2027.
The policy creates an additional consideration for domestic traders after three previous delays. Its effect on exchange volume will depend partly on how platforms implement transaction reporting and cost-basis calculations before the rules take effect.
Smaller exchanges seek new sources of growth
South Korea is simultaneously expanding state-backed investment in strategic industries, though the initiative is separate from its crypto tax and exchange policies.
The government approved plans for a new account under the Korea Investment Corporation, the country’s sovereign wealth fund. The account will begin with at least 20 trillion won, or approximately $13.7 billion, and may invest domestically in artificial intelligence, data centers and other strategic sectors.
KIC has historically focused on overseas assets. The expanded mandate reflects a wider effort to direct institutional capital toward domestic industries while seeking long-term returns.
For crypto exchanges, the immediate challenge remains rebuilding activity while complying with tighter rules. Upbit’s rising market share suggests smaller platforms may need institutional partnerships, stablecoin services, or structural changes to compete in a market where total trading volume continues to fall.
Crypto World
New York Attorney General Sues Kalshi for Violating State Laws Against Illegal Gambling

New York Attorney General Letitia James has sued prediction markets platform Kalshi for violating state laws against illegal gambling by offering users event contracts on elections, sporting events, and other outcomes.
Kalshi has called the lawsuit “political theater,” while the Commodity Futures Trading Commission (CFTC) has accused the state of trying to “annihilate prediction markets.”
New York Files Lawsuit Against Kalshi
The lawsuit alleges Kalshi operates an illegal gambling operation in New York and asks Kalshi to stop operating in the state, forfeit its illegal gains, pay restitution to users, and pay civil penalties up to three times its gains. James alleges that Kalshi has not obtained a New York State Gaming Commission license to operate in the state.
New York had filed similar lawsuits against Coinbase and Gemini’s prediction market platforms. James said in a statement released Friday:
“New York’s gambling laws protect children from underage betting and help combat gambling addiction. No matter what they call themselves, prediction markets like Kalshi are gambling platforms, plain and simple. We are taking them to court to uphold our laws and protect New Yorkers.”
The latest action comes after the New York State Gaming Commission issued a cease-and-desist order against Kalshi in October 2025. Kalshi responded by suing the regulator in court. However, a judge rejected Kalshi’s request for a preliminary injunction, and the appeals court rejected a subsequent bid to block enforcement action during the appeals process.
Elisabeth Diana, Kalshi’s head of communications, called the action “political theater,” saying:
“It’s sad to see this type of political theater from the leadership in our own state. States can’t just shut down a federally licensed exchange. This would also hurt New Yorkers, who would be driven offshore. We love New York, we love New Yorkers, and New Yorkers love our product.”
The prediction market platform wants to move the lawsuit to Manhattan federal court, stating that it is based in New York. According to court filings, damages and costs could amount to $36 billion, significantly higher than Kalshi’s $22 billion valuation.
CFTC Files Emergency Motion
Prediction markets have gained immense popularity since the 2024 US Presidential elections, and the Commodity Futures Trading Commission (CFTC) has claimed exclusive regulatory oversight over them. The commission has also challenged regulatory attempts by other agencies in nine jurisdictions, including New York.
The regulator filed an emergency motion to block any enforcement action by New York, arguing that it oversteps authority and infringes upon the CFTC’s exclusive authority to regulate contract markets like Kalshi and other prediction market platforms, and threatens to annihilate the industry nationwide.
Kalshi added that by attempting to shut down the platform, New York was subverting the CFTC’s exclusive jurisdiction to regulate prediction market platforms:
“New York seeks to place itself in the position of a nationwide derivatives regulator. Through this action, which seeks to shut Kalshi down nationwide, New York seeks to fundamentally subvert the exclusive jurisdiction of the CFTC.”
Why Does New York See Prediction Markets As Gambling
New York equates Kalshi’s prediction markets with gambling because it allows people to wager on events whose outcomes they do not control. This includes wagering on outcomes like “who wins the Super Bowl” and even reality TV shows.
The state also highlighted that the minimum age under state law for mobile sports betting was 21 and opposed Kalshi allowing 18- to 20-year-olds on its prediction market platform.
New York Governor Kathy Hochul stated:
“Kalshi has chosen to ignore New York’s gaming laws, which exist to protect consumers, prevent problematic gambling, deliver funding for critical public services, and ensure that every company plays by the same rules. This choice has consequences.”
Prediction Markets Gaining Popularity
Despite regulatory scrutiny, prediction markets like Kalshi and Polymarket are gaining significant traction. Kalshi has expanded its blockchain-based infrastructure and launched tokenized prediction markets on Solana. It subsequently added support for multiple blockchain networks.
Prediction markets have also grown beyond sports, allowing users to trade event contracts on real-world outcomes like elections, inflation, interest rate cuts or hikes, entertainment, and even daily temperatures.
The popularity of prediction markets surged during the recently concluded FIFA World Cup 2026. According to Chainalysis, prediction markets processed around $20 billion in trading linked to the sporting event.
Disclaimer: This article is provided for informational purposes only. It is not offered or intended to be used as legal, tax, investment, financial, or other advice.

The uncertainty around the highly anticipated regulatory bill continues with new negotiations in Washington. New ethics proposals and political disagreements threaten the legislation’s chances of becoming law this year.
Prediction markets now assign a much lower probability of becoming law this year, around 31%-35%, down from the 70% peaks earlier this year.
Highly Important Weekend
Popular journalist Eleanor Terrett noted on X earlier today that this weekend will be a “high-stakes waiting game” for supporters of the bill as the White House “considers an ethics counteroffer involving a state attorney general.”
The proposal reportedly centers on one of the bill’s biggest remaining sticking points: whether state attorneys general should retain authority in enforcing certain ethics provisions involving federal officials.
Bipartisan negotiations between Senator Thom Tillis (R-NC) and Arizona Democrat Ruben Gallego continue, as both believe the bill has to contain a stronger ethics package than the one proposed by the White House and two Senate Republicans at the end of July. Terrett cited three sources familiar with the matter, indicating that the initial offer did not receive approval from Tillis, Gallego, and other Democrats.
Instead, they believe state attorneys general should be able to sue the Department of Justice if it fails to enforce ethics laws against federal officials.
One of the issues with the White House’s proposal is that the ethics provisions would remain in force through January 2029, and there are few clues on what happens next.
With the Senate scheduled to begin its August recess next week, experts and observers believe the bill has only a narrow window remaining this year, which is why the odds on prediction markets continue to dwindle. If lawmakers fail to move it forward before the break, the prospects are likely to deteriorate significantly as attention shifts toward the midterm elections.
Saylor Supports
Most key figures in the cryptocurrency industry have expressed support for the bill over the past year or so. Michael Saylor, the Chairman of the world’s largest corporate holder of bitcoin, doubled down in the past 24 hours.
He believes that BTC will succeed with or without the bill, but added that “America needs clarity for digital assets.”
I support advancing the CLARITY Act through bipartisan work to establish clear, durable rules, protect property rights, promote innovation, and strengthen American capital markets. Bitcoin will succeed with or without legislation, but America needs clarity for digital assets. https://t.co/LYqpPb5zKL
— Michael Saylor (@saylor) July 31, 2026
The post CLARITY Act Faces Another Critical Weekend as Passage Odds Slide appeared first on CryptoPotato.

US-listed spot Bitcoin exchange-traded funds (ETFs) finished July in the green despite a late-month wave of selling and BTC price volatility.
Bitcoin ETFs attracted a modest $172.4 million in net inflows in July, reversing two consecutive months of outflows, according to SoSoValue data.
The monthly inflows came despite a volatile end to July, as the funds logged a $265.4 million net outflow on Friday, marking their largest daily withdrawal since July 13.
July’s return to positive territory improved Bitcoin ETF flows after nearly $7 billion in combined outflows over the previous two months, including the largest monthly outflow of 2026 in June at $4.5 billion. However, the weak finish showed investors remained cautious heading into August.
Bitcoin ETFs remain negative in 2026 with $5.29 billion in outflows
Despite a modest net inflow in July, US-listed spot Bitcoin ETFs have recorded around $5.3 billion in net outflows year to date.
March, April and July were the only positive months of 2026, bringing in a combined $3.46 billion in inflows, while January, February, May and June posted outflows totaling about $8.75 billion.
Monthly spot Bitcoin ETF flows in 2026. Source: SoSoValue
The products have still attracted $51.32 billion in cumulative net inflows since launch, while total net assets stood at $76.29 billion at the end of July.
Related: Bitcoin price sinks to 2-week lows as US stocks fail to copy Asia rebound
Weekly flows turned negative at the end of the month after three consecutive weeks of inflows, with Bitcoin ETFs recording a $61.53 million outflow for the week ending July 31.
Ether ETFs end July with four-week inflow streak
While Bitcoin ETFs faced renewed selling pressure at the end of July, some altcoin ETFs maintained steadier inflows.
Ether ETFs stood out, posting four consecutive weeks of inflows and ending the month with a $365.2 million net inflow, according to SoSoValue.
The inflows marked the second month of positive flows for Ether ETFs year to date after April’s $356 million inflow. Despite the recovery, the products remained about $1.1 billion in net outflows year to date.
XRP ETFs also maintained steady demand, recording $27.3 million in July inflows and marking their fifth positive month of 2026. The products have recorded about $343 million in net inflows year to date, making them one of the stronger-performing crypto ETF categories this year.
Magazine: A quantum roadmap would push Bitcoin much higher: Charles Edwards
The XRP Ledger wants to let banks pay network costs for their users. If validators agree, people could use the ledger without ever buying XRP.
Jazzi Cooper, head of product at RippleX, said the xrpld 3.3.0 release should arrive next week. It carries five proposed changes. One is called Sponsored Fees and Reserves.
Why Using the XRP Ledger Costs XRP Today
Every account on the ledger locks up 1 XRP. That amount cannot be spent or moved. Each extra item an account holds, such as a trustline, locks another 0.2 XRP.
Every transaction also burns a small fee. So a new user has to buy XRP first. Only then can they do anything else.
The upgrade changes who pays. A bank, issuer, or platform can cover both the fee and the locked amount. Users still hold their own accounts and keys.
Cooper called that requirement one of the biggest barriers for new users, and for institutional tokenization on XRPL.
“Users continue to own their accounts and keys, while removing one of the biggest onboarding hurdles: requiring every participant to acquire and manage XRP before they can interact with the network,” Cooper said.
Follow us on X to get the latest news as it happens
What It Means for XRP Demand
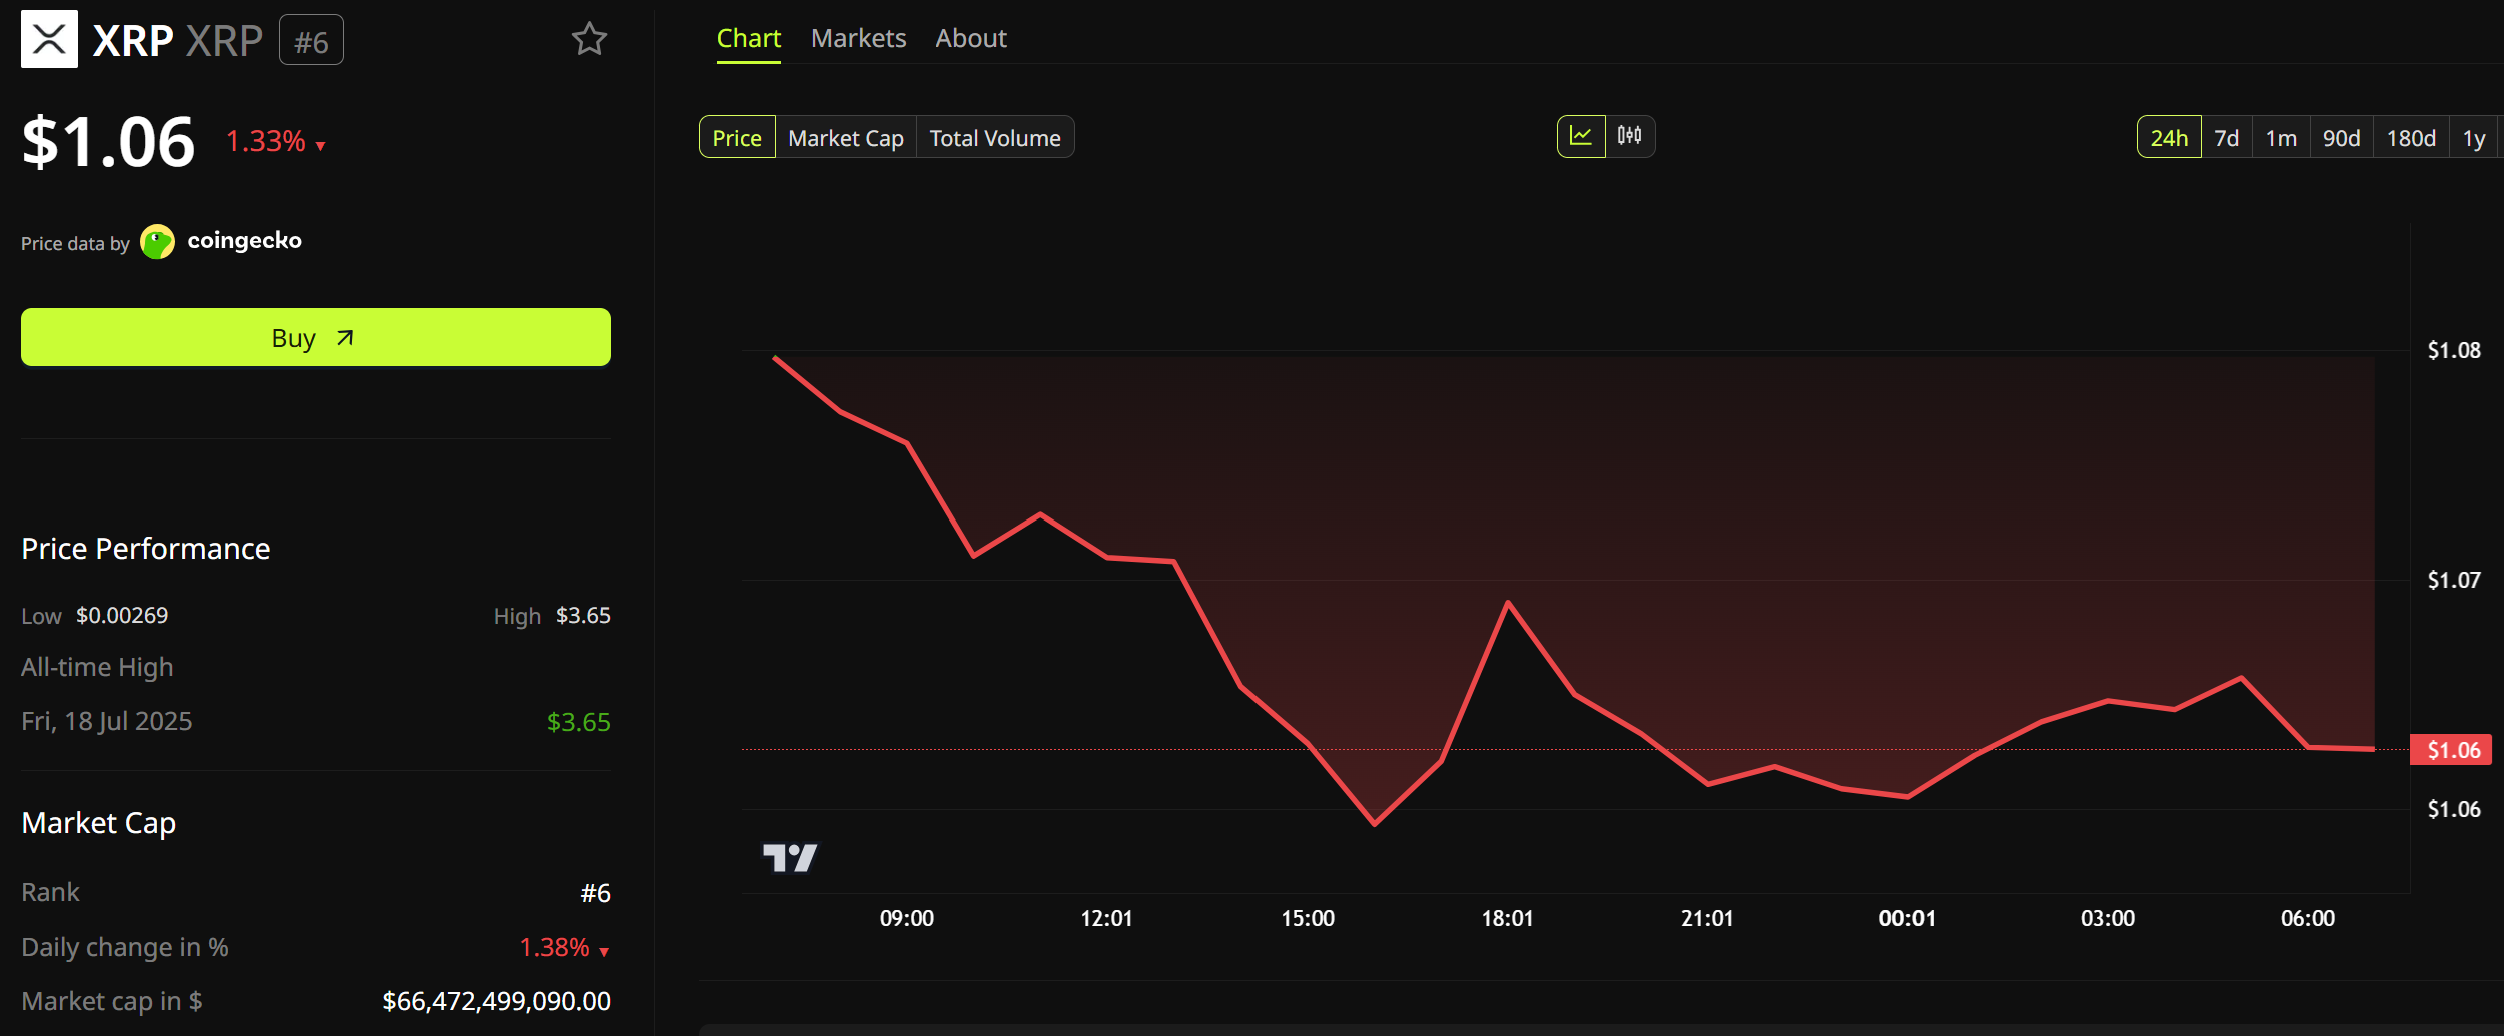
XRP trades near $1.06. It is down 1.3% on the day and about 64% lower than a year ago. Its market cap sits at $66.5 billion.

The locked XRP does not vanish under this plan. It simply moves. Sponsors would hold it instead of millions of small users.
That cuts both ways. Everyday users lose their main reason to buy XRP. But a platform signing up thousands of accounts would need far more of it.
Past upgrades offer little guide. Permissioned Domains went live in February with more than 91% validator support. A smaller update followed in May. Neither moved the price much, and ledger use has grown while XRP fell.
2 of the 5 Changes Failed Before
Confidential MPT hides Multi-Purpose Token (MPT) balances from public view. Auditors can still check them when needed. Dynamic MPT lets issuers decide upfront which token settings they may change later.
The last two are second attempts. Batch groups up to eight transactions so they all succeed or all fail. It was pulled in February. Pranamya Keshkamat and Cantina AI’s tool Apex found a flaw that let attackers spend from other people’s accounts.
Permission Delegation was switched off in September 2025. A developer known as tequ reported that it charged fees before checking signatures. Neither ever reached the live network, so no money was lost.
Validators now decide. Each change needs 80% support for two straight weeks. Batch has been rejected once already.
The post XRP Ledger Upgrade Could Make Owning XRP Optional: Will Demand Fall? appeared first on BeInCrypto.


Moneyflip CEO Marcos Arturo Kleiman Tronllan faces a federal murder-for-hire charge after allegedly paying undercover agents $40,000 to kidnap and kill a businessman over an unpaid debt.
Summary
- Kleiman allegedly agreed to pay $40,000 to kidnap and murder a Mexican businessman.
- Prosecutors said the final payments included $5,000 in cash and about 25,000 USDT.
- Undercover agents previously had Kleiman convert approximately $750,000 into cryptocurrency.
- The federal charge carries up to 10 years in prison and a $250,000 fine.
Moneyflip CEO arrested in Miami
Homeland Security Investigations agents arrested Kleiman in Miami on July 30 in connection with a federal complaint filed in San Diego.
Kleiman, 40, is a Mexican citizen and lawful permanent resident of the United States. He previously lived and worked in San Diego, according to the U.S. Attorney’s Office for the Southern District of California.
Moneyflip is a registered money services business offering cross-border currency exchange services. Kleiman previously operated the company as MXN Financial LLC before it changed its name to Moneyflip LLC in 2025.
Investigators began examining Kleiman while investigating currency exchange businesses in San Diego and Imperial counties. Authorities suspected that he used cross-border transactions to avoid Bank Secrecy Act reporting requirements and launder proceeds from drug sales.
The complaint contains allegations rather than proven facts. Kleiman is presumed innocent unless convicted.
Undercover agents converted $750K into crypto
Undercover HSI agents approached Kleiman in February and asked him to convert U.S. dollars into cryptocurrency. The agents allegedly told him that the money came from drug sales.
Prosecutors said Kleiman created an email account and shared its password with the agents. The parties allegedly communicated through unsent draft emails to avoid transmitting messages directly.
Kleiman then allegedly converted approximately $750,000 into cryptocurrency and arranged for the assets to be transferred to an undercover agent’s wallet. Authorities said he charged a 10% fee.
“Kleiman converted approximately $750,000 of United States currency into cryptocurrency and caused the transmission of those crypto coins into an undercover federal agent’s wallet,” prosecutors said.
During those discussions, Kleiman allegedly asked whether the agents could recover a debt from a Mexican businessman and kill him. Prosecutors said he agreed to pay $40,000 for the kidnapping and murder, including two $5,000 advance deposits.
Agents staged murder before 25,000 USDT payment
Kleiman allegedly arranged for a third party to deliver the first $5,000 deposit to an undercover agent in San Diego in May. Prosecutors said he later paid another $5,000 deposit after an agent requested money to reserve the purported killers.
On July 28, the undercover agents showed Kleiman three photographs and a video that falsely depicted the businessman as having been captured, tortured and killed. No murder occurred as part of the operation.
Authorities said Kleiman responded that the agents could count on him to complete the payment. On July 29, he allegedly delivered another $5,000 in cash and transferred approximately 25,000 USDT to an undercover cryptocurrency wallet.
USDT is a dollar-pegged stablecoin issued by Tether. Unlike cash, transfers made through public blockchain networks can leave transaction records that investigators may use alongside messages, surveillance, and other financial evidence.
Federal charge carries a 10-year maximum sentence
Kleiman faces one count of murder-for-hire under Title 18, Section 1958(a) of the U.S. Code. The charge carries a maximum sentence of 10 years in federal prison and a fine of up to $250,000.
The case is being prosecuted by Assistant U.S. Attorneys Michael Deshong and Christopher Beeler. HSI led the investigation with support from the U.S. Postal Inspection Service, Drug Enforcement Administration, Customs and Border Protection, IRS Criminal Investigation, and local law enforcement agencies.
Money services businesses that exchange or transmit convertible virtual currencies may fall under federal Bank Secrecy Act requirements. Registration as a money services business does not represent government approval of a company or its activities.


George Santos said he would attend the 2026 State of the Union. He was also betting on Kalshi that he would skip it. Regulators have now fined him $35,000.
He made $17,570 on that bet. He kept the money for about five months. Now he has to give all of it back.
He Bet Against Himself, and Won
Kalshi is a US exchange where people trade contracts on real events. Federal derivatives rules cover it, not state gambling rules.
The contract was simple. It asked who would show up at the State of the Union. Santos traded it between February 12 and February 25.
While he held those bets, he posted about his plans on X. The US Commodity Futures Trading Commission (CFTC) says those posts were misleading. Its order came out Friday.
Prices then moved his way. He walked away with $17,569.98. He now owes that back, plus a $17,500 fine.
He is also banned from trading for three years. He admitted nothing.
This is not his first problem. Congress expelled Santos in 2023. Trump commuted his fraud sentence last year.
Kalshi Caught It in Seconds
No regulator spotted this first. The exchange did, and so did other traders. Kalshi CEO Tarek Mansour described how fast it happened.
“within seconds it was flagged by our system. We opened investigations and within minutes we had like a hundred whistleblower complaints,” Axios reported, citing Tarek Mansour, Kalshi CEO.
That speed is the real story here. On a stock exchange, staff dig through records weeks later. On these markets, the people holding the other side notice immediately.
They have every reason to look. Their own money is at stake. Most Kalshi traders lose as it is, so they watch each other closely.
Regulators are circling too. In February, the CFTC said it would go after insider trading and manipulation on markets like these. Former officials had warned about weak oversight earlier.
Kalshi has since punished three congressional candidates who bet on their own races. A White House teleprompter operator lost his job in July. Reports said he won over $100,000 betting on Trump’s speeches.
Santos Says He Did Nothing Wrong
His lawyer, Joseph W. Murray, says the deal proves nothing.
“Mr. Santos has settled without admitting any of the Commission’s allegations, findings, or conclusions,” Joseph W. Murray, via MS NOW.
Kalshi is running its own case against him as well. If it collects any money, it says it will try to repay the traders he beat.
The timing is awkward, though. New York sued the company on the same day. The state calls it illegal gambling and wants up to $36 billion.
Kalshi says it is a regulated exchange, not a casino. It is fighting that case while chasing a $40 billion valuation.
Catching Santos in seconds may be the best argument it has.
The post George Santos Kalshi Bet Cost Him $35,000: Who Caught Him First? appeared first on BeInCrypto.


A Hong Kong woman reportedly lost around $3.3 million after an online romantic partner directed her to a fraudulent cryptocurrency investment platform.
Summary
- 25 romance-linked investment scams were reported in Hong Kong between July 24 and 30.
- Combined losses from the cases approached nearly $9 million, according to local police statistics.
- One victim saw supposed returns of more than 800% before the platform blocked withdrawals.
- Hong Kong also recorded a 92.1% rise in online employment scams during early 2025.
Crypto romance scams cost victims nearly $9M
Hong Kong authorities recorded 25 investment fraud cases involving online romantic relationships during the week ending July 30, according to police statistics cited by Binance Square News.
The reported losses totaled nearly HK$70 million, or roughly $9 million. One case accounted for more than a third of that amount.
A 50-year-old insurance professional reportedly met a person online who presented himself as a car dealer. After establishing a romantic relationship, the person persuaded her to invest in virtual currencies through an unfamiliar platform.
The victim continued transferring money after the platform displayed rising account balances. By last month, it claimed that her portfolio had generated returns exceeding 800%.
However, the platform denied her withdrawal request. The purported romantic partner and an alleged investment adviser then stopped responding, leaving the woman with cumulative losses exceeding HK$26 million or around $3.3 million.
Authorities did not disclose which cryptocurrencies were involved or whether any of the transferred funds had been recovered.
Fake profits kept the victim investing
The case follows a common pattern in relationship-based cryptocurrency fraud. Scammers first build trust through dating applications, social media or messaging services before introducing an investment opportunity.
Victims are then directed to trading websites or applications controlled by the fraudsters. These platforms may display fabricated profits, allow a small initial withdrawal, or encourage victims to increase their deposits.
The scheme typically becomes apparent when a victim attempts to withdraw a larger amount. Operators may block the transaction or demand additional payments described as taxes, processing charges or penalties.
Hong Kong police urged investors to treat investment recommendations from newly established online contacts with caution. Warning signs include guaranteed returns, unusually high profits and requests to transfer funds through an unfamiliar platform.
The FBI describes the same method, saying criminals control the supposed investments and often steal all funds deposited by victims.
Hong Kong employment scams also surged
The romance cases add to a wider increase in online fraud affecting Hong Kong residents.
Police recorded 2,148 online employment scams between January and May 2025, up 92.1% from the same period a year earlier, according to figures reported by the South China Morning Post and HRD Asia.
Reported losses increased from HK$260 million to HK$480 million, an 89% rise. Authorities registered 621 cases in May alone, with 60% originating on WhatsApp and another 22% on Telegram.
Investigators attributed much of the increase to “click farming” schemes. Fraudsters initially pay participants small commissions for completing simple online tasks, such as following social media accounts or purchasing products to inflate a seller’s activity.
After gaining trust, scammers ask victims to commit larger sums for higher-paying assignments. Withdrawal attempts are then rejected, with operators claiming the victim made an error or damaged a company system and must pay a penalty.
US crypto fraud losses reached $7.2B
Similar investment schemes remain a major threat to US users. Cryptocurrency investment fraud produced $7.2 billion in reported US losses during 2025, making it the country’s largest category of financial loss reported to the FBI’s Internet Crime Complaint Center.
The FBI’s 2025 report said scammers commonly approach victims through social media, dating platforms and unsolicited messages before moving conversations to private messaging services.
US authorities advise victims to stop sending money immediately and preserve wallet addresses, transaction hashes, platform domains and communications. The FBI also warns against paying supposed recovery services, which may operate a second scam targeting people who have already lost funds.
Hong Kong police similarly advised users not to lower their financial safeguards because of emotional attachment or trust. Investors should independently verify platforms and avoid offers promising guaranteed or abnormally high returns.

Inside John Cusack’s Life Out of the Spotlight

Chris Newsome urges quick turnaround for Meralco after loss

3 underrated movies on HBO Max you should watch this weekend (July 31-August 2)

Renter of Home in Anne Heche Crash Denies Settlement With Son

No Jackpot Winner as $257 Million Prize Rolls Over to $269 Million Monday Draw

Weekend Open Thread: Staud – Corporette.com

From Learning to Earning: My MRR Certification, Website- Next..Financial Freedom Online!

#stock #finance #financialeducation #What is share holding pattern #shortvideo
![LISA - 'MONEY' 2023 WORLD TOUR [BORN PINK] KYOCERA DOME OSAKA](https://wordupnews.com/wp-content/uploads/2026/02/1770253317_hqdefault-80x80.jpg)
LISA – ‘MONEY’ 2023 WORLD TOUR [BORN PINK] KYOCERA DOME OSAKA
-
 Sports5 days ago
Commonwealth Games boxing: Jadumani Singh seals dominant 5-0 win over Pakistan’s Sumama Rehman to enter quarter-finals | Commonwealth Games News
-

 Business2 days ago
Why Trees Belong on the Risk Register
-

 Fashion15 hours ago
Weekend Open Thread: Wit & Wisdom
-

 Politics11 hours ago
Meta enters AI-training agreement with far-right ‘propaganda rag’ Newsmax
-

 Tech5 days ago
Intel is reversing course and bringing hyper-threading back to its server chips
-

 Crypto World7 days ago
Ripple bought a bank in pieces. The $4 billion audit
-

 Politics5 days ago
Luke Littler dismantles Gerwyn Price to retain title in Blackpool
-

 Politics4 days ago
The Part of the Electric Transition Nobody Wants to Discuss
-

 News Videos5 days ago
BITCOIN JUST ENTERED THIS CRITICAL ZONE…
-
 Entertainment4 days ago
‘Stargate’ Creator’s New Sci-Fi Series Returns for Season 3 Tomorrow
-

 Crypto World6 days ago
XRP Ledger adds $2.6B as RWA inflows rank second
-

 Business3 days ago
Major shareholder moves on Canyon
-

 Politics6 days ago
Spain sweeps the board at 2026 World Cup with individual awards
-

 News Videos2 days ago
Bitcoin Enters the 3rd Stage of the Bear Market
-
Crypto World2 hours ago
XRP Ledger v3.3.0 brings five institutional features
-

 Entertainment6 days ago
Sara Gilson Killed By Husband After Viral “Pedophile” TikTok Video
-

 Crypto World3 days ago
Kraken Enables Retail Access to Jersey Mike’s IPO via Tokenized Shares
-

 Tech4 days ago
New macOS Sequoia & Sonoma security updates for older Macs
-

 News Videos4 days ago
Claude: Build Financial Dashboards in Minutes (2026)
-

 Politics2 days ago
Luke Littler’s dominance sparks GOAT debate
You must be logged in to post a comment Login