

Crypto World
European Banking Authority seeks feedback on a tougher MiCA penalty framework


The European Banking Authority has proposed a standardized penalty framework that would allow the European Union to impose multimillion euro fines on issuers of significant crypto tokens that breach the bloc’s digital asset rules.
Summary
- European Banking Authority has proposed fines of up to 12.5% of annual turnover for major crypto token issuers that breach MiCA rules.
- Crypto firms must secure MiCA licenses by July 1 or risk enforcement action and restrictions on operating across the European Union.
- Binance has begun limiting services in the European Union while licensed rivals Coinbase and OKX continue competing for affected users.
The consultation paper, published on June 26, sets out a two-step methodology for calculating penalties under the Markets in Crypto Assets regulation. The EBA plans to first assess the seriousness of each infringement before adjusting the amount based on aggravating or mitigating circumstances.
Statutory penalties could reach up to 12.5% of annual turnover for issuers of significant asset-referenced tokens and 10% for issuers of significant e-money tokens. The consultation paper also allows fines of up to twice the profits earned from a violation, where applicable.
The proposal forms part of the enforcement framework for MiCA, which introduced a single regulatory regime for digital assets across the European Union. The regulation requires token issuers and crypto asset service providers to meet licensing, capital, consumer protection, and compliance requirements before operating across the bloc.
The EBA added that the proposed framework will establish a consistent process for calculating penalties across the European Union. As per the consultation paper, the methodology aims to ensure supervisory authorities apply financial sanctions in a uniform manner once the rules take effect.
July 1 licensing deadline approaches
The EBA released the consultation days before the July 1 MiCA licensing deadline, when crypto firms must obtain authorization from a national regulator to continue offering services or marketing stablecoins throughout the European Union.
Firms that fail to secure authorization could face enforcement action if they continue operating without approval or commit violations covered by the proposed penalty framework, including unauthorized public disclosures and organizational compliance failures.
The consultation period will remain open until Sept. 28, allowing industry participants to submit feedback before the EBA finalizes the methodology.
Binance has already begun restricting parts of its European business after failing to obtain MiCA authorization before the deadline. As previously reported, the exchange withdrew its MiCA application in Greece and has stated that it intends to seek approval through another European Union member state.
Exchange notices shared by users on social media confirmed that Binance will stop onboarding new European Union customers and limit selected services for existing users from July 1. The company also informed customers that digital assets will remain available for withdrawal after the restrictions take effect.
As uses moved out of Binance, Coinbase, OKX, and some other exchanges have responded by promoting their MiCA authorized operations to European customers. For instance, Coinbase launched a campaign across several European markets offering a 5% transfer bonus for eligible users who move assets before July 13, while OKX introduced welcome rewards and deposit matching of up to 8% for qualifying users in the European Economic Area.


As the chart shows, AUD/USD has entered a distinctly bearish phase in recent weeks, reflecting the broader consolidation — and in some cases outright weakness — that the US dollar has begun imposing across most major currency pairs.
Fundamental Analysis
The Reserve Bank of Australia concluded its June meeting by holding the cash rate steady at 4.35%, opting to monitor the effects of the three consecutive hikes already delivered since the start of the year. The board acknowledged that financial conditions have tightened and that the economy is showing early signs of slowing, while maintaining a vigilant stance on inflation, which remains above target.
In theory, a pause after a tightening sequence — with a cash rate at 4.35%, the highest in the G10 — is a structurally supportive signal for the Australian dollar, as elevated rate differentials tend to attract flows toward AUD-denominated assets. However, markets had already fully priced in this outcome, stripping the decision of any surprise. AUD/USD has consequently failed to post any meaningful bullish impulse, sliding toward almost three-month lows near 0.6890, weighed down by renewed US dollar strength on growing Federal Reserve rate hike expectations. Adding further complexity to the outlook, the ongoing Middle East conflict continues to weigh on global risk sentiment, acting as an additional headwind for a currency that markets have long treated as a barometer of global risk appetite.
Technical Analysis
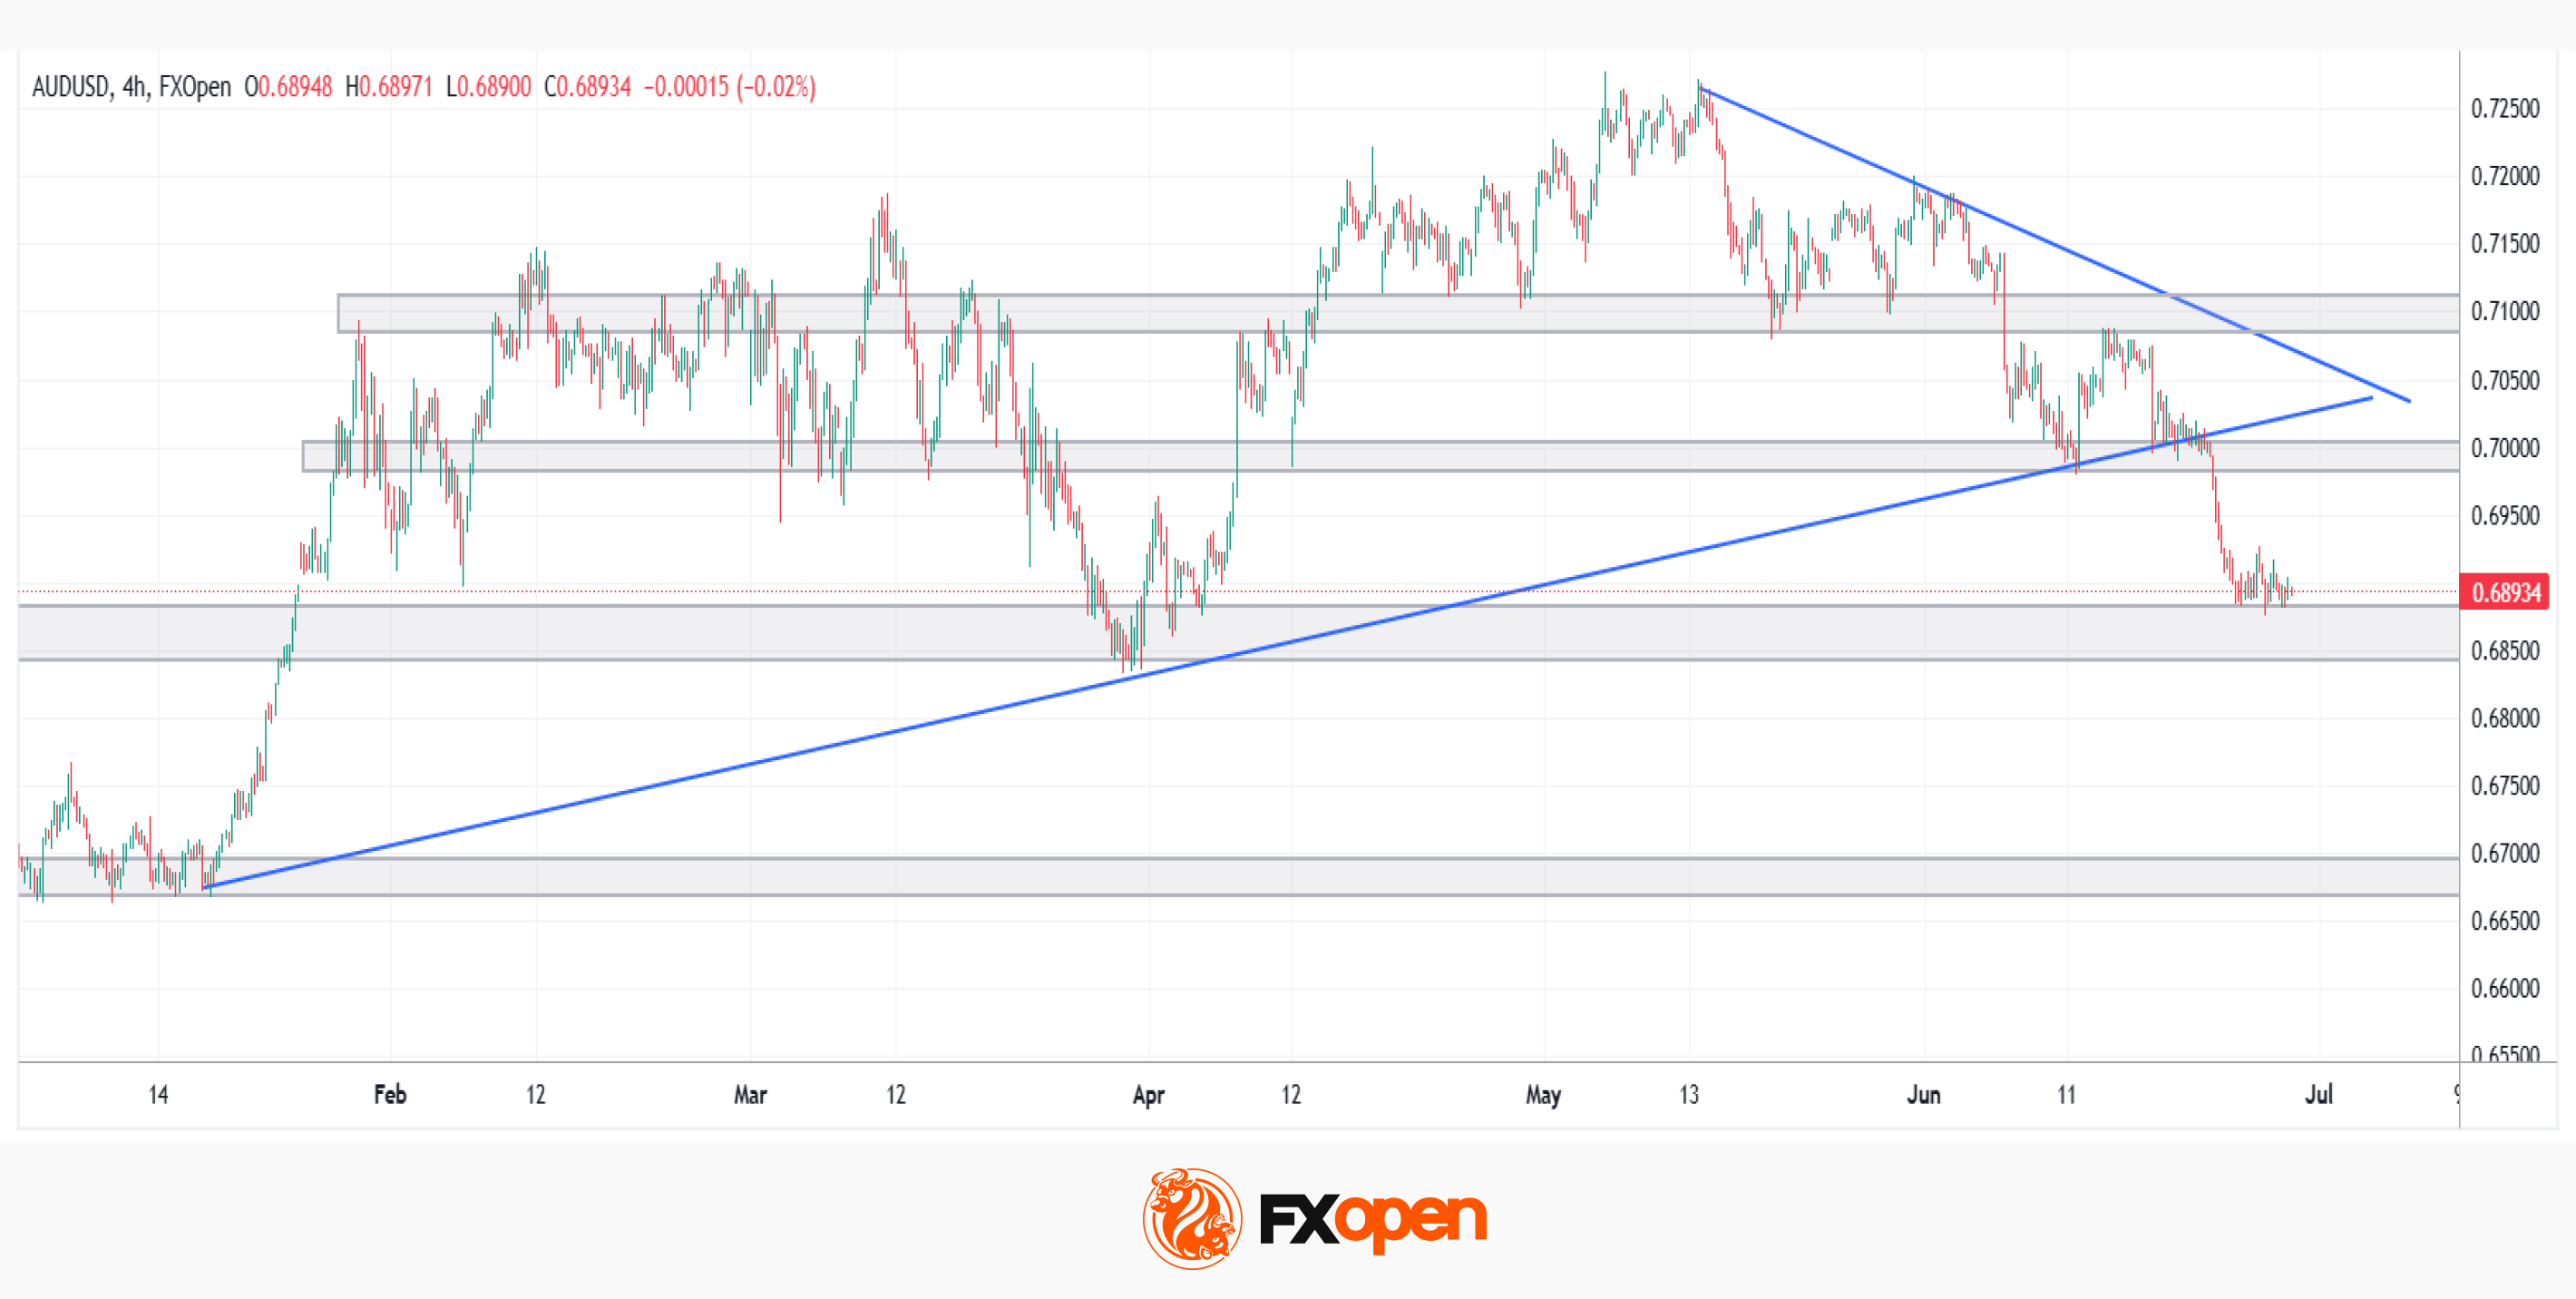
The most representative benchmark for the Australian dollar’s momentum, AUD/USD seems to have already shifted his path. Following a prolonged period of broad greenback strength, the pair has gradually developed a bearish structure over recent weeks.
→ Bullish scenario: a key support zone sits in the 0.6880–0.6850 area. Should this level hold, it could restore some of the strength lost in recent weeks and bring the pair back to test the resistance between 0.6980 and 0.7000 — a threshold that will be decisive for the next directional move. A sustained recovery would also require a more relaxed geopolitical backdrop, as risk sentiment continues to cap AUD’s upside potential.
→ Bearish scenario: should support fail to hold — or should the pair test the descending trendline in play and reject it, confirming the prevailing downtrend — AUD/USD could revisit levels last seen at the start of the year, with the 0.6700–0.6600 zone as the next significant area of interest.
With a more relaxed geopolitical environment and a hawkish central bank behind it, will the Australian dollar manage to reclaim its strength on the forex stage?
Trade over 50 forex markets 24 hours a day with FXOpen. Take advantage of low commissions, deep liquidity, and spreads from 0.0 pips (additional fees may apply). Open your FXOpen account now or learn more about trading forex with FXOpen.
This article represents the opinion of the Companies operating under the FXOpen brand only. It is not to be construed as an offer, solicitation, or recommendation with respect to products and services provided by the Companies operating under the FXOpen brand, nor is it to be considered financial advice.

Key Takeaways
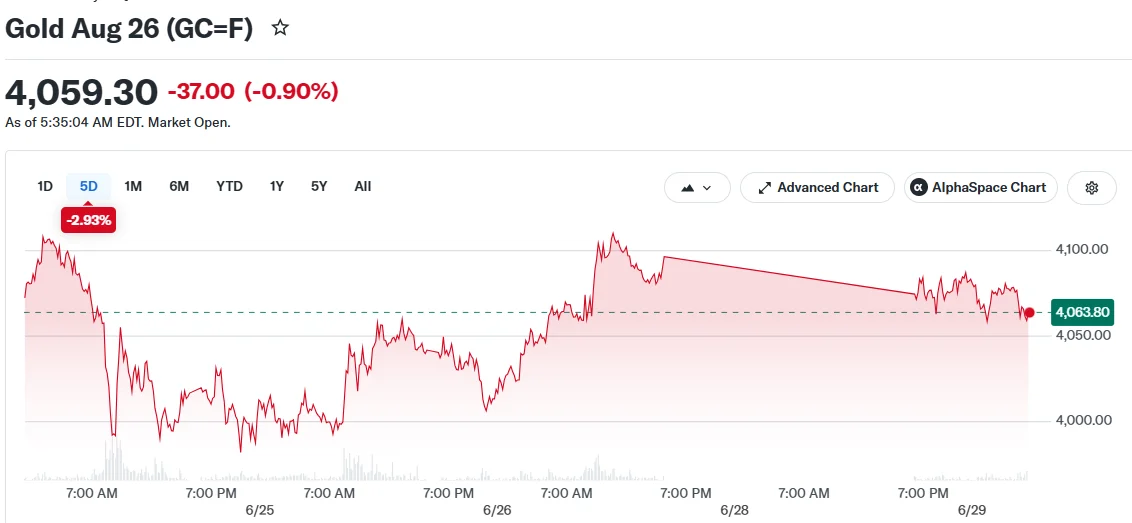
- Precious metal declined more than 1% on Monday, approaching $4,000 per ounce following renewed military exchanges between the US and Iran
- Washington and Tehran have committed to suspending hostilities and will convene for diplomatic discussions in Doha this Tuesday
- The yellow metal has surrendered approximately 23% of its value since joint US-Israeli military operations against Iran commenced in late February
- Derivative markets indicate over 30% probability of Federal Reserve rate increases before 2026 concludes
- Critical employment statistics scheduled for release this week may shape the central bank’s policy direction
Renewed military confrontations between Washington and Tehran during the weekend drove precious metal valuations downward on Monday, bringing the commodity close to the $4,000 threshold as inflationary pressures re-emerged in financial markets.
Spot bullion decreased 1.1% to $4,043.62 per ounce during early Asian trading sessions. Futures contracts for gold retreated 1% to $4,056.77.
The United States and Iran engaged in military operations across the Persian Gulf throughout the weekend, undermining a temporary cessation of hostilities that had previously stabilized energy commodity markets. A vessel transporting Qatari petroleum was damaged during these confrontations, interfering with maritime traffic through the Strait of Hormuz.
Notwithstanding the escalating tensions, both nations have committed to cease military operations. Diplomatic representatives are scheduled to convene in Doha on Tuesday, as reported by Axios through confidential government sources.
Bullion Weakens Under Rate Expectations and Dollar Strength
Gold has experienced sustained downward momentum for several months. The precious metal has depreciated roughly 23% since coordinated US-Israeli strikes against Iranian targets began in late February.
Elevated energy commodity valuations stemming from the regional conflict have accelerated inflationary trends, prompting market participants to anticipate prolonged restrictive monetary policies from central banking institutions. This dynamic has particularly disadvantaged gold, which generates no income for holders.
Derivative market pricing currently reflects greater than 30% likelihood of Federal Reserve rate increases materializing before the conclusion of 2026, based on CME Fedwatch analytics.
A robust American currency combined with elevated Treasury bond yields have compounded downward pressure. The Federal Reserve’s June policy meeting conveyed a restrictive stance, while recent inflation measurements registered elevated levels, though consistent with analyst projections.
The central bank’s preferred inflation metric, the personal consumption expenditures price index, advanced 0.4% during May. Government bond yields experienced modest declines following that data release.
Additional precious metals similarly declined on Monday. Silver retreated 1.8% to $58.11 per ounce. Platinum decreased 0.4% to $1,612.20.
Employment Report Poised to Dominate Market Attention This Week
Market participants are monitoring numerous economic indicators scheduled for release this week to assess future monetary policy trajectories.
Japanese manufacturing output figures, Chinese purchasing managers surveys, and European inflation measurements are all anticipated.
However, the primary focus remains the United States nonfarm payrolls report covering June. Resilient labor market conditions would provide the Federal Reserve additional justification for implementing rate increases.
Any indication that employment growth maintains momentum could accelerate gold’s decline, as elevated borrowing costs amplify the opportunity cost of maintaining non-income-producing assets such as bullion.
The diplomatic negotiations scheduled in Doha on Tuesday will also command significant attention. A sustainable peace agreement could alleviate energy price pressures and diminish inflationary expectations, fundamentally altering the trajectory for gold.
Currently, the metal remains confined near multi-month lows, suspended between geopolitical instability and the probability of ascending interest rates.

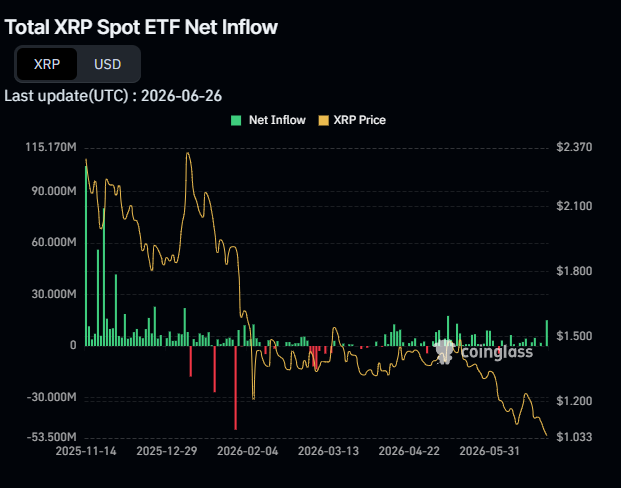
XRP (XRP) spot exchange-traded funds extended their inflow streak to eight consecutive weeks through June 26, pulling in $22.99 million. Bitcoin (BTC) ETFs shed hundreds of millions over the same period as BTC slid to its lowest price since late 2024.
The gap between the two assets widened sharply last week. Bitcoin ETFs recorded $444.50 million in net outflows in a single session, per CoinGlass data. XRP ETFs posted zero outflow days across the week.
XRP Holds Steady While Bitcoin Bleeds
Last week’s $22.99 million XRP ETF print was the largest single-week figure in June. Bitwise’s XRP ETF led flows, contributing $11.18 million on June 26. Franklin Templeton’s XRPZ added $3.80 million the same day.

Canary Capital and Grayscale recorded minimal movement across most sessions. The seven active funds hold combined assets under management approaching $1 billion.
Bitcoin ETFs have now posted seven consecutive weeks of net outflows. Total net assets across the BTC ETF complex fell to $81.85 billion from roughly $107.8 billion in mid-May.

BTC Falls Below $60,000 as Macro Pressures Mount
Bitcoin fell to below $60,000 on June 25, its lowest level since October 2024. Several factors hit at once. A selloff in semiconductor and AI stocks pushed investors away from risk assets. Reports of a potential CLARITY Act delay added regulatory uncertainty. ETF redemptions created additional mechanical selling as issuers sold underlying BTC to meet withdrawals.
BTC now sits roughly 31% lower year-to-date and more than 50% below its October 2025 all-time high of $126,272.
XRP has also dropped from its January 2026 peak of $2.40. However, the XRP price has held up better than BTC on a relative basis. The eight-week ETF inflow streak signals that institutions view XRP’s regulatory clarity as a separate factor from the broader market selloff.
Whether that bid holds into July will depend on CLARITY Act progress and macro conditions in the weeks ahead.
The post XRP ETF Inflows Hit 8-Week Streak: Will Bitcoin ETF Outflows Continue? appeared first on BeInCrypto.
A container ship is berthed at the container terminal in Qingdao, China’s eastern Shandong province on June 25, 2026.
– | Afp | Getty Images
China’s economy is showing signs of picking up, thanks in part to a rebound in shipments to the U.S.
“Manufacturing saw the clearest improvement. Retail sales recovered nicely,” according to the China Beige Book, an independent survey of Chinese businesses, on Monday. The survey, covering 1,321 businesses from June 1 to 22, pointed to a surge in luxury goods sales, but weaker tourism-related spending.
“The second quarter is ending on a more positive note than it began, but this performance will need to repeat itself in July and August for there to be legitimate cause for celebration,” the report said.
The world’s second-largest economy lost steam in April and May after a strong first quarter. In May, China’s retail sales fell for the first time since the pandemic, official figures showed, while data from the 618 shopping festival, which ran from mid-May through mid-June, showed a sharp slowdown in sales growth.
Investment in manufacturing, dragged down by declines in metals, chemicals and auto production, fell in May on a year-to-date basis for the first time since December 2020, according to Chinese financial-data provider Wind Information.
But in June, the Beige Book said factory activity “accelerated,” and “U.S.-bound orders again saw sharp year-on-year gains.” China’s exports to the U.S. have picked up in recent months, growing 11.3% and 35.4% in April and May, respectively, following double-digit declines for most of last year when President Donald Trump ratcheted up levies on Chinese goods.
Freight rates for shipping between Asia and the U.S. have climbed to their highest in nearly two years, S&P Global said last week, attributing the surge to importers frontloading shipments ahead of higher fuel surcharges and price hikes from Asian suppliers. The stockpiling could taper off by late July, it said.
China’s export order growth to Asia and other developing countries, however, slowed in June from May, while growth of those to Europe held steady, the Beige Book found.

Trump’s meeting with Chinese President Xi Jinping signaled tariffs will likely remain lower for now, while the U.S. has yet to impose additional duties that could emerge from Washington’s Section 301 probes targeting countries identified for overcapacity and forced labor practices. The 10% duty on goods from most major trading partners that Trump imposed under Section 122 is set to expire on July 24.
Businesses are rushing to ship goods to the U.S. before tariffs potentially surge again, said Tianchen Xu, senior economist at the Economist Intelligence Unit.
Reflecting a trade recovery, China’s exports to the U.S. in May reached nearly 90% of levels seen in 2024, according to official data. In contrast, May 2025 figures showed China’s exports to the U.S. had dropped to 70% of their 2024 levels.
“China’s weak momentum likely turned around in June,” said Xu, adding that “the improvement was still first and foremost led by the external sector.”
He added that strong demand for artificial-intelligence technology and components, as well as falling oil prices in the wake of easing tensions around the Strait of Hormuz, will help soften the pressure on China’s economy.
China is scheduled to release retail sales and industrial data for June, as well as second-quarter GDP, on July 15. It is expected to report June trade data on July 14.
The earliest official read on June economic performance is due out Tuesday, with the National Bureau of Statistics scheduled to release the official manufacturing purchasing managers’ index. The measure of business activity is expected to climb into expansionary territory with a 50.1 print in June, according to a Reuters poll.
Goldman Sachs on Sunday revised up its third-quarter GDP growth forecast to 5% from 4.5% quarter-on-quarter annualized, on the anticipation of lower oil prices and faster fiscal spending over the next few months, after a tepid second quarter for which it predicts growth of 3.5%.

Key Highlights
-
HPQ stock experiences modest gains following announcement of enhanced OpenAI collaboration.
-
Company deploys AI solutions to accelerate customer service and partner engagement.
-
OpenAI Frontier platform to power HP’s operational infrastructure and workforce tools.
-
Initiative includes advanced governance frameworks and enterprise-grade data management.
-
Partnership aligns with HP’s comprehensive workplace transformation and AI hardware initiatives.
HP Inc. (HPQ) announced an expansion of its collaboration with OpenAI, integrating artificial intelligence capabilities throughout its business operations as HPQ stock demonstrated modest upward movement. The technology giant will leverage OpenAI’s Frontier platform to enhance customer engagement, strengthen partner relationships, boost employee efficiency, and accelerate software innovation. HPQ shares settled at $22.88, declining 0.17%, though pre-market activity showed improvement with prices reaching $22.97.
HP Integrates AI Technology Throughout Customer And Partner Ecosystems
HP outlined plans to transform operational processes across its worldwide infrastructure through this strategic alliance. The technology company intends to integrate AI capabilities with retail locations, partner platforms, messaging services, and voice communication channels. Consequently, both customers and business partners should experience accelerated support delivery and enhanced workflow clarity.
According to the company’s statement, Frontier will enable more unified interactions across multiple customer engagement platforms. HP intends to deploy the technology for standard operations, problem-solving workflows, and technical assistance. Furthermore, the organization anticipates AI-driven tools will enhance analytics capabilities and customer data monitoring.
This implementation follows an evaluation period that commenced in February 2026. Throughout this testing phase, HP assessed Frontier’s technological capabilities, security architecture, platform functionality, and enterprise compatibility features. Following successful pilot programs, HP committed to a comprehensive strategic alliance with OpenAI.
OpenAI Frontier Powers HP’s Enterprise-Wide Digital Evolution
HP represents among the initial major multinational corporations to implement OpenAI’s Frontier platform across enterprise-level operations. The organization intends to optimize applications as the collaboration expands throughout various divisions. Target areas encompass customer assistance, partner enablement, workforce efficiency, and application development.
HP additionally intends to jointly create emerging AI applications with OpenAI. Nevertheless, these solutions must satisfy HP’s stringent requirements for data connectivity, oversight protocols, and security measures. Accordingly, the collaboration emphasizes both operational effectiveness and regulated enterprise implementation.
The organization positions AI as a fundamental operational infrastructure throughout its enterprise. This methodology transitions AI from experimental projects into comprehensive internal platforms and customer-facing operations. It further demonstrates HP’s extensive initiative to embed AI within routine business functions.
HP Advances Workplace Evolution Through AI Hardware And WXP Solutions
HP connected the OpenAI collaboration to its comprehensive workplace modernization vision. The corporation anticipates collaborative interactions between personnel and AI systems throughout professional settings. HP is engineering autonomous AI hardware designed to integrate with current organizational infrastructure.
The company additionally plans equipment featuring specialized processors for persistent AI computation. These offerings address operations requiring uninterrupted processing capabilities and dependable local performance. Ultimately, HP seeks to position AI functionality closer to employee work locations.
HP’s Workforce Experience Platform complements this organizational approach. The system coordinates entire inventories of personal computers, professional workstations, printing equipment, and teamwork technologies through a unified dashboard. Through OpenAI Frontier and WXP integration, HP pursues expanded AI-enabled workflows spanning customers, partners, and workforce members.

Galaxy Digital cut its probability estimate for the CLARITY Act becoming law in 2026 to a 50-50 outcome, arguing that the US Senate is facing a shrinking window to advance the digital-asset bill before lawmakers depart for its August recess. The firm’s head of firmwide research, Alex Thorn, said the change reflects timing pressures rather than a sudden shift in the bill’s underlying policy merits.
Thorn pointed to structural hurdles in the Senate—most notably the absence of a single, unified text spanning the Senate Banking and Agriculture committees, uncertainty around when the bill might reach the floor, and an increasingly tight legislative calendar. In parallel, he said political maneuvering over other high-profile legislation has intensified competition for limited Senate scheduling time.
Key takeaways
- Galaxy Digital reduced its 2026 odds for the CLARITY Act passing to 50%, citing Senate floor-time uncertainty and a narrowing timetable.
- The firm previously estimated 60% after lowering its forecast on June 9 from 75% set just weeks earlier on May 22.
- Thorn said the downgrade is primarily about timing, not whether the CLARITY Act’s substance has gained or lost support.
- US Senate scheduling constraints are being heightened by competing legislative priorities, including the SAVE Act debate.
- Although the bill cleared the Senate Banking Committee in May, lawmakers still must find a feasible path through the full Senate before the August recess.
Galaxy’s odds cut tracks a tighter Senate path
In a post shared via Alex Thorn’s social account, Galaxy said it is lowering its projected odds of CLARITY Act passage in 2026 to “50-50.” Thorn framed the adjustment as a response to the Senate’s calendar realities—specifically, the likelihood that even a bill with bipartisan backing may fail to secure enough procedural and scheduling bandwidth to reach a final vote.
The update comes after Galaxy changed its estimate multiple times in recent weeks. On June 9, Galaxy lowered its forecast to 60% from a prior 75% estimate. Earlier, on May 22, the firm raised its odds to 75%, signaling that it believed the bill’s momentum could be sustained.
Thorn emphasized that the downgrade should not be interpreted as a commentary on the bill’s policy direction. Instead, he said the core problem is “timing”—including a lack of clarity on whether a Senate Banking-Agriculture unified version exists that can move through the chamber, and whether leadership can allocate the bill a meaningful slot on the floor.
August recess looms as competing fights intensify
Galaxy’s argument is anchored in the Senate’s near-term schedule. According to the US Senate’s legislative timetable, the chamber entered a work period Monday through July 10. The Senate is also expected to begin its traditional August recess on Aug. 8 for roughly five weeks, before returning Sept. 14.
Thorn suggested the path to passage grows harder as the calendar compresses. He warned that lawmakers are dealing with an “already crowded queue” for floor time and said debate over the SAVE Act has added another “contentious” and resource-heavy fight into the same scheduling bottleneck.
Thorn further noted that the broader legislative environment includes other unfinished and politically sensitive items, which can make it harder for any single bill—especially one requiring coordination across committees—to gain priority. He cited Section 702 of the Foreign Intelligence Surveillance Act (FISA) and the National Defense Authorization Act (NDAA) for fiscal year 2027 as additional “must-pass” targets that often draw political attention.
In this context, the CLARITY Act’s timeline is also under scrutiny. The bill is scheduled for a House hearing on July 17, and it is intended to establish the first regulatory framework for digital assets in the United States.
Where the CLARITY Act stands—and why pushback persists
While the CLARITY Act has advanced in Congress, it has not escaped controversy. The bill cleared the Senate Banking Committee in May, but according to coverage at the time, most Democrats on the committee and parts of the banking industry pushed back. Critics argued that the bill could permit crypto firms to offer yield products connected to stablecoins without meeting the same requirements imposed on traditional financial institutions.
Regulatory and public-safety objections have also surfaced from outside the banking sector. Earlier reporting noted that groups including law enforcement organizations and coalitions of Catholic organizations contacted White House officials with concerns that the CLARITY Act could create oversight gaps related to illicit activity.
At the same time, industry advocates continue to press for movement. At the beginning of June, over 200 crypto firms and organizations urged the Senate to pass the CLARITY Act in a letter shared by the crypto lobbying group Stand With Crypto, underscoring that supporters are working to keep momentum alive even as schedule pressure increases.
What to watch as timing becomes the deciding factor
With Galaxy now treating 2026 passage as a coin flip, the practical question for market participants is whether the Senate leadership can align committee processes and secure floor time before the August recess. The next developments to monitor are procedural: whether a workable, unified Senate text emerges; what the Senate leadership’s floor schedule ultimately looks like; and how the SAVE Act and other high-priority “must-pass” items affect what can realistically be brought to a vote.


The locked capital needed for a MiCA spot license is relatively small, somewhere between 50,000 euros ($57,000) and 150,000 euros by class, according to Patrick Gruhn, founder and CEO of Perpetuals.com Ltd. (PDC).
What becomes costly is the license itself, which can be as high as 700,000 euros in year one and 250,000 euros a year after for a lean firm, or into the millions for a large exchange, Gruhn said via email. “Call it 12–24 months to the first authorized trade with maybe €100k lawyer fees,” he said.
As for the number of jobs that could be lost due to MiCA, no reliable estimate exists. However, many of the 80% of pre-MiCA platforms facing extinction are tiny shell entities, Gruhn said.
“That overstates the situation significantly,” Gruhn said. “And much of it is reallocation, since licensed firms have to hire compliance staff and the offshore ones don’t.”
Changing environment
Nevertheless, MiCA threatens to stifle crypto as an industry in some countries. The situation is particularly harsh in Poland, where domestic legislative delays and presidential vetoes have meant the Polish Financial Supervision Authority (KNF) has faced roadblocks in establishing a fully functional crypto application and licensing regime.
Mateusz Kara, CEO of Morphic Financial Group, which is headquartered in London and has deep roots and operations in Poland, said the MiCA deadline could “wipe out Polish crypto.”

If you’ve been in the crypto industry for a while, you’re undoubtedly aware of market cycles.
They tend to revolve around Bitcoin’s halving, which usually acts as a catalyst for an incoming bull run. Many have expressed doubts about this theory, but so far it appears to be playing out incredibly accurately.
Let’s dive in and see if we can estimate when this downturn could end, taking into account previous market behavior.
What the Previous Cycles Suggest
The first reference point is the price increase from Bitcoin’s 2015 low to its 2017 high. This period lasted roughly 1064 days (this may vary depending on the exchange data you use, but it’s a very accurate estimate). From then, the bear market lasted until the low on December 15th, 2018. This created a 363-day top-to-bottom window. The market then spent months recovering, but the main capitulation low had already been set.
The second reference point is the cycle that began after the December 2018 low and lasted until the 2021 high on November 10th. This time, it took Bitcoin 1062 days to complete the cycle (about the same as the previous cycle). From there, BTC started declining into bear market territory, which ultimately bottomed on November 21, 2022.
That took 376 days, only 13 days longer than the previous cycle. Despite different macro conditions, different market participants, and a larger crypto ecosystem, the timing was alarmingly close.
Here’s where it gets interesting. From the low in 2022 to the high achieved on October 6th, 2025, it’s around 1051 days – more or less the same. Following that logic and using a historical average of 363 to 376 days from top to bottom, the current bear market might reach its lowest point between October 4 and October 17, 2026. Make of this what you will.
This is a Window, not a Prediction
Now, this kind of cycle analysis could be useful, but it should never be treated as a guaranteed forecast – previous results do not promise future ones. Bitcoin’s future bottom will heavily depend on liquidity, interest rates, ETF flows, regulation, miner behavior, leverage, broader risk appetite, geopolitics, and more. A major macro shock could accelerate the decline, while strong institutional demand could easily shorten it.
Still, this pattern is worth watching. It gives some sort of a framework. If Bitcoin tops around October 2025, history suggests the most important low may not arrive in the next few days or weeks. It may take another few months of correction and eventual capitulation before the conditions reset.
For now, the historical model points to one key window: October 2026.
The post Bitcoin Cycle Timing: Could the Next BTC Bottom Arrive in October 2026? appeared first on CryptoPotato.

Key Takeaways
- ASML shares currently hover around $1,841, within a 52-week trading band of $683.48 to $1,959.04, commanding a $724 billion market valuation
- The company’s order backlog stays robust as semiconductor manufacturers reserve EUV machinery years ahead, guaranteeing revenue visibility
- Revenue from installed base operations reached €2.49 billion in Q1 2026, climbing from €2.13 billion in the preceding quarter
- Management elevated full-year 2026 sales outlook to €36–€40 billion, while earnings per share are projected to surge 33% in the coming year
- Analyst consensus leans Moderate Buy with a mean price objective of $1,772.62; Bank of America maintained its Buy stance and increased its target
ASML began Friday’s session at $1,841.18. This represents a dramatic recovery from the 52-week floor of $683.48, and approaches the ceiling of $1,959.04. Following such a substantial appreciation, investors naturally wonder: does meaningful upside remain?
The current valuation demands attention. ASML commands approximately 49.9x this year’s anticipated EPS of just under $36. This multiple significantly exceeds its historical average in the mid-30s range. For typical corporations, such pricing would trigger caution.
Yet ASML operates in a category of its own.
The Dutch company maintains an uncontested monopoly on Extreme Ultraviolet lithography equipment — the critical machinery enabling cutting-edge semiconductor production. Manufacturing 2-nanometer chips is impossible without this technology. No competing suppliers exist.
Each unit commands a price exceeding $350 million and requires months for assembly, precision calibration, and delivery. Customers don’t simply submit purchase orders — they reserve manufacturing capacity years into the future. This represents far more than a healthy sales funnel. It constitutes structural market control.
Order Backlog and Service Revenue Drive Fundamentals
Q1 2026 net revenue totaled €8.77 billion, representing a decline from Q4 2025’s €9.72 billion. At first glance, this suggests weakening momentum. The reality differs considerably.
ASML’s quarterly revenue fluctuates based on delivery schedules rather than underlying demand. Every system the company manufactures already has a committed buyer. The quarter-over-quarter decrease reflects production capacity constraints, not softening customer appetite.
The more revealing metric comes from installed base management. This revenue category — encompassing maintenance and enhancement of existing deployed systems — registered €2.49 billion in Q1, advancing from €2.13 billion the prior quarter. It delivers predictable, margin-rich, and expanding cash flows.
Executives lifted full-year 2026 guidance to a revenue corridor of €36 billion to €40 billion. The latter half of the year should show acceleration, powered by increasing system deliveries.
TSMC, Intel, and Samsung are all expanding fabrication facilities to satisfy AI infrastructure requirements. These facilities require ASML’s equipment. Hyperscaler capital spending is forecast to nearly double from $427 billion in 2025 to beyond $860 billion by 2027.
Profit Margin Improvement Represents the Upcoming Driver
EPS consensus forecasts indicate 33% expansion next year. This figure anchors the bullish investment thesis.
The route to that outcome flows through margin enhancement. ASML is shifting from limited-volume, early-phase production of its latest systems — including the high-margin High-NA EUV platform and the NXE:3800 series — toward standardized, volume-scale manufacturing. Fixed expense allocation improves across larger unit counts. Gross margins should progress toward management’s 2030 objective of 56%–60%.
One notable risk persists. China continues to represent approximately 19% of ASML’s revenue, and export limitations remain an active concern. Dutch government representatives are reportedly advocating against stricter restrictions on equipment sales to Chinese customers. Any intensification on this front could constrain sales.
Decker Retirement Planning recently established a fresh $4.23 million stake in ASML. Dimensional Fund Advisors maintains ownership exceeding 990,000 shares. Institutional holdings comprise 26.07% of outstanding equity.
Goldman Sachs, Citigroup, Morgan Stanley, and Deutsche Bank all maintain Buy ratings or equivalents. Bank of America elevated its price objective citing improved earnings projections for 2027 and 2028.
The consensus mean target stands at $1,772.62, though an alternative analyst cohort establishes it at $2,019 — suggesting approximately 12.5% appreciation potential from present levels.

Key Takeaways
- ASTS shares rallied approximately 11% Thursday following the company’s announcement of three additional BlueBird satellites scheduled for August launch via SpaceX Falcon 9.
- The updated deployment timeline positions AST for launches every two months, enabling up to 18 satellite deployments annually.
- Twenty-four satellites (BlueBirds 14-37) are currently in production, with orbital deployment expected by late 2027.
- Institutional ownership stands at roughly 61% of outstanding shares; company insiders have liquidated over $280 million in stock during the past 90 days.
- Wall Street consensus leans toward “Reduce” with an average price target of $85.09; shares opened Monday trading at $71.57.
AST SpaceMobile (ASTS) shares surged approximately 11% during Thursday’s session, closing at $71.58. While no immediate news triggered the rally that day, the momentum followed the company’s recent announcement of an accelerated satellite deployment strategy that captured investor attention.
Earlier during the week, the company disclosed that its upcoming trio of BlueBird satellites—units 11, 12, and 13—are slated for an August liftoff using SpaceX’s Falcon 9 launch vehicle. This announcement arrives on the heels of the successful June 17 deployment of BlueBirds 8, 9, and 10.
The consecutive launch schedule establishes a rhythm of approximately one deployment every eight weeks, potentially enabling an annual deployment rate of 18 satellites.
AST is presently manufacturing 24 additional satellites—BlueBirds 14 through 37. Maintaining the current timeline, the company projects these units will achieve orbit before 2027 concludes, coinciding with the planned commencement of beta operations for its direct-to-cell (DTC) connectivity network.
The European market is also entering the picture. Statements connected to a Vodafone-supported deployment identified Spain as a potential early commercial territory, with service potentially beginning in 2027—strengthening the company’s international monetization narrative.
Wall Street’s Take: Ratings and Target Prices
Despite investor optimism reflected in recent price action, analyst sentiment remains tepid. The consensus rating on ASTS currently registers as “Reduce,” with analysts projecting an average fair value of $85.09.
Deutsche Bank recently downgraded the stock from buy to hold while trimming its price objective from $117 down to $106. B. Riley shifted to a “neutral” stance with an $85 valuation. Among the more optimistic voices, Roth MKM maintains a “buy” recommendation alongside a $108 price target.
Among the ten analysts providing coverage, just one rates the stock a buy. Six recommend holding. Three advise selling.
Technically, the stock’s 50-day moving average sits at $87.18, while the 200-day average rests at $89.23—both considerably above current price levels.
Heavy Insider Liquidation Draws Attention
A notable development that investors cannot overlook: significant insider selling activity.
During the past three months, company insiders have offloaded more than 3.1 million shares valued at approximately $280.6 million. This includes CFO Andrew Martin Johnson, who disposed of 45,809 shares at an average price of $93.81 on June 11, trimming his holdings by 8.34%.
Director Julio A. Torres separately sold 15,000 shares at $76.34 during May, reducing his position by roughly 26%.
Insiders currently control 20.89% of outstanding shares, while institutional investors hold 60.95%.
SG Americas Securities LLC expanded its ASTS position by 18.6% during Q1, purchasing an additional 11,813 shares to reach a total holding of 75,157.
Regarding financial performance, AST’s first quarter results disappointed. The company reported an EPS loss of -$0.66, significantly worse than the -$0.23 consensus estimate. Revenue totaled $14.73 million, falling short of the $39.01 million analyst projection.
Full-year EPS is forecast at -$1.47. The stock has traded within a 52-week range spanning from $36.08 to $133.86.

AUD/USD: Will the RBA Be Able to Keep Its Currency Strong?

Joe Biden Calls Donald Trump a Loser Amid Lincoln Pool Fail
Kate Middleton shares powerful cancer update after completing Three Peaks Challenge


-
 Sports6 days ago
Two goals and an assist by sheer aura: Cristiano Ronaldo just entered the World Cup chat
-

 Tech7 days ago
Microsoft accidentally kills epic Outlook email threads
-

 Fashion3 days ago
Weekend Open Thread: Staud – Corporette.com
-

 Politics3 days ago
The House | Manchesterism won’t survive the painful trade-offs unless it gets citizens on board
-

 Politics3 days ago
Potential 2028er World Cup attendee leaderboard
-

 Business3 days ago
Asia stock markets slide as tech shares slump
-

 Tech4 days ago
A Look At A Gaggle Of Transputer Boards
-
Crypto World5 days ago
Bitcoin (BTC) Dips Below $62K, Ethereum (ETH) Plunges 6% Daily: Market Watch
-
 Crypto World4 days ago
Dell (DELL) Shares Tumble Over 5% Following Analyst Downgrade to Hold
-

 Crypto World5 days ago
Securitize Wraps Roubini's SEC-Registered ETF as Dubai VARA Digital Security
-
Business5 days ago
Entergy settles forward sale agreements, raises $672 million in cash proceeds
-

 Crypto World2 days ago
Kraken's xStocks Opens Bending Spoons IPO Registration to EEA Retail
-

 Sports3 days ago
FIH Pro League: India defeat Pakistan 7-1, register biggest win of campaign | Other Sports News
-

 Crypto World2 days ago
Coinbase, Circle Deepen Crypto Stock Losses Despite Resilient S&P 500
-
Crypto World3 days ago
Hyperliquid Named on Singapore MAS Investor Alert Register
-

 Crypto World3 days ago
RTX holders must register wallets before token distribution begins
-

 News Videos16 hours ago
MAJOR BITCOIN & MARKET UPDATE!!!! (MUST WATCH ASAP!!!)
-

 Tech1 day ago
Bluekit phishing kit adopts browser-in-the-middle for login theft
-

 Tech2 days ago
Russian hackers now target Signal backup recovery keys
-

 Sports4 days ago
India vs Bangladesh LIVE Score, Women’s T20 World Cup: Bangladesh Opt To Bat; India Enter ‘Do-Or-Die’ Stage As Semi-Final Race Heats Up
You must be logged in to post a comment Login