

Crypto World
Bittensor (TAO) price prediction: The halving effect

Bittensor cut its emissions in half in December, and roughly 70% of the supply is locked in staking. The supply side looks tight, but a halving only moves price if demand shows up to meet it.
Summary
- Bittensor (TAO) ran its first halving on Dec. 12, 2025, cutting daily emissions from 7,200 to 3,600 TAO against a fixed 21 million cap, the same hard-cap design Bitcoin uses.
- TAO trades near $250 as of late June 2026, roughly 65% below its early-2024 record near $757, ranked around #27 to #37 with a market cap close to $3 billion and only about 11 million tokens in circulation.
- The bull case rests on a tightening float: with around 70% of supply staked for roughly 10% yield, the halved emissions slowly thin out sell-side pressure, which can lift price if demand holds or grows.
- The bear case is that a halving is a supply event the market already knew about, and TAO’s real problem is proving its subnets capture lasting value instead of riding AI-narrative momentum that fades.
- Analyst forecasts for 2026 run wide, from Gate near a $236 average to Coinpedia eyeing a $500 reclaim, with the outcome hinging on subnet revenue, ETF flows, and the broader AI trade more than on the halving alone.
Bittensor’s first halving is already in the past. It happened on Dec. 12, 2025, and the daily issuance of TAO dropped from 7,200 tokens to 3,600 overnight. So the live question for 2026 is not whether the halving will happen. It is what a halving actually does to a token whose price sits 65% below its record, whose technical picture is bearish, and whose deeper story is still unproven. The supply math is real. Whether it matters depends on demand, and that is the harder part of the forecast.
This piece walks through how the Bittensor halving works, why a supply cut takes months to filter into the market, the demand-side question the halving does not answer, what the charts say at current levels, the institutional wildcard around a possible spot ETF, and where analysts think TAO could trade in 2026. It closes with bull, base, and bear scenarios and a short FAQ.
How the Bittensor halving actually works
Bittensor is an open marketplace for machine intelligence. Models, compute, and data compete inside specialized markets called subnets, and the network scores their output through a mechanism known as Yuma Consensus.
TAO is the settlement token that pays for useful work and secures the network through staking. The protocol was started in 2019 by AI researchers Ala Shaabana and Jacob Steeves, and its token design borrows directly from Bitcoin: a fixed cap of 21 million coins and a halving schedule that cuts new issuance over time.
The December 2025 halving was the first of these events. Daily emissions fell from 7,200 TAO to 3,600. In plain terms, the network now mints half as much new TAO each day as it did before. Miners and validators who earn TAO for their contributions receive a smaller flow of new tokens, which over time means less fresh supply hitting the market. The mechanism is the same logic that underpins Bitcoin halvings, where reduced issuance has historically preceded periods of price strength, though the cause and effect is never as clean as the charts make it look in hindsight.
The key difference between a halving in theory and a halving in practice is timing. Issuance dropped instantly on the halving date, but the effect on circulating supply is gradual. The tokens already in circulation do not disappear, and the slower drip of new supply only changes the balance of buyers and sellers over weeks and months, not in a single candle. That is why the halving is better understood as a structural shift in the background rather than a switch that flips price higher on the day.
Why the supply cut takes months to bite
The most important number for the supply thesis is not the emission rate. It is how much TAO is locked away and cannot be sold. Roughly 70% of the circulating supply is staked by validators and delegators, who earn an annual yield in the region of 10% for securing the network. Staked tokens are not idle, but they are also not sitting on exchange order books waiting to be dumped. That combination, halved emissions plus a high staking ratio, is what makes the Bittensor float look unusually thin compared with most tokens of similar size.
Here is the chain of logic the bulls lean on. New supply has been cut in half. A large majority of existing supply is staked and earning yield, so holders are paid to keep it locked. If demand for TAO stays flat or rises while the liquid, sellable float shrinks, the price pressure shifts upward over time. This is the classic supply-shock argument, and on paper it is coherent. With only about 11 million of the 21 million cap in circulation and most of that staked, the genuinely tradable supply is a fraction of the headline number.
The honest caveat is that supply shocks are slow and conditional. The phrase doing the heavy lifting is “if demand stays flat or rises.” Reduced emissions cannot lift a price by themselves if buyers walk away faster than sellers do. Through the first half of 2026, that is roughly what happened: TAO slid toward $200 in early June before rebounding, even though the halving was months in the rearview mirror. The supply setup was already in place, and it did not stop the drawdown. The lesson is that the halving loads the spring, but something on the demand side has to pull the trigger.
The demand side the halving does not solve
This is the part of the forecast that actually decides where TAO goes, and it has nothing to do with the halving. Bittensor’s value depends on whether its subnets capture real, durable economic demand for machine intelligence, or whether TAO is mostly a high-beta proxy for AI enthusiasm that rises and falls with the narrative.
There is a real case to make. The subnet ecosystem has expanded past 120 active markets, each handling a specialized task such as inference, compute, data, or prediction. The network reported around $43 million in Q1 2026 revenue from AI services, which is a concrete sign that money is moving through the system instead of just speculation.
The Dynamic TAO, or dTAO, upgrade lets subnets allocate emissions based on real demand instead of fixed rewards, which is meant to price intelligence by the market and push Bittensor from a research project toward actual economic activity. The ambition is large: to be the settlement layer for intelligence itself, the place where models, compute, data, and incentives meet in one market.
The bear reading is that this is still unproven, and the network has shown it can break. In April 2026, a high-profile subnet exit triggered a roughly 25% price drop, exposing how much concentration and governance fragility sit underneath the optimistic story. The market punished the weak decentralization signal fast.
The deeper worry is value capture: even if subnets generate revenue, it is not yet clear how much of that value flows back to the TAO token itself rather than to the subnet operators or token holders downstream. An AI token can have busy subnets and still struggle to translate that activity into sustained token demand.
When AI excitement runs hot across the market, TAO tends to jump, and when attention rotates elsewhere, it tends to fade. That correlation is the bear case in one sentence: if TAO is mostly AI-hype beta, the halving will not save it.
What the charts say right now
At current levels near $250, TAO sits in a bearish-to-neutral technical posture. Through June, it traded below the cluster of 50-day, 100-day, and 200-day exponential moving averages sitting roughly between $256 and $270, which means the medium-term trend has been pointing down and that band overhead acts as resistance. Momentum readings have hovered in weak-to-neutral territory, with relative strength index values in the mid-30s to mid-50s depending on the day, not oversold enough to scream reversal and not strong enough to confirm one.
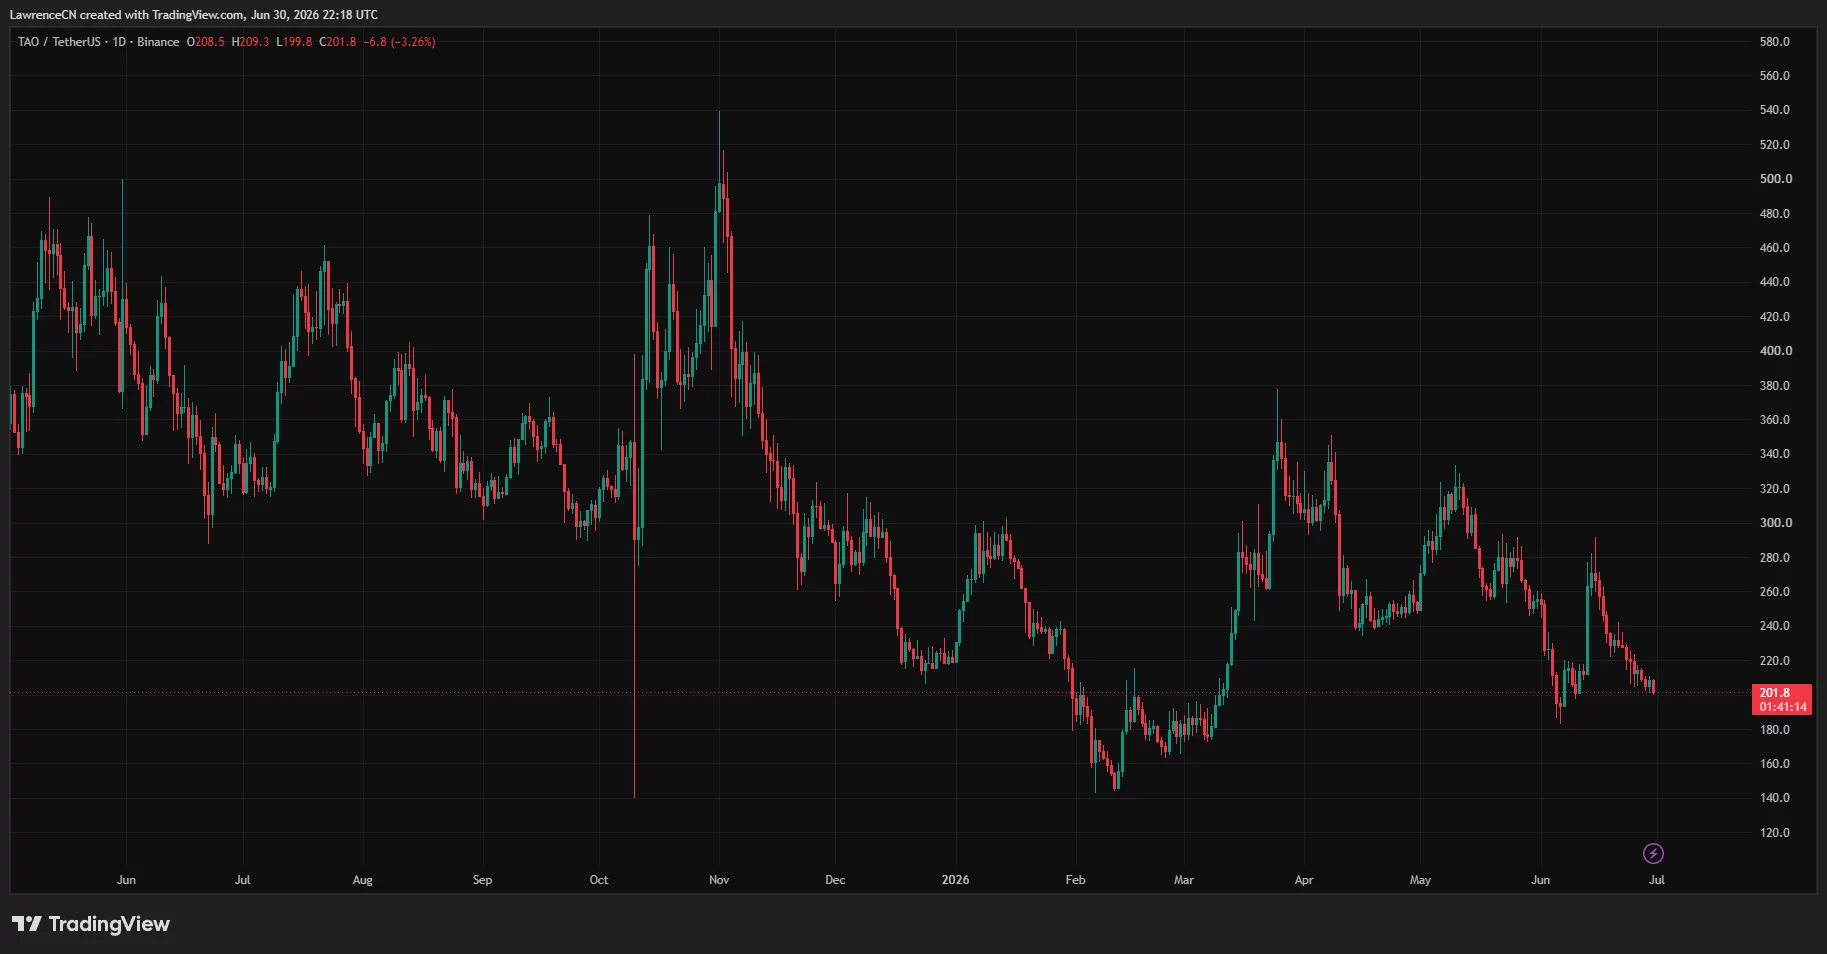
The levels traders watch are clear. On the downside, the $200 area has acted as a line in the sand through June, and a decisive break below it opens the door toward the February low near $163. On the upside, the first hurdle is reclaiming that $256 to $270 moving-average band, and above it the structure points toward $352 and then $396, the levels several analysts flag as the gateway to a larger move.
The longer-term chart frames the whole range: an accumulation floor around $160 to $200 and a distant ceiling near the $720 to $760 zone that produced the record in early 2024. TAO has cycled inside that channel before, finding demand at the lows and heavy profit-taking at the highs.
The takeaway from the charts is that TAO is not in a breakdown, but it is not in an uptrend either. It needs to reclaim its moving averages before the supply thesis gets any technical confirmation, and until it does, the halving narrative is a fundamental tailwind fighting a bearish trend.
The institutional wildcard
The most underpriced catalyst in the TAO forecast may be the one that has nothing to do with the chart. Grayscale filed an S-1 for a Bittensor trust on Dec. 30, 2025, and its Grayscale Bittensor Trust is already live over the counter, giving accredited investors a regulated wrapper for TAO exposure. Bitwise has also filed for a spot TAO product, with a U.S. regulatory decision expected around August 2026. The exact timing is not guaranteed, and approval is not certain, but the direction of travel matters.
The reason this is a wildcard rather than a sure thing is the corridor it opens. Once an asset is treated as ETF-eligible, it stops being dismissed as a pure speculation and starts being treated as infrastructure exposure that funds can hold without touching spot crypto directly. Bitcoin went through this in its earlier institutional phase, and Ethereum followed.
TAO is now entering the same corridor as the leading decentralized-AI asset. Anticipation alone can move price, because spot buyers tend to position early when future access looks credible.
There is a broader narrative tailwind too. When confidence in centralized AI wobbles, capital has flowed toward decentralized alternatives, and one such episode pushed an estimated $2.87 billion into AI crypto tokens inside a single week. TAO is the default beneficiary of that rotation given its position as the category leader by market cap. The flip side is that this same dependence on the AI narrative is exactly the fragility the bears point to: flows that arrive on a narrative can leave on one too.
What analysts forecast for TAO in 2026
Forecasts for TAO in 2026 span an enormous range, which is itself the honest signal: the outcome depends on variables no model can pin down. The figures below are third-party projections, presented as a spread of views, not as targets this publication endorses.
On the cautious end, Gate’s model centers 2026 around an average near $236, with a projected low close to $130 and a high around $318, essentially expecting TAO to hold near current levels with wide swings. Coindataflow’s experimental forecast sits in a similar low band, with a 2026 high near $281. In the middle and higher, Changelly’s analysis points to a 2026 range of roughly $388 to $472 with an average near $402, while Cryptopolitan’s technical read frames a $134 to $570 band with an average around $475.
Coinpedia takes a more constructive technical view, arguing that if TAO clears resistance at $352 and $396 in the 1st half of the year, the path opens toward a $500 reclaim. Looking further out, long-term projections from several of these firms cluster in a $900 to $3,000 range for 2030, premised on decentralized AI demand expanding and TAO holding its category lead.
The width of that spread, from a low near $130 to highs above $570 in the same year, is not a failure of analysis. It is an accurate reflection of how much hinges on whether subnet demand compounds, whether an ETF arrives, and whether the AI trade stays in favor. The halving sets the supply backdrop. These other forces decide the magnitude.
How the Bittensor halving compares with Bitcoin’s
The halving thesis borrows its emotional weight from Bitcoin, where four-year supply cuts have lined up with major bull runs. The comparison is useful, but it breaks down in ways that matter for the forecast. Bitcoin’s halving reduces the new supply paid to miners who secure a settlement network whose demand driver is, broadly, monetary: people want to hold Bitcoin as a store of value.
Bittensor’s halving reduces the new supply paid to miners and validators who produce and verify machine intelligence, and TAO’s demand driver is supposed to be usage of that intelligence through subnets. Those are different engines.
The practical consequence is that a Bittensor halving cannot lean on the same reflexive narrative. Bitcoin’s halvings work partly because a huge population of holders believes they work, which makes the belief partly self-fulfilling. TAO does not yet have that scale of conviction, and its price has shown it: the token fell after the December halving instead of rallying on it, because the AI-token market cared more about subnet performance and the broader risk environment than about a supply chart. The halving is real and structurally helpful, but anyone modeling TAO on a clean Bitcoin-style post-halving curve is importing an assumption the data has not yet earned.
There is also a proportionality difference. Bitcoin’s reduced issuance is a small fraction of its already-large circulating supply, so the supply effect is gradual while the narrative effect is immediate.
For TAO, the emission cut is proportionally larger against a much smaller circulating base, which should make the mechanical supply effect more potent over time, yet the narrative effect is weaker because fewer participants treat the halving as gospel. The net is a token where the fundamentals of the halving may matter more than they do for Bitcoin, while the storytelling matters less.
The deeper design point sits underneath all of this. Bittensor was built by Ala Shaabana and Jacob Steeves in 2019 around Yuma Consensus, the mechanism that scores and rewards useful machine-intelligence work. That design is what lets the network claim it pays for output instead of raw hardware uptime, and it is the foundation of the value-capture argument. The halving sharpens the supply side of that design, but it does not resolve whether the scoring turns into durable token demand, which remains the open question the price keeps asking.
What to watch through the rest of 2026
For readers tracking TAO instead of chasing headlines, a short list of signals will reveal which scenario is unfolding well before the price confirms it. The first is subnet revenue: the roughly $43 million reported for the first quarter is the number to watch for growth, because rising real revenue is the strongest evidence that the value-capture story is working instead of stalling. The Second is the moving-average band between $256 and $270; reclaiming and holding above it would be the first technical sign the bearish trend has turned.
The third is the ETF timeline, with a U.S. decision expected around August 2026. An approval, or even rising odds of one, would open the institutional corridor the bull case needs, while a denial or a delay removes a catalyst the market has started to anticipate.
The fourth is governance stability: after the April subnet exit that triggered a 25% drop, any repeat of concentration or governance trouble would confirm the fragility the bears emphasize and could undo months of recovery in days. The fifth is the health of the broader AI trade, since TAO has behaved as a high-beta proxy for AI sentiment, and a rotation out of AI tokens would pressure it regardless of its own progress.
Watched together, these five tell a more reliable story than any single price target. If subnet revenue climbs, the moving averages flip, and the ETF path advances, the supply setup from the halving finally has demand to work with, and the bull case gains real footing. If revenue stalls, governance wobbles, and the AI trade cools, the thin float will amplify the downside instead of cushioning it. The halving set the stage in December. These signals decide whether anyone shows up to use it.
Bull, base, and bear scenarios for TAO
The scenarios below combine the supply setup with the demand and institutional variables that actually drive the outcome. They are illustrative ranges built from the third-party forecasts above and current market structure, not guarantees.
Bull case
In the bull scenario, the halving thesis works as designed and demand shows up to meet the tightening float. Subnet revenue keeps climbing from the $43 million Q1 pace, dTAO routes emissions toward markets with real usage, and the value-capture question starts to resolve in TAO’s favor. A spot ETF decision lands favorably or looks likely, pulling regulated capital into a thin float where roughly 70% of supply is staked and out of reach. TAO reclaims the $256 to $270 moving-average band, breaks $352 and $396, and runs toward the $500 area that Coinpedia and others flag, with the more aggressive long-term models pointing higher into 2027 if the AI trade stays hot. This case depends on the AI narrative staying strong and the network avoiding another governance shock.
Base case
In the base scenario, the halving slowly does its quiet work but no single catalyst fires hard. Subnet activity grows unevenly, the ETF path advances but without a clean approval inside 2026, and the AI trade runs warm instead of euphoric. TAO spends the year chopping inside its broad trading channel, roughly between the $200 floor and the low-$400s, with the average landing near the $236 to $402 zone that the Gate and Changelly models bracket. The thin float keeps downside contained on dips, but the unproven value-capture story caps rallies. This is the “constructive but unconfirmed” outcome where the supply setup helps at the margin without overpowering a cautious market.
Bear case
In the bear scenario, the halving is revealed as a supply event the market already priced, and TAO behaves as AI-hype beta. The value-capture question stays unanswered, another subnet exit or governance dispute dents confidence the way April’s did, and the broader AI trade rotates out. TAO loses the $200 floor and slides toward the February low near $163 or lower, with the bearish low-end forecasts near $130 coming into view. In this case, the staking lockup offers little protection, because holders unwind positions when yield no longer offsets falling token value, and the thin float that amplifies rallies amplifies declines just as efficiently.
Frequently Asked Questions
When was the Bittensor halving and what changed?
The first Bittensor halving took place on Dec. 12, 2025. Daily TAO emissions were cut in half, from 7,200 tokens to 3,600. The network follows a Bitcoin-style design with a fixed 21 million supply cap, so issuance steps down over time. The supply effect is gradual, filtering into circulating supply over months instead of moving price on the halving date itself.
Does a halving guarantee TAO goes up?
No. A halving reduces the rate of new supply, which can support price if demand holds or grows, but it cannot lift a token on its own. TAO slid toward $200 in the months after the December halving before rebounding, which shows that reduced emissions do not override weak demand or a bearish trend. The halving loads the supply side, but demand has to do the rest.
Why is roughly 70% of TAO staked, and why does it matter?
Holders stake TAO to help secure the network through validators and delegators, and they earn an annual yield around 10% for doing so. Staked tokens are locked and not readily available to sell, which thins the liquid float. Combined with halved emissions, the high staking ratio is the core of the supply-shock argument, since it shrinks the genuinely sellable supply.
What is the biggest risk to the TAO forecast?
The biggest risk is that TAO is valued mostly on AI-narrative momentum instead of durable demand for its subnets. The subnet ecosystem generates revenue, but how much value flows back to the TAO token is unproven, and a high-profile subnet exit in April 2026 triggered a roughly 25% drop. If the AI trade cools or governance fragility resurfaces, the supply setup will not protect the price.
Could a spot TAO ETF change the picture?
Possibly. Grayscale’s Bittensor Trust is already live over the counter, Grayscale filed an S-1, and Bitwise has filed for a spot product, with a U.S. decision expected around August 2026. A favorable outcome would open a regulated channel for institutional capital into a thin float, which the bull case leans on. Approval and timing are not guaranteed, so it remains a catalyst to watch instead of a certainty.
Where do analysts think TAO could trade in 2026?
Third-party forecasts span a wide range. Cautious models such as Gate center near a $236 average with a low around $130, while higher views from Changelly and Cryptopolitan point to averages around $400 to $475 and Coinpedia flags a possible $500 reclaim if key resistance breaks. Long-term 2030 projections from several firms cluster between $900 and $3,000. The spread reflects genuine uncertainty about subnet demand, ETF flows, and the AI trade.
Disclaimer: This article is for information purposes only and does not constitute financial, investment, or trading advice. Cryptocurrency prices are highly volatile, and price predictions are speculative estimates that may not occur. Nothing here is a recommendation to buy or sell any asset. Always do your own research and consider consulting a licensed professional before making financial decisions. Figures are accurate as of June 30, 2026, and will change.

Ether has struggled to regain traction after failing to hold above the $1,600 area since Thursday, as a broader risk-off tone across crypto coincided with shifting expectations for macro policy. With oil prices easing and equities staying relatively supported, attention has leaned toward traditional markets—an environment that can drain momentum from high-beta assets like ETH.
Traders are now focused on whether ETH can defend the $1,500 support level. Negative flows into US spot Ether ETFs have erased recent “accumulation” narratives, while onchain signals—especially fading activity in Ethereum’s fee and decentralized application (DApp) economics—suggest the network’s incentives have not strengthened in tandem with tokenization ambitions.
Key takeaways
- US-listed spot Ether ETFs recorded net outflows of $345 million since June 17, counteracting ETH accumulation reported from Ether treasury-related companies.
- ETH’s pullback remains consistent with weak Ethereum fee and DApp revenue trends, which have not yet translated into stronger staking or ecosystem demand.
- Regulatory uncertainty in the US—around the proposed Digital Asset Market CLARITY Act—continues to complicate institutional confidence.
- Despite growing real-world asset (RWA) tokenization figures on Ethereum, the current pace of DeFi activity tied to tokenized assets remains limited.
Spot Ether ETF outflows overtake treasury accumulation
According to the figures cited in the source, US-listed Ether ETFs have seen $345 million in net outflows since June 17. That selling pressure has outweighed accumulation reported over the same period from Ether treasury strategies—specifically $182 million in ETH associated with BitMine Immersion (BMNR US) and Sharplink (SBET US).
Separately, the article notes that BitMine’s ETH holdings rose to 57 million, referencing earlier coverage from Cointelegraph. In practical terms for markets, the key issue is not whether ETH treasuries are buying, but whether those purchases are sufficient to absorb ETF-driven outflows. With spot ETF flows clearly running negative, near-term downside risk to ETH increases if demand fails to reappear.
That helps explain why traders are again prioritizing technical levels. If $1,500 does not hold, the narrative quickly shifts from “temporary correction” to a broader weakening in ETH positioning.
What’s weighing on ETH sentiment: regulation and capital rotation
Beyond ETF flows, the article points to US regulatory uncertainty as a continuing headwind. It highlights that the Digital Asset Market CLARITY Act has been awaiting a Senate vote since May 15. The bill is described as aiming to reduce “regulation-by-enforcement” and clarify which tokens are treated as securities.
However, lawmakers have raised objections related to stablecoin yield mechanics and anti-money-laundering standards. Even when a bill is seen by many market participants as supportive of decentralized finance, persistent uncertainty can delay institutional commitments—particularly for assets that remain highly sensitive to regulatory expectations.
Meanwhile, the source connects crypto’s muted tone to a stronger draw from traditional markets. Lower inflation expectations and ongoing focus on equities and earnings can support broader risk appetite, but it also tends to redirect incremental capital away from crypto if investors don’t see a clear catalyst specific to the sector.
Onchain economics: shrinking fees and DApp revenue
Ethereum’s current fundamentals, at least as reflected by onchain monetization, appear soft. The article cites DefiLlama data showing that Ethereum monthly network fees fell to $10.7 million in June, down from $24.4 million in April.
DApp revenue also declined: it reached $51.7 million in June, compared with $64.8 million two months earlier. The source lists several top contributors, including Sky (formerly Maker) at $12.7 million, Titan Builder at $7.2 million, and Chainlink at $4.6 million.
When fees and DApp revenue weaken, the incentive structure around ETH can look less compelling. The article argues that this contributes to a more inflationary supply dynamic and that staking yields remain limited—reducing the ecosystem’s “economic pull” for both holders and builders. It also notes that parts of DApp revenue that could otherwise reinforce the token economy flow back to users, which can further temper the case for sustained token price appreciation.
To be clear, this doesn’t mean Ethereum’s long-term thesis is broken. Instead, it suggests the network is not currently generating enough broad monetization to outweigh macro and flow-driven pressure.
Tokenization is rising, but DeFi incentives are not yet catching up
The article argues that tokenization remains early and that its long-term expansion could increase blockchain demand. It points to Ethereum real-world assets (RWA) activity, noting a tokenized market capitalization of $14.5 billion on Ethereum.
Yet the piece also emphasizes a gap: despite the growth in tokenized assets, that momentum has not produced meaningful DeFi activity so far. It also cites a staking yield of 2.7% alongside weak onchain metrics, concluding that the probability of ETH slipping below $1,500 remains “in play.”
This tension—rapid growth in one segment (RWA tokenization) alongside slower translation into ecosystem-wide DeFi traction—may be central to why ETH has struggled to regain strength. Investors may want confirmation that tokenization leads to higher fee-generating activity, deeper liquidity, and stronger DApp revenue—signals that, based on the cited numbers, have been deteriorating rather than improving.
Related coverage referenced in the source notes Ether treasury activity, including an earlier report that Sharplink bought $62.4M ETH last week. But until spot ETF flows stabilize and onchain economics improve, that kind of accumulation may have limited impact on near-term price behavior.
Looking ahead, the market’s next prompts are likely to be ETF flow direction, whether Ethereum’s fee and DApp revenue trends reverse, and any concrete progress on US regulatory clarity. If those catalysts fail to materialize, the $1,500 level remains the line traders will watch most closely.

HYPE got its first U.S. exchange-traded fund in May, ran 16 straight days of inflows, then saw money walk out the door. The ETF is a new demand channel, but the first outflow is the first test of it.
Summary
- Hyperliquid (HYPE) trades in the mid-$60s as of late June 2026, roughly 14% below its $76.67 record set on June 16, with a market cap near $14 billion to $16 billion and a fully diluted valuation around $60 billion.
- The Bitwise HYPE ETF launched on May 14, 2026, giving regulated investors a wrapper for HYPE exposure, after Bitwise had already listed a Hyperliquid staking product in Europe in April.
- The fund logged 16 consecutive days of inflows before its first daily outflow of nearly $3 million on June 5, a small figure in dollars but a notable turn in the early demand story.
- HYPE’s core engine is a buyback that routes 97% of protocol fees into purchasing and burning the token, which has retired over $1 billion of HYPE and pulled circulating supply below 300 million, working against a roughly 1.2 million monthly unlock to insiders.
- Forecasts run from Coinpedia’s high-$30s average to Arthur Hayes at $150, with prediction markets leaning toward HYPE clearing $80 by year-end, so the ETF flow and the buyback-versus-unlock balance, not any single target, will decide the path.
In May 2026, Hyperliquid crossed a line that most tokens never reach: it got its own U.S. exchange-traded fund. The Bitwise HYPE ETF gave ordinary brokerage accounts and institutions a regulated way to hold exposure to one of the most talked-about assets in crypto.
For 16 trading days, the money flowed in. Then, on June 5, it reversed, with the fund posting its first daily outflow of close to $3 million. The amount was tiny next to HYPE’s multibillion-dollar market cap, but the symbolism was real, and crypto.news flagged the turn at the time.
This piece looks at HYPE’s price through the lens of that ETF and its first outflow, which is a different question from whether HYPE can reach $100. It covers what the Bitwise fund changed, what the early outflow signals, the buyback engine the ETF flows into, the unlock overhang pulling the other way, the regulatory cloud overhead, where the chart sits, and what analysts and prediction markets expect. It closes with bull, base, and bear scenarios and a short FAQ.
The Bitwise ETF and why it mattered
The Bitwise HYPE ETF debuted on May 14, 2026, pitched as targeted exposure to the infrastructure behind on-chain derivatives. It was not Bitwise’s first Hyperliquid product. In April, the firm listed a Hyperliquid staking exchange-traded product, BHYP, on Deutsche Boerse’s Xetra venue in Europe, one of a growing suite of staking vehicles.
Bitwise also leaned into Hyperliquid’s own transparency ethos, committing to publish the ETF’s wallet addresses so investors could verify the fund’s holdings on-chain rather than take them on trust.
The reason an ETF matters for price is access. A token that previously required a self-custody wallet or an offshore exchange suddenly becomes reachable through a regulated product that fits inside retirement accounts and institutional mandates. That widens the pool of potential buyers and, in theory, adds a steady bid that is less reactive than crypto-native flows.
For HYPE, which already carried a large following, the ETF was a credibility marker as much as a demand channel: it signaled that a serious asset manager judged the token investable enough to wrap and sell.
The catch is that an ETF is a pipe, not a pump. It makes buying easier, but it does not create demand on its own. The flows that move through it can run in either direction, and that is exactly what the first month showed.
The first outflow, and what it signals
For 16 straight sessions after launch, the Bitwise HYPE ETF took in money. That streak was the bullish read in action: regulated demand arriving day after day, exactly the steady bid the ETF was supposed to deliver. Then on June 5, the fund recorded its first daily outflow, nearly $3 million leaving in a single session. In dollar terms, it was almost nothing against a market cap in the tens of billions. As a signal, it carried more weight than its size.
The outflow is best read as the first test of the ETF demand story rather than its failure. It coincided with HYPE pulling back from its mid-June record and the broader market sliding into a risk-off, extreme-fear posture, so some of the selling was almost certainly market-wide rather than HYPE-specific. But it punctured the clean narrative of one-directional institutional accumulation. ETF flows, it turned out, would ebb and flow with sentiment like everything else, and that makes them a variable to track instead of a guaranteed tailwind.
For the forecast, the practical point is that ETF flow is now one of the clearest real-time gauges of institutional appetite for HYPE. A return to sustained net inflows would confirm the bull thesis that regulated demand is building. A pattern of choppy or net-negative flows would suggest the early enthusiasm has cooled, and that the price has to lean on its other engines instead.
The buyback engine the ETF flows into
What makes HYPE structurally unusual is where its trading fees go. Roughly 97% of the protocol’s fees feed an Assistance Fund that continuously buys HYPE on the open market and burns it. This is not a promise of future buybacks; it is a live mechanism funded by real activity. Cumulative buybacks have passed $1 billion; the program has burned around 4.17% of total supply, pushing circulating supply below 300 million tokens. The platform’s daily revenue has run near $2.5 million, HyperEVM transaction fees have set records, and cumulative trading volume has crossed $4.15 trillion.
The ETF and the buyback connect in a way that matters for price. The buyback is powered by trading volume, because more volume means more fees and therefore more HYPE bought and burned. The ETF, by widening the holder base and supporting the token’s profile, can indirectly feed the system if it helps sustain attention and activity on the platform.
The product expansion compounds the same way: the FOMO app launched on June 11, letting users trade perpetuals across equities, pre-IPO stocks, crypto, indices, and commodities from one interface, while HIP-3 and HIP-4 push the platform toward prediction markets and options. Each new market is a potential new source of the fees that drive the burn.
The bull case in one line is that this engine eats its own supply faster than the unlocks can replace it. The more the platform grows, the more it buys back, and the thinner the float becomes. The ETF is one more on-ramp pointed at that engine.
The unlock overhang pulling the other way
Against the buyback sits the supply schedule. Only about 27% of HYPE’s roughly 953 million to 1 billion maximum supply is in circulation, which means a large share is still locked and scheduled to come to market over years. Roughly 1.2 million HYPE per month is distributed to team members and early backers, a steady stream of new sellable supply that the buyback has to absorb just to stay even.
The fully diluted valuation near $60 billion is the number the skeptics point to: it implies a very large eventual supply, and the gap between the circulating market cap and the FDV is the overhang the market has to digest over time.
This is the tug-of-war that defines HYPE. The buyback pulls supply off the market and burns it; the unlocks push new supply on. ETF inflows can tilt the balance toward demand; ETF outflows tilt it back. The reason forecasts vary so wildly is that the outcome depends on which side wins, and that in turn depends on whether platform volume keeps growing fast enough to keep the burn ahead of the unlocks. No model can know that in advance, which is why honest analysis tracks the variables instead of betting the house on a single price.
The regulatory cloud
HYPE carries a regulatory question mark that the ETF does not erase. In one episode, Singapore’s monetary authority added Hyperliquid to its Investor Alert List, a reminder that a permissionless derivatives venue draws scrutiny from regulators who worry about access and oversight.
Hyperliquid also operates in a legal gray zone in some jurisdictions, including restrictions affecting users in the United States, and the traditional derivatives establishment has been pressing regulators to bring platforms like it under tighter rules, citing concerns about manipulation and permissionless markets.
For the price, regulation cuts both ways. A clear, favorable framework would remove an overhang and could unlock broader access, especially in the United States where the platform’s reach is constrained. A crackdown, or even sustained uncertainty, could cap institutional participation and weigh on the very ETF demand the bull case depends on. The ETF brings HYPE closer to the regulated world, which is a benefit when the rules are friendly and a liability when they are not.
Where the chart and the price sit
HYPE trades in the mid-$60s as of late June, roughly 14% below the $76.67 all-time high set on June 16. The price history is a story of violent moves: the token launched near $7.56 in November 2024, climbed to about $35 by year-end, peaked near $59 in September 2025, then corrected hard to the $21 to $26 range in early 2026 with a February low around $21. From there it built a long base and broke out through the $50 to $52 zone in June, ran to its record, and pulled back. That $50 to $52 area now reads as structural support, the floor the breakout set.
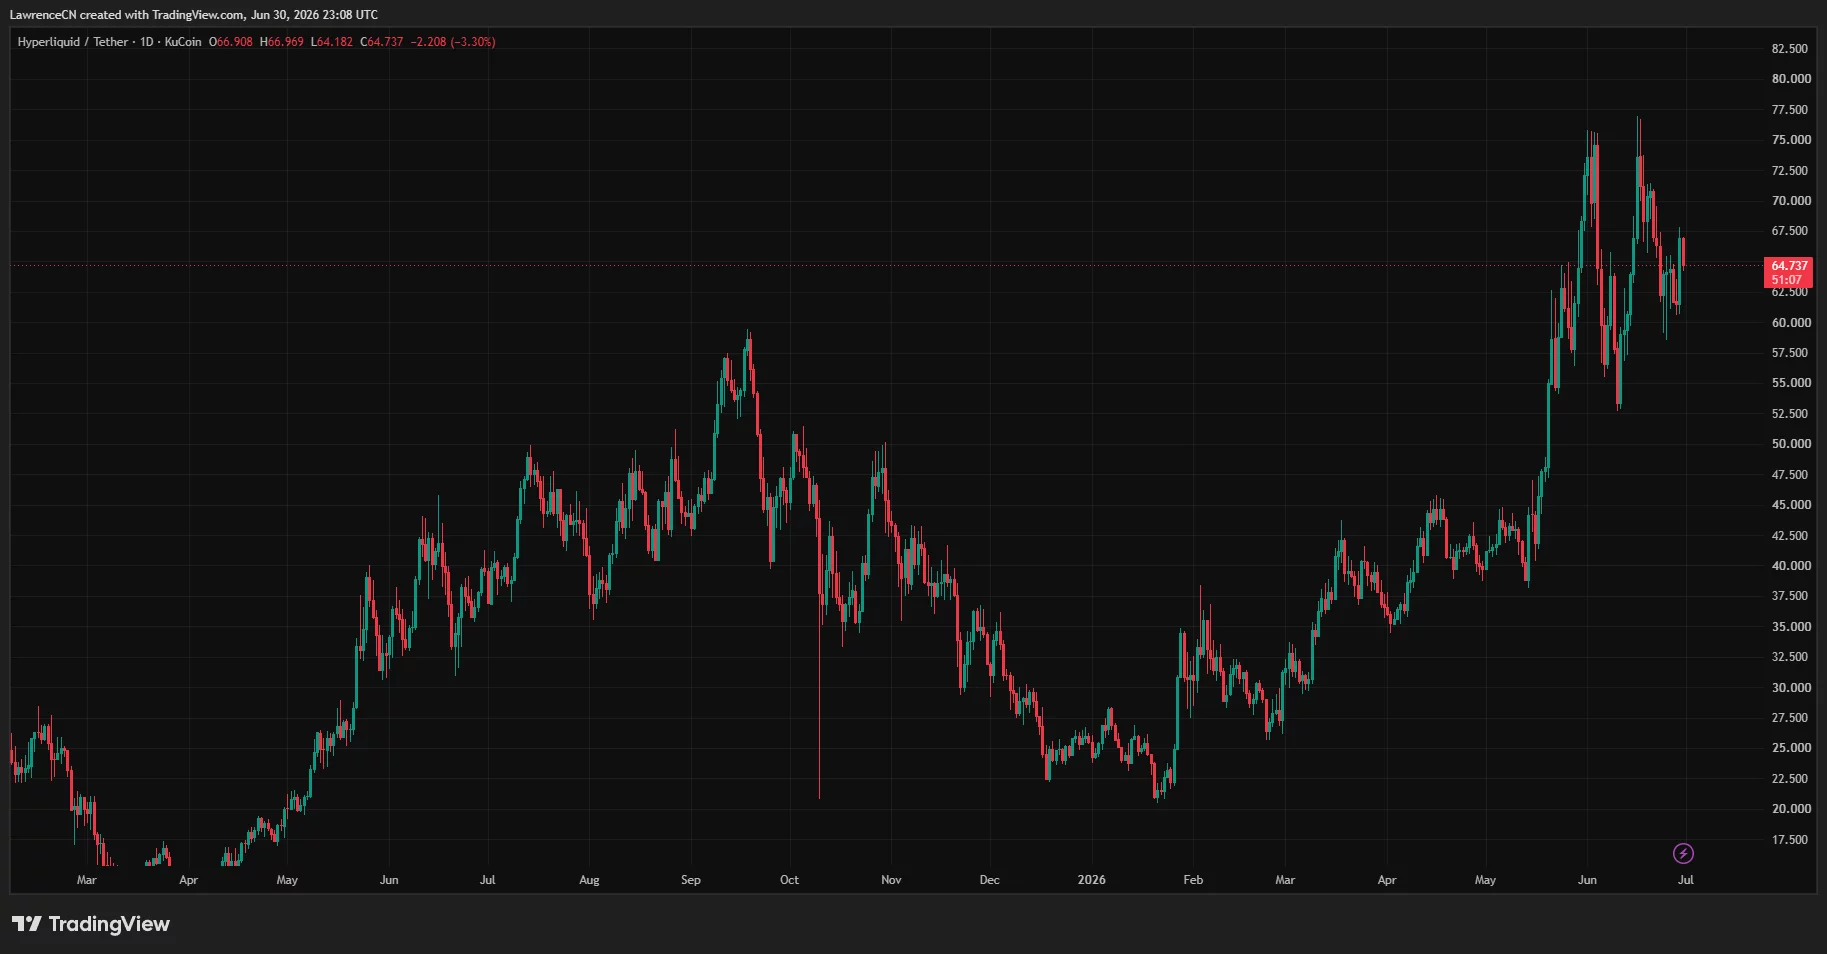
The short-term picture is post-record consolidation. After a sharp run to a new high, the token is digesting gains, with momentum cooled from its peak. The bullish structural read is that the correction is happening while the platform’s fundamentals, volume, revenue, and fees keep setting records, which is the opposite of a top built on fading activity.
The bearish read is that a second failed push at the high would raise doubts and open the door back toward the low-$50s support. Reclaiming and holding above the record is what would put price discovery back in play.
What analysts and prediction markets expect
Third-party forecasts for HYPE span an enormous range, which reflects the genuine uncertainty in the buyback-versus-unlock outcome. These are external projections, offered as a spread of views instead of targets this publication endorses.
On the cautious side, Coinpedia’s 2026 model runs from roughly $19.85 to $54.87 with an average near $37, and Cryptopolitan points to a peak around $58 with a separate analysis near a $40 average. In the middle, several views see a return toward or past the all-time high if adoption continues.
At the bullish extreme, Arthur Hayes has floated $150 by August 2026, premised on the buyback, organic volume growth, and the prediction-market and options expansion all firing together, while Multicoin Capital argues for $319 by 2028 on the thesis that the market underrates Hyperliquid as an emerging “everything exchange” instead of just a perpetuals venue. Prediction markets in mid-2026 leaned toward HYPE clearing $80 before year-end, with a smaller share betting on $100 and bets on a drop below $50 carrying meaningful odds.
The spread, from the high $30s to $150 in the same year, is the point. It is not noise; it is an honest map of how much depends on volume, flows, and regulation. The ETF is one input into that map, not the whole territory.
How HYPE’s ETF compares with the Bitcoin and Ether funds
The clearest way to read the Bitwise HYPE ETF is against the template set by the Bitcoin and Ether funds that came before it. Those products showed the playbook: a regulated wrapper opens a corridor for capital that cannot or will not touch spot crypto directly, and once that corridor exists, an asset stops being treated as a fringe speculation and starts being treated as an allocatable holding.
The Bitcoin funds in particular showed how powerful steady, structural inflows can be when they arrive day after day from advisers and institutions instead of from reactive crypto traders.
HYPE inherits that template, but with important differences that cut against a clean comparison. It is far younger and far smaller than Bitcoin or Ether, which makes its ETF flows more volatile and more capable of moving the underlying price in both directions. Its fully diluted valuation near $60 billion sits well above its circulating market cap, so the supply overhang is larger and more present than it was for the major assets when their funds launched. And HYPE’s regulatory standing is less settled, which caps how aggressively some institutions can participate.
The European staking product, BHYP on the Xetra venue, adds a second access point and a yield angle that the early Bitcoin funds lacked, but it does not change the core asymmetry: a smaller, younger token feels ETF flows more sharply than a trillion-dollar asset does.
The takeaway is that the ETF is a genuine structural positive that should not be mistaken for a guaranteed one. For Bitcoin, the funds eventually delivered sustained net demand. For HYPE, the first month already showed flows can reverse, so the corridor is open but the traffic through it is not yet proven to run one way.
What to watch: the metrics that decide HYPE
For readers tracking HYPE instead of reacting to each candle, a handful of metrics will signal which scenario is unfolding. The first and most direct is ETF flow direction. Sustained net inflows would confirm the bull thesis that regulated demand is building, while a pattern of choppy or negative flows, in the vein of the June 5 outflow, would suggest the early enthusiasm has cooled, and the price must lean on its other engines.
The second is weekly trading volume and fee revenue, because those power the buyback. As long as volume keeps setting records and fees keep feeding the Assistance Fund, the burn stays strong, and supply keeps tightening. A slowdown in volume would weaken the buyback at the worst possible time, just as fresh unlocks arrive.
The third is the unlock pace itself, roughly 1.2 million HYPE a month to insiders, and whether the buyback is retiring tokens faster than the schedule releases them. The fourth is regulation: any movement on the U.S. access question or follow-through on alerts like the one from Singapore’s authority would shift the institutional calculus quickly.
The fifth is the chart structure around two levels. Reclaiming and holding above the $76.67 record would put HYPE back into price discovery and validate the optimistic targets, while losing the $50 to $52 breakout support would confirm the post-record correction has turned into something deeper.
Tracked together, these five say more about HYPE’s path than any single forecast, because they map directly onto the buyback-versus-unlock tug-of-war that the ETF flows now sit on top of. The ETF made HYPE easier to buy. These metrics decide whether buyers keep showing up.
Bull, base, and bear scenarios for HYPE
The scenarios below combine the ETF flow story with the buyback, the unlocks, and the regulatory backdrop. They are illustrative ranges drawn from the external forecasts and current structure, not guarantees.
Bull case
In the bull scenario, ETF flows turn decisively net positive again after the early wobble, confirming that regulated demand is building. Platform volume keeps climbing as the FOMO app, prediction markets, and options add fee sources, so the buyback accelerates, and the burn stays ahead of the roughly 1.2 million monthly unlocks. Regulation breaks favorably, easing the access overhang. HYPE reclaims $76.67, enters price discovery, and runs toward the optimistic targets in the $90 to $150 range that Telegaon and Arthur Hayes describe, with the “everything exchange” thesis supporting a higher multi-year path. This case needs volume growth to outrun the unlocks and the regulatory cloud to lift.
Base case
In the base scenario, the ETF settles into choppy flows that neither confirm nor break the demand story, and the buyback roughly offsets the unlocks without overwhelming them. HYPE holds its $50 to $52 breakout support and trades in a wide band beneath the record for much of the year, with the average landing somewhere around the high $30s to high $50s that the cautious Coinpedia and Cryptopolitan models bracket, punctuated by sharp moves in both directions as sentiment shifts. The fundamentals stay strong, but the supply overhang and regulatory uncertainty cap sustained upside. This is the “strong business, range-bound token” outcome.
Bear case
In the bear scenario, ETF outflows persist and signal that institutional enthusiasm has cooled, while a risk-off market and any regulatory escalation, building on the MAS alert and U.S. access concerns, weigh on demand. Platform volume slows, the buyback weakens just as fresh unlocks arrive, and the FDV gap reasserts itself. HYPE loses the $50 to $52 support and slides toward the low-$30s or below, in line with the bottom of the cautious forecast range. In this case, the buyback cannot keep pace with the unlocks, and the ETF that was supposed to be a tailwind becomes a visible scoreboard for fading demand.
Frequently Asked Questions
When did the Bitwise HYPE ETF launch?
The Bitwise HYPE ETF debuted on May 14, 2026, offering regulated exposure to Hyperliquid’s token. Bitwise had earlier listed a Hyperliquid staking product, BHYP, on Deutsche Börse’s Xetra venue in Europe in April 2026. The firm also committed to publishing the fund’s wallet addresses so investors could verify holdings on-chain.
What was the first HYPE ETF outflow, and does it matter?
After 16 consecutive days of inflows, the Bitwise HYPE ETF recorded its first daily outflow of nearly $3 million on June 5, 2026. The dollar amount was small relative to HYPE’s market cap, and it coincided with a broad risk-off pullback, so it was not a HYPE-specific collapse. It matters as a signal: it showed ETF flows will move with sentiment, making them a variable to track instead of a guaranteed source of demand.
How does the HYPE buyback work?
Roughly 97% of Hyperliquid’s protocol trading fees flow into an Assistance Fund that buys HYPE on the open market and burns it. Cumulative buybacks have passed $1 billion, around 4.17% of supply has been burned, and circulating supply has fallen below 300 million. The buyback is powered by trading volume, so more platform activity means more buying and burning.
What is the main force working against HYPE’s price?
The main counterweight is the token unlock schedule. Only about 27% of the maximum supply circulates, and roughly 1.2 million HYPE per month is released to team members and early backers. That steady new supply, plus a fully diluted valuation near $60 billion, is what the buyback has to absorb. The balance between buyback and unlocks is the central question for the price.
Is HYPE affected by regulation?
Yes. Singapore’s monetary authority placed Hyperliquid on its Investor Alert List, and the platform operates in a legal gray zone in some jurisdictions, including restrictions affecting U.S. users. Favorable rules could broaden access and support ETF demand, while a crackdown or prolonged uncertainty could limit institutional participation and weigh on the price.
What do forecasts say HYPE could reach?
External forecasts vary widely. Coinpedia’s 2026 range runs from about $20 to $55 with an average near $37, and Cryptopolitan points to a peak around $58. More bullish views include Arthur Hayes at $150 by August 2026 and Multicoin Capital at $319 by 2028. Prediction markets leaned toward HYPE clearing $80 by year-end. The wide spread reflects how much depends on volume, ETF flows, and regulation.
Disclaimer: This article is for information purposes only and does not constitute financial, investment, or trading advice. Cryptocurrency prices are highly volatile, and price predictions are speculative estimates that may not occur. Nothing here is a recommendation to buy or sell any asset. Always do your own research and consider consulting a licensed professional before making financial decisions. Figures are accurate as of June 30, 2026, and will change.
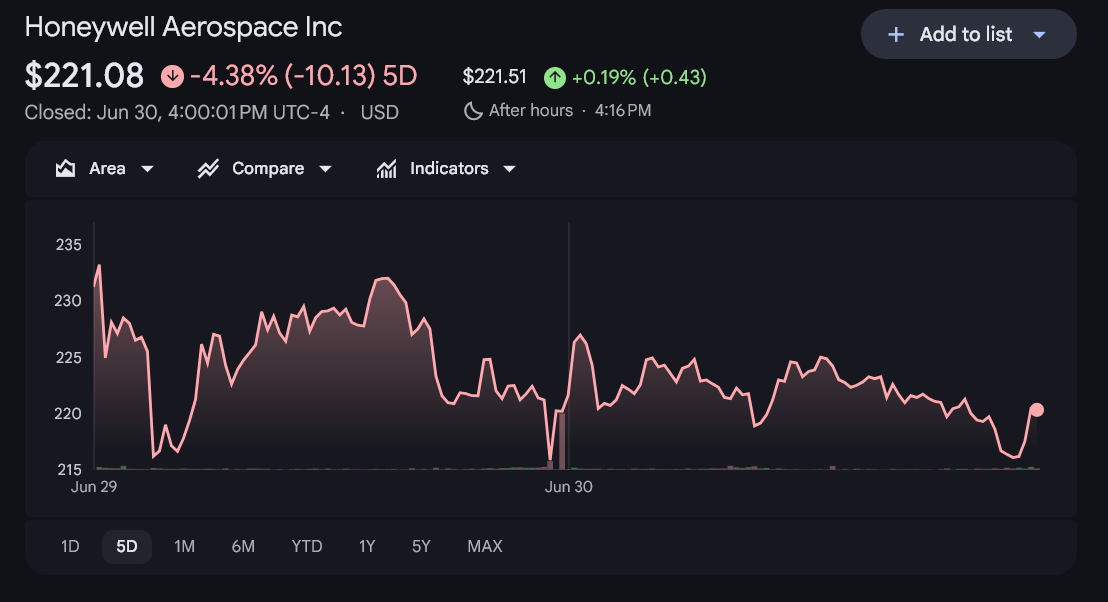
Honeywell Aerospace (HONA) has made a weak and volatile start on the Nasdaq, trailing the wider aerospace and defense sector despite a strong standalone business case.
The stock began trading on June 29 after Honeywell International separated its aerospace unit through a one-for-two distribution. The debut was choppy. HONA reportedly rose nearly 7% intraday before fading and closing down 0.4%, with volume near 8.5 million shares.
Aerospace and defense stocks have remained in demand, while HONA has lagged the group by about 10 percentage points.

The first explanation is spin-off churn. Newly separated companies often face early selling from funds that do not want the new stock, cannot hold it, or need to rebalance after the distribution. That selling can pressure the share price even when the business itself looks solid.
A Strong Business Faces Early Doubt
The standalone case for Honeywell Aerospace is clear. Management told investors earlier in June that the business generated $17.4 billion in 2025 sales and $4.3 billion in operating profit. Sales also grew 12% organically, meaning growth came without acquisitions.
The business has a large repeat-revenue base. About 44% of sales come from servicing aircraft already in operation. These are parts, repairs and upgrades that operators need long after a plane is delivered.
Defense and space accounted for 41% of sales, giving the company another steady revenue stream. Honeywell Aerospace also says its technology is used on roughly 90% of aircraft flying today.
The order book adds support. The company has about $18.56 billion of future work lined up across its units, led by Electronic Solutions at $6.8 billion.
HONA also looks cheaper than many peers. At about $70 billion, the company trades near 15 times yearly profit on an EV/EBITDA basis. Comparable aerospace and defense stocks often trade closer to 18 to 20 times.
That discount can attract buyers, but it also shows the market has not fully accepted the new listing yet.
Traders are Still Split
Short-term money flow has not confirmed a clear rebound. Chaikin Money Flow, a gauge of buying and selling pressure, was slightly negative on intraday charts.

Options activity points to a more bullish view, although the signal is indirect. HONA options are still new, so traders have been watching Honeywell International options as a proxy. HON’s put-call ratio fell sharply by June 29, showing heavier interest in bullish calls than bearish puts.
That does not guarantee HONA will recover. It does show that some traders are still positioning for upside, even as the spot price remains soft.

The Key Levels for HONA Stock
For now, the chart still favours caution. HONA trades below its VWAP near $223.55. VWAP tracks the average price paid during the session, adjusted for volume. When a stock trades below it, sellers usually have more control.
The key downside level is $217.74. A clean break below that area could push HONA toward $208.59. Before that, $220.56 is the first warning level to watch.
On the upside, HONA needs to reclaim $223.39 to steady the chart. A move above $232.54 could open a retest of $238.48.
The caveat is that HONA has only a few days of trading history. These levels may shift quickly as the market finds a fair price.
For now, HONA looks like a strong aerospace business with a weak early tape. If buyers defend the $217 area and push the stock back above VWAP, the debut sell-off may look like early spin-off noise.
If that level fails, the market may keep marking HONA lower before giving the fundamentals credit.
The post Honeywell Aerospace Stock Stumbles After Nasdaq Debut appeared first on BeInCrypto.
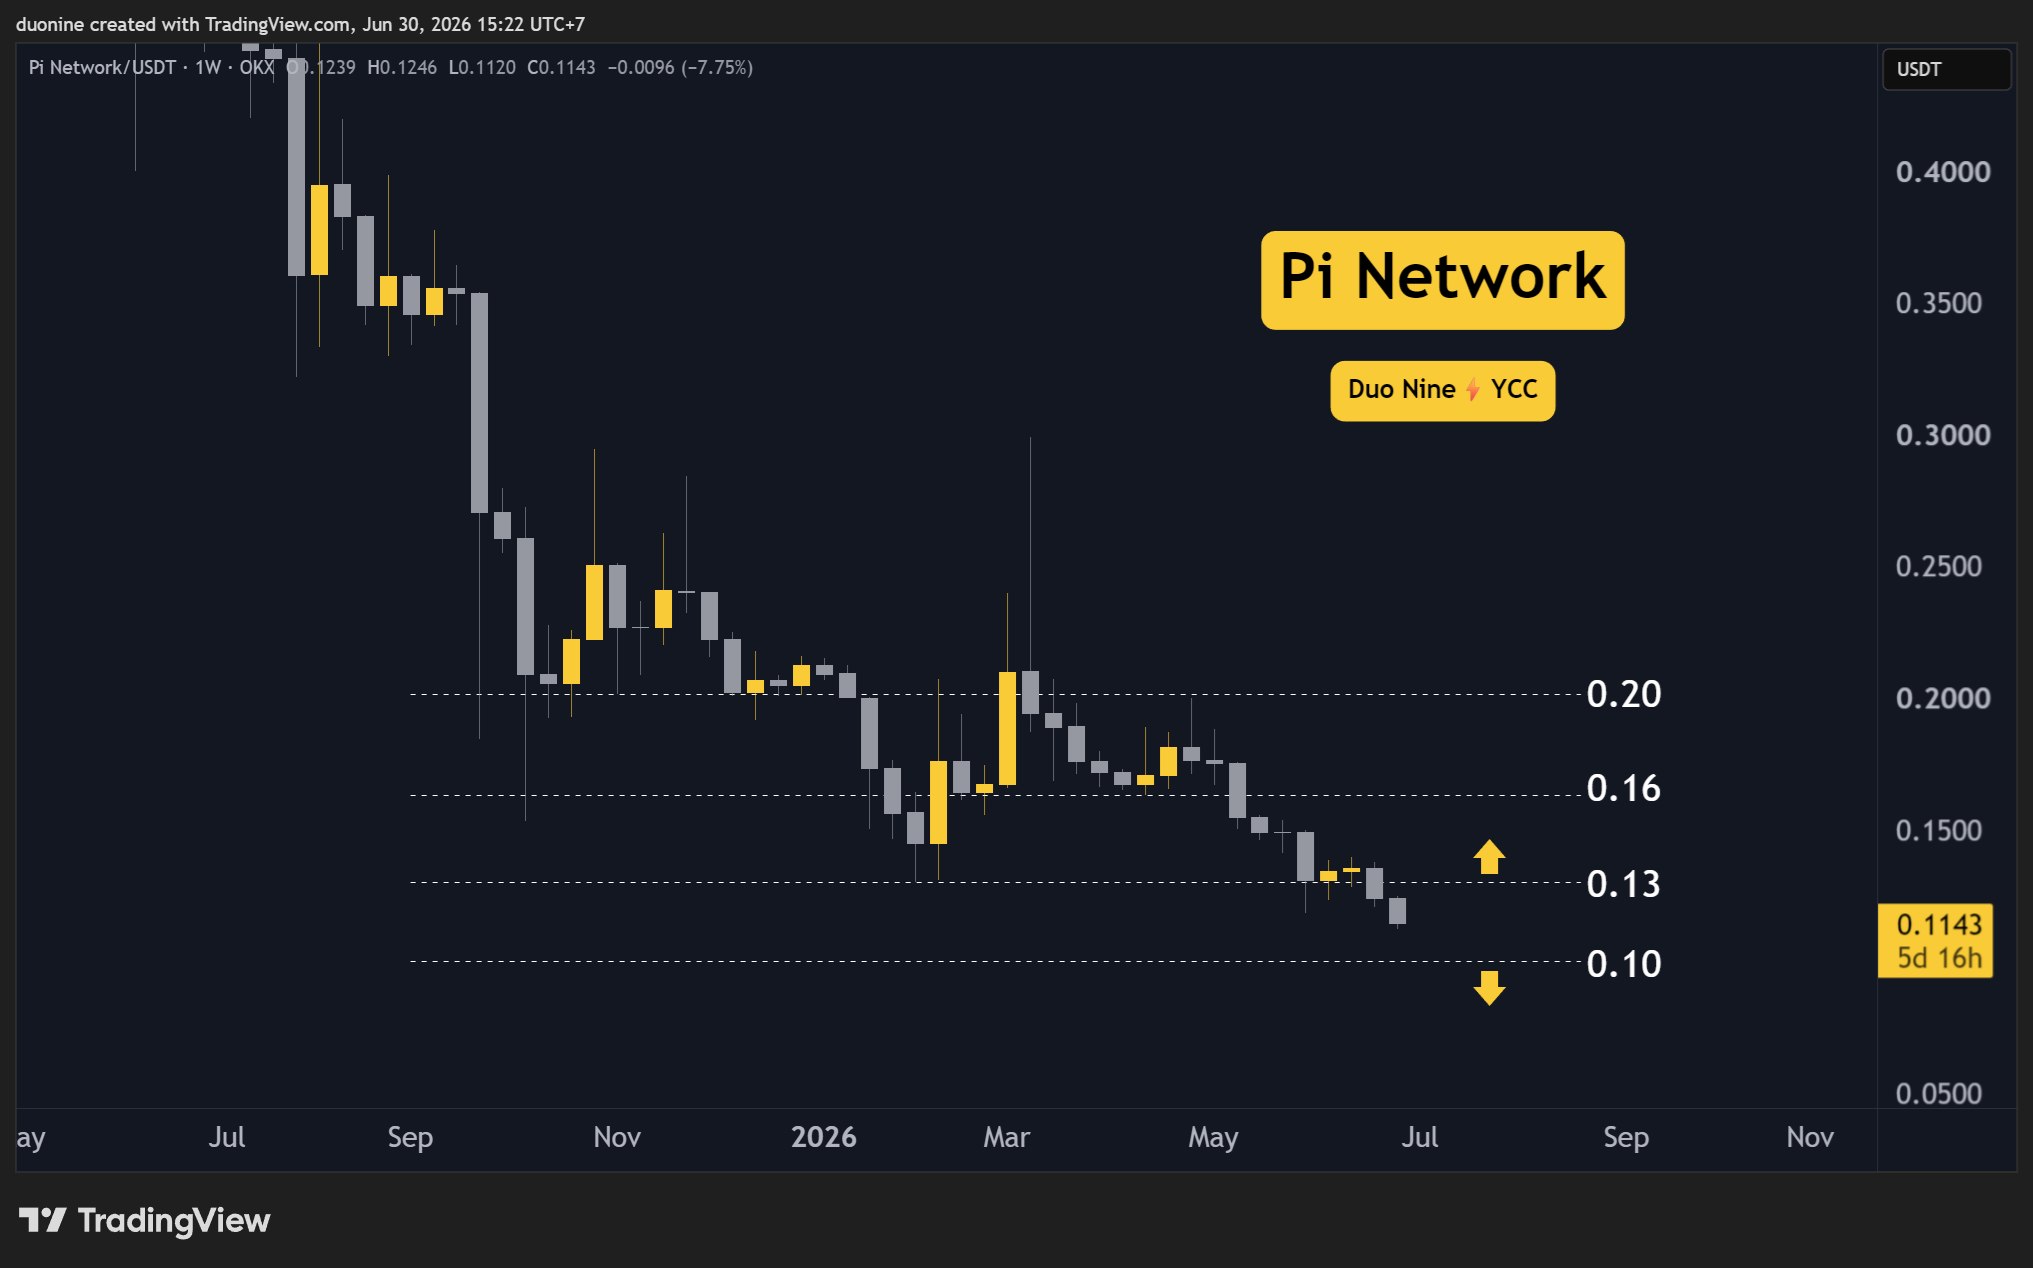
PI is down 11% this week after losing its key support at $0.13. Where will it go next?
PI Network (PI) Price Predictions: Analysis
Key support levels: $0.10
Key resistance levels: $0.13, $0.16
PI Falls Towards $0.10
With the support at $0.13 lost, PI is down 11% on the weekly chart. This latest push from sellers has seen the price nosedive towards the key support at $0.10. At the time of this post, the price was found around $0.11.
It’s unlikely that this cryptocurrency will find any relief until it reaches 10 cents, a key psychological level. Buyers may be tempted to return there, but it’s still too early to say if they will be successful in stopping the downtrend there.
Downtrend Resumes
With support lost, PI resumed its downtrend. This means the bottom may take quite a bit longer to reach, and the price will unfortunately continue to fall until buyers return. So far, buy volume has been very weak and sporadic.
In the last two weeks, sellers totally dominated the chart, which also explains the recent loss of support. Bulls tried to hold at $0.13, but they only managed a brief relief in early June, which was not enough to stop the bearish momentum.

RSI Shows Bears are in Control
Since May, the daily RSI has been hovering below 50 and has never managed to go above it. That’s an extremely bearish signal since it shows buyers have no control over the price action.
Moreover, the RSI recently fell below 30, placing it in the oversold area. However, PI has visited this area repeatedly since May, which is just another sign of weakness and not a buy opportunity.

The post Pi Network (PI) Price Predictions for This Week (June 30) appeared first on CryptoPotato.

Bitcoin’s “long-term holder” supply has climbed to new highs, a development that some analysts say could point to an earlier end to the current drawdown. Swan Bitcoin CEO Cory Klippsten highlighted that long-term investors are holding a record amount of BTC, a pattern he argues has historically coincided with cycle lows.
At the same time, other market watchers continue to stress that macro signals and US regulatory uncertainty may still weigh on demand. Grayscale, for instance, tied potential downside pressure to the uncertain fate of the US CLARITY Act, while Galaxy Digital later reduced its odds that the bill would become law in 2026.
Key takeaways
- Long-term holders reportedly reached 14.7 million BTC, described by Swan Bitcoin’s Cory Klippsten as “cycle low” territory in prior market turns.
- Glassnode data cited in the discussion links the increase in long-term holder supply to “continued conviction” among experienced investors.
- Coinglass data shows long-term holder supply is up about 14% since Nov. 26, reflecting renewed accumulation after earlier market stress in October.
- Some forecasts based on corporate treasury metrics suggest Bitcoin may still bottom later, potentially after Strategy’s mNAV hits its own low.
- Grayscale and Galaxy Digital both flagged uncertainty around the CLARITY Act as a factor that could keep near-term selling pressure elevated.
Record long-term holder supply revives “earlier bottom” arguments
Klippsten said Bitcoin supply held by long-term holders has reached an all-time high, pointing to a level of BTC held in “addresses of long-term holders” that he characterized as having “marked cycle lows historically.” In an interview with Cointelegraph shared via X, Klippsten attributed the reading to long-term investor behavior rather than speculative turnover.
According to Glassnode, the amount of BTC held by long-term holders reached 14.7 million BTC on Wednesday, a record level that the analytics firm said signals “continued conviction.” The core idea behind this metric is that long-term holder cohorts—typically understood as holders that have not moved their coins for extended periods—tend to be less sensitive to short-term price fluctuations. When that cohort grows, it can be interpreted as reduced willingness to sell during weaker markets.
Klippsten’s interpretation takes this one step further: he suggested that the data could imply Bitcoin’s cycle bottom may arrive sooner than in previous downturns. That view stands in tension with at least one prominent alternative framework referenced in the discussion.
Why treasury-based models still point to a later cycle low
Earlier coverage cited a forecast from Lebit Mining Pool founder Jiang Zhuoer, who argued Bitcoin would bottom between October and December 2026—roughly six months after Strategy’s Multiple to Net Asset Value (mNAV) measure found its own cycle low.
Zhuoer’s reasoning, as presented in the referenced post, centers on mNAV. He wrote that Strategy’s mNAV had already declined to 0.72, approaching the lowest level of 0.7 seen on May 11, 2022. Under this model, the time gap between a company-level valuation trough (mNAV) and the broader market’s cycle low could remain consistent across cycles.
Zhuoer also suggested that such a lag could place Bitcoin’s cycle low closer to the $42,000 to $44,000 region. While that range is model-derived rather than a direct price target, it highlights an important disagreement among analysts: long-term holder accumulation may be suggesting early stabilization, while valuation compression in major treasury buyers could still imply additional downside before the market bottoms.
For investors and traders, the practical takeaway is that “accumulation signals” and “valuation timing signals” are not necessarily synchronized. If long-term holder supply continues to rise, it may reinforce a case for faster stabilization. But if treasury-driven downside pressures extend, any improvement may be slower than accumulation data alone would imply.
Accumulation restarted after October’s liquidation shock
The long-term holder narrative gains additional context from supply trends tracked by Coinglass. Coinglass reports that long-term holder supply stood at 16.65 million BTC at the time of publication, up 14% from 14.6 million BTC on Nov. 26.
Coinglass defines long-term holders as addresses that have held BTC for at least 155 days. In its framework, rising long-term holder supply often indicates that participants are reluctant to sell at current levels—an observation that aligns with Klippsten’s broader thesis about conviction during weaker periods.
The report also notes that long-term holders resumed accumulation at the end of 2025, nearly two months after early October’s record $19 billion liquidation event. That linkage matters because it suggests the observed behavior change is not purely random: a major stress event may have forced a reassessment among longer-term participants, who then positioned more conservatively as the market stabilized.
At the same time, the renewed accumulation doesn’t automatically resolve the question of price depth. If the market continues to absorb forced selling or if demand is delayed by regulation-related uncertainty, long-term holder accumulation can coexist with further price weakness.
CLARITY Act uncertainty could keep pressure on Bitcoin demand
Beyond on-chain and corporate valuation signals, the discussion also points to policy uncertainty that could affect Bitcoin demand in the US. Grayscale linked the potential for additional “deleverage” by treasury companies to whether the CLARITY Act passes.
In a Friday report, Grayscale’s head of research Zach Pandl wrote that if the CLARITY Act does not pass this year, companies such as Strategy and other treasury operators may continue to “deleverage,” which Grayscale suggested could cause Bitcoin to “fall moderately further.”
Galaxy Digital separately reduced its odds estimate, cutting the likelihood that the CLARITY Act would become law in 2026 to 50%. Galaxy Digital’s warning, as cited in the referenced coverage, emphasized that the US Senate may be running out of time to advance the broader crypto market structure bill before its August recess.
The bill is scheduled for a House of Representatives committee hearing on July 17. It aims to create the first regulatory framework for digital assets in the US, but has faced resistance from parts of the banking industry, particularly over the bill’s approach to allowing yield on stablecoin holdings.
For market participants, this policy dimension matters because it can directly influence institutional appetite—especially among firms whose balance-sheet strategies depend on clear regulatory pathways. When legislation is uncertain, even structurally bullish long-term investors may slow their risk-taking, affecting the pace at which demand can offset any sell-side pressure.
Next, readers should watch whether long-term holder supply continues rising alongside improving liquidity conditions, and whether the CLARITY Act’s legislative timeline shifts closer to or further from passage. Those two forces—on-chain conviction and regulatory clarity—may ultimately determine whether current accumulation translates into a quicker cycle turn or a longer grind lower.

A Pump.fun token airdropped to a famous trader’s wallet is up tens of thousands of percent in days. Here is the honest version: this is a high-risk memecoin with no product, and most tokens like it go to zero.
Summary
- The Black Bull (ANSEM) is a Solana memecoin launched on Pump.fun in mid-June 2026, trading near $0.13 with a market cap around $56 million after a move of roughly 26,000% in a week.
- The token was not created by the trader it is named after. An anonymous developer airdropped a large share of the supply to the wallet of Ansem, a well-known Solana influencer, who later embraced it rather than launching his own coin.
- There is no product, roadmap, team, or revenue behind the token. Its price is driven entirely by attention, one influencer’s involvement, and speculative trading, which makes it a casino bet, not an investment.
- On-chain analysis tools have flagged manipulation risk and heavy holder concentration; liquidity is thin relative to the market cap, and the trader associated with it has faced market-manipulation allegations.
- Third-party forecasts that exist for ANSEM are wide and speculative, spanning roughly $0.03 to $0.25, and the most realistic base case for any token of this type is a sharp drawdown, with a real chance of going to near zero.
Before anything else, the blunt version. The Black Bull, traded under the ticker ANSEM, is a memecoin. It has no underlying business, no cash flows, and no roadmap that would anchor a valuation. Its price exists because a famous trader is associated with it and the internet is paying attention.
Tokens like this can produce life-changing gains and total losses inside the same week, and the overwhelming majority of Pump.fun launches lose nearly all their value, many within a single day. Any “price prediction” for an asset like this is closer to handicapping a roulette spin than forecasting a company. Read the rest with that frame fixed in place.
This piece explains what The Black Bull actually is, the numbers behind its move, why it is a casino rather than an investment, the bull thesis stated fairly, the specific ways it could go to zero, what the few forecasters tracking it say, and then bull, base, and bear scenarios. It closes with a short FAQ.
What The Black Bull (ANSEM) actually is
The Black Bull is a Solana token launched on Pump.fun, the memecoin launchpad, around June 16 to 17, 2026, with the on-chain contract address ending in “pump” as Pump.fun tokens do. The story that gave it life is specific. An anonymous developer created the token and airdropped a large portion of the supply, by some accounts around 65%, directly to the wallet of Ansem, a prominent Solana trader and influencer also known by the handle blknoiz06, whose real name is Zion Thomas. Ansem is one of the best-known memecoin personalities on Solana, with roughly a million followers and a reputation as an early caller of tokens like WIF and BONK.
Crucially, Ansem did not create the token, and it is not officially his project. The developer essentially bet that putting the supply in a famous wallet would manufacture attention. It worked. Rather than dump the airdrop or launch a competing coin of his own, Ansem leaned in, reportedly pledging to airdrop creator fees back to holders instead of cashing out, and his wallet holds a very large position, on the order of 600 million tokens that at points represented the bulk of his visible on-chain portfolio. That alignment, a recognizable figure with skin in the game, is the entire bull narrative. It is also the entire risk, because the token’s fate is tethered to one person’s continued involvement.
The numbers behind the move
As of late June 2026, ANSEM trades near $0.13, having reached a peak around $0.14 on June 29. The 7-day move was roughly 26,000%, the kind of figure that only appears in freshly launched memecoins coming off a near-zero base. The market cap sits around $56 million, with roughly 410 million of a 1 billion total supply in circulation, implying a fully diluted valuation closer to $136 million. The token ranks somewhere around #374 by market cap, and daily trading volume has run between roughly $60 million and $94 million, which against a $56 million cap produces a volume-to-market-cap ratio above 2.
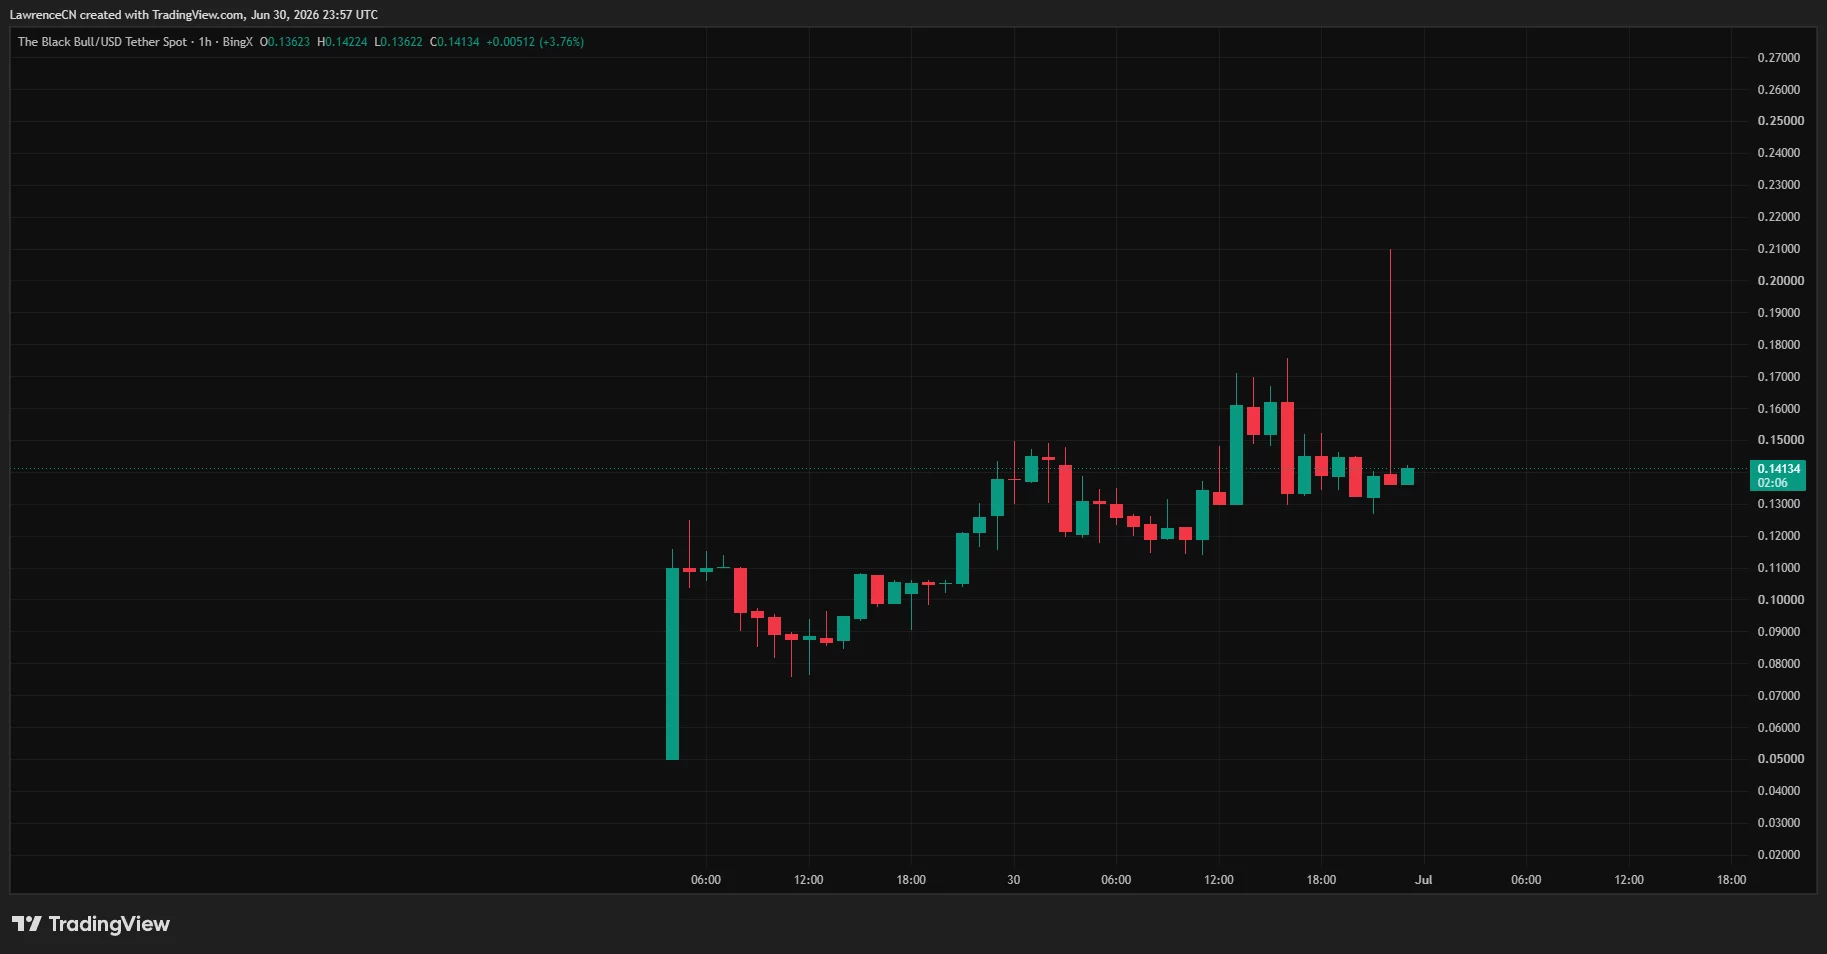
That ratio is itself a warning light: it means the token turns over its entire value more than twice a day, the signature of frantic speculative churn rather than steady holding. ANSEM trades across venues including PumpSwap and Meteora on Solana, with perpetual futures listed on some offshore exchanges such as MEXC and others, and it has appeared as a verified token on Solana interfaces like Jupiter and Phantom. The presence of leveraged perps on a token this young amplifies the volatility in both directions, because liquidations can cascade fast when the price moves.
These numbers describe a token in the most volatile possible phase of its life. The percentage gains are real, and so is the fragility underneath them.
Why this is a casino, not an investment
This section is the heart of the piece, and it is deliberately heavier than the bull case, because the risks here are not footnotes. They are the main event.
First, there is nothing to value. ANSEM has no product, no revenue, no roadmap, and no team in the conventional sense. There is no cash flow to discount, no user base to grow, no utility that creates demand for the token beyond speculation. Its price is a pure function of attention and belief, both of which can evaporate without warning.
Second, on-chain analysis has flagged it. Token-screening tools such as Rugcheck have raised manipulation warnings tied to supply concentration in wallets that are not clearly identified. Heavy concentration means a small number of holders could move the price violently or exit into the liquidity that retail buyers provide. Thin liquidity relative to the market cap compounds this: when real liquidity is shallow, a few large sells can collapse the price far faster than the order book suggests.
Third, the person at the center carries his own controversy. The trader associated with the token has faced market-manipulation allegations in the broader memecoin context, which adds reputational and regulatory risk to an asset whose entire thesis rests on his involvement. If he steps back, sells, or is forced to distance himself, the narrative that supports the price can vanish.
Fourth, the base rate is brutal. The large majority of Pump.fun memecoins lose almost all their value, frequently within hours or days of launch. Survivorship bias makes the winners loud and the thousands of dead tokens silent. Treating ANSEM as likely to be one of the rare survivors, instead of one of the many that fade, is the single most common and most expensive mistake buyers of tokens like this make.
Put together, these are not reasons to never touch a memecoin. They are reasons to size any exposure as money one is fully prepared to lose, and to never confuse a fast chart with a sound investment.
The bull thesis, stated fairly
For balance, the case the buyers make deserves a fair hearing, even inside a risk-first frame. The bull argument has 3 legs. The first is reach: Ansem commands a large, engaged audience, and in memecoins, attention is the scarce resource that drives price. A token he is actively associated with has a built-in distribution advantage that most launches never get.
The second is alignment. By reportedly pledging to route creator fees back to holders instead of launching a separate token to cash in, Ansem signaled that his incentives point in the same direction as the people holding the coin, at least for now. In a category defined by developers dumping on their communities, an influencer choosing to share fees is a comparatively constructive signal.
The third is the Solana memecoin meta itself. Solana has repeatedly produced memecoins that ran far longer and higher than skeptics expected, and the ecosystem’s culture, low fees, and fast launches keep the speculative engine fed. In a market where attention rotates quickly, a token with a recognizable face and an active community can sustain a narrative longer than a faceless launch.
None of this changes the absence of fundamentals. The bull case is a bet that attention and alignment persist long enough to matter, which is a real but fragile proposition.
What could make it go to zero
The bear mechanics are concrete and worth naming, because they are the most probable outcome for tokens of this kind. Concentration is the first: if large holders, identified or not, decide to sell into the thin liquidity, the price can fall faster than buyers can react, and early entrants exit at the expense of late ones. Liquidity withdrawal is the second: if liquidity providers pull their positions, the token can become nearly untradeable at anything close to the quoted price.
Narrative death is the third and most likely slow killer. Memecoins live on attention, and attention is finite. When the crowd rotates to the next launch, volume dries up, the chart bleeds, and the token drifts toward irrelevance even without a dramatic crash. Copycats accelerate this, as the inevitable wave of imitation tokens splits the speculative capital and dilutes the original’s mindshare. Finally, the single-person dependency is the acute risk: if Ansem sells, goes quiet, or is forced to distance himself for legal or reputational reasons, the one pillar holding up the price is removed, and there is nothing fundamental left to catch it.
Any one of these can take a token like this down by 80% or more in short order, and several can combine. This is not a tail risk for ANSEM. It is the central scenario that any honest forecast has to treat as the base case.
What forecasters say
A handful of exchange-affiliated outlets have published speculative ANSEM ranges, and they should be read as guesses about a chaotic asset, not as analysis grounded in fundamentals, because there are no fundamentals to ground them in. These are 3rd-party figures, not endorsements.
Some short-term models from venues such as WEEX have sketched a near-term base band roughly between $0.085 and $0.135, a momentum upside toward $0.15 to $0.18 if attention holds, and a downside toward $0.06 to $0.075 if it fades. Broader 2026 ranges floated by outlets including BTCC and WEEX span roughly $0.03 to $0.25. The width of these ranges, a possible multiple up or a collapse of more than half, is the most honest thing about them: it concedes that the outcome is dominated by reflexive sentiment, not by anything that can be modeled. For an asset like this, the error bars are the message.
The pattern this fits: influencer memecoins before ANSEM
The Black Bull is not the first token to run on a famous name, and the history of the pattern is the most useful guide to its likely path. Solana has produced a long line of influencer-linked and celebrity memecoins, some tied to the same callers who built reputations on early WIF and BONK trades. The recurring shape is familiar: a token attaches itself to a recognizable figure, attention floods in, the price goes parabolic on a near-zero base, and a wave of buyers arrives late expecting the early gains to repeat. What happens next sorts almost entirely on whether attention and the figure’s involvement persist.
The brutal majority outcome is decay. Most of these tokens fade within days or weeks as the crowd rotates to the next launch, leaving holders who bought the peak deeply underwater. A small number sustain a community and trade sideways at a fraction of their high for longer. A rare few extend into something more durable, and those are the cases the next round of buyers remembers, which is exactly how survivorship bias keeps the cycle turning. The honest framing is that ANSEM is drawing from the same deck, and the base rates for that deck are unforgiving.
What makes The Black Bull slightly different from a faceless launch is the creator-fee airdrop dynamic, which gives the central figure a reason to stay engaged instead of dumping immediately. That can extend the attention window. It does not change the category math.
An influencer can prolong a memecoin’s life, but no influencer has reliably prevented the eventual reversion that defines the type. Treating ANSEM as exempt from that pattern, because this time the figure seems aligned, is the precise belief that has separated late buyers from their money in every prior cycle.
If you choose to speculate anyway
This is not a recommendation to buy ANSEM or any memecoin. But because people will trade tokens like this regardless of warnings, the harm-reduction principles that disciplined speculators apply are worth stating plainly, since they are the difference between a survivable loss and a damaging one.
The first principle is sizing. Money committed to an asset like this should be money one can lose in full without affecting rent, savings, or obligations, because total loss is a realistic outcome, not a worst case. The second is that the position should be treated as already gone the moment it is opened, which removes the emotional pressure that leads people to average down into a falling token or chase it higher. The third is that taking profits on the way up is the only way speculative gains become real; a paper gain in a token with thin liquidity is not a realized gain until it is sold, and the same shallow liquidity that let the price spike can prevent an exit at the quoted price on the way down.
The fourth principle is to distrust leverage entirely here. The presence of perpetual futures on a token this young and this volatile is a fast path to liquidation, because the swings that make memecoins exciting also trigger margin calls in minutes.
The fifth is to verify instead of assume: checking the contract, the liquidity, and the holder concentration before committing, instead of trusting a chart or a name. None of this makes a memecoin a sound investment. It makes the gamble less likely to cause real damage, which is the most honest advice anyone can give about an asset with no fundamentals.
Bull, base, and bear scenarios for ANSEM
These scenarios are illustrative and speculative. For a memecoin with no fundamentals, they describe possible paths driven by attention and holder behavior, not valuations. The bear case is weighted as the most probable, consistent with how tokens of this type typically resolve.
Bull case
In the bull scenario, Ansem stays actively involved, the creator-fee airdrops keep holders engaged, and the Solana memecoin meta stays hot enough to keep attention flowing. Volume holds, new buyers keep arriving faster than early holders exit, and the token sustains or extends its level, pushing toward the upper speculative bands near $0.15 to $0.25 that the most optimistic 3rd-party ranges describe. This case requires attention to persist, concentration not to unwind, and no reputational or regulatory shock to the figure at its center. It is possible, and in memecoins it does happen, but it is the minority outcome.
Base case
In the base scenario, the initial frenzy cools as it almost always does. Volume fades from its launch peak, the chart gives back a large portion of the parabolic move, and the token settles into a lower, choppier range, perhaps the $0.06 to $0.13 zone, while it searches for whether a durable community remains after the hype. From there it either grinds out a smaller, attention-dependent existence or slowly bleeds lower as the crowd moves on. Even this “survives but deflates” path involves a substantial drawdown from the peak for anyone who bought the top.
Bear case
In the bear scenario, which is the most likely for a token of this kind, the attention rotates away, concentration unwinds into thin liquidity, or the single-person narrative breaks. The price falls 80% or more from its highs and continues toward near zero as volume disappears, joining the large majority of Pump.fun launches that do not survive. A liquidity pull, a large holder exit, a wave of copycats, or the central figure stepping back are each sufficient to trigger this, and they often compound. Anyone holding into this scenario should expect to lose most or all of the position.
Frequently Asked Questions
Did Ansem create The Black Bull token?
No. The token was created by an anonymous developer who airdropped a large share of the supply to Ansem’s wallet to attract attention. Ansem, the Solana trader also known as blknoiz06, did not launch it, and it is not officially his project. He later embraced it and reportedly pledged to share creator fees with holders, but the origin was a 3rd party using his name and wallet.
Why has ANSEM risen so much?
The move, roughly 26,000% in a week, reflects a freshly launched memecoin coming off a near-zero base combined with the attention of a well-known influencer. There is no product or revenue driving it. The price is a function of speculation, social momentum, and one person’s involvement, which is exactly why it can reverse just as violently.
Is The Black Bull a safe investment?
No. It is a high-risk memecoin with no fundamentals, flagged manipulation and concentration risk, thin liquidity, and a price dependent on a single person’s involvement. The large majority of tokens like it lose nearly all their value. It should be treated as a speculative gamble with money one is fully prepared to lose entirely, not as an investment.
What are the biggest risks?
The biggest risks are holder concentration selling into thin liquidity, liquidity providers withdrawing, attention rotating away and the narrative dying, copycat tokens splitting interest, and the central figure selling or stepping back for legal or reputational reasons. Any one can cause an 80%-plus decline, and they often combine.
What price targets do forecasters give?
Speculative 3rd-party ranges from exchange-affiliated outlets span roughly $0.03 to $0.25 for 2026, with short-term bands near $0.06 to $0.18. These are guesses about a chaotic, sentiment-driven asset, not fundamentals-based analysis. The wide ranges reflect that the outcome cannot be modeled with any confidence.
What is the most likely outcome?
For a memecoin of this type, the most likely outcome is a sharp drawdown from the peak, with a meaningful chance of trending toward near zero as attention fades. A minority of such tokens sustain a smaller community-driven existence, and a rare few extend higher. Betting on the rare outcome is the most common and costly mistake.
Disclaimer: This article is for information purposes only and does not constitute financial, investment, or trading advice. Memecoins are extremely high-risk, speculative assets with no underlying value, and most lose nearly all of their value. Prices are highly volatile, and the figures here, accurate as of June 30, 2026, will change rapidly. Nothing here is a recommendation to buy or sell any asset. Never invest more than you can afford to lose entirely, and consider consulting a licensed professional before making financial decisions.

Key Highlights
- MetaMask introduces Money Account featuring mUSD yield generation and payment capabilities
- Users can earn, transact, and trade using a unified balance
- mUSD holdings may generate up to 4% variable APY following fee deductions
- MetaMask Card users could receive up to 3% cashback rewards in mUSD
- Monad blockchain enables sponsored transaction fees for efficient stablecoin operations
MetaMask has introduced its Money Account feature, integrating mUSD yield opportunities, payment functionality, and trading capabilities within a single self-custody balance. This new offering transforms the platform from a basic wallet and exchange tool into a comprehensive financial solution as stablecoins become increasingly mainstream in everyday transactions. Eligible users now have access to a streamlined method for generating returns, making purchases, and executing trades without transferring assets between different accounts.
mUSD Yield Integration Powers Money Account
The Money Account centers on mUSD, MetaMask’s proprietary stablecoin engineered for transaction processing and account management. Users have the ability to exchange compatible stablecoins for mUSD at a one-to-one exchange rate with no conversion charges. Additionally, mUSD can be acquired through approved fiat payment channels in jurisdictions where the service is available.
The platform distributes opted-in funds through third-party vault systems overseen by Veda. Initially, assets are channeled into Morpho protocols, with Aave integration planned for subsequent releases. Yield calculations refresh within the account interface and may achieve up to 4% variable annual percentage yield after applicable fees.
According to Consensys, Bridge maintains the reserve assets supporting mUSD through U.S. dollar holdings and short-duration Treasury securities. The stablecoin operates on M0 infrastructure, while yield production functions independently from reserve backing mechanisms. MetaMask emphasizes that users retain full control over their private keys, preventing the company from accessing or moving user funds.
Payment Functionality Via Monad Integration
Money Account operates on the Monad blockchain, which facilitates rapid settlement times and consistent transaction expenses. The architecture employs sponsored gas fee models, enabling users to manage their balances without incurring network costs. This framework supports seamless payment processing, yield generation, and trading activities from a consolidated balance.
MetaMask has integrated the account with its MetaMask Card in regions where the card service operates. Transactions automatically settle using the Money Account balance without requiring additional conversion procedures. Qualified card transactions may also generate up to 3% cashback rewards distributed in mUSD.
The service accommodates multiple stablecoins, including USDC, USDT, DAI, aUSDC, aUSDT, and aDAI across compatible blockchain networks. Account funding options include cryptocurrency transfers and approved fiat on-ramp services. MetaMask has deployed this functionality worldwide, excluding the United Kingdom and certain restricted territories.
Crypto Wallets Evolve Toward Full Banking Services
MetaMask’s Money Account debut reflects intensifying competition among wallet providers and exchanges to capture more comprehensive financial services. Cryptocurrency platforms are increasingly incorporating payment systems, savings mechanisms, and trading features centered around stablecoin balances. This evolution parallels growing stablecoin adoption among traditional banks, payment processors, and established financial institutions.
The launch coincides with ongoing regulatory discussions surrounding stablecoin yield offerings in the United States. Government agencies and legislative bodies continue examining how cryptocurrency companies can provide returns on stablecoin deposits. These deliberations may significantly influence future products that merge payment processing, asset custody, and decentralized finance returns.
MetaMask has simultaneously expanded into automated financial tools through its Agent Wallet product. This solution enables AI agents to execute transactions according to user-established parameters and restrictions. Collectively, these initiatives demonstrate MetaMask’s strategic transformation from a simple cryptocurrency wallet into a comprehensive financial management platform.

TLDR
- Avalanche Treasury Corp told regulators it may not survive the year due to financial strain.
- The company cited “substantial doubt” about its ability to continue as a going concern.
- AVAX price declines led to major writedowns and over $26 million in quarterly losses.
- The firm’s AVAX holdings dropped to nearly half of their original purchase value.
- Shares collapsed over 90% within a month and now trade below $0.73.
Avalanche Treasury Corp told regulators it may not survive the year after a steep decline in its finances. The company disclosed material losses and liquidity pressure linked to falling AVAX prices. It also warned that current conditions raise “substantial doubt” about its ability to continue operations.
AVAX Holdings Decline and Balance Sheet Pressure
The company previously promoted a large AVAX treasury valued near one billion dollars during last year’s expansion phase. However, market conditions changed, and the value of its AVAX holdings dropped sharply over recent months. As a result, its market capitalization fell below thirty million dollars, reflecting severe investor concern.
Its operating unit reported losses exceeding twenty-six million dollars in one quarter due to AVAX writedowns. The firm bought AVAX for about two hundred sixty-five million dollars, yet the holdings fell to nearly one hundred twenty-three million dollars. This gap left the company holding assets worth far less than their original purchase cost.
AVAX prices declined forty-seven percent this year and nearly two-thirds over the past twelve months. Consequently, the treasury strategy weakened as asset values dropped and reduced the firm’s financial flexibility. The company stated that these conditions created ongoing uncertainty regarding its financial stability.
Stock Collapse Follows AVAX Treasury Strategy
Avalanche Treasury Corp completed a merger with a blank check company and entered public markets with high expectations. However, investor sentiment turned negative as disclosures revealed risks tied to its AVAX exposure and financial position. The stock fell from above ten dollars to below two dollars within days of additional filings.
Shares continued to decline and traded below seventy-three cents, entering penny stock territory. In total, the stock lost more than ninety percent of its value within one month. This decline reflected market concern over the sustainability of its AVAX treasury model.
The company also pledged a large portion of its AVAX holdings as collateral for a loan agreement. It committed nearly seven point eight million AVAX tokens from a total of thirteen point eight million holdings. This move increased financial risk as falling prices could pressure collateral requirements.
Other AVAX Treasury Firms Show Similar Declines
Other firms pursuing AVAX treasury strategies reported similar declines in value after initial expansion plans. AgriFORCE Growing Systems rebranded as AVAX One and announced a large capital raise to acquire more AVAX. The company aimed to build a significant AVAX treasury supported by strategic investors and advisors.
Despite those plans, its market value dropped sharply and now stands near forty-three million dollars. The firm’s shares declined sixty-eight percent this year and over ninety percent in the past year. These figures highlight the broader pressure affecting companies holding large AVAX reserves.
Data across the sector shows a consistent downward trend in treasury company valuations linked to AVAX exposure. Companies that accumulated AVAX during earlier market optimism now face reduced asset values and weaker investor confidence. This trend underscores the risks tied to concentrated digital asset treasury strategies.
Strategy, the publicly traded firm behind the Strategy (formerly MicroStrategy) Bitcoin treasury model, has moved to reassure investors after a steep drop in both Bitcoin and its own shares intensified fears about the company’s complex capital structure. With Bitcoin trading below $60,000 and Strategy’s stock down more than 70% from its highs, attention has turned to STRC—Strategy’s preferred-like security—and the possibility that its funding mechanics could amplify downturns.
On Monday, Strategy unveiled a new capital framework designed to address concerns around liquidity, financing reflexivity, and the company’s ability to meet obligations during stress. The plan includes up to $1 billion of buybacks for MSTR, up to $1 billion of buybacks for STRC and related securities, an increase in STRC’s dividend to roughly 12%, and expansion of the company’s cash buffer to $2.55 billion. Strategy also disclosed that it may sell up to $1.25 billion in BTC holdings if needed to satisfy dividend or debt requirements.
Key takeaways
- Strategy’s new framework combines buybacks (MSTR and STRC) with a larger cash reserve, aiming to reduce uncertainty during market stress.
- STRC’s dividend is expected to rise to roughly 12%, supported by expanded cash resources under the plan.
- Strategy added a contingency option: selling up to $1.25 billion in Bitcoin if required for dividend or debt obligations.
- Short-term trading activity improved after the announcement, with STRC and MSTR both rallying more than 12% in after-hours trading, according to Yahoo Finance.
- Debate continues over whether the company’s structure can withstand prolonged tightening in funding markets—even if it is not expected to face near-term insolvency.
What Strategy outlined in its capital framework
Strategy’s announcement centers on a restructuring of how it intends to manage risk across its Bitcoin-linked balance sheet and its layered security offerings. The company says the package includes up to $1 billion in buybacks for MSTR and up to $1 billion in buybacks for STRC and related securities.
In addition to buybacks, Strategy is increasing the STRC dividend rate to roughly 12% and expanding its cash buffer to $2.55 billion. Strategy’s filing—an 8-K submitted June 29—spells out the mechanics and priorities management would follow in its capital allocation framework, including an emergency pathway that allows BTC sales if needed to meet obligations.
Crucially for investors who worry about “reflexive” downside dynamics, Strategy also said it may sell up to $1.25 billion in BTC holdings to meet dividend or debt requirements. That disclosure is notable given Strategy’s long-standing “Bitcoin maximalist” positioning and the recurring argument that selling BTC during stress could worsen market conditions.
Following the release, markets reacted positively. As reported with reference to Yahoo Finance, STRC and MSTR shares rose more than 12% in after-hours trading. The piece notes STRC was trading at $84.86 after the announcement, up from $72.06 on June 26.
Why STRC is a flashpoint for investors
STRC sits in the middle of Strategy’s capital structure—positioned as a perpetual preferred-like instrument linked to the broader Bitcoin treasury strategy. Strategy describes STRC as paying an annual dividend of about 12% on a $100 par value, supported by cash and its Bitcoin-linked capital framework.
This design has drawn skepticism from critics who argue that the instrument’s stability depends less on Strategy’s underlying solvency and more on the health of secondary-market demand and liquidity conditions. In other words, even if STRC is not a classic stablecoin, its market behavior can still be sensitive to tightening access to capital.
Earlier concerns have focused on how Strategy’s treasury approach could interact with market stress. Bitcoin critic Peter Schiff has repeatedly challenged Strategy’s model, warning that Strategy can’t sell Bitcoin without negatively affecting Bitcoin’s price and pointing to potential spillover effects if purchasing activity slows or selling accelerates.
At the same time, some analysts and market participants argue the risk framing is overstated. Taran Dhillon, head of digital assets at Kula, told Cointelegraph that Bitcoin volatility alone is unlikely to break the structure; he suggested the more important test is whether Bitcoin remains under pressure while funding becomes progressively more expensive or difficult.
The bear case: liquidity dependency and potential feedback loops
Much of the controversy around Strategy’s structure relates to how its financing cycle can behave in both directions. The core bear argument is that the same momentum that fuels expansion in calmer conditions can intensify stress when investors pull back, funding costs rise, or liquidity in secondary markets deteriorates.
Cointelegraph reported that Brad Garlinghouse, CEO of Ripple, made a similar point on CNBC, criticizing financial engineering as a driver of long-term value. Kyle Rodda, senior analyst at Capital.com, characterized Strategy as a momentum-driven accumulation vehicle: capital raises funds for Bitcoin purchases, and those purchases support the company’s valuation. But he warned the dynamic can reverse when market conditions weaken, funding costs rise, and investor appetite declines.
Rodda also emphasized that secondary market liquidity is a structural dependency. If refinancing pressures or forced selling forces larger adjustments elsewhere, the spillover effects could extend beyond Strategy itself.
Some prominent Bitcoin commentators have compared the scenario to prior stress-tested leveraged structures in crypto. Charles Edwards, founder of Capriole Investments, has been among the critics drawing parallels to Terra/LUNA-era dynamics during drawdowns, framing the situation as potential “feedback loop” risk rather than a purely price-driven story.
The neutral and bull positions: stress may target funding markets first
Not all observers agree that the primary threat is Bitcoin price movement. Dhillon suggested that any early instability would likely show up first in funding conditions—such as widening discounts, higher yields, and reduced issuance capacity—rather than immediate solvency failure tied directly to Bitcoin valuation.
He also highlighted a key distinction: STRC is not a stablecoin pegged mechanically to $100. Instead, its yield profile is designed to adjust with market pricing. The logic, in theory, is that when STRC trades below par value, the effective yield becomes more attractive to buyers, eventually pulling pricing back toward $100.
Cointelegraph also referenced a Bitfire Research report shared with the outlet, which argued that recent STRC price dislocations should not automatically be treated as structural failure. The report stated that Strategy faces no near-term insolvency risk, attributing de-pegging events largely to sentiment and liquidity conditions rather than a sudden change in fundamentals or solvency profile.
On the bull side, the article describes a “three-year MSTR stress test” conducted by Bitcoin supporter Adam Livingston. His model assumes extreme conditions—including a 55% Bitcoin drawdown, closed capital markets, and continued cash burn requiring large Bitcoin sales. The simulation also tracks a dramatic compression in “common equity Bitcoin exposure” (CEBE) and estimates that Strategy would sell approximately 115,727 BTC over three years to meet obligations before stabilization returns.
In Livingston’s scenario, the company survives the cycle and ends with over 700,000 BTC on its balance sheet, with a recovering net asset structure once conditions normalize. The takeaway from this model, regardless of how an investor views its assumptions, is that proponents believe the balance-sheet framework could be robust enough to survive even severe drawdowns—particularly if contingency mechanisms are executed as planned.
What changed—and what remains uncertain
Strategy’s new framework can be viewed as an attempt to make its stress-response playbook more concrete. According to the article’s references to Strategy’s June 29 8-K filing, management is focusing on transparency around how it would act during liquidity or capital-market disruptions—especially through cash buffer expansion, buybacks for both MSTR and STRC, and the ability to monetize Bitcoin up to $1.25 billion if required.
Dhillon described the changes as a meaningful improvement to transparency and confidence, pointing to the enlarged $2.55 billion reserve and a clearer plan for how Bitcoin monetization would work under pressure.
However, critics argue the fundamental dependency remains. Schiff, as cited in the piece, pointed to market-cap vs. Bitcoin value asymmetries—arguing that as long as MSTR’s market cap remains below the value of its Bitcoin holdings, newly issued capital could imply a “negative Bitcoin yield.” In other words, for some skeptics, the debate is not whether contingency tools exist, but whether the market structure will persistently price exposure in a way that helps—or harms—long-term holders.
Ultimately, Strategy’s framework strengthens the company’s toolkit for short-term stress, but it does not remove its reliance on access to capital markets over time. The key unresolved question is whether expanded liquidity buffers, buybacks, and contingency BTC sales can stand up to a prolonged period of tightening across both equity and credit-style markets—precisely the environment where feedback-loop concerns tend to matter most.
For investors, the next watch items are straightforward: whether STRC’s pricing relationship to par value stabilizes, how funding conditions evolve if Bitcoin stays under pressure, and whether Strategy’s disclosed order of operations holds up in practice during the next stress test.


The United States just lifted export controls on Anthropic’s Claude Fable 5 and Mythos 5. The Commerce Department cleared both models on June 30, paving the way for a swift restoration of full global access starting July 1.
The resolution ends nearly three weeks of tense negotiations between Anthropic and the White House.
What the Lifted Export Controls Actually Mean
An export control is a US rule that restricts who can access sensitive technology, including advanced AI models, based on national security concerns. The Commerce Department imposed one on Claude Fable 5 and Mythos 5 shortly after the models launched. It has now been formally reversed.
The original directive landed on June 12, just three days after the models went live on June 9. Furthermore, it cited national security concerns reportedly tied to potential model jailbreaks. As a result, Anthropic suspended access for foreign nationals worldwide across every product surface.
The rule caused immediate operational chaos. Segmenting users by nationality in real time proved impossible in practice. Consequently, Anthropic took both models entirely offline for customers on Claude.ai, the API, AWS Bedrock, and other partner platforms until the situation could be resolved.
The company confirmed the reversal directly. “We’ve received notice that the Department of Commerce has lifted export controls on Claude Fable 5 and Mythos 5. We’ll begin restoring access tomorrow, and will share an update soon,” Anthropic posted on June 30.
Why Claude Fable 5 and Mythos 5 Matter So Much
Claude Fable 5 stands as Anthropic’s most capable widely available model. It is built on the powerful Mythos-class architecture but ships with enhanced safeguards for general use. Furthermore, it excels at demanding reasoning tasks, long-horizon agentic work, software engineering, and advanced vision capabilities.
Mythos 5 targets more sensitive workloads. The model shares the same underlying architecture but comes with lifted safeguards for cybersecurity applications. Moreover, access was originally reserved for trusted partners through Project Glasswing across high-stakes government and enterprise deployments.
Pricing keeps both models competitive across the industry. Anthropic charges 10 dollars per million input tokens and 50 dollars per million output tokens. Additionally, built-in classifiers automatically route high-risk queries to safer fallbacks, especially on cybersecurity and biology-related tasks across every product surface.
The resolution highlights a broader shift in the AI industry. Anthropic held intensive talks with Commerce Department and White House officials throughout the standoff. As a result, the swift lifting signals both effective advocacy and a maturing regulatory framework for advanced AI systems across the entire United States.
The post US Lifts Export Controls on Anthropic’s Claude Fable 5 and Mythos 5 Models appeared first on BeInCrypto.

Fable and Mythos: Anthropic says US lifts export ban on its advanced AI tools

Ether risks sliding below $1,500
Jason Statham’s $1.5 Billion Success Proves He Needs a Tom Cruise Team-Up

No Jackpot Winner as $257 Million Prize Rolls Over to $269 Million Monday Draw

Renter of Home in Anne Heche Crash Denies Settlement With Son

Two goals and an assist by sheer aura: Cristiano Ronaldo just entered the World Cup chat

How To Become Crypto Millionaire #trading #crypto #bitcoin

RECEIVE UNEXPECTED MONEY IN 10 MINUTES (MONEY FLOWS TO YOU) Music to attract money

Crypto Live Trading| 30 june #vinbullindia #livetrading #vinbulllive #live #trading #cryptotrading
-

 Fashion4 days ago
Weekend Open Thread: Staud – Corporette.com
-

 Politics5 days ago
The House | Manchesterism won’t survive the painful trade-offs unless it gets citizens on board
-

 Crypto World23 hours ago
Strategy authorizes up to $1.25B in Bitcoin sales under new capital plan
-

 Politics5 days ago
Potential 2028er World Cup attendee leaderboard
-

 Business5 days ago
Asia stock markets slide as tech shares slump
-

 News Videos2 days ago
MAJOR BITCOIN & MARKET UPDATE!!!! (MUST WATCH ASAP!!!)
-

 Tech5 days ago
A Look At A Gaggle Of Transputer Boards
-

 Crypto World7 days ago
Securitize Wraps Roubini's SEC-Registered ETF as Dubai VARA Digital Security
-
Crypto World7 days ago
Bitcoin (BTC) Dips Below $62K, Ethereum (ETH) Plunges 6% Daily: Market Watch
-
 Crypto World5 days ago
Dell (DELL) Shares Tumble Over 5% Following Analyst Downgrade to Hold
-

 Crypto World3 days ago
Coinbase, Circle Deepen Crypto Stock Losses Despite Resilient S&P 500
-

 Crypto World4 days ago
Kraken's xStocks Opens Bending Spoons IPO Registration to EEA Retail
-

 Business22 hours ago
Australia treasurer says alleged access of prime minister’s bank data ’incredibly concerning’
-

 Sports4 days ago
FIH Pro League: India defeat Pakistan 7-1, register biggest win of campaign | Other Sports News
-
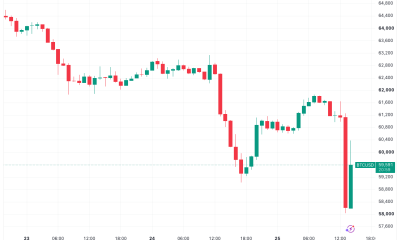
 Crypto World5 days ago
Bitcoin Sparks $600M Hourly Liquidations With $65,000 Set To Become Resistance
-

 Tech3 days ago
Bluekit phishing kit adopts browser-in-the-middle for login theft
-

 Tech4 days ago
Russian hackers now target Signal backup recovery keys
-
Crypto World4 days ago
Hyperliquid Named on Singapore MAS Investor Alert Register
-
 Crypto World6 days ago
Ripple and SBI launch RLUSD in Japan after JFSA approval
-

 Crypto World4 days ago
RTX holders must register wallets before token distribution begins
You must be logged in to post a comment Login