

Crypto World
Corporate chain land grab: Base, Tempo, Robinhood Chain


On July 1, Robinhood launched its own blockchain, joining Coinbase, Stripe, Circle, and Tether in the fastest-moving infrastructure race in crypto: giant consumer companies building their own rails instead of renting someone else’s. The land grab has a clear logic, clear winners, and one uncomfortable question about what happens to the neutral chains everyone used to build on.
Summary
- Robinhood has joined Coinbase, Stripe, Circle, and Tether in building its own blockchain, accelerating the corporate race to own crypto infrastructure instead of relying on public networks.
- Corporate chains promise higher margins, greater product control, and built-in user distribution, making infrastructure ownership an increasingly attractive strategy for major financial platforms.
- The shift raises long-term questions about the future of neutral blockchains, as corporate-controlled networks compete for developers, liquidity, and the value once captured by open ecosystems.
For most of crypto’s history, the deal between companies and blockchains was simple: the chains were public infrastructure, and companies were tenants. Coinbase listed tokens on other people’s networks. Stripe processed payments over other people’s rails. Robinhood gave customers a buy button for assets that lived somewhere else. The chains were roads; the companies drove on them.
That arrangement is ending in real time. On July 1, at an event in London called “The World is Flat”, Robinhood launched the public mainnet of Robinhood Chain, its own layer 2 network, and moved its tokenized stock business onto rails it controls.
The launch slots into a pattern that has become the defining infrastructure story of this cycle: Coinbase built Base and turned it into a revenue machine. Stripe incubated Tempo and shipped it in March with half of global finance as design partners. Circle is building Arc. Tether has backed its own settlement chains. In the span of 2 years, nearly every large company that touches crypto has concluded the same thing: owning the road beats paying tolls on it.
The speed of the shift is easy to miss because each launch arrived dressed as a product announcement. Assemble the timeline instead: Base in 2023, the first proof that a corporate chain could scale. The stablechain wave forming through 2025 as the GENIUS Act clarified the rules. Tempo’s testnet in December with Visa and Mastercard already inside, its mainnet in March, Robinhood Chain’s testnet in February and mainnet in July.
What took the neutral ecosystems a decade of grant programs and hackathons, bootstrapping users, liquidity, and developer attention, the corporations are compressing into quarters by shipping the users and liquidity pre-attached. The chains did not get easier to build. The distribution finally showed up owning the builders.
Robinhood’s version is the most retail-facing yet, and the most aggressive about what it puts on-chain. This is the map of the land grab: who is building what, why the economics are irresistible, and what the corporatization of blockspace does to the industry that invented it.
What Robinhood actually launched
The July 1 announcement bundled a full product offensive, but the chain is the center of gravity. Robinhood Chain is an Ethereum layer 2 built on Arbitrum technology, running 100-millisecond block times, live on public mainnet after a testnet that opened in February. The company describes it as AI-native and purpose-built for real-world assets, and unlike the walled gardens skeptics expected, it is permissionless: anyone can deploy contracts, and users can interact through self-custody wallets without touching Robinhood’s brokerage at all.
The anchor tenant is Robinhood’s own tokenized equity business. Stock Tokens, the company’s tokenized shares, are live through Robinhood Wallet in more than 120 countries, with the tokenized United States stocks and ETFs that previously lived on Arbitrum migrating to the new network. The design goal is straightforward: equities that trade around the clock and plug into decentralized finance as collateral, the same premise the SpaceX listing just stress-tested across the whole industry.
Around the anchor, Robinhood assembled a launch ecosystem that reads like a checklist of what a chain needs on day one. Uniswap is deploying a dedicated automated market maker as the primary public liquidity venue, with Pleiades running a separate platform for proprietary trading. Alchemy, BitGo, Chainlink, and 0x shipped day-one infrastructure support.
Robinhood Earn gives United States users an estimated 7% yield lending the USDG stablecoin through Morpho from a self-custody wallet. Perpetual futures arrive through an integration with the decentralized exchange Lighter, sweetened with an $11 million token rewards program, while Agentic Accounts let eligible users wire AI models directly into Robinhood’s trading infrastructure.
The market’s verdict was immediate: HOOD jumped 8% toward $108 on launch day, with Cantor Fitzgerald having already raised its target to $130 on the product pipeline. The enthusiasm has context worth keeping. Robinhood’s crypto transaction revenue fell 47% year over year in the first quarter to $134 million; the company cut 10% of its workforce weeks before the launch, and the stock remains roughly 30% below its October record.
The chain is not a victory lap. It is a bet that owning infrastructure smooths out a revenue line that trading fees alone cannot, backed by the $51 billion in crypto custody assets and the Bitstamp exchange acquisition the company already sits on. Our news desk covered the launch mechanics when they landed; the bigger story is the pattern the launch completes.
The strategic sequencing is worth noticing too, because it shows how deliberately the ladder was climbed. Robinhood spent 2025 acquiring the pieces: Bitstamp for exchange infrastructure, WonderFi for Canadian licensing, tokenized SpaceX and OpenAI products in Europe as a proof of concept. It spent early 2026 testing the chain quietly while expanding perpetuals in Europe, where crypto derivatives became one of its fastest-growing products.
The July launch assembled everything into a single architecture: assets tokenized on its own network, traded through its own wallet, leveraged through partnered perpetuals, yielding through integrated lending, and increasingly operated by customers’ AI agents through its own trading interface. Each layer feeds the others, and every layer that used to belong to a partner now belongs to the platform. Vlad Tenev has called tokenized stocks inevitable; the chain is the claim that the inevitability should run on his rails.
The pattern: everyone builds now
Put the corporate chains side by side, and the strategy differences sharpen.
Base is the template and the proof. Coinbase launched its Ethereum layer 2 in 2023, and it became the fastest-scaling network of its generation, generating sequencer revenue, anchoring the exchange’s on-chain strategy, and proving the core economics: a company with a large user base can route those users onto its own chain and capture value at the infrastructure layer that it previously leaked to others. Base also showed the failure mode this June, suffering 2 outages within hours from a sequencer bug, a reminder that corporate chains concentrate operational risk in exactly one place.
Tempo is the payments-native version. Incubated by Stripe with Paradigm and launched to mainnet in March, it is a layer 1 built purely for stablecoin settlement: gas payable in any major stablecoin instead of a native token, ISO 20022 compatibility for bank back offices, and a Machine Payments Protocol co-developed with Stripe that lets AI agents authorize and stream payments autonomously.
The design-partner list, including Visa, Mastercard, Deutsche Bank, Standard Chartered, Revolut, Nubank, Shopify, OpenAI, and Anthropic, signals the ambition: not a crypto chain with payments features, but a settlement standard for the $190 trillion cross-border market, launched by the company that processed $1.9 trillion in payments last year. crypto.news covered the mainnet launch in March, and the venture’s $500 million raise at a $5 billion valuation says the capital markets take the ambition literally.
Circle’s Arc and the Tether-aligned settlement chains extend the same logic to issuers: if your product is a dollar token, the chain it settles on is your cost structure and your regulatory perimeter, so own it. Even the consortium behind Open USD chose a launch chain, Solana, as one of its first architectural decisions, because in 2026 the question of where this settles is inseparable from who captures the value.
Robinhood Chain adds the missing archetype: the retail brokerage chain, where the asset being brought on-chain is not a stablecoin or an exchange’s order flow but the entire traditional portfolio, stocks, ETFs, and eventually whatever else the securities rulebook allows.
The stablechain sub-race deserves its own map
Within the broader land grab, the payments-specific chains have become a category with its own name, stablechains, and its own competitive logic, because the prize they contest is the largest: the settlement layer for a stablecoin market above $300 billion today and projected by Citi to reach $4 trillion by 2030.
Tempo’s design choices show what purpose-built means in practice. The chain has no native gas token at all; transaction fees settle in any major stablecoin through an integrated exchange mechanism, removing the token-price volatility that makes enterprise finance departments allergic to blockchain cost accounting. Its ISO 20022 compatibility means bank reconciliation systems can read its messages natively, and its throughput targets are set against payments workloads instead of trading ones.
The venture also declined to issue a token at launch, citing regulatory clarity, a decision that separates the stablechains philosophically from the token-financed networks they compete with: Tempo’s backers monetize through the businesses the chain enables, not through a coin.
The competitive set is filling in fast. Circle’s Arc approaches from the issuer side, Stable and the Plasma-style ventures approach from the Tether ecosystem, and the incumbent general-purpose chains are retrofitting payments features to defend the flows they already host. Solana’s counterargument is that a fast general-purpose chain with existing liquidity beats a specialized newcomer, and winning the Open USD launch was a material point in that argument.
Ethereum’s counterargument is that corporate layer 2s like Base and Robinhood Chain keep settling on it anyway, making it the quiet beneficiary of every corporate launch that chooses the rollup route. The stablechain race is therefore also a proxy war over whether the future of payments settlement is specialized or general, and no result so far is decisive.
What every contestant shares is the same tell: the serious money in crypto has concluded that payments, not speculation, is the volume that matters next, and that whoever operates the rails for it collects the most durable fees in the industry. Stripe processing $1.9 trillion a year off-chain is the number every stablechain pitch deck opens with, because capturing even single-digit percentages of flows like that on-chain would dwarf the fee revenue of everything DeFi has ever built.
The market Tempo names explicitly the $190 trillion in annual cross-border payments still moving through correspondent banking with 1-3 day settlement, is the largest unclaimed territory in finance, and stablecoin volumes doubling to $400 billion last year with 60% of it business-to-business says the migration has started without waiting for anyone’s permission.
The developer calculus nobody says out loud
The land grab’s quietest constituency is developers, and their private math will decide more than the launch events do.
Building on a corporate chain offers what neutral chains historically could not: distribution. A protocol deploying on Robinhood Chain is one integration away from tens of millions of funded retail accounts; on Base, from the largest United States exchange’s user base; on Tempo, from the merchant internet. For consumer applications that die of user-acquisition costs, that proximity is worth real sovereignty concessions, which is why Uniswap, Morpho, Aave, and the rest of blue-chip DeFi keep showing up as day-one partners on chains owned by corporations. The protocols are not confused about the trade; they are pricing it.
The concessions are real, though, and developers enumerate them privately. A corporate chain’s sequencer is a single counterparty that can reorder, delay, or censor whatever the roadmap promises about future decentralization. Its owner is a regulated company that will comply with orders neutral infrastructure might resist, and that can change fee structures, partnership terms, or strategic direction with a quarterly earnings cycle’s notice.
Most subtly, the owner is frequently a future competitor: a lending protocol thriving on a brokerage’s chain is a product demo for the brokerage’s own lending desk, and the platform history of the internet says the demo gets copied. Every developer choosing a corporate chain is betting they can extract the distribution before the platform extracts them, a bet with a long and mostly losing history outside crypto.
The equilibrium forming looks like a barbell. Applications that need users deploy where the users are and accept platform risk; infrastructure that needs neutrality, stablecoin issuers, bridges, oracles, deploys everywhere and belongs nowhere; and the neutral chains compete to be the settlement layer underneath both. It is a more corporate industry than the one the whitepapers described, and also a much larger one, which is the trade the whole cycle keeps making.
Why the economics are irresistible
The land grab is not fashion. Three economic forces make it close to inevitable for any company at this scale.
The first is margin capture. A company routing millions of users through public infrastructure pays for blockspace, market making, and settlement in fees that flow to someone else’s token holders and validators. The same company running its own chain converts those costs into revenue: sequencer fees, ecosystem deals, and the option to monetize every layer of the stack. Base proved the number is large; every subsequent chain is chasing it.
The second is product control. On a rented chain, an outage, a fee spike, or a governance fight is your product problem and someone else’s decision. Robinhood offering a 7% yield product and 24-hour stock trading to mainstream customers cannot outsource reliability to a network it does not operate, or so the reasoning goes; June’s Base outages cut both ways, showing both why companies want control and how controlling it concentrates the blame.
The third is distribution leverage, and it is the one that changes the competitive map. Chains historically fought for users app by app. A corporate chain arrives with the users pre-installed: Robinhood brings tens of millions of funded accounts, Stripe brings the merchant internet, Coinbase brought the largest United States exchange. The scarce resource in crypto was never blockspace; it was distribution, and the companies that own distribution have realized they can vertically integrate backward into infrastructure far more easily than infrastructure can integrate forward into distribution.
There is a fourth, quieter force: the regulatory clock. The GENIUS Act settled stablecoin rules, tokenized equities are inching through frameworks in Europe and Asia, and market structure legislation is grinding through the Senate. Companies are racing to have the rails built before the rules that legitimize the traffic are finished, because the standards that exist at legalization tend to become the standards, period.
What it means for the neutral chains
The uncomfortable question underneath the land grab is what happens to the ecosystems the corporations are building on top of, and around.
In the short run, the answer looks symbiotic. Robinhood Chain and Base both settle on Ethereum and pay for its security; Arbitrum licenses its technology into Robinhood’s stack; Solana hosts the consortium stablecoin and much of the tokenized asset flow. The corporate chains are customers of the neutral infrastructure, and their arrival validates the underlying platforms, which is precisely how Ethereum bulls frame every such launch in the ongoing argument over which L1 is actually winning.
The longer-run answer is less comfortable, because value and attention migrate to where activity lives, and activity increasingly lives one layer up from the neutral base. Some Ethereum layer 2 tokens have sunk to record lows this year even as corporate layer 2 activity grew, a divergence that shows the economics of the model concentrating with the operators rather than the ecosystems.
A world where the dominant consumer chains are owned by Coinbase, Stripe, Robinhood, and the issuers is a world where crypto’s neutral, credibly permissionless middle gets squeezed between corporate rails above and commodity security below. The industry spent a decade arguing that the point of this technology was infrastructure nobody controls. The fastest-growing infrastructure of 2026 has a specific someone in control of every layer that touches the customer, and the sharpest version of the critique says the industry is speed-running the history of the internet, open protocols first, walled platforms winning.
There is a measurable version of the squeeze already on the tape. The market rewards the operators: Coinbase’s stock carries Base in its valuation, HOOD rallied 8% on its chain launch, and Tempo’s $5 billion private valuation prices a network with months of history. The market punishes the middleware: several Ethereum layer 2 tokens printed record lows this year while the corporate chains built on identical technology thrived, because the corporate versions replaced the token with equity and the community with a customer base. The technology stack is winning while the token stack attached to its neutral versions loses, and that divergence, more than any philosophical debate, is what will pull the next 100 corporate chains into existence.
The optimistic rebuttal has real weight too. These chains are permissionless in the ways that matter mechanically: self-custody works, external developers can deploy, assets can exit. Robinhood explicitly built exit rights into its design, and a corporate chain that abuses its position faces the one discipline the old walled gardens never did: users who can bridge away with their assets in minutes.
The bet embedded in the whole land grab is that companies can capture infrastructure economics without triggering that exit, and the bet has not been seriously tested yet, because no corporate chain has yet faced the moment where its interests and its users’ interests point in opposite directions with real money on the line.
The pattern also has a stablecoin-shaped shadow: the same week Robinhood launched its chain, Circle watched 140 of its partners unveil a replacement for its business model, a reminder that in shared infrastructure, today’s platform owner is tomorrow’s disintermediation target.
The scoreboard from here
The metrics that will decide the race are unglamorous. Total value locked and developer migration on Robinhood Chain, against the built-in advantage of $51 billion in custodied assets. Whether Tempo converts its design-partner list into settlement volume that dents correspondent banking. Whether Base’s outages stay anecdotes or become a pattern that costs it the reliability argument.
Whether any corporate chain attracts meaningful third-party development, the thing that separates a platform from a product. And, hovering over all of it, whether regulators treat brokerage-operated blockchains as innovation to charter or vertical integration to unwind.
The regulatory question deserves the last stretch of attention, because it is the one variable none of the builders controls. A brokerage that operates the venue where its customers’ tokenized securities settle, lends against them, runs the wallet, and sells the order flow has reassembled, on new rails, precisely the vertical integration that a century of securities law spent itself disassembling. The companies know it, which is why the launches emphasize permissionlessness and self-custody, features that double as legal arguments.
Regulators know it too, and the pending market structure legislation will decide whether the corporate chain is a licensed product category or a conflict of interest with a block explorer. Europe has already shown, through its handling of exchange licensing, that a framework with teeth can lock the largest player out of a continent; the corporate chains are being built at maximum speed partly to be too integrated to unwind by the time an American framework grows the same teeth.
What is already settled is the direction. The era when serious consumer companies rented their crypto infrastructure lasted about a decade, and it ended without a single dramatic moment, just a sequence of launch events in London and San Francisco where, one by one, the tenants announced they had bought the building. Robinhood was not the first and will not be the last. The land grab has plenty of land left, and everyone with a user base now knows the price of not claiming any.
Disclaimer: This article is for informational purposes only and does not constitute investment advice. Digital asset markets are volatile, and you can lose your entire investment. Always do your own research. Information current as of July 4, 2026.

The Department of Government Efficiency (DOGE) officially ended on July 4, the sunset date written into President Donald Trump’s January 2025 executive order. Posts from Elon Musk and Michael Saylor quickly fueled speculation that Bitcoin (BTC) inherits the reform story.
Musk, DOGE’s former co-leader, marked Independence Day with a patriotic video montage instead of a farewell to the program. Meanwhile, MicroStrategy’s executive chairman answered him with one loaded line.
DOGE Ends With No Report and No Farewell
Trump’s January 2025 executive order created DOGE as a temporary organization. It set termination for July 4, 2026, America’s 250th birthday.
The program barely made it that far. DOGE had already collapsed as a centralized body last November, months ahead of schedule. Its public savings tracker went silent after January 1.
The commission claimed $215 billion in savings, about $1,335 per taxpayer by its own math. That equals roughly 3% of one year’s $7 trillion federal budget, and a fraction of the $2 trillion Musk pitched in October 2024.
Office of Management and Budget Director Russ Vought told lawmakers this week that no closing report is planned, Politico reported.
Musk, who left Washington in May 2025 after 130 days as a special government employee, always framed the ending as intentional.
Follow us on X to get the latest news as it happens
The efficiency concept has meanwhile traveled beyond Washington. New York City Mayor Zohran Mamdani recently launched a municipal efficiency version of the playbook.
Michael Saylor Answers Musk With a Bitcoin Pitch
Marc Andreessen opened July 4 with a five-minute montage of American history and the caption “God bless America.” Musk shared the same video hours later.
Saylor then replied to Musk directly, swapping a letter for the Bitcoin symbol.
Saylor has run this play before. In December 2020, he publicly urged Musk to shift Tesla’s balance sheet into Bitcoin. Tesla bought $1.5 billion worth two months later, then suspended BTC payments in May 2021 over energy concerns.
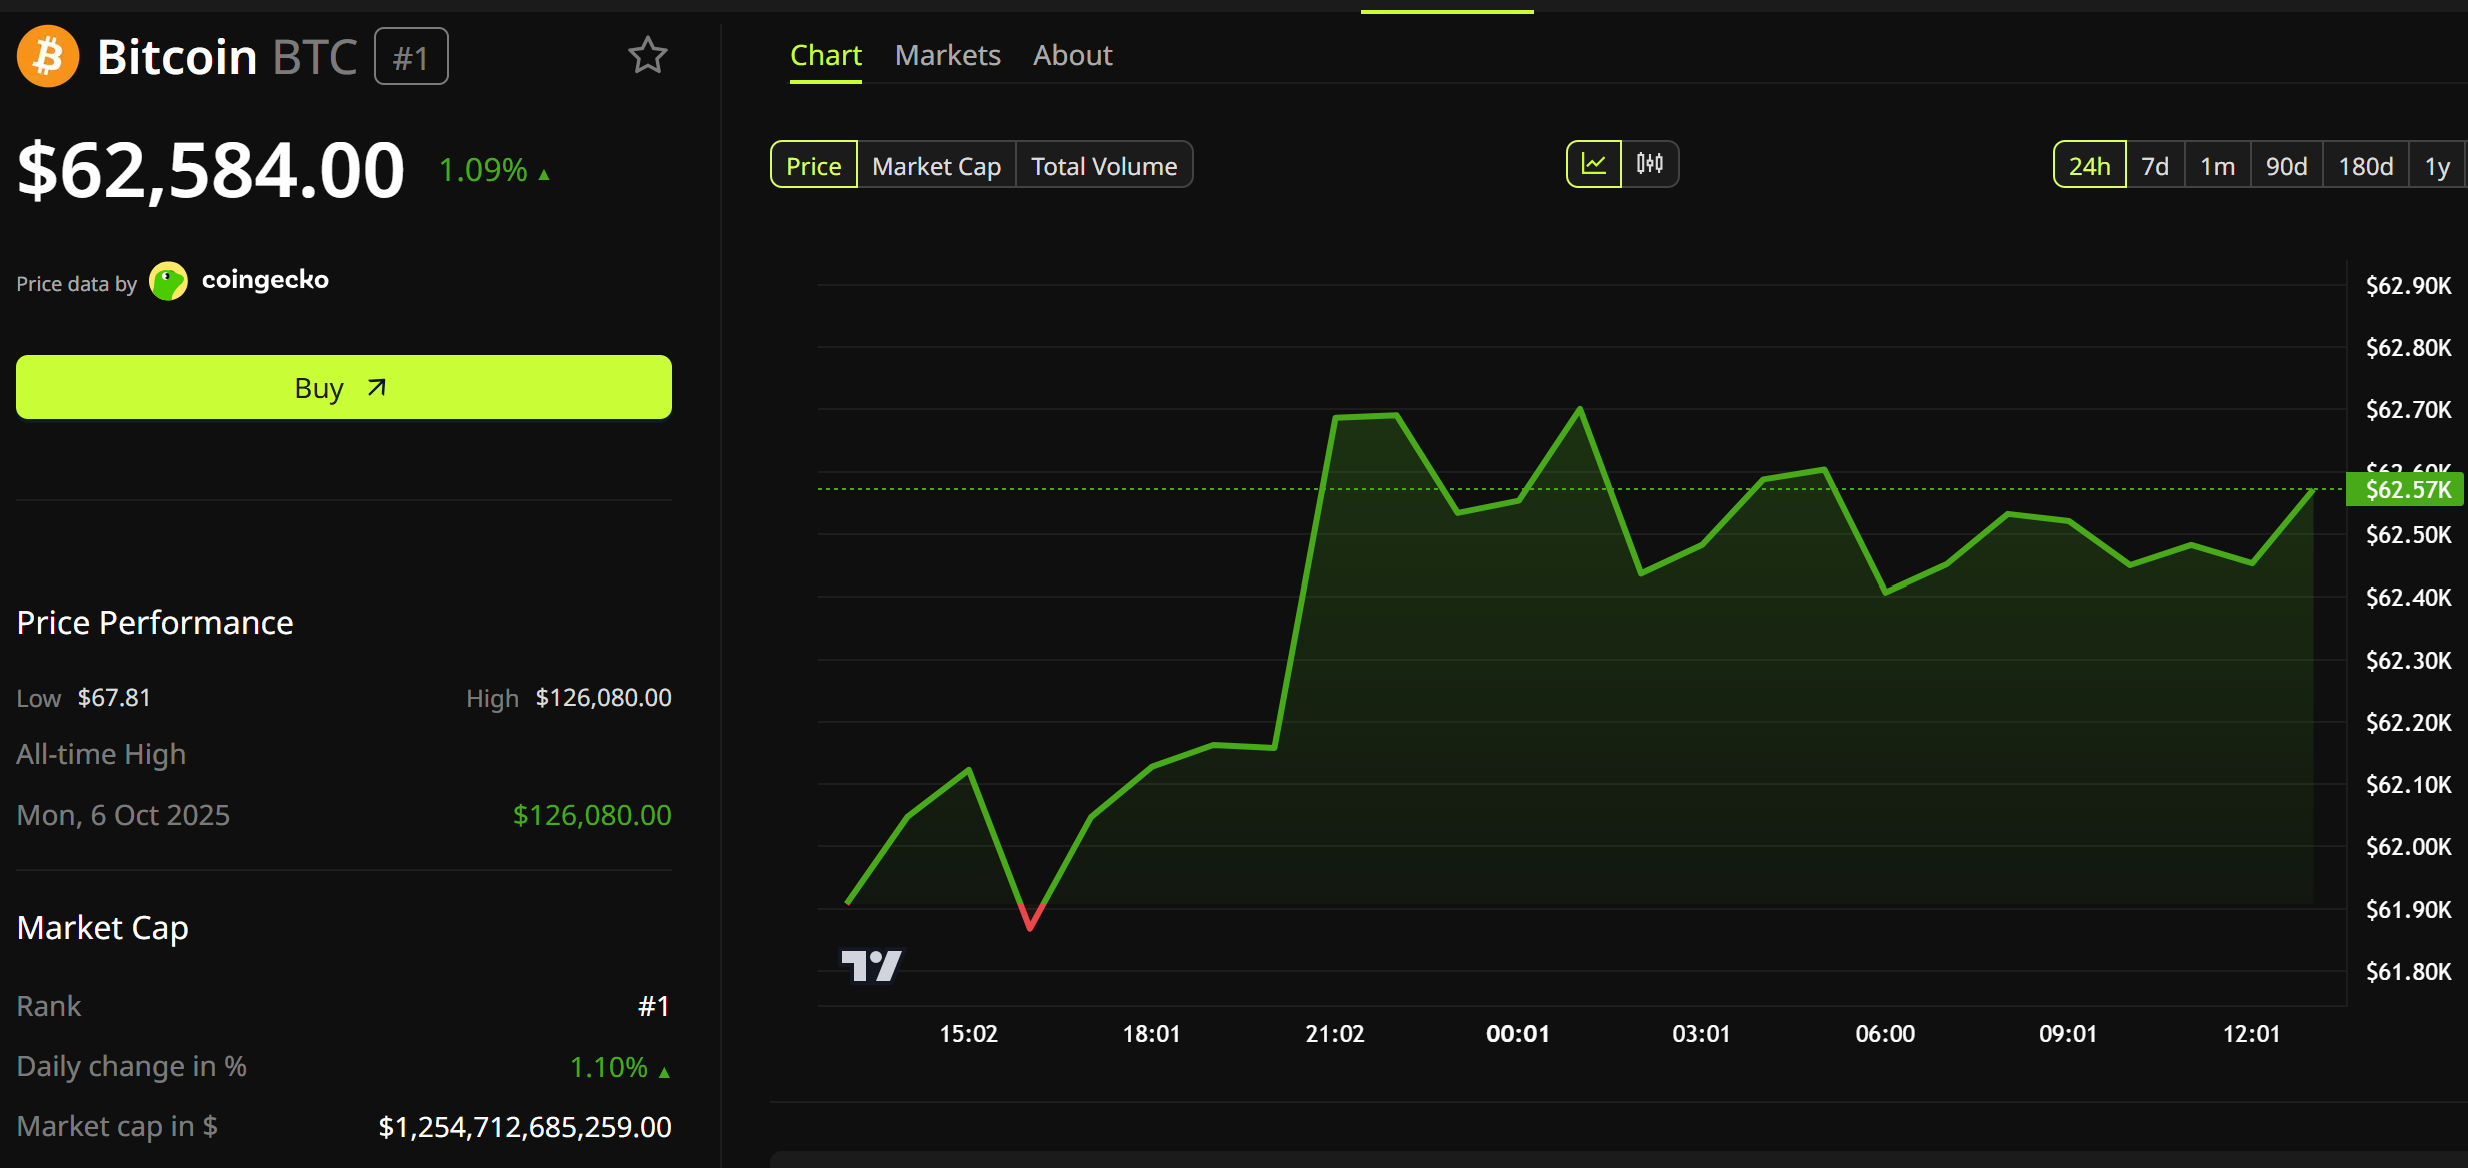
That history shaped the reaction. Traders read the exchange as a handoff from government reform to sound money, and some replies urged Tesla to resume Bitcoin payments. BTC trades near $62,584, up about 1% in 24 hours.

The timing carries irony for Saylor. Strategy faces questions over a reported 491 BTC sale and a dividend policy JPMorgan called risky. Meanwhile, Saylor pits MSTR against the Magnificent 7.
Neither Musk nor Saylor mentioned DOGE by name. The debate now turns on whether innovation and Bitcoin truly replace the reform push, or whether the ₿etter reply stays a holiday flourish.
The post DOGE Ends, Bitcoin Begins? Musk and Saylor’s July 4 Posts Fuel Speculation appeared first on BeInCrypto.
Ethereum has extended its recovery over the past several sessions, breaking above its recent consolidation range and approaching a major confluence resistance area. The rally has improved short-term sentiment, but the market is now testing a zone that could determine whether this move develops into a broader trend reversal or remains a relief rally within the prevailing downtrend.
Ethereum Price Analysis: The Daily Chart
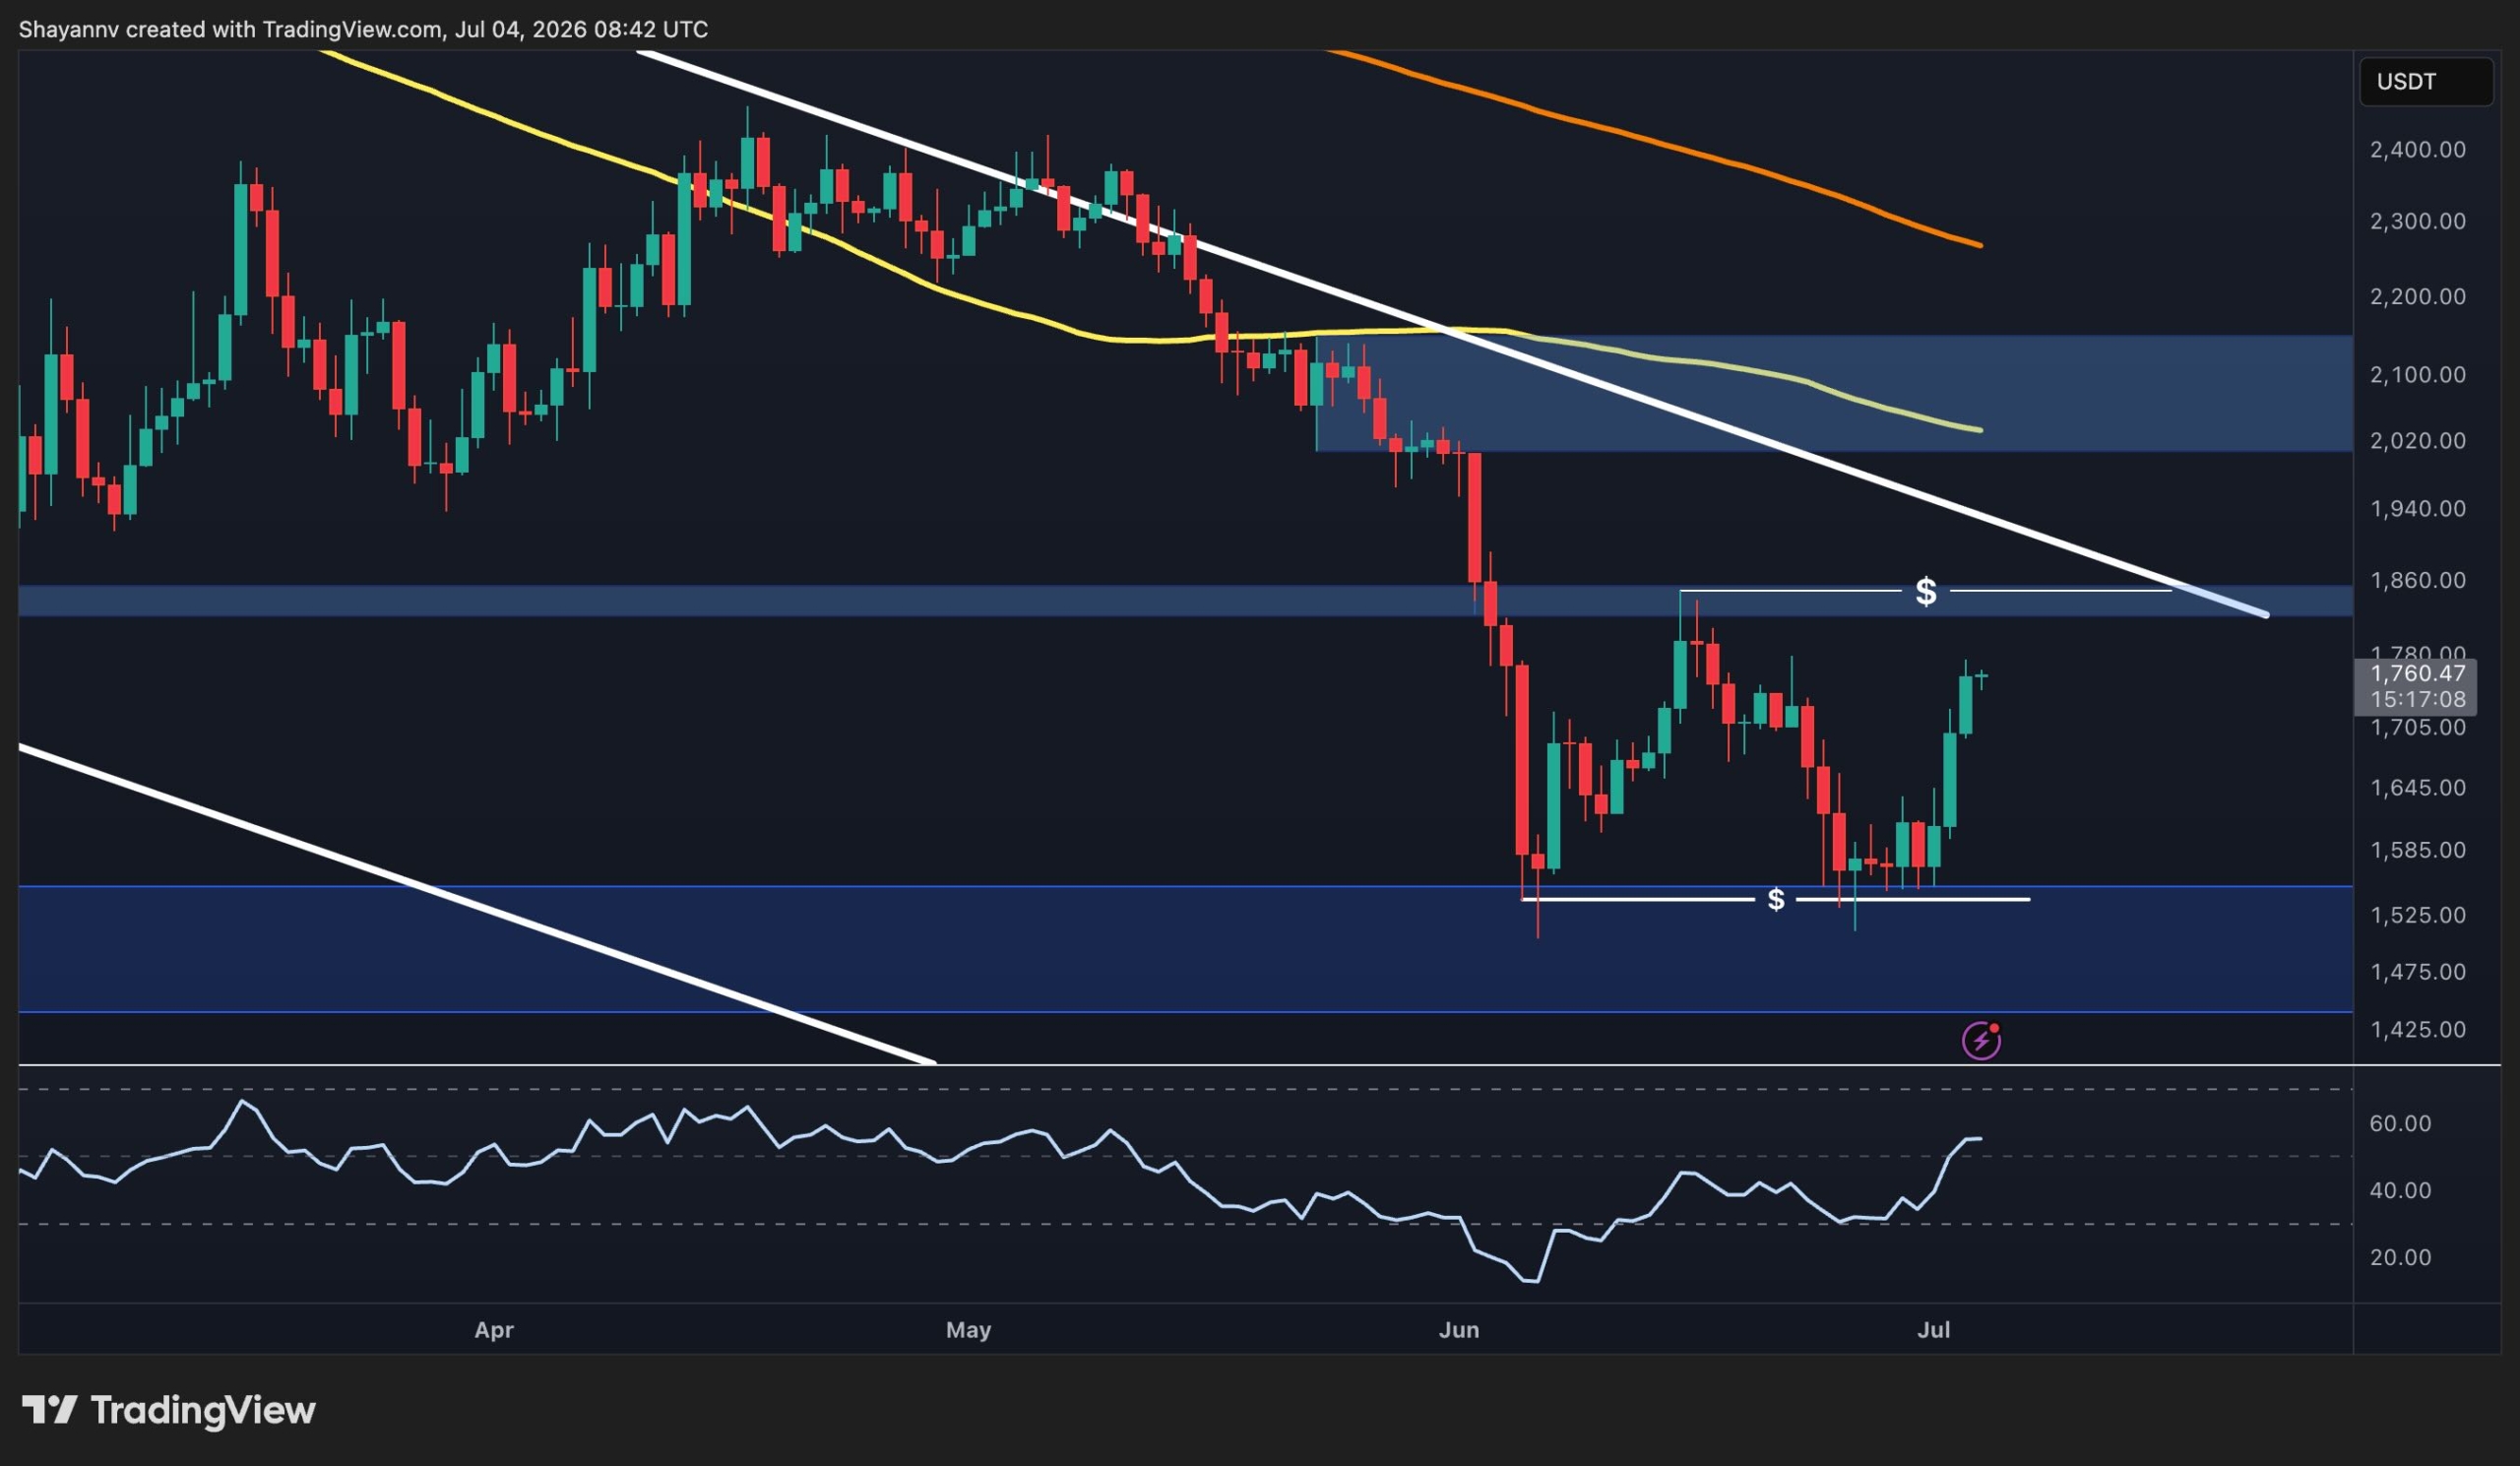
Ethereum continues to recover from the $1.46K-$1.53K demand zone, where buyers once again stepped in after defending the June lows. The rebound has now carried price toward the descending trendline that has capped every major rally since the May peak.
The recent advance has also reclaimed the $1.70K area, placing ETH just below the next key resistance cluster around $1.82K-$1.86K. This region is particularly important because it aligns with the long-term descending trendline, creating a significant technical confluence.
Momentum has improved considerably. The previously discussed bullish RSI divergence has continued to play out, with the indicator making higher highs while price has recovered sharply from support. This suggests bearish momentum has weakened substantially compared to previous sell-offs.
Nevertheless, the broader trend cannot be considered bullish until Ethereum breaks above the descending trendline and reclaims the higher resistance band. A rejection from this area would preserve the sequence of lower highs that has defined the market for the past several months.
ETH/USDT 4-Hour Chart
The 4-hour chart shows that Ethereum has successfully broken above its short-term consolidation and reached the first resistance zone around $1.70K-$1.74K. Buyers have maintained strong momentum following the breakout from the lower range, allowing the price to approach the upper boundary of the descending structure.
Price is now trading just beneath the falling trendline that has repeatedly rejected previous recovery attempts. A decisive breakout above this trendline would represent the first meaningful structural improvement since the broader decline began and could open the door for a move toward the $1.82K-$1.86K resistance area.
As long as Ethereum remains above the recently reclaimed $1.70K region, buyers retain short-term control. However, failure to overcome the descending trendline could trigger another rejection, sending price back toward lower support levels and extending the broader corrective structure.

Sentiment Analysis
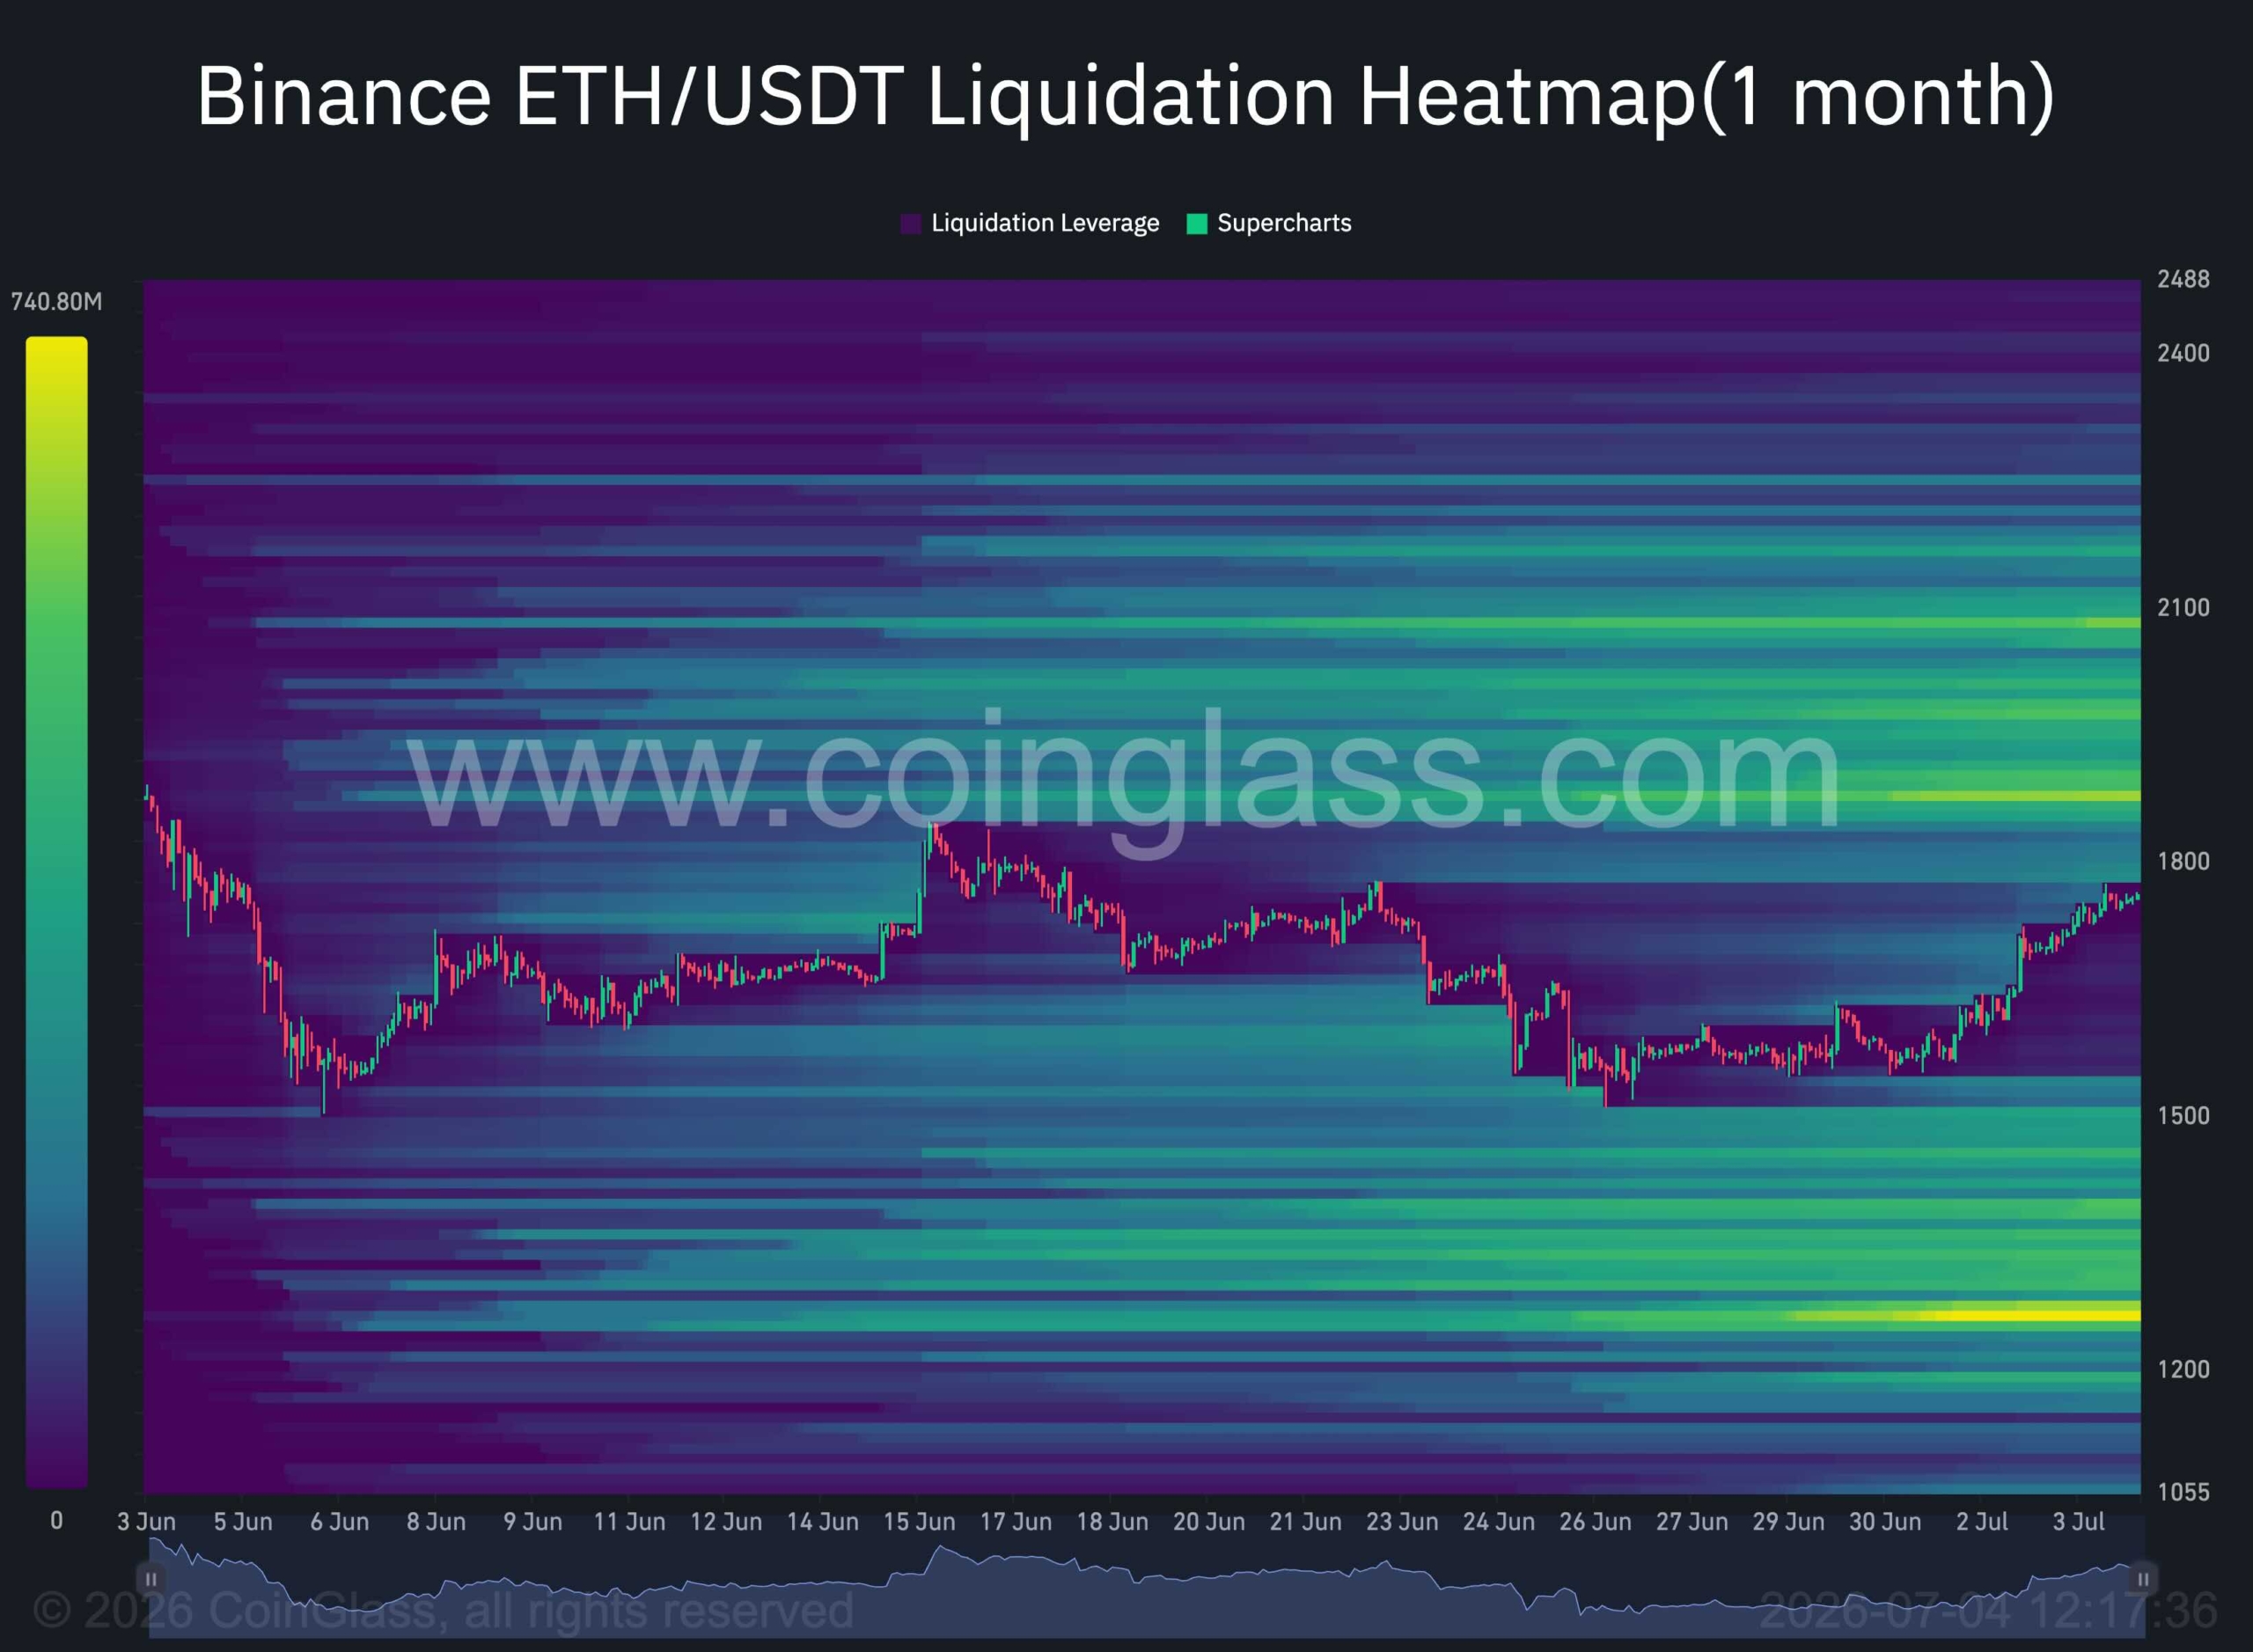
The one-month liquidation heatmap highlights a significant concentration of leveraged positions above the current market price, particularly within the $2K-$2.2K region.
These overhead liquidity clusters could act as a magnet for price in the coming sessions. If Ethereum successfully clears the descending trendline and continues its recovery, the market may accelerate toward this area as short liquidations fuel additional upside momentum.
However, the reaction after such a liquidity sweep may prove even more important than the rally itself. Once the $2K-$2.2K liquidity has been absorbed, the market will likely reveal whether buyers have accumulated enough strength to establish a sustainable bullish trend or whether the move was primarily a liquidity-driven squeeze.
If bullish momentum remains strong after clearing the overhead liquidity, Ethereum could enter a broader recovery phase. Conversely, failure to hold above that region would increase the probability of another significant decline, with price potentially rotating lower to target the sizeable liquidity clusters that remain beneath the current market. Such a sequence would fit the market’s tendency to move between major pools of leveraged liquidity before establishing its next directional trend.
The post Ethereum Price Prediction: Can ETH Break Its Downtrend and Target $2.2K? appeared first on CryptoPotato.


On July 7, 3 weeks after the largest IPO in history, SPCX enters the Nasdaq-100 with billions in passive index buying behind it. The more interesting market is the one Wall Street does not run: tokenized shares on Solana, perpetual futures that priced the listing before bankers did, a $557 million subscription campaign that had to refund almost everyone, and 18,712 Bitcoin sitting on the rocket company’s balance sheet.
Summary
- SpaceX’s Nasdaq-100 entry will bring estimated passive buying while crypto markets already trade its exposure around the clock.
- Tokenized shares, tracker products, and perpetual futures turned SPCX into a live test of equity trading on crypto rails.
- The SpaceX cycle exposed both the promise and risks of tokenized markets, from global access to failed allocations and liquidations.
Index inclusions are usually the sleepiest events in finance. A committee updates a list, passive funds rebalance, and the market moves on. SpaceX joining the Nasdaq-100 before the open on Tuesday, July 7, is not sleepy, partly because the company only went public on June 12 and partly because the estimated $4.3 billion in passive buying tied to the inclusion is arriving into one of the strangest market structures any stock has ever had.
SpaceX, ticker SPCX, is the first mega-cap whose entire public life has run in parallel on crypto rails. Its valuation was traded around the clock for weeks before the IPO priced. Its shares exist simultaneously as Nasdaq stock, as redeemable tokens on Solana, as tracker certificates on half a dozen exchanges, and as cash-settled perpetual futures that liquidated more than $50 million in positions during one bad 48-hour stretch. Its balance sheet holds 18,712 Bitcoin. And when the index funds start buying on Tuesday morning, a meaningful part of the price discovery will already have happened overnight, on-chain, while the exchange was closed.
This is what it looks like when the market structure conversation stops being theoretical. Here is the full map of the SpaceX trade, and what Tuesday tests.
The listing that broke records and brokers
The numbers behind the underlying event deserve a restatement, because everything else sits on top of them. SpaceX sold 555.6 million Class A shares at $135 on June 12, raising $75 billion, the largest initial public offering in United States history, at a valuation near $1.75 trillion. Goldman Sachs led the syndicate alongside Morgan Stanley, Bank of America Securities, Citigroup, and JPMorgan. The company dual-listed on Nasdaq’s Texas exchange under the same ticker, and in a sharp break from mega-cap convention, allocated 30% of the offering to retail investors instead of the usual sliver near 10%.
The stock opened at $150, traded as high as the mid-$160s, and then did what heavily hyped listings often do: it came back down, slipping below its opening price in late June during the broader market drawdown, leaving buyers above the $135 offer price with a live lesson in post-IPO volatility. The first public earnings report lands in September, and the first quarterly disclosure period, ending June 30, has just closed.
One filing detail turned the listing into a crypto story on its own. SpaceX’s registration statement disclosed 18,712 BTC on the balance sheet, acquired back in 2021 at a cost basis of roughly $661 million and worth around $1.2 billion at recent prices. As a public company, SpaceX now reports that position, its cost basis, and its fair-value changes every quarter, joining the small club of corporates whose earnings calls double as Bitcoin disclosures. The June market slide made that holding a talking point immediately, with analysts noting that the $75 billion raise itself competed for the same pool of risk capital that had been holding up crypto prices.
The perpetuals that front-ran the bankers
The most consequential crypto layer of the SpaceX trade started weeks before the stock existed. On May 18, the builder TradeXYZ deployed a pre-IPO perpetual futures market for SpaceX on Hyperliquid under the ticker xyz:SPCX, using the HIP-3 framework that lets outside builders launch perpetual markets on the chain.
Centralized exchanges followed with their own contracts, and by listing day the pre-IPO complex had processed $3.2 billion in volume across 8 venues with open interest peaking above $390 million, including more than $190 million on Hyperliquid alone before the Nasdaq open.
What makes those markets more than a curiosity is how well they priced the event. Aggregated pre-IPO contracts traded at a volume-weighted average near $155 in the final stretch against the $135 offer price, and closed the pre-listing period at an average of $157, within 4.7% of the $150 opening print. The precedent held from the Cerebras listing months earlier, where the equivalent contract landed within 1.3% of the opening price. Synthetic, around-the-clock markets built on crypto infrastructure produced a credible forecast of where one of the most oversubscribed offerings in history would open, while the traditional book-building process kept that information inside the syndicate.
The same markets also delivered the cautionary chapter. Once Nasdaq trading began, the contracts converted into standard equity-linked perpetuals using the live stock price as an oracle, and when SPCX slid below its $150 opening level in late June, leveraged longs paid for the enthusiasm: more than $50 million in SPCX perpetual liquidations in 48 hours, a total that briefly ranked the contract behind only Bitcoin and Ethereum among crypto derivatives. A perpetual future on a stock inherits crypto’s speed in both directions, and the liquidation engine does not wait for an opening bell.
Four things called SpaceX exposure, one of them actual stock
The tokenized layer is where the SpaceX trade turned into a market structure exam that much of the industry failed. By late June, a retail buyer reaching for SpaceX exposure through crypto could end up holding four legally distinct instruments, and the differences only became obvious under stress.
The first is the real thing: a Nasdaq share, whether through a traditional broker or through exchange offerings that route whole-share orders to an introducing broker with standard clearing. Real equity, real shareholder claim, real trading halts.
The second is the redeemable token. Backpack Securities issued a Solana-native SpaceX token backed 1:1 by actual shares in regulated custody, redeemable into the underlying equity and transferable to a conventional brokerage. Ondo launched its own 1:1 tracker on Ethereum and Solana with daily custody attestations. These are the instruments the tokenization thesis has been promising: the stock, wrapped, portable, and trading around the clock.
The third is the tracker certificate. The xStocks product, launched by Kraken parent Payward and distributed across exchanges including Bybit, delivers price exposure through bearer debt instruments with no shareholder rights, no voting, and no legal claim on the underlying shares, and its own terms allow the collateral behind them to be assets other than the stock itself. It is exposure, not ownership, and the paperwork says so for anyone who reads it. Payward has spent 2026 planting flags across mainstream finance, from tokenized equities to its FIFA World Cup sponsorship, and xStocks is the ambitious middle of that portfolio.
The fourth is the perpetual, which owns nothing at all and tracks the price purely through funding mechanics.
The stress test arrived before the stock did. Binance Wallet ran a tokenized subscription campaign for SpaceX exposure through xStocks that raised $557 million from 27,689 wallet addresses, one of the largest tokenized offering campaigns ever, with Bybit running a parallel program. Then the supply failed to show up: the xStocks provider received a smaller pre-IPO share allocation than expected, and Binance, Bybit, and Bitget canceled customer allocations and refunded in full, with Binance distributing a consolation $1 million in shares through its newer bStocks platform. The fine print had warned that allocations were not guaranteed, and the fine print won. Tokenization can wrap a share, but it cannot conjure one, and the biggest tokenized IPO campaign in history ended as a refund notice.
None of that stopped the sector’s growth. Tokenized stock volumes hit a record $20 billion during the SpaceX cycle, pre-IPO tokenized trading volume surged over 1,000%, and tokenized equities as a category kept compounding, with Citi projecting tokenized real-world assets to grow from around $17 billion today to $5.5 trillion by 2030. SpaceX was simultaneously the category’s best advertisement and its most public quality-control failure.
How a market for a private company actually works
Since pre-IPO perpetuals are about to become a fixture of every major listing, the mechanics deserve a proper walkthrough, because the instrument is stranger than its chart suggests.
A perpetual future normally needs a reference price to anchor its funding mechanism: longs pay shorts when the contract trades above the index, shorts pay longs below it, and the payments tether the derivative to the underlying. A private company has no underlying. The pre-IPO contracts solved this by letting the funding mechanism anchor to itself, with the contract price representing the market’s continuously updated estimate of the eventual listing value, disciplined by traders willing to take the other side of any drift. It is price discovery with no ground truth until listing day, which sounds like astrology and behaved like arbitrage.
The Cerebras listing was the controlled experiment. The chipmaker’s pre-IPO perpetual traded for weeks before its Nasdaq debut, and when the stock opened, the contract’s final pre-listing price sat within 1.3% of the $350 opening print. Spreads on the contract compressed to a 0.07% median once the live stock price became the oracle, and open interest rolled off in an orderly unwind as positions reconciled against reality. The experiment answered the core objection to synthetic pre-IPO markets, that with no underlying to arbitrage they would drift into fantasy, with a data point: they did not.
SpaceX ran the experiment at 40 times the size. The Hyperliquid contract launched on May 18 with the IPO reference at $135, and the market immediately priced the company richer, clustering between $180 and $200 in the first weeks, an implied valuation near $2.5 trillion that said more about scarcity hunger than fundamentals. Then something instructive happened: as the roadshow progressed and allocation details leaked, the contracts converged, sliding into the $160 to $170 range by June 8 and settling near $155 aggregate VWAP into listing week. The synthetic market did not just guess; it updated, absorbing information through the exact process equity analysts describe as price discovery, running around the clock on rails the syndicate did not control.
At listing, the contracts flipped their oracle to the live Nasdaq price and became ordinary equity-linked perpetuals, which is where the second lesson arrived. An around-the-clock leveraged derivative on a stock means the stock effectively trades around the clock too, with all of crypto’s liquidation mechanics attached. When SPCX broke below $150, the cascade cleared more than $50 million in 48 hours, forcing exits firing at 3 a.m. against a reference asset whose actual venue was closed. Equity investors got their first taste of a dynamic crypto traders know in their bones: in a leveraged 24-hour market, the price you are liquidated at and the price the asset deserves are frequently different numbers, and only one of them empties your account.
The regulatory seam running through everything
Every layer of the SpaceX crypto complex operates around a single inconvenient fact: most of it is unavailable to Americans, on purpose.
The tokenized products draw the sharpest lines. xStocks excludes users from the United States, the United Kingdom, Canada, and Australia outright. Ondo’s tracker is for non-United States users. Backpack’s redeemable token operates through securities registrations that carefully fence its distribution. The pattern is uniform because the legal exposure is: a tokenized share offered to a United States retail investor is a securities offering, and nobody in the stack wants to run that experiment ahead of legislation. The result is an inverted access map, where a trader in Lagos or Manila can hold around-the-clock SpaceX exposure through a phone wallet while a trader in Ohio needs a brokerage account and market hours, for a company whose rockets launch from Texas and Florida.
The perpetuals live in the same seam. The offshore exchanges listing SPCX contracts exclude United States persons as a matter of stated policy, with all the enforcement rigor that phrase historically implies, and the domestic regulated path for equity perpetuals is still being fought over between the CFTC and the exchanges. Meanwhile, the pending market structure legislation grinding through the Senate would redraw several of these lines at once, which is why every player in the tokenized stock complex is building now and lobbying simultaneously: the rails that exist when the rules finalize tend to get grandfathered into legitimacy, and the ones that do not get built never do.
The seam also explains the industry’s strange incentive alignment around Tuesday. A clean, liquid, boring index inclusion, with the tokenized layer tracking faithfully and no structural embarrassments, is a lobbying exhibit for the entire sector. A blowup is an exhibit for the other side. Rarely has a passive rebalancing event carried this much narrative weight for people who do not own the stock.
What Tuesday actually tests
The Nasdaq-100 inclusion, effective before the market opens on July 7, is mechanically simple: index-tracking funds led by the QQQ complex must hold SPCX, and the estimated $4.3 billion in passive demand tied to that rebalancing arrives on a schedule everyone can see. The flow is not new money deciding it likes rockets; it is rule-following capital buying whatever the index says, funded by trimming whichever component fell out of the top 100, which is why inclusion effects are usually front-run, faded, and forgotten within a week. The wrinkle this time is that the front-running venues never close. The same June liquidity squeeze that drained a record $4 billion from Bitcoin ETFs while whales accumulated on-chain showed how sharply passive flows and conviction flows can diverge; Tuesday runs that experiment inside a single ticker. For a normal stock, the interesting question is how much of the flow is already priced in. For this stock, there are three better questions.
First, where does the price discovery happen? The inclusion takes effect at the open, but the tokenized shares and the perpetuals trade through the weekend and overnight. Whatever the market decides about the inclusion will be visible on-chain hours before the first Nasdaq print on Tuesday, the same way the pre-IPO perps front-ran the offer price. Index events used to be a bell-to-bell affair. This one has a 24-hour shadow market attached, and the arbitrage between the two is now a professional trade.
Second, does the passive bid meet the leveraged crowd? SPCX perpetual open interest rebuilt after the June flush, and a scheduled, well-telegraphed buying event is exactly the setup that attracts leverage on both sides. The last time the stock moved sharply, the liquidation cascade outpaced anything the equity market itself did. A calm inclusion would be a small landmark for the tokenized complex; a violent one would be a reminder that bolting crypto market structure onto a stock imports crypto’s failure modes along with its hours.
Third, does the index bid revalue the Bitcoin on the books? Passive funds buying SPCX are, at one remove, buying 18,712 BTC without an opinion about it, the same way index investors have been buying corporate Bitcoin treasuries through other tickers for years. It is a small position against a $1.7 trillion company, but the symbolism runs the other direction: Bitcoin exposure is now something the Nasdaq-100 carries by default, embedded in a rocket company, disclosed quarterly, and owned by every retirement account tracking the index.
The precedent being set in real time
Step back from the ticker and the SpaceX cycle reads like a preview of how every major listing will eventually work. A company’s valuation now starts trading the moment the market cares, not the moment a syndicate allows it. The pre-IPO perps priced SpaceX within a few percent while the roadshow was still running. The tokenized wrappers extended the stock into jurisdictions and hours the exchange cannot reach, the same premise Robinhood just built an entire blockchain around. The failures were real, from the xStocks allocation collapse to the liquidation cascade, but they were failures of capacity and leverage, not of the premise.
The IPO pipeline behind SpaceX makes the preview matter. OpenAI and Anthropic perpetuals already trade the same way SPCX did in May, meaning the market is currently pricing companies that have not filed anything, continuously, with open interest in the hundreds of millions. Whenever those listings arrive, the crypto layer will not be an afterthought bolted on for retail access. It will have been the market of record for months, with the exchange listing arriving as the settlement event that reconciles everyone’s positions.
The retail geography of the trade is the part traditional finance keeps underestimating. SpaceX allocated 30% of its offering to retail, an unprecedented share for a listing this size, and the tokenized layer extended that populism to jurisdictions the allocation never reached: on-chain SPCX products let buyers in more than 100 countries take positions from a phone, in fractions, at any hour, with no brokerage relationship. The demand was not hypothetical. The pre-IPO tokenized trading complex grew over 1,000% in volume during the SpaceX cycle, the Binance Wallet campaign alone pulled in $557 million of subscription demand from under 28,000 wallets, and the perpetuals cleared billions from traders who could never have participated in the actual book. Whether regulators read that as democratized access or as an unlicensed parallel offering is precisely the fight the next 2 years of market structure policy will settle, and SpaceX supplied both sides with their best evidence.
There is also a quieter institutional lesson in how the instruments behaved relative to each other. Through the June volatility, the redeemable tokens tracked the stock tightly because arbitrageurs could actually redeem them, the tracker certificates drifted on their own supply and demand because nobody could, and the perpetuals overshot in both directions because leverage always does. The dispersion between four instruments referencing one asset is a live measurement of how much each layer of trust costs, updated every minute, and desks have started trading the basis between the wrappers the way they trade the futures basis in any mature market. Market structure people call this the instrument stack finding its pricing; everyone else calls it confusing, and both are right.
That inversion, crypto markets first and the stock exchange as confirmation, would have sounded absurd during the last cycle. On Tuesday morning, when the index funds show up to buy a stock whose weekend price action already happened on Solana and Hyperliquid, it will just be how the SpaceX trade works. The rocket company did not set out to become the test case for the merger of equity and crypto market structure. It became one anyway, because it was the biggest thing on the launchpad when the rails were finally ready, and markets, like rockets, use the heaviest available payload to prove the vehicle.
The score going into the open
The scoreboard so far: the perpetuals called the IPO price better than the commentary did, the redeemable tokens worked exactly as designed, the tracker certificates exposed the difference between exposure and ownership, the subscription campaigns found the hard limit of tokenized supply, and the leverage got punished on schedule. That is a remarkably complete stress test for a market structure that barely existed 2 years ago, administered by a single stock in 3 weeks.
Tuesday adds the last missing scenario, a scheduled institutional flow event, to the record. Whichever way SPCX trades, the more durable result is already in: the parallel market did not blink, did not halt, and did not wait for anyone’s opening bell. The index committee added a company to a list. The market around that company had already added itself to something bigger.
Disclaimer: This article is for informational purposes only and does not constitute investment advice. Digital asset markets are volatile, and you can lose your entire investment. Always do your own research. Information current as of July 4, 2026.
Disclosure: This article does not represent investment advice. The content and materials featured on this page are for educational purposes only.
Gold’s modern market history reflects decades of price swings shaped by inflation, interest rates, central bank actions, and geopolitical events.
Summary
- Gold’s post-1971 history reflects decades of inflation, monetary policy, crises, and shifting investor sentiment.
- Gold prices have been shaped by inflation, central bank policies, and geopolitical events since leaving the gold standard.
- From Bretton Woods to the 2008 crisis, gold’s market history highlights the impact of macroeconomic and policy shifts.
In open markets, gold has only been on the free market for the last 50-some years. Until the month of August 1971, its value had been pegged at $35 per ounce under the Bretton Woods monetary system.
However, the Nixon administration gave up on dollar convertibility to gold, which put the metal into a market that it had not known in living memory. The history that ensued is one of the more instructive in the history of prices in modern finance, driven by oil shocks, conscious rate policy, concerted institutional action, and periodic crises not foreseen by most of the actors until they actually happened.
The 1970s: Gold’s first decade without a fixed price
There were no fireworks following the move to a market-determined price. However, inflation rates in the Western world rose dramatically during the 1973 Arab oil embargo, and the gold chart started to move in a decade-defining manner. The metal was up to nearly $195 per ounce by the end of 1974, a nearly fivefold increase in three years. In 1975, the U.S. government legalized private gold ownership for American citizens, which brought some profit-taking and halted the upward trend for a short while. But structural factors – weak dollar, high inflation and growing geopolitical tension – held strong.
In January 1980, gold hit $850.00 an ounce due to the Iranian Revolution, the Soviet invasion of Afghanistan, and a series of inflationary pressure events during the Carter administration. That would be the first time the level is not matched in real, inflation-adjusted dollars in more than 30 years, something that is often overlooked when people talk about the bull market of the 2000s just in nominal terms.
The 1980s and 1990s: Two decades of consistent decline
The period since gold peaked in 1980 has been one of the most instructive in recent gold history, not for any one event, but rather because of the persistent conditions that held gold prices down for 20 years.
The Volcker rate environment
Under Paul Volcker, the Federal Reserve hiked rates hard to squelch “embedded inflation”. This did work, but the environment, with real rates quite positive and a strengthening dollar bringing in capital to U.S. assets, was fundamentally not good for a commodity that did not yield. From 1980, gold dropped consistently and found a range of $300-$500 during most of the decade. This was not caused by any one factor but by a combination of macro factors that were unfavorable to the metal.
Institutional selling in the 1990s
Another big negative wind was the coordinated central bank selling in the 1990s. A number of European governments decided to cut their gold stocks because they were unproductive and produced no return. Known publicly in advance, the UK’s auction of 415 tonnes between 1999 and 2002 took place close to what proved to be multi-decade low prices and became a benchmark in reserve management debates, which still exist today. The larger picture of Europe’s institutional sell added to the pressures on prices.
The 1999 low and the Washington agreement
In 1999, gold was almost $252 an ounce at the bottom. The Washington Agreement on gold, negotiated by European central banks in September this year, contained annual limits on the volume of sales and assisted in stabilizing the cycle low. By this time, the sentiment on gold was universally negative, and as the next decade proved, this was a good contrarian indicator.
The pattern that defined this era
The 1980s and 1990s form a pattern that can be seen numerous times on the longer time frame. Gold was found to underperform when the following occurred at the same time:
- Interest rates were meaningfully positive for a considerable amount of time.
- General trust in the financial system and in equity markets was largely not affected.
- The U.S. dollar was structurally strong on a trade-weighted basis
- Institutional reserve holders were net sellers
This combination is not a mechanical rule, but it did occur with uncanny uniformity during two successive decades. It also shows why the lows of gold in the latter part of the 1990s (now appearing to be extraordinary) seemed to be reasonable for the times.
The 2000s: A new bull market, then a crisis that surprised both ways
Gold’s bounce from the 1999 low was subdued initially. The metal started to rise from about $270 per ounce in 2001. The dot-com bubble burst, bringing into doubt the valuation of equities; the events of 9/11 drove up geopolitical risk premiums in all markets, and the U.S. fiscal budget increased dramatically to pay for military operations outside the country. The general trend of a falling dollar was an underlying theme.
In 2007, gold reached $800 an ounce for the first time since 1980. Then the financial crisis of 2008 had a chain reaction, surprising many observers. gold was hit hard in the last few months of 2008 as institutions began to dump assets in all asset classes to recoup losses and satisfy redemptions, and gold was no different. But with monetary easing having begun globally and with several major central banks applying near-zero rates as well as large-scale asset purchases, real interest rates went deeply negative, and gold began to rise again with a vengeance. It was at about $1,920 per ounce by September 2011, more than seven times higher than the 1999 low.
The following table outlines the general price ranges and main factors for each decade:
Decade
Approx. Low
Approx. High
Key Driver
1970s
$35 (fixed, 1971)
$850 (Jan 1980)
Inflation, oil shocks, USD weakness
1980s
~$280
~$500
Positive real rates, disinflation
1990s
~$252 (1999)
~$415
Central bank selling, equity boom
2000s
~$270 (2001)
~$1,000 (2008)
Dollar weakness, financial instability
2010s
~$1,050 (2015)
~$1,920 (2011)
QE, then rate normalization
2020s
~$1,700 (2022)
$3,000+ (2025)
Pandemic, geopolitics, central bank buying
The 2010s: A steep correction and a gradual return
When it peaked in 2011, not many expected gold to fall so much and so far. The metal’s annual decline was its worst since 1981 after the Fed indicated it would begin to slow asset purchases, which sent real yields higher and took one of gold’s primary props out from under the market. As of December 2015, prices had dropped to approximately $1,050 per ounce. The mining industry balance sheets were seriously strained, and analysts were generally negative.
An adjustment from that trough was slow and took place due to a number of factors — partly the weaker geopolitical demand from Brexit uncertainty, the U.S.-China trade tensions, and the uncertainty surrounding some of the world’s larger economies, and partly due to a structural change in how central banks manage their reserves. Emerging market institutions also started to add gold to their holdings in amounts never again witnessed in the modern history of gold demand: gold purchases in the countries of the modern data series exceeded 1,000 tonnes per year for the first time in more than 55 years. By mid-2019, gold had made a comeback, trading well over $1,500 per ounce and reclaiming the ground lost over the years.
The 2020s: New records and more nuanced drivers
COVID-19 has changed the global monetary landscape quickly and dramatically and gold prices have reacted as such. The metal’s historical record indicated that conditions in the form of near-zero interest rates and large-scale fiscal stimulus programs and significant monetary expansion would be favorable for the metal. Gold’s intraday price in August 2020 breached the $2,000-an-ounce threshold for the first time in history, topping out at about $2,075.
The inflation surge and why gold’s response was muted
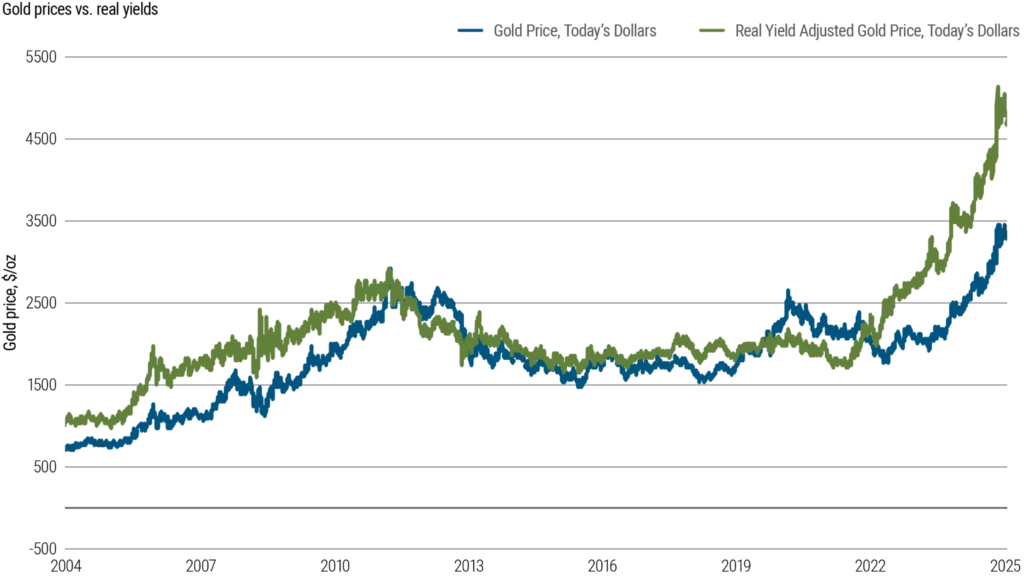
The price reaction to the surge in inflation in 2021 and its following years has been weaker than many observers expected and there’s a reason why. The link between gold and inflation is often misunderstood and misinterpreted in the media. The message of the longer history is that the metal has been a better indicator of real interest rates, that is, it tends to do best when the inflation is higher than the nominal yield and real interest rates are negative. The nominal rate environment in many markets changed when central banks responded aggressively in 2022-2023, lifting nominal rates above the rate of price increases. That offset also weighed on gold’s ability to rally despite the high levels of headline inflation, as the metal spent much of 2022 trading between $1,700 and $2,000.

From $2,500 to $3,000 and the current environment
Gold ventured into fresh nominal highs in late 2023 as rate expectations eased, geopolitical fragmentation continued, and the structural central bank buying by reserve holders wanting to unwind dollar-denominated holdings continued. It crossed $2,500 in 2024 and breached $3,000 per ounce in early 2025. Today, prices are still at historically high levels as of mid-2026. The share of gold in global foreign exchange reserves has been gradually improving in recent years and has turned the tide in the long-term structural deterioration of the precious metal’s share, as several major countries are actively diversifying their reserves away from dollar-dominated portfolios.
What the full 50-year chart actually reveals
There are 50 years of price data to provide context but not certainty. This chart doesn’t show a consistent cycle or a reliable formula to follow in the future, but it does show which conditions have been reliable indicators of a significant price move and which areas confident stories have consistently missed.
Historical factors that historically signal bull markets in gold are:
- When the real interest rate is very negative, that is when the nominal interest rate is less than the rate of meaningful inflation
- Widespread loss of trust in key financial institutions or money systems
- Structural, persistent dollar weakness (trade-weighted basis)
- Near-term crises with no immediate resolution prospects (geopolitical crises)
- A significant continuous net purchase from institutional reserve buyers
- Monetary expansion that brings up issues of long-term purchasing power of currency
- Increased uncertainty about statements of sovereign debt paths in key economies
Factors that have been a drag on the price:
- With positive real interest rates, yield-bearing assets have a clear competitive edge.
- Favorable and sustainable financial position and widespread trust in equities.
- A structurally strong dollar combined with contained and declining inflation
Important turning points in the 50-year history:
1971: Fixed pricing ends, market discovery of gold begins, $35
1980: $850 peak as a result of compounding crises and entrenched inflation
1999: Price bottoms near $252, and the bearish consensus is at its lowest ebb.
2011: $1920 – end of the second major bull run with monetary conditions returning to normal levels.
2020: the first year to cross $2,000 in a pandemic environment
2025: Gold breaks through $3,000 and heads into new nominal space on structural and macro forces.
2026: Institutional demand for safe haven reaches an all-time high of $5,600.
History also reveals the challenges that have historically befallen overarching narratives. During the first stages of the crisis in 2008, gold gave back, just as it is usually considered a safe haven, and then rose when policy took action. Despite a strong inflation period in 2022, it still underperformed for much of the year. It fell over ten years for two decades, and recovery was called for each and every one, but the calls always proved to be premature.
Being honest about reading the 50-year chart means taking into account the periods when gold acted out of the ordinary and when it did what it was supposed to do. The price is a combination of financial policy, institutional flows, currency dynamics, and investor positions — all of which are interdependent and all of which are complex and cannot be summarized by a one-size-fits-all explanatory variable that is consistent through every time period.
Disclosure: This content is provided by a third party. Neither crypto.news nor the author of this article endorses any product mentioned on this page. Users should conduct their own research before taking any action related to the company.

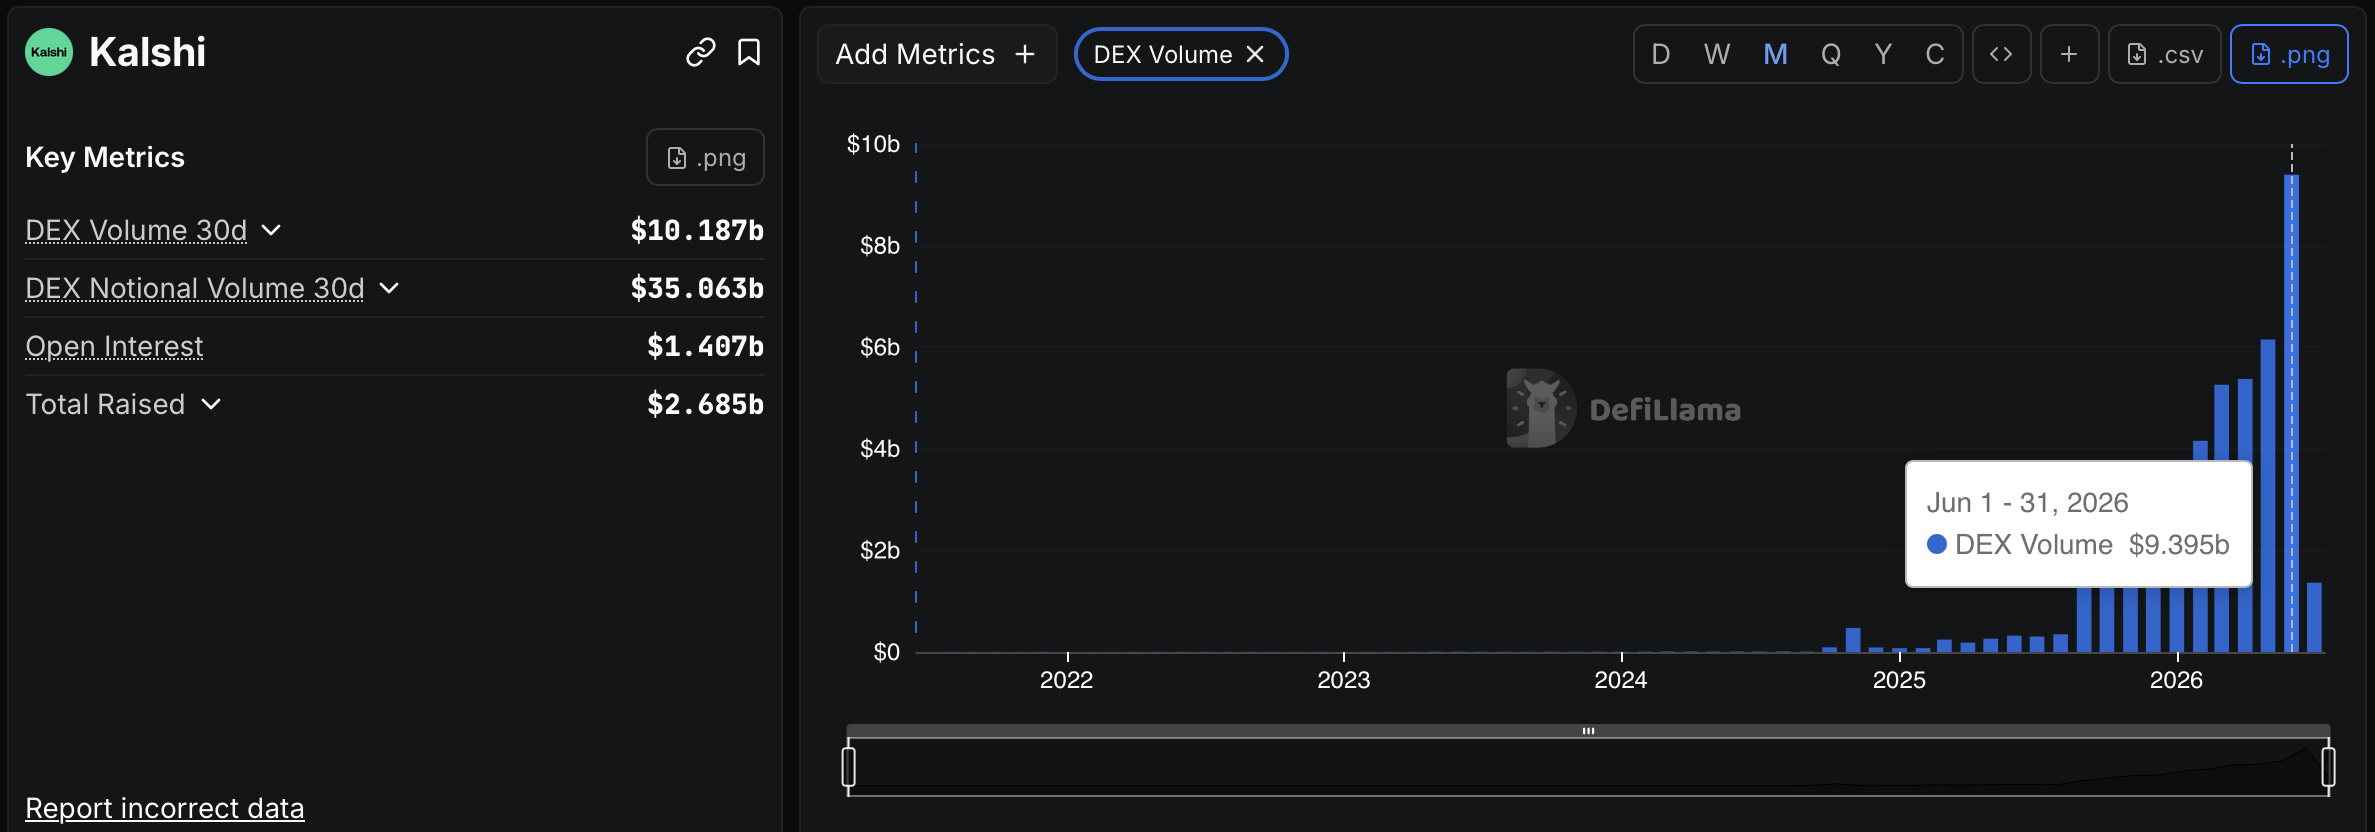
Prediction markets have found an unexpected new liquidity magnet: the 2026 FIFA World Cup. According to DefiLlama data cited by CNBC, trading volume surged across major US prediction platforms after the tournament began on June 11—at a time when the sector is simultaneously facing intensified regulatory pressure.
DefiLlama shows Kalshi handled nearly $9.4 billion in trading volume in June, up from about $5.3 billion in May. Polymarket International also rose to roughly $4.3 billion in June, compared with about $3.5 billion the month prior. CNBC reported that the World Cup became the biggest driver of prediction market volumes in June, with Dune Analytics highlighting record notional trading activity on both Kalshi and Polymarket.
Key takeaways
- Kalshi’s June trading volume nearly hit $9.4 billion, rising from about $5.3 billion in May, as World Cup activity accelerated.
- Polymarket climbed to about $4.3 billion in June from roughly $3.5 billion in May, also pointing to the tournament as a major catalyst.
- High-stakes World Cup knockout matchups are generating tens of millions in daily volume on both exchanges, with some fixtures surpassing $48 million on Kalshi.
- The growth is unfolding alongside escalating US legal and regulatory disputes over whether prediction markets should fall under federal derivatives authority or state gambling frameworks.
World Cup liquidity floods prediction platforms
The jump in activity aligns with the tournament’s expanded format. The 2026 World Cup is the first FIFA edition featuring 48 teams, up from 32 previously. That increase has effectively created more matches, more outcomes, and more trading opportunities—especially around qualification and match advancement markets.
Knockout-stage matchups appear to be particularly attractive to traders. For example, Canada’s Round of 16 match against Morocco—scheduled for Saturday—had generated more than $48 million in trading volume on Kalshi and over $26.8 million on Polymarket at the time of reporting.
The pattern extends to the US Round of 16. Kalshi’s market on which team advances recorded more than $2.1 million in volume, while a comparable Polymarket market attracted around $1.6 million as of Saturday. While these figures are smaller than the Canada–Morocco matchup, they show how quickly attention can shift between fixtures as brackets lock in.
What matters for market participants is not just overall volume, but where it concentrates. World Cup-related contracts create repeatable, time-bound narratives that traders can model—often with clear deadlines and an intense news cycle. That combination helps explain why notional activity can spike even for markets that are narrower than broad political or macro event themes.
Regulatory pressure rises as trading expands
The World Cup-driven surge is occurring against a backdrop of growing controversy over prediction markets in the United States. Earlier this year, Cointelegraph noted that by March nearly a dozen US states had moved against companies including Kalshi and Polymarket. Some states sought to halt such markets, while others argued they should be brought under existing gambling laws and related tax regimes.
At the federal level, regulators have pushed back. In the following month, CFTC Chair Michael Selig accused states of pursuing what he called “illegal enforcement actions” against federally regulated exchanges. In remarks reported via a CFTC press release, Selig argued that Congress granted the agency sole authority over commodity derivatives markets, which can include prediction markets, warning that any state effort to nullify federal law could lead to court challenges.
This is not merely an abstract legal dispute. For platforms, regulatory uncertainty can influence which contracts can be offered to different users, how product structures are shaped, and what compliance costs may look like in practice. For traders, the risk is that market access could change rapidly depending on court outcomes or agency interpretations.
Congress and Europe weigh in with different approaches
The debate is also expanding beyond regulators and into Congress. In June, casino operators, tribal organizations, and labor groups urged lawmakers to amend the Digital Asset Market Clarity (CLARITY) Act by removing sports-event contracts from the CFTC’s authority. Their argument, as described in Cointelegraph reporting, is that sports contracts should instead remain under state gambling laws and existing gaming oversight.
Europe’s approach is different. In a recent reminder, the European Securities and Markets Authority (ESMA) told firms that many event contracts may already fall under existing restrictions tied to binary options. ESMA’s stance emphasized that whether a product is regulated depends on its characteristics rather than merely the label “event contract.” For market operators contemplating cross-border expansion, that distinction is crucial: product design details, not marketing terminology, can determine regulatory treatment.
Taken together, the picture is uneven. The US environment appears to hinge on jurisdiction—whether prediction markets are treated as commodity derivatives under federal authority or as gambling under state law. In Europe, the focus shifts more toward how the contract functions under binary-options-like rules. These differences can shape where liquidity travels, which venues can scale fastest, and how quickly new market formats can be launched.
What to watch next
With the World Cup supplying an immediate, high-volume catalyst, the key question for investors and builders is whether these trading surges translate into longer-term user growth or just prove how concentrated liquidity becomes during major events. Just as importantly, readers should track how ongoing legal challenges—and potential congressional or European regulatory clarifications—affect market access, contract structures, and the durability of platform volume beyond the tournament.


Bitcoin climbed above $63,000 in U.S. morning hours Saturday, up 1.4% over 24 hours and 3.6% on the week, per CoinDesk data, its highest in two weeks and a full reversal of the losses that closed out June.
XRP led the day’s majors, up 5.3% to $1.18 and nearly 10% on the week, a move that lifted it past the USDC stablecoin to fifth place by market value at about $73 billion.
The gain came alongside onchain data showing XRP holders at their deepest average losses on record – the kind of washed-out positioning some traders buy against. Ether added 3.2% on the day to about $1,793, up 11.5% over seven days, while dogecoin rose 2.6% and solana held near $82.50 with a 13.2% weekly gain.
The surge extended a week built on a friendlier macro turn. Fed Chair Kevin Warsh’s comment that inflation risks have come down, a soft June jobs report and a squeeze on bearish traders carried bitcoin from below $60,000 to above $63,000 in five sessions.
Trading was thin on Saturday with U.S. markets shut for the Independence Day holiday, the kind of liquidity that exaggerates moves in both directions.
Bitcoin entered the third quarter at 21-month lows and has now recovered the ground lost in June’s final slide. Whether the momentum holds turns on the coming U.S. inflation print and on whether buying continues once U.S. desks return from the holiday.
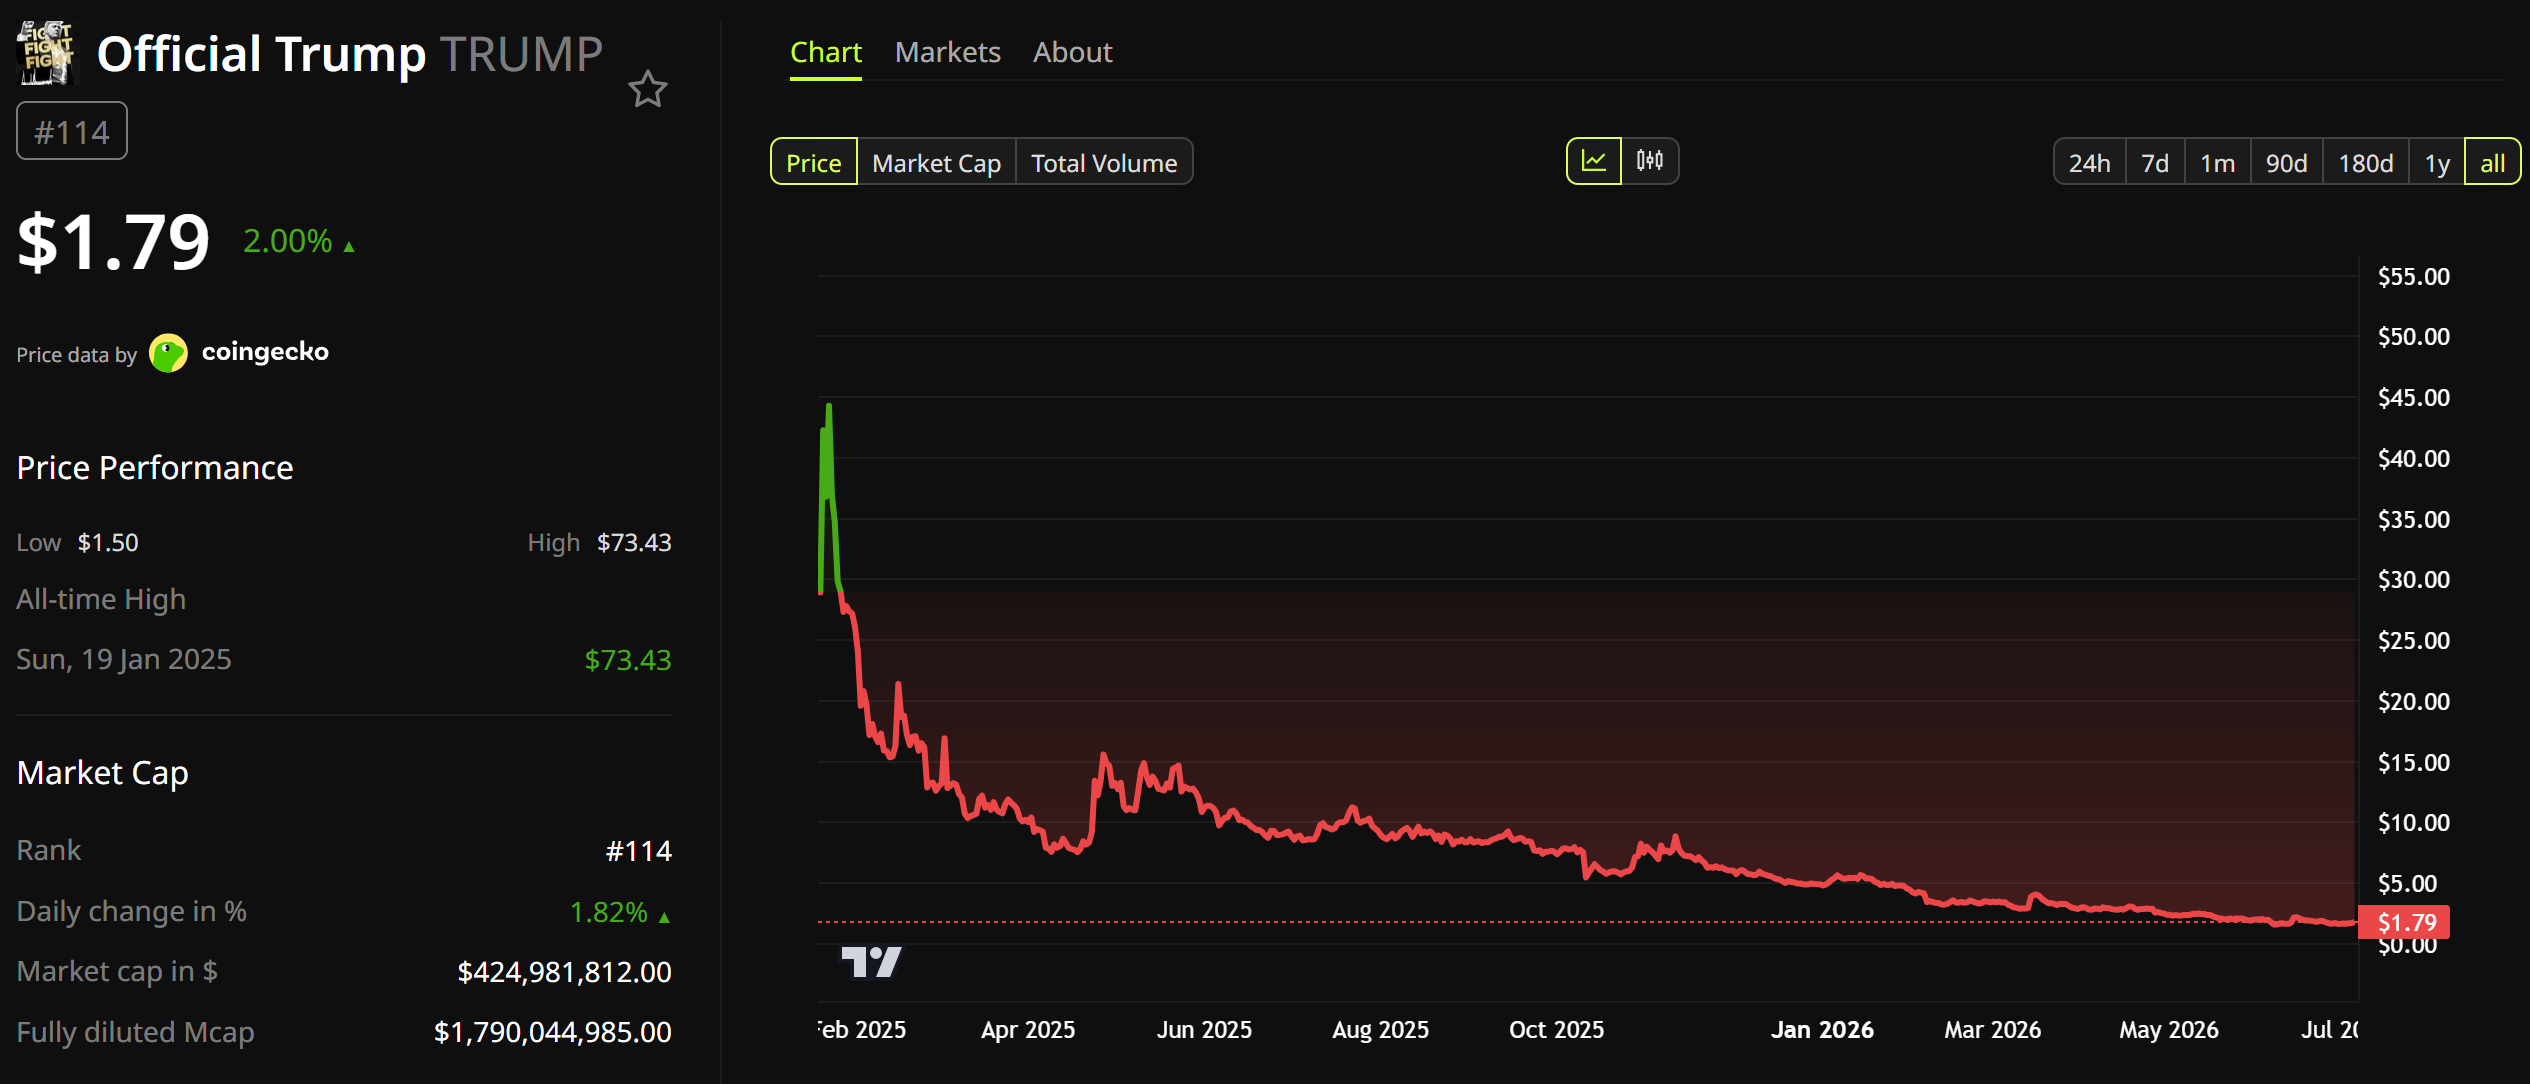
Nearly 1 million buyers of the Official Trump (TRUMP) meme coin are sitting on a combined $3.81 billion in losses, according to blockchain analytics firm Nansen. The TRUMP meme coin now trades roughly 98% below its January 2025 record high.
The losses look like the final stage of a familiar meme coin cycle. Early buyers captured most of the gains, while later arrivals absorbed the decline that followed the launch hype.

The TRUMP Meme Coin Cycle Played Out in 18 Months
TRUMP launched on January 17, 2025, three days before President Donald Trump’s second inauguration. Its price jumped from below $1 to a record $73.43 within two days. That briefly lifted its market value near $15 billion.
Nansen tracked about 1.48 million wallets that bought the token. Just under 500,000 locked in profits worth roughly $4 billion. Most of those gains went to early traders who sold into the first rally.
The buyers who followed became the exit liquidity. Nansen counted 988,905 wallets underwater, about two out of every three, once paper losses are included. The token’s own website had warned that it was not an investment.
Follow us on X to get the latest news as it happens
The outcome fit a pattern that analysts flagged for celebrity meme coins from the start. A month later, Argentina saw a faster version. President Javier Milei promoted the LIBRA token in February 2025. Its near $4 billion valuation collapsed within hours, triggering a fraud probe.
The Token Earned for Its Backers Regardless of Price
The design meant the decline barely touched the people behind it. The token’s code routes a share of every trade to creator-linked wallets. Chainalysis traced more than $324 million in such fees to those addresses in the months after launch.
Those fees accrued whether buyers won or lost. Trump’s 2025 financial disclosure later listed a $636 million windfall from the meme coin. The royalties were routed through CIC Digital, the Trump-linked entity behind the token.
Retail buyers had little legal cover. In a February 2025 statement, the Securities and Exchange Commission said meme coins are not securities. That left the market outside its oversight.
Economist Peter Schiff has called the tokens a way to buy access to the president rather than a real investment.
“He’s actually had events at the White House where the top owners of Trump coin are allowed to attend. But it’s really a way to bribe the president. You don’t have to give him money directly, just buy his token, because who else would buy the token? It’s a lousy investment,” he said.
The White House rejects that view. According to a New York Times report, Spokeswoman Anna Kelly said there are no conflicts of interest and that the president acts in the public interest.
TRUMP set an all-time low of $1.50 in early June and has barely recovered. Appetite across the wider meme coin market has stayed subdued. The token now trades close to $1.79, little changed over the past month. Its market value sits near $424 million, ranking around 115th.
Political branding drew far more attention than a typical meme coin. It did not rewrite the math. The TRUMP token traced the same boom-and-bust arc as the speculative coins that came before it.
The post Nearly 1 Million TRUMP Meme Coin Buyers Lost $3.81 Billion: Is the Cycle Complete? appeared first on BeInCrypto.

He authored Bitcoin Improvement Proposal 361 (BIP-361), which outlines a phased migration to quantum-resistant cryptography.
“The goal is to create incentives and deadlines so users, exchanges, custodians, wallets and institutions actually migrate in a timely fashion,” saidLopp, who in April said it would be better to freeze Satoshi’s hoard and millions of other dormant bitcoins than to let hackers steal them.
Matt Hougan, chief investment officer at Bitwise, rejected both letting the coins be stolen and freezing them outright.
Instead, he pointed to a proposal by Castle Island Ventures partner Nic Carter that would place Satoshi’s bitcoin into a legal trust until ownership could be proven through historical electronic records.
Avoiding philosophical challenges
“I actually like Nic Carter’s proposal,” Hougan said via email. “It avoids the philosophical challenges of both CZ’s suggestion and the ‘let whatever happens’ perspective.”
Hougan said the market already treats Satoshi’s holdings as effectively unavailable, meaning almost any change would create more risk than opportunity.
“I don’t think there is any way that developments around Satoshi’s coins are positive for the ecosystem,” he said. “The market already accounts for them as frozen forever.”
For now, the debate remains largely theoretical. Researchers are still working on practical post-quantum cryptography for Bitcoin, and no consensus has been reached on how the network should respond if its encryption does become vulnerable.

Coinbase CEO Brian Armstrong said AI has changed how engineers work inside the crypto exchange. He described the shift as the rise of the “super builder,” where one engineer can deliver far more output. According to Armstrong, Coinbase now ships twice as much code overall. He said some engineers act as ten-times contributors who share effective AI practices.
Armstrong said Coinbase has become one of the most AI-enabled companies in the world. The Coinbase AI engineering strategy focuses on productivity, cost control, and wider adoption. A user reacting to his remarks said former Coinbase employees at other crypto firms describe the company as ahead in AI integration. That reaction added context to Armstrong’s claim about Coinbase’s engineering culture.
Coinbase Cuts Ai Costs As Usage Rises
The update covered how Coinbase reduced AI spending while usage continued to rise. Armstrong said the company nearly halved AI costs even as token usage grew sharply across systems. “How to keep AI spend flat while token usage grows exponentially: not with friction and spend alerts. With better defaults, routing, and caching,” Armstrong said.
Source:
The Coinbase AI engineering approach uses smarter model routing to match tasks with suitable models. This method sends simple work to cheaper tools and reserves stronger models for harder tasks. The company also uses caching to avoid paying for repeated answers when teams ask similar queries. Coinbase uses cheaper open-weight models for routine work where advanced models add little value.
Armstrong Links Ai Growth To Infrastructure
Armstrong framed the savings as a scaling decision rather than a limit on AI use. He said the goal does not involve cutting access or slowing engineers through controls. Instead, Coinbase wants infrastructure that allows AI usage to grow without future budget pressure. That view places cost efficiency at the center of Coinbase AI engineering operations.
The comments connect with Armstrong’s earlier view on AI bottlenecks. In June, he argued that access to energy and compute matters more than model quality for AI growth. His latest comments extend that position into company operations through routing, caching, and model selection. As a result, Coinbase AI engineering reflects productivity gains and infrastructure discipline.
For Coinbase, the message points to AI as an operating layer for software teams. Engineers use AI to write, review, and ship code faster, while management tracks costs. The company’s approach suggests that AI adoption depends on workflow design, not only model access. Coinbase AI engineering shows how a crypto firm can scale AI while watching spend.

Kalshi posted a record month for trading volume in June as the 2026 FIFA World Cup fueled activity across prediction markets.
DefiLlama data shows Kalshi recorded nearly $9.4 billion in trading volume in June, up from about $5.3 billion in May. Polymarket International also climbed to roughly $4.3 billion from about $3.5 billion a month earlier.
The tournament kicked off on June 11 and is the first FIFA World Cup to feature 48 teams, up from 32 in previous editions. CNBC reported the competition became the biggest driver of prediction market trading in June, with Dune Analytics showing record notional trading volumes on Kalshi and Polymarket.
Kalshi trading volume hits June record. Source: DefiLlama
The tournament’s knockout matches are attracting some of the highest trading activity. Canada’s Round of 16 match against Morocco, scheduled for Saturday, had generated over $48 million in trading volume on Kalshi and over $26.8 million on Polymarket at the time of writing.
The United States’ Round of 16 match has also drawn significant attention from traders. Kalshi’s market on which team will advance had generated more than $2.16 million in volume, while a comparable market on Polymarket had attracted around $1.6 million as of Saturday.
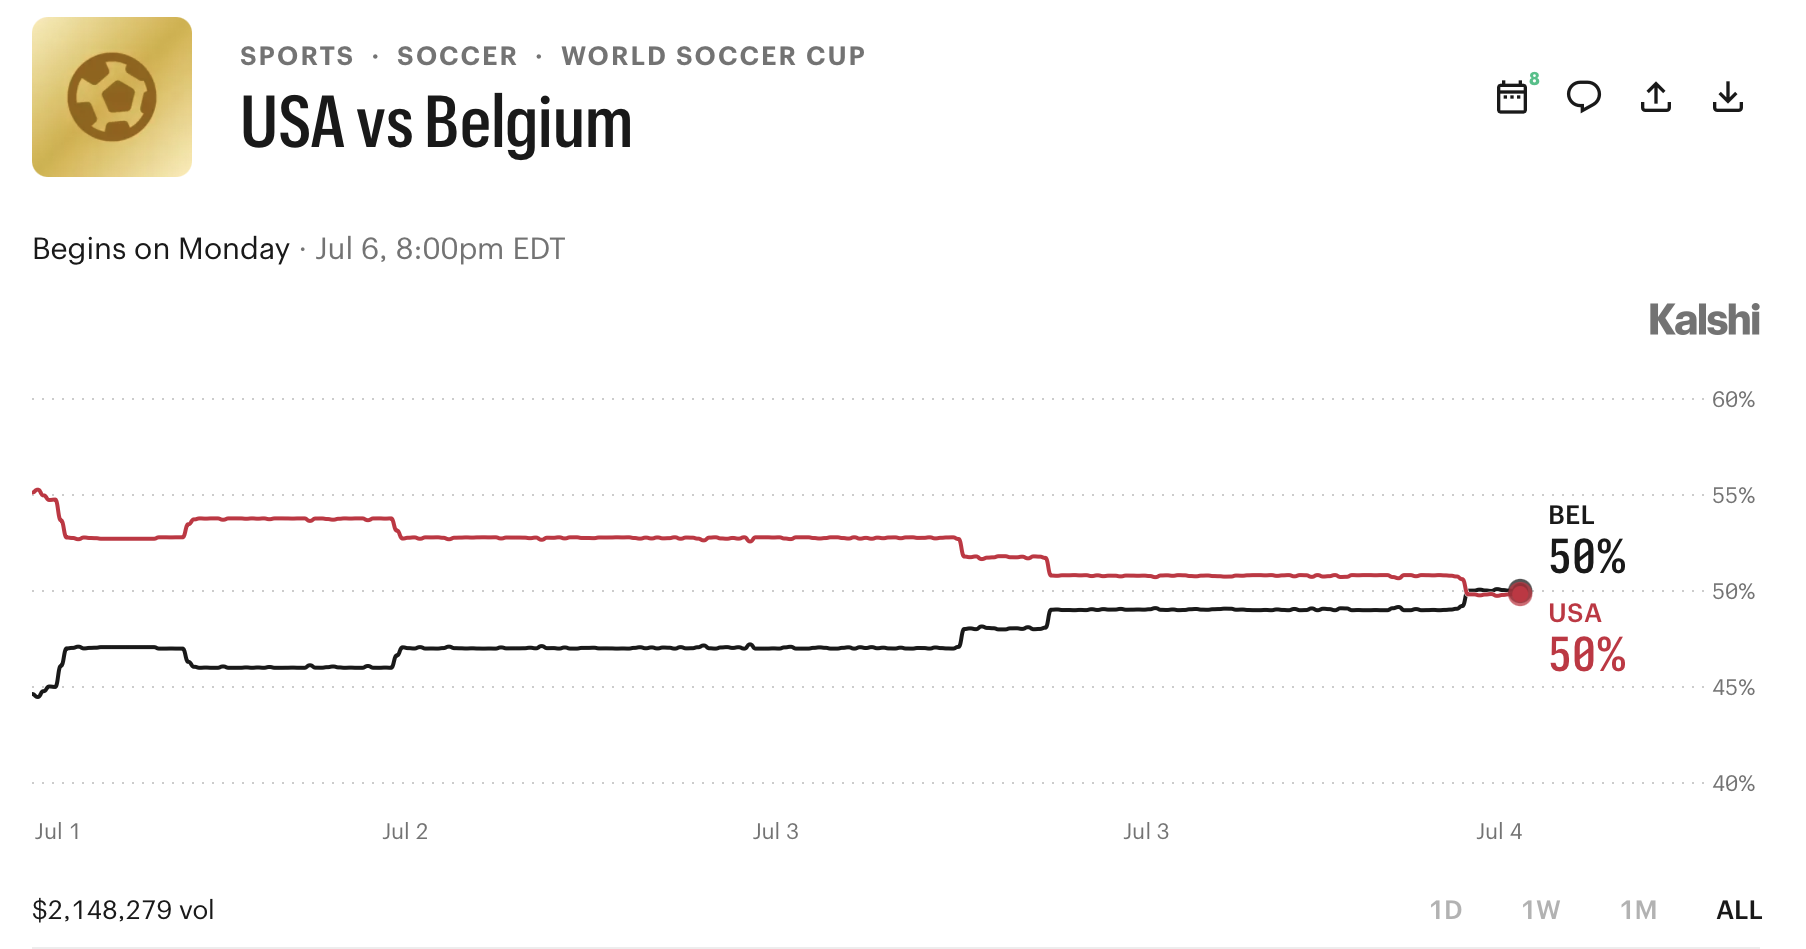
Source: Kalshi
Related: US dominates Polymarket political bets despite geoblock: Report
Legal battles intensify as prediction markets grow
The high trading volumes come as prediction markets remain at the center of a growing legal and regulatory debate in the United States.
By March, nearly a dozen US states had already moved against companies including Kalshi and Polymarket, with some seeking to halt the markets while others pushed to bring them under existing gambling laws and state tax frameworks.
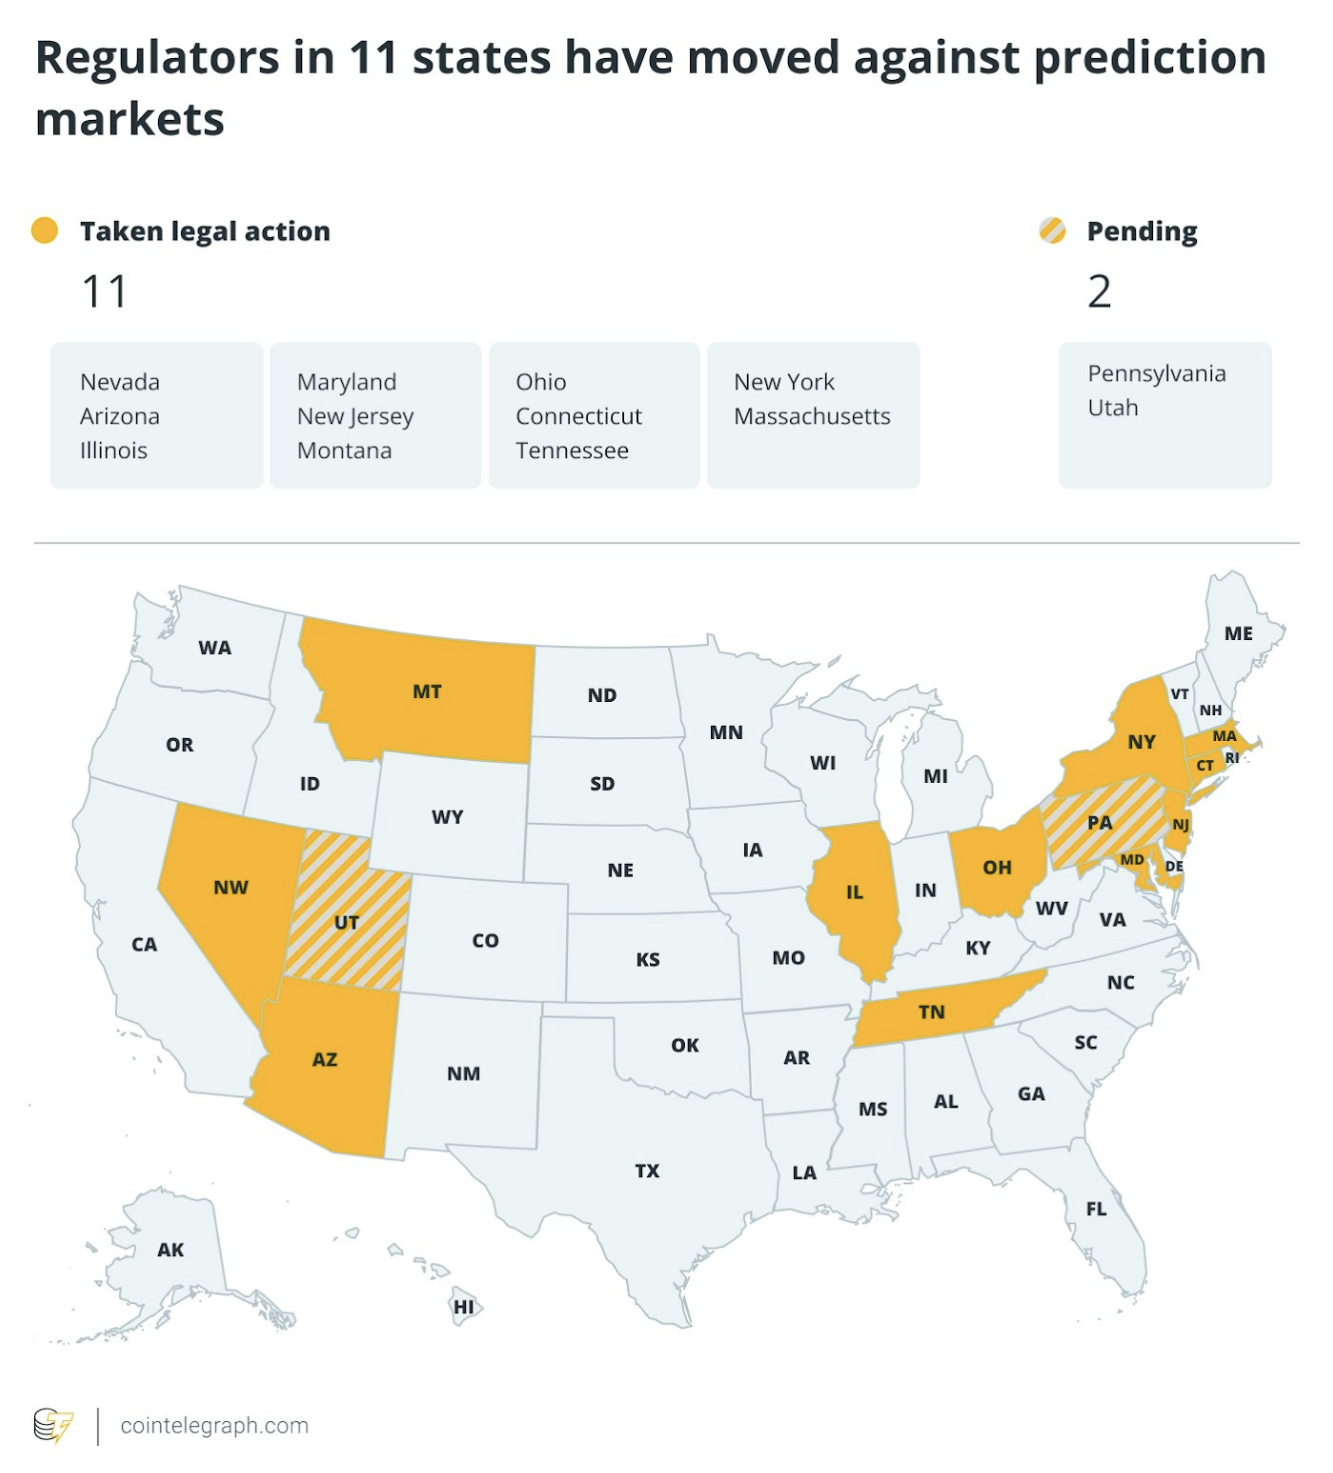
Source: Cointelegraph
Federal regulators have rejected states’ attempts to police prediction markets. The following month, CFTC Chair Michael Selig accused states of pursuing “illegal enforcement actions” against federally regulated exchanges, arguing Congress had given the agency sole authority over commodity derivatives markets, including prediction markets. “To any state that seeks to nullify federal law and seize authority over these markets,” Selig said, “we will see you in court.”
The debate has broadened beyond regulators. In June, casino operators, tribal organizations and labor groups urged Congress to remove sports-event contracts from the CFTC’s authority with an amendment to the Digital Asset Market Clarity (CLARITY) Act, arguing the contracts should instead remain under state gambling laws and existing gaming oversight.
Europe has taken a different approach. On Friday, the European Securities and Markets Authority (ESMA) reminded firms that many event contracts may already fall under existing restrictions on binary options, saying whether a product is regulated depends on its characteristics rather than the “event contract” label attached to it.
Magazine: AI is banking the unbanked in Africa… faster than crypto

Money Saving Tips #shorts#MoneySaving #Finance #PersonalFinance
National Lottery results live: Lotto and Thunderball numbers for Saturday, July 7

Lili Turns Idle Cash Into Up to 4% APY for Small Businesses


-

 Fashion1 day ago
Weekend Open Thread: High Hopes
-

 Tech7 days ago
Bluekit phishing kit adopts browser-in-the-middle for login theft
-

 Tech7 days ago
Claude Code turned every engineer into three. Now companies need more product thinkers
-

 Crypto World5 days ago
Strategy authorizes up to $1.25B in Bitcoin sales under new capital plan
-

 Politics1 day ago
The House | “Reframing the debate from a binary discussion of winners and losers”: Yuan Yang reviews ‘We Are Not Machines’
-

 News Videos6 days ago
MAJOR BITCOIN & MARKET UPDATE!!!! (MUST WATCH ASAP!!!)
-

 Tech5 days ago
Anonymous researcher drops 0-day ‘exploitarium’ repo
-

 Business5 days ago
Australia treasurer says alleged access of prime minister’s bank data ’incredibly concerning’
-
 Business5 days ago
The AI boom won’t burst all at once. It will pop in ‘rolling bubbles’: Macquarie
-

 Sports3 days ago
Broncos roster: OL Ben Powers (No. 74) entering final year of contract
-

 NewsBeat4 days ago
Presenter Caroline Flack’s brother Paul Flack dies aged 55
-

 Crypto World3 days ago
Binance stock trading tops $1B in first month after launch
-
 NewsBeat2 days ago
New exhibition reflects five decades of movement between island of Ireland and GB
-

 Crypto World3 days ago
Alibaba-affiliate Ant Group enters the humanoid robot market with 12 deals
-

 News Videos4 days ago
How to Build INSANE Live Financial Dashboards With Claude
-

 Business3 days ago
Meta Platforms Stock Jumps 7% Today as Bloomberg Reports Company Plans to Enter the Cloud Business
-

 Business2 days ago
What a 10 Percent Drop Means for Buyers, Sellers and Renters
-

 Crypto World2 days ago
Binance Re-Enters Philippines As EU MiCA Rules Restrict Access
-

 Tech5 days ago
The attack that hijacked Claude Code came through Sentry. Datadog, PagerDuty, and Jira have the same exposure.
-
 Business5 days ago
PRISM’s IPO filing mentions Zostel case, CCI investigation
You must be logged in to post a comment Login