
Crypto World
50 years of gold price history: What the charts reveal

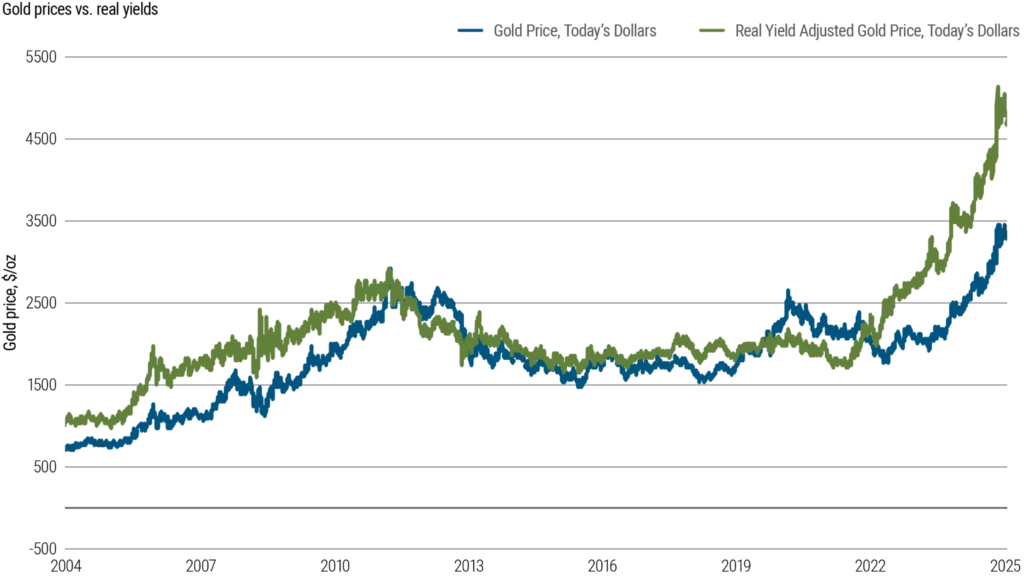
Disclosure: This article does not represent investment advice. The content and materials featured on this page are for educational purposes only.
Gold’s modern market history reflects decades of price swings shaped by inflation, interest rates, central bank actions, and geopolitical events.
Summary
- Gold’s post-1971 history reflects decades of inflation, monetary policy, crises, and shifting investor sentiment.
- Gold prices have been shaped by inflation, central bank policies, and geopolitical events since leaving the gold standard.
- From Bretton Woods to the 2008 crisis, gold’s market history highlights the impact of macroeconomic and policy shifts.
In open markets, gold has only been on the free market for the last 50-some years. Until the month of August 1971, its value had been pegged at $35 per ounce under the Bretton Woods monetary system.
However, the Nixon administration gave up on dollar convertibility to gold, which put the metal into a market that it had not known in living memory. The history that ensued is one of the more instructive in the history of prices in modern finance, driven by oil shocks, conscious rate policy, concerted institutional action, and periodic crises not foreseen by most of the actors until they actually happened.
The 1970s: Gold’s first decade without a fixed price
There were no fireworks following the move to a market-determined price. However, inflation rates in the Western world rose dramatically during the 1973 Arab oil embargo, and the gold chart started to move in a decade-defining manner. The metal was up to nearly $195 per ounce by the end of 1974, a nearly fivefold increase in three years. In 1975, the U.S. government legalized private gold ownership for American citizens, which brought some profit-taking and halted the upward trend for a short while. But structural factors – weak dollar, high inflation and growing geopolitical tension – held strong.
In January 1980, gold hit $850.00 an ounce due to the Iranian Revolution, the Soviet invasion of Afghanistan, and a series of inflationary pressure events during the Carter administration. That would be the first time the level is not matched in real, inflation-adjusted dollars in more than 30 years, something that is often overlooked when people talk about the bull market of the 2000s just in nominal terms.
The 1980s and 1990s: Two decades of consistent decline
The period since gold peaked in 1980 has been one of the most instructive in recent gold history, not for any one event, but rather because of the persistent conditions that held gold prices down for 20 years.
The Volcker rate environment
Under Paul Volcker, the Federal Reserve hiked rates hard to squelch “embedded inflation”. This did work, but the environment, with real rates quite positive and a strengthening dollar bringing in capital to U.S. assets, was fundamentally not good for a commodity that did not yield. From 1980, gold dropped consistently and found a range of $300-$500 during most of the decade. This was not caused by any one factor but by a combination of macro factors that were unfavorable to the metal.
Institutional selling in the 1990s
Another big negative wind was the coordinated central bank selling in the 1990s. A number of European governments decided to cut their gold stocks because they were unproductive and produced no return. Known publicly in advance, the UK’s auction of 415 tonnes between 1999 and 2002 took place close to what proved to be multi-decade low prices and became a benchmark in reserve management debates, which still exist today. The larger picture of Europe’s institutional sell added to the pressures on prices.
The 1999 low and the Washington agreement
In 1999, gold was almost $252 an ounce at the bottom. The Washington Agreement on gold, negotiated by European central banks in September this year, contained annual limits on the volume of sales and assisted in stabilizing the cycle low. By this time, the sentiment on gold was universally negative, and as the next decade proved, this was a good contrarian indicator.
The pattern that defined this era
The 1980s and 1990s form a pattern that can be seen numerous times on the longer time frame. Gold was found to underperform when the following occurred at the same time:
- Interest rates were meaningfully positive for a considerable amount of time.
- General trust in the financial system and in equity markets was largely not affected.
- The U.S. dollar was structurally strong on a trade-weighted basis
- Institutional reserve holders were net sellers
This combination is not a mechanical rule, but it did occur with uncanny uniformity during two successive decades. It also shows why the lows of gold in the latter part of the 1990s (now appearing to be extraordinary) seemed to be reasonable for the times.
The 2000s: A new bull market, then a crisis that surprised both ways
Gold’s bounce from the 1999 low was subdued initially. The metal started to rise from about $270 per ounce in 2001. The dot-com bubble burst, bringing into doubt the valuation of equities; the events of 9/11 drove up geopolitical risk premiums in all markets, and the U.S. fiscal budget increased dramatically to pay for military operations outside the country. The general trend of a falling dollar was an underlying theme.
In 2007, gold reached $800 an ounce for the first time since 1980. Then the financial crisis of 2008 had a chain reaction, surprising many observers. gold was hit hard in the last few months of 2008 as institutions began to dump assets in all asset classes to recoup losses and satisfy redemptions, and gold was no different. But with monetary easing having begun globally and with several major central banks applying near-zero rates as well as large-scale asset purchases, real interest rates went deeply negative, and gold began to rise again with a vengeance. It was at about $1,920 per ounce by September 2011, more than seven times higher than the 1999 low.
The following table outlines the general price ranges and main factors for each decade:
Decade
Approx. Low
Approx. High
Key Driver
1970s
$35 (fixed, 1971)
$850 (Jan 1980)
Inflation, oil shocks, USD weakness
1980s
~$280
~$500
Positive real rates, disinflation
1990s
~$252 (1999)
~$415
Central bank selling, equity boom
2000s
~$270 (2001)
~$1,000 (2008)
Dollar weakness, financial instability
2010s
~$1,050 (2015)
~$1,920 (2011)
QE, then rate normalization
2020s
~$1,700 (2022)
$3,000+ (2025)
Pandemic, geopolitics, central bank buying
The 2010s: A steep correction and a gradual return
When it peaked in 2011, not many expected gold to fall so much and so far. The metal’s annual decline was its worst since 1981 after the Fed indicated it would begin to slow asset purchases, which sent real yields higher and took one of gold’s primary props out from under the market. As of December 2015, prices had dropped to approximately $1,050 per ounce. The mining industry balance sheets were seriously strained, and analysts were generally negative.
An adjustment from that trough was slow and took place due to a number of factors — partly the weaker geopolitical demand from Brexit uncertainty, the U.S.-China trade tensions, and the uncertainty surrounding some of the world’s larger economies, and partly due to a structural change in how central banks manage their reserves. Emerging market institutions also started to add gold to their holdings in amounts never again witnessed in the modern history of gold demand: gold purchases in the countries of the modern data series exceeded 1,000 tonnes per year for the first time in more than 55 years. By mid-2019, gold had made a comeback, trading well over $1,500 per ounce and reclaiming the ground lost over the years.
The 2020s: New records and more nuanced drivers
COVID-19 has changed the global monetary landscape quickly and dramatically and gold prices have reacted as such. The metal’s historical record indicated that conditions in the form of near-zero interest rates and large-scale fiscal stimulus programs and significant monetary expansion would be favorable for the metal. Gold’s intraday price in August 2020 breached the $2,000-an-ounce threshold for the first time in history, topping out at about $2,075.
The inflation surge and why gold’s response was muted
The price reaction to the surge in inflation in 2021 and its following years has been weaker than many observers expected and there’s a reason why. The link between gold and inflation is often misunderstood and misinterpreted in the media. The message of the longer history is that the metal has been a better indicator of real interest rates, that is, it tends to do best when the inflation is higher than the nominal yield and real interest rates are negative. The nominal rate environment in many markets changed when central banks responded aggressively in 2022-2023, lifting nominal rates above the rate of price increases. That offset also weighed on gold’s ability to rally despite the high levels of headline inflation, as the metal spent much of 2022 trading between $1,700 and $2,000.
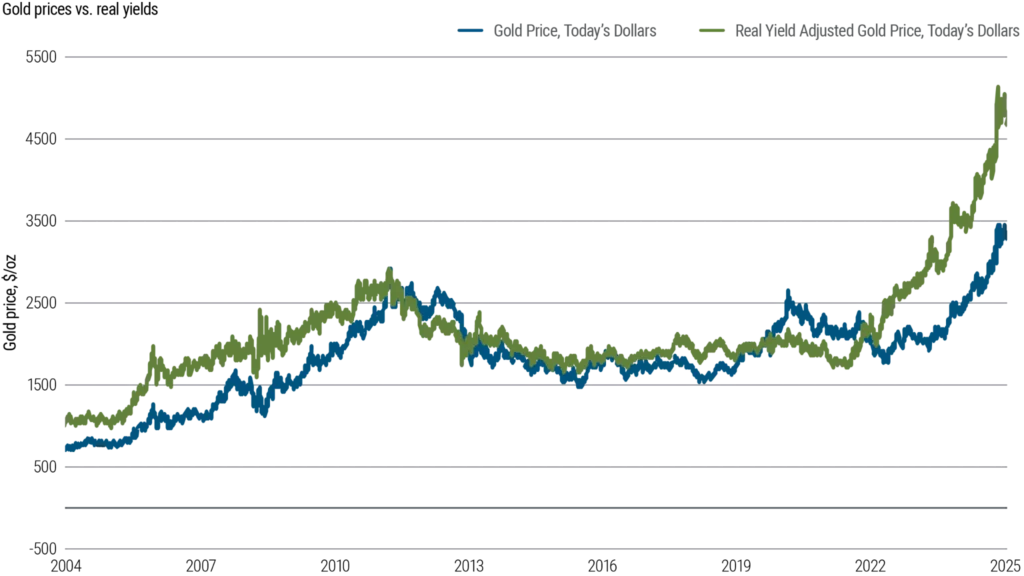
From $2,500 to $3,000 and the current environment
Gold ventured into fresh nominal highs in late 2023 as rate expectations eased, geopolitical fragmentation continued, and the structural central bank buying by reserve holders wanting to unwind dollar-denominated holdings continued. It crossed $2,500 in 2024 and breached $3,000 per ounce in early 2025. Today, prices are still at historically high levels as of mid-2026. The share of gold in global foreign exchange reserves has been gradually improving in recent years and has turned the tide in the long-term structural deterioration of the precious metal’s share, as several major countries are actively diversifying their reserves away from dollar-dominated portfolios.
What the full 50-year chart actually reveals
There are 50 years of price data to provide context but not certainty. This chart doesn’t show a consistent cycle or a reliable formula to follow in the future, but it does show which conditions have been reliable indicators of a significant price move and which areas confident stories have consistently missed.
Historical factors that historically signal bull markets in gold are:
- When the real interest rate is very negative, that is when the nominal interest rate is less than the rate of meaningful inflation
- Widespread loss of trust in key financial institutions or money systems
- Structural, persistent dollar weakness (trade-weighted basis)
- Near-term crises with no immediate resolution prospects (geopolitical crises)
- A significant continuous net purchase from institutional reserve buyers
- Monetary expansion that brings up issues of long-term purchasing power of currency
- Increased uncertainty about statements of sovereign debt paths in key economies
Factors that have been a drag on the price:
- With positive real interest rates, yield-bearing assets have a clear competitive edge.
- Favorable and sustainable financial position and widespread trust in equities.
- A structurally strong dollar combined with contained and declining inflation
Important turning points in the 50-year history:
1971: Fixed pricing ends, market discovery of gold begins, $35
1980: $850 peak as a result of compounding crises and entrenched inflation
1999: Price bottoms near $252, and the bearish consensus is at its lowest ebb.
2011: $1920 – end of the second major bull run with monetary conditions returning to normal levels.
2020: the first year to cross $2,000 in a pandemic environment
2025: Gold breaks through $3,000 and heads into new nominal space on structural and macro forces.
2026: Institutional demand for safe haven reaches an all-time high of $5,600.
History also reveals the challenges that have historically befallen overarching narratives. During the first stages of the crisis in 2008, gold gave back, just as it is usually considered a safe haven, and then rose when policy took action. Despite a strong inflation period in 2022, it still underperformed for much of the year. It fell over ten years for two decades, and recovery was called for each and every one, but the calls always proved to be premature.
Being honest about reading the 50-year chart means taking into account the periods when gold acted out of the ordinary and when it did what it was supposed to do. The price is a combination of financial policy, institutional flows, currency dynamics, and investor positions — all of which are interdependent and all of which are complex and cannot be summarized by a one-size-fits-all explanatory variable that is consistent through every time period.
Disclosure: This content is provided by a third party. Neither crypto.news nor the author of this article endorses any product mentioned on this page. Users should conduct their own research before taking any action related to the company.


Crypto’s most prominent former regulator wants the industry to stop treating the CLARITY Act as make-or-break. Chris Giancarlo, who chaired the Commodity Futures Trading Commission from 2017 to 2019, says the technology gets built either way.
Giancarlo still wants the bill passed. However, he argues the industry has staked its public message on legislation that has sat idle in the Senate for 80 days.
The CLARITY Act Is Not a Precondition
Speaking in a recent interview, Giancarlo said the sector has overcommitted to one piece of legislation.
“Now, what I’d say to the industry is perhaps it’s time to stop making such a big deal out of CLARITY,” he said.
The timeline explains the anxiety. The House passed H.R. 3633 on July 17, 2025, by 294 votes to 134. The Senate Banking Committee advanced it 15-9 on May 14, 2026.
No floor vote has followed. The Senate calendar sends the chamber home from August 10 until September 11, leaving roughly one week of floor time.
Giancarlo pointed to an older technology as precedent.
“The industry is running around saying we need clarity, we need clarity. Yeah, we do. But the internet is still happening and there’s never been an authorizing statute 30 years later. If we don’t get clarity, innovation goes on.”
Follow us on X to get the latest news as it happens
That cuts against the message from the bill’s loudest backers, including MicroStrategy and its lead Senate author, Cynthia Lummis.
Why Giancarlo Still Wants the Bill
His position is not opposition, and part of it is personal. Section 503 codifies LabCFTC, the fintech office he created in May 2017 as acting chairman.
He wants every financial regulator in Washington to run something similar.
“I’d like to see clarity pass, but I think we need to brace ourselves that it might not and the world is going to go on.”
The Precedent That Worries Him
Giancarlo also warns that legislation drags surveillance along with it. Public Law 119-27, the GENIUS Act, subjects permitted stablecoin issuers to the Bank Secrecy Act.
CLARITY applies the same standard to digital asset transactions. Giancarlo argues that approach violates Fourth Amendment privacy rights.
What Happens If CLARITY Fails
The CFTC is running on one Senate-confirmed official. Michael Selig, sworn in as the 16th chairman in December 2025, occupies the only filled seat of five.
Giancarlo expects the agency to keep moving with or without a statute.
“This is a change that is going to happen whether the clarity bill passes or not… Clarity will bring order to how that change happens. But it’s not going to stop that change.”
Failure would separate builders from spectators, he argued.
“If clarity doesn’t pass, the… premium for courage is going to go up.”
Subscribe to our YouTube channel to watch leaders and journalists provide expert insights
The post Stop Acting Like the CLARITY Act Is Everything, Former Regulator Says appeared first on BeInCrypto.
SpaceX earnings land Tuesday, August 4, marking the first since the company went public. The June listing already paid Morgan Stanley bankers about $100 million in fees.
That fee was the small part. IPOs led by SpaceX sent more than $74 billion to the bank’s wealth arm. Now SpaceX has to show the numbers behind it.
How the SpaceX IPO Built Morgan Stanley’s $10 Trillion Quarter
SpaceX sold 555,555,555 shares at $135 each on June 11. That raised $75 billion. It is the biggest IPO ever, more than double the $29.4 billion Saudi Aramco raised in 2019.
Ten banks ran the deal. Goldman Sachs, Morgan Stanley, BofA Securities, Citigroup and J.P. Morgan led them. They all shared the fee pool.
Only one of those banks also ran SpaceX employee stock plans. That is what set Morgan Stanley apart.
Here is why it matters. When staff get rich on IPO day, the money lands wherever their stock plan already lives.
Morgan Stanley’s wealth arm took in $148.1 billion of new client money last quarter. A year ago the figure was $59.2 billion.
Just over half came from IPOs of stock plan clients, its earnings release shows. That is more than $74 billion in three months. Bloomberg reported a large share came from SpaceX.
The bank calls this unit Workplace. It bought Solium Capital in 2019 and E*Trade in 2020 to build it. Both deals pushed the firm deeper into steady fee income after the 2008 crisis.
Workplace now serves over half the S&P 500. It also covers about 70% of the 100 biggest private companies worth more than $1 billion. Total client assets passed $10 trillion.
Jed Finn runs Morgan Stanley’s wealth business. He sees the IPO as a start, not a payday.
“It would be a mistake to think about the IPO as a one-off event for asset capture. These are opportunities with multiple phases, with shares that get unlocked and new shares issued.”
Follow us on X to get the latest news as it happens
Here is the catch. Most of that money is not earning fees yet.
Morgan Stanley charges a fee once clients move cash into managed accounts. Only 26% of the new money went that way last quarter. A year earlier it was 72%.
Bloomberg puts the yearly revenue from SpaceX-linked money above $100 million. Getting it depends on shares that are still locked.
What SpaceX Earnings Have to Prove on August 4
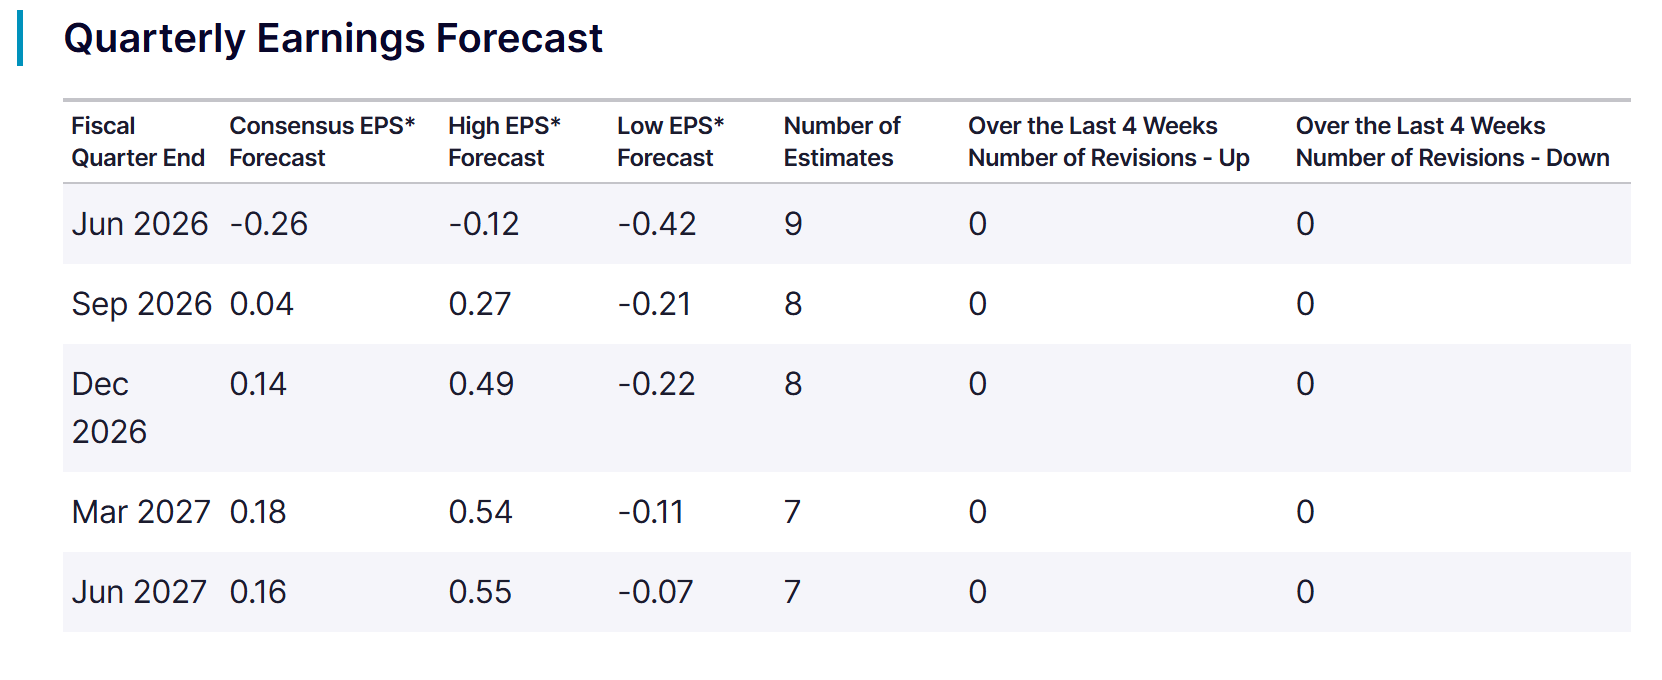
Results come after the close on Tuesday. Analysts expect a loss of 26 cents a share. Nine of them filed forecasts, per Zacks.

This is the first real look inside the business. Investors want launch numbers, Starlink revenue, and the split between government and commercial work.
The stock has not waited. SPCX closed at $108.37 on July 31. That is 20% below the $135 offer price and 33% below its $161 first-day close. It hit a record low last week.

Contracts have not helped either. Shares still fell after SpaceX won $1.6 billion in Space Force launch work through 2027.
Then comes August 6. About 911.5 million locked shares become free to sell, two trading days after earnings.
At Friday’s price that is close to $99 billion of stock. It is more than the IPO itself raised. Meta’s 2012 unlock is the closest thing to a warning here.
Morgan Stanley has already been paid. It raised its dividend 15 cents to $1.15 and approved $20 billion in share buybacks. SpaceX investors are still waiting.
The post SpaceX IPO Paid Wall Street $100 Million: Will It’s First Earnings Repay Investors? appeared first on BeInCrypto.

White House teleprompter operator Gabriel Perez is no longer employed by the federal government after being placed on unpaid leave over allegations that he used insider knowledge to bet on President Donald Trump’s speeches, according to another official.
Speaking on condition of anonymity, the official said that Perez had left his government job but did not say whether he resigned or was fired.
Inside the Allegations
The White House had suspended Perez earlier this month following an ABC News report that alleged he made more than $100,000 through bets on the online prediction market Kalshi. The report said the wagers were based on advance knowledge of what Trump would say during major speeches, including the State of the Union address earlier this year.
The allegations drew a sharp response from the White House. Press secretary Karoline Leavitt described the reported insider trading as “deeply unfortunate and, frankly, a disgrace.” Kalshi also responded after the report was published.
Robert Denault, the company’s lawyer and head of enforcement, said in a post on X that its surveillance team detected the trades, investigated them, and referred the matter to the US Commodity Futures Trading Commission (CFTC). Denault’s statement did not identify Perez by name.
Legal Battles
Kalshi has faced legal hurdles this year in Massachusetts, Michigan, Nevada, and Washington. At the same time, it has also tightened its own rules. In April, the prediction market suspended three political candidates for betting on elections they were contesting after determining that the trades amounted to political insider trading under its CFTC-approved rules.
An insider trading case on Polymarket also surfaced that same month. Federal prosecutors charged US soldier Gannon Ken Van Dyke with allegedly betting on whether former Venezuelan President Nicolás Maduro would be removed from power. Authorities said Van Dyke, who worked on the operation targeting Maduro, made about $400,000 from the trades.
The legal battle over prediction markets has also taken a new turn. This week, a federal judge temporarily blocked Minnesota from enforcing a new law that would have banned prediction markets in the state. The ruling gave a temporary win to Kalshi, Polymarket, and the CFTC as the case moves forward.
Judge Katherine Menendez said the law is likely preempted by the federal Commodity Exchange Act because many event contracts may qualify as federally regulated swaps. The law, signed by Governor Tim Walz in May, was set to take effect on Saturday. The judge said the injunction could later be narrowed if needed.
The post Teleprompter Operator Accused in Kalshi Betting Case Is No Longer a Federal Employee appeared first on CryptoPotato.


President Donald Trump reshared a White House post on Sunday about restarting California’s Sable Pipeline. The same day, OPEC+ agreed to pump more oil from September.
Both moves add oil to the market. Neither has helped drivers yet. Californians paid $5.49 a gallon in late July, the highest price in the country.
Why Trump Revived a March Order Now
Gas is expensive, and Trump knows it.
US drivers paid about $4.10 a gallon in the week to July 27, federal data shows. That is 97 cents more than a year ago.
In June, Trump told fuel retailers to cut prices to $2.50. They have not.
California hurts most at $5.49 a gallon. That is roughly $1.39 above the national average, which makes the state an obvious target.
On March 13, Trump signed an order giving Energy Secretary Chris Wright emergency powers. The law behind it, the Defense Production Act, lets Washington direct private companies during a crisis.
Wright told Sable Offshore Corp. to reopen the Santa Ynez Pipeline. It had sat unused since a 2015 oil spill.
Oil flowed the next day. Sable aimed to sell about 50,000 barrels daily from April 1, a company filing shows. The line can carry 200,000.
Courts keep pushing back. On June 17, a California appeals court blocked Sable’s coastal work, backing state regulators in a published opinion.
OPEC+ Supply Hike Opens One Tap, Not All
Seven countries agreed to pump 188,000 more barrels a day from September. Saudi Arabia and Russia account for most of that, at about 62,000 barrels each.
The move finishes one round of cuts. The group had held back 1.65 million barrels a day since April 2023. That batch is now fully back.
A second cut from November 2023 stays in place. So the taps are not fully open.
OPEC says it can still speed up, pause, or reverse, according to its July statement.
Harder talks come in 2027, when the group sets new limits for each member. Iraq already wants a bigger share.
What This Means for Crypto
More oil has not made oil cheaper.
Brent crude sat near $87 on July 20. US crude was close to $84. Those are the latest daily figures from the Energy Information Administration.
Wars in Iran and Ukraine explain the gap. They block exports, so the extra barrels stay stuck on paper.
That matters for Bitcoin. Costlier fuel pushes inflation higher, and energy costs pressure Bitcoin by making rate cuts less likely.
Cheaper fuel does the opposite. It gives the Federal Reserve room to cut, which has lifted risk assets before, such as after the Fed held rates steady.
The question now is simple. Will September’s barrels reach buyers, or stay stuck?
The post Trump’s Oil Order Meets OPEC+ Supply Hike: Why California Gas Costs $5.49 appeared first on BeInCrypto.

Data shared by Lookonchain earlier today suggests that Trump Media, the entity behind the Truth Social media platform, majority-owned by the Donald J. Trump Revocable Trust, has sold over $165 million worth of bitcoin.
This was the second substantial sale made by the entity in recent months after it had splashed over $1 billion at prices near the top last year to accumulate 11,542 units.
The on-chain analytics company noted that the latest offload was for 2,628 BTC after it had transferred the stash to crypto.com. This continued a streak that began earlier this year.
Previously, the entity had spent $1.37 billion to acquire 11,542 BTC at an average price of $118,522. Since its entry level was very close to bitcoin’s very top marked just under a year ago, this automatically means that its sales have been completed at prices well below that.
CryptoPotato reported the previous BTC disposal in May, when wallets linked to Trump Media sold another substantial batch of 2,650 BTC for $205 million.
Lookonchain’s data concurs that the entity has sold a total of 7,281 BTC since it began disposing of its assets, at an average price of under $75,000. This means that its total losses have grown to $555 million.
It looks like Trump Media sold another 2,628 $BTC($165.07M).
Trump Media bought 11,542 $BTC($1.37B) at an average price of $118,522, then started selling 7 months ago, selling a total of 7,281 $BTC ($545M) at an average price of $74,855.
Trump Media is now down a total of $555M… pic.twitter.com/9xx0MTbweg
— Lookonchain (@lookonchain) August 2, 2026
Aside from the continuous controversial decisions toward the crypto industry from the POTUS-linked companies, this move builds on a recent worrisome trend about BTC treasury firms deciding to sell during times of distress.
As we reported last week, several public companies have shifted their strategies, with some selling BTC holdings while others have paused buying the asset indefinitely.
The post Trump Media Sells Another $165M in Bitcoin, Booking a Fresh Loss appeared first on CryptoPotato.

After two consecutive painful months in which they lost billions of dollars, the spot Bitcoin ETFs finally turned the page in July, but inflows were still modest.
Meanwhile, the exchange-traded funds tracking the performance of the largest altcoin enjoyed the month more, attracting over 2x more fresh capital.
Bitcoin ETFs in July
March and April were quite bullish for the spot BTC ETFs as the financial vehicles attracted well over $3 billion. However, the trend changed violently in May when they lost $2.43 billion. June became the worst month on record, as investors pulled out just over $4.5 billion. In total, the net outflows for May and June stood at nearly $7 billion, and the cumulative total flows dropped from over $58 billion to $51 billion.
July started more positively, with almost $200 million in net inflows during the first full week. Another $76 million followed during the second, and a more modest $34 million in the third. The trend was obvious as the initial high numbers gradually declined, aligning with the underlying asset’s controversial and sporadic price performance and ultimately leading to a very modest increase throughout the month.
The last week in July was once again in the red, with investors pulling $61.53 million out of the funds. Friday was the most painful day, as the total net outflows stood at over $265 million. As such, the month ended with $172.42 million. On one hand, green finally overcame the red wave, but on the other, the number was nowhere near enough to offset some of the recent losses.
ETH ETFs Do Better
The Ethereum ETFs entered July after a similarly painful two-month streak, in which they lost $541 million in May and another $529 million in June. However, investors were more persistent, and the actual net inflows for July were at a more respectable $365.17 million, thus outpacing the BTC ETF flows by over 2x.
Moreover, the ETH ETFs closed all four full weeks of July in the green, including the last one, which saw only one day in the red. Perhaps this investor behavior is among the reasons behind the underlying asset’s major resurgence in July. As reported earlier, ETH ended the month with a substantial 20% increase, making it the best in precisely a year.
All eyes are now on August, which hasn’t been ETH’s most favorable month historically, but there are some major double-digit exceptions.
The post Bitcoin vs. Ethereum ETF Battle: Who Won July? appeared first on CryptoPotato.
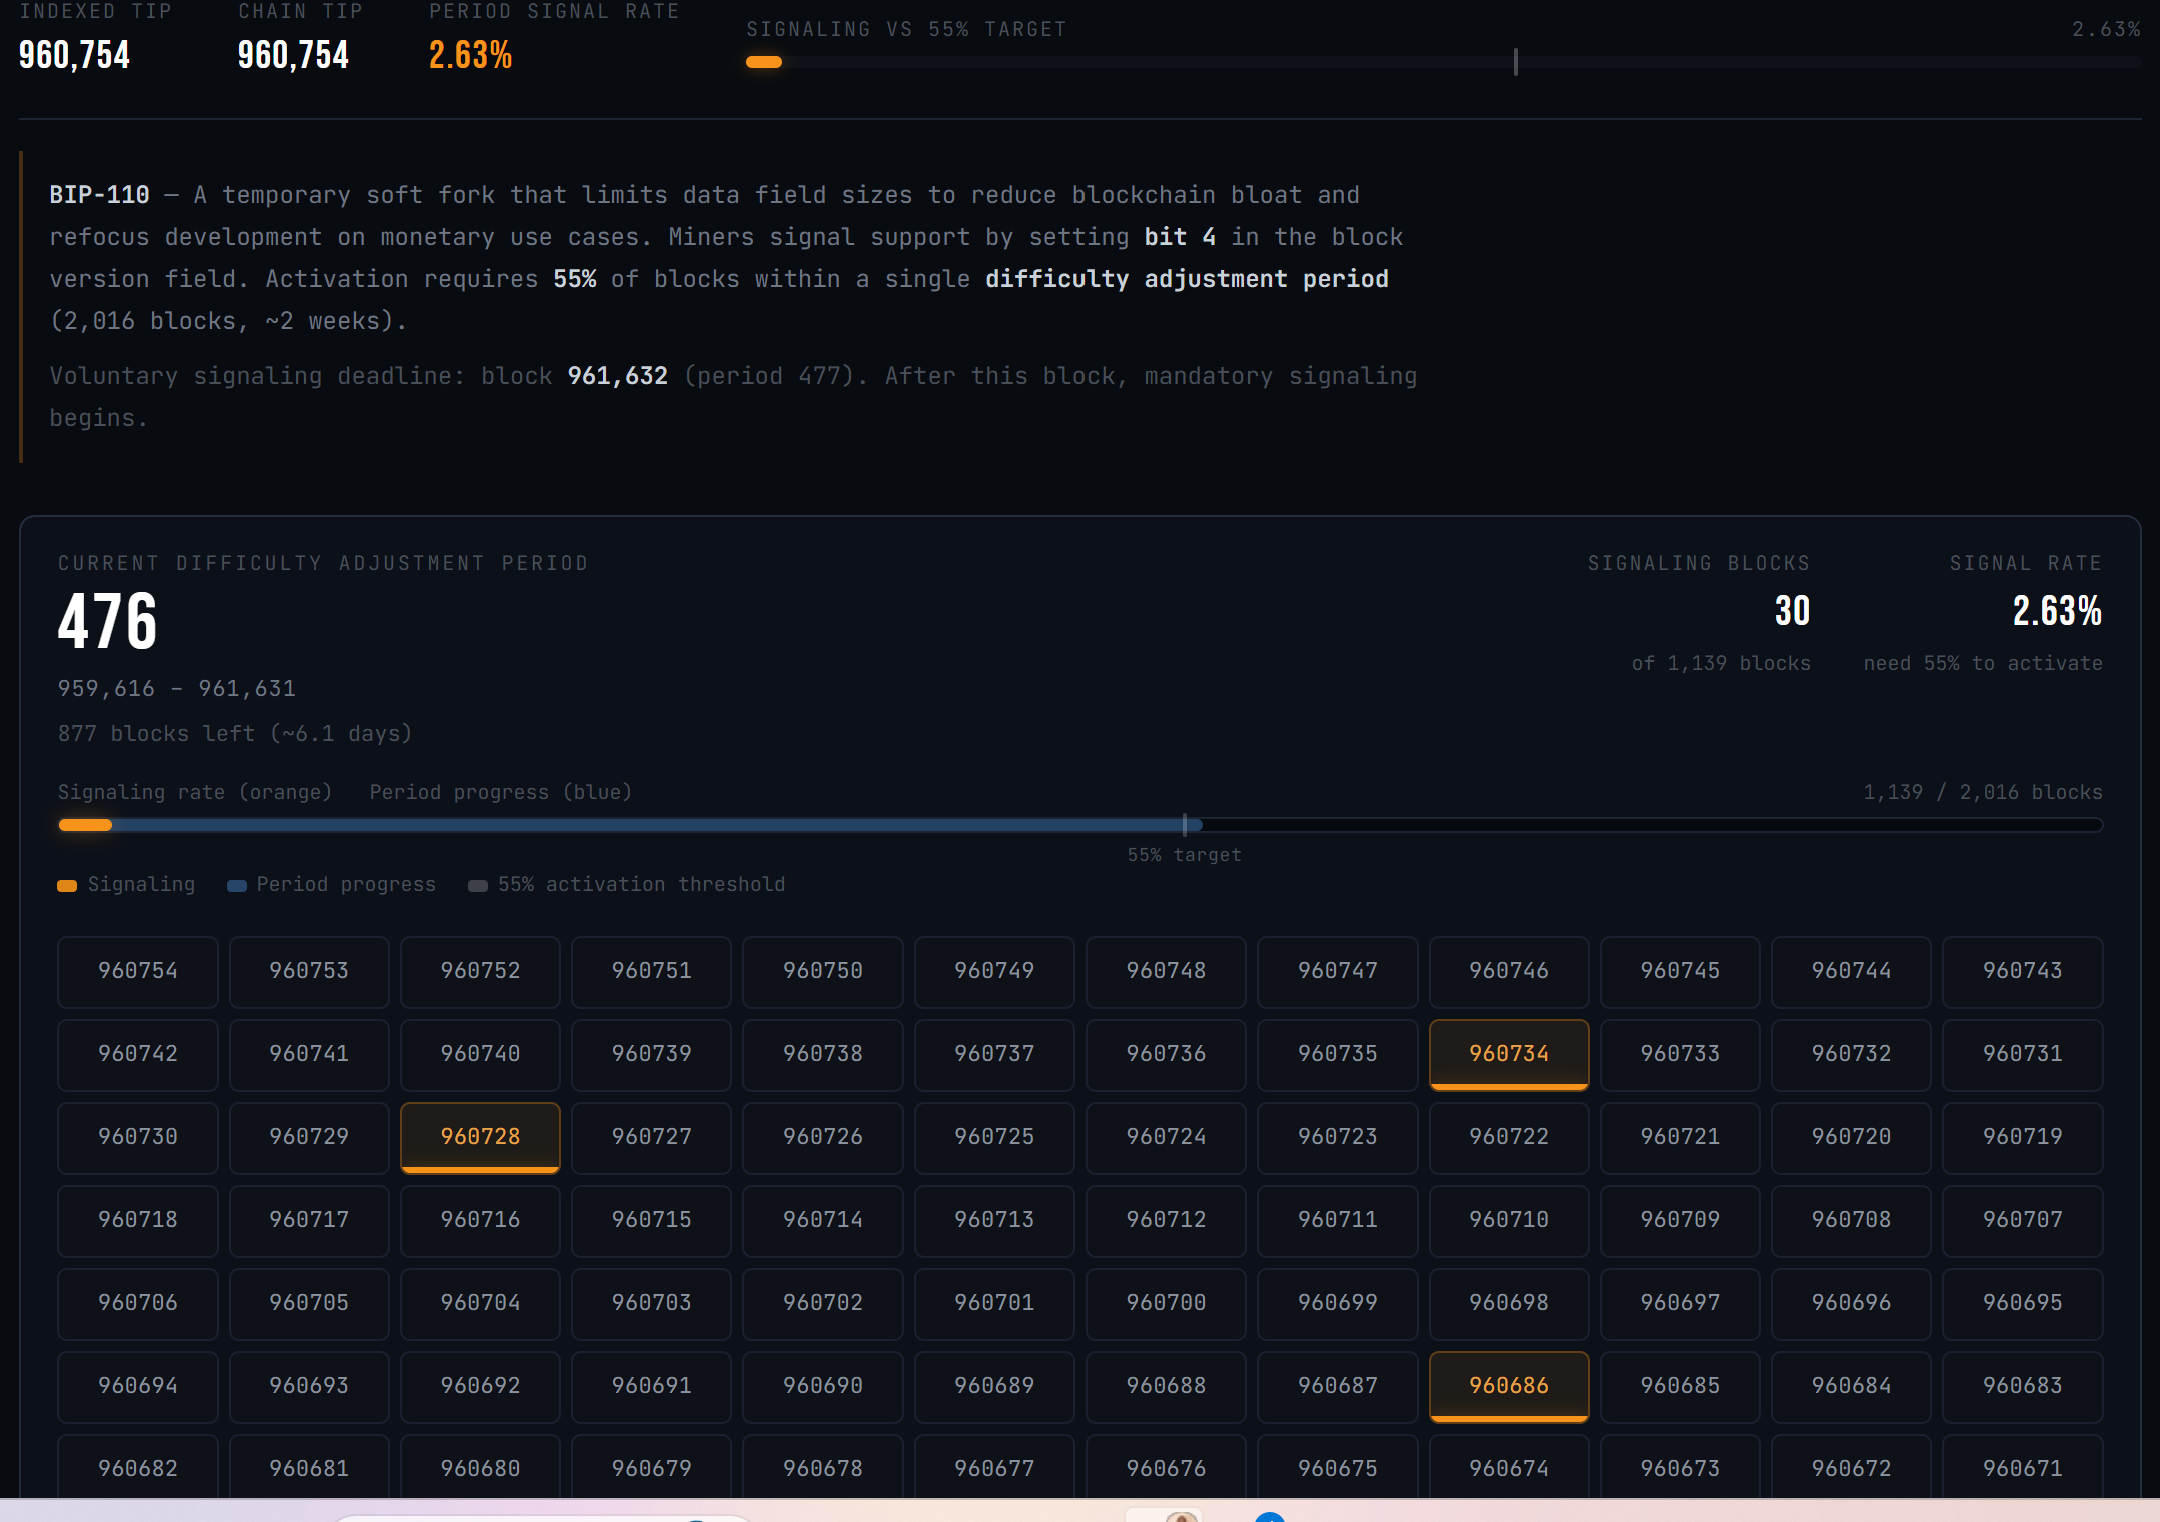
The developers pushing Bitcoin’s BIP-110 rule change have called off its launch. They blamed the industry response to a Coldcard wallet flaw that left user funds easier to steal.
Udi Wertheimer announced the delay, urging anyone running BIP-110 software to switch back to a normal Bitcoin (BTC) node. He gave no new date.
Why BIP-110 Activation Was Paused
BIP-110 is a temporary rule change, known as a soft fork. It would limit how much data people can pack into Bitcoin transactions.
Supporters say that data crowds out ordinary payments. Critics say Bitcoin should not police what users store.
The limits would last one year. Developer Dathon Ohm wrote the rules, and Bitcoin Knots software ships them.
Miners started voting on December 1, 2025. The Bitcoin blockspace spam debate had already split the community.
Then a separate problem landed.
Coinkite disclosed the bug on July 30. Its COLDCARD wallets built seed phrases, the master key behind a wallet, using far less randomness than promised. Roughly 72 bits instead of 128.
That gap makes a seed vastly easier to guess. Wallets running firmware released since March 2021 were hit hardest.
Updating the device does not fix a seed it already made. Coinkite is telling owners to move their money.
Thieves had already drained wallets tied to the flaw. The company has not said how much was lost.
Wertheimer called the delay a matter of timing, not doubt.
“…due to the coldcard incident, BIP-110 community leaders have decided to DELAY ACTIVATION. a new activation date will be announced at a later time,” he wrote.
Follow us on X to get the latest news as it happens
The Math Was Already Settled
Miners back a rule change by flagging their blocks. BIP-110 needed 55% of blocks in a two-week stretch. That means 1,109 blocks. The live monitor counted 30.

That is 2.63% of 1,068 blocks mined this period. It is the best BIP-110 has ever managed. It is still more than 20 times short.
Every earlier two-week stretch since December finished below 1.3%. Only 948 blocks are left. Even if every one voted yes, the total would reach about 48%. It could not pass this round.
That was already true days before anyone announced a delay.
Michael Saylor has warned about Bitcoin neutrality for weeks. He says almost every yes vote comes from one mining pool. Blockstream chief executive Adam Back has flagged chain split risk, calling the 55% bar too low to be safe.
A second phase was due at block 961,632, about six days away. It would reject any block that did not vote yes.
Nodes still running BIP-110 would enforce that on their own. That is why the warning to switch back matters.
No one owns Bitcoin’s rules. Nobody can flip a switch to start or stop a soft fork. This was a request, not a command.
Whether operators listen will say more about BIP-110’s support than any vote counter has.
The post BIP-110 Activation Frozen After Coldcard Exploit: Is the Soft Fork Dead? appeared first on BeInCrypto.
Senators Ruben Gallego and Thom Tillis sent a proposed revised ethics provision to the White House on Thursday, after drafting the compromise the day before, an industry source familiar with the talks told CoinDesk. As of midafternoon on Friday, the White House had not officially responded to the proposal.
Ethics remains the biggest outstanding issue to be resolved before the Clarity Act can advance. There are ongoing negotiations around other issues, including stablecoin reserves and yield, law enforcement authorities and some of the Agriculture Committee provisions addressing the Commodity Futures Trading Commission’s total remit, but these are relatively uncomplicated compared to ethics, two industry sources said. One added that they expected those other issues to be resolved relatively quickly should negotiators come to a deal on ethics.
If the White House signs off on the counter-proposal from Tillis and Gallego, that could speed the way to at least the first part of the cloture process, the other source told CoinDesk. The Senate would still need to follow the cloture process laid out in last week’s edition of this newsletter, but the timelines involved mean that it would be difficult to get the bill all the way through by the end of the week. Still, getting through that first procedural vote would be a visible win for the crypto industry, should it happen.


Strategy Inc. kept the annual dividend rate on its STRC preferred stock at 12% for August 2026, even though the Nasdaq-listed security ended July more than 10% below its $100 stated amount.
Summary
- 12% annualized dividend remains unchanged for August despite STRC closing July at $89.46 per share.
- $3.75 billion reserve covers roughly 2.1 years of preferred dividends and debt interest payments currently.
- Strategy repurchased 288,930 STRC shares below par while retaining $975 million in remaining authorization capacity.
The company’s official STRC information page confirms that the variable annualized rate for record dates beginning in August remains 12%. Executive Chairman Michael Saylor promoted the product on Aug. 1 as a way to “stretch your income,” emphasizing its twice-monthly payment schedule.
STRC closed at $89.46 on July 31, down $0.25 during the session. At that price, the $12 annualized payout based on the security’s $100 stated amount produces an effective yield of about 13.41%. Because Saylor announced the unchanged rate during the weekend, no post-announcement market reaction will be available until Nasdaq trading resumes.
Strategy’s STRC dividend no longer rises automatically
Strategy raised STRC’s annual dividend from 11.5% to 12% for record dates beginning in July. The increase followed a sharp June decline that took the shares as low as $71.25 and moved them far below the $100 level the company wants to maintain.
However, the company changed its rate-setting policy on June 29. Under the revised framework, management considers STRC’s market price, credit spreads, competing yields, Bitcoin volatility, cash-reserve coverage and the wider capital structure. The filing specifically states that Strategy will not necessarily raise the dividend solely because STRC trades below its stated amount.
That policy explains why July’s discount did not produce another 50-basis-point increase. Strategy instead said during its second-quarter results that it would maintain the 12% rate until STRC shows “sustained, healthy trading” near $100. The language describes management’s objective and does not guarantee that the shares will return to par.
The decision also prevents Strategy’s cash obligations from rising further while the company attempts to repair demand through other measures. Every additional 50 basis points would increase the annual cash cost across more than $10.46 billion in outstanding STRC stated value.
Buybacks now carry more of the price-support burden
Strategy has shifted part of its response from dividend increases to preferred-share repurchases. Between July 20 and July 26, the company bought back 288,930 STRC shares for approximately $25 million, paying an average of $86.53 per share. The purchase represented a 13.47% discount to the shares’ stated amount.
About $975 million remains under Strategy’s $1 billion preferred-securities repurchase authorization. Management said it intends to purchase more STRC at deeper discounts and reduce its activity as the security approaches $100. The authorization does not require Strategy to spend the remaining amount and has no fixed expiry date.
Repurchasing shares below par reduces the number of preferred shares requiring future cash distributions. It also lets Strategy retire $100 of stated value for less than $100. However, buybacks use capital that could otherwise remain available for dividends, debt interest or Bitcoin purchases.
As previously reported, Strategy funded its first $25 million STRC repurchase while increasing its U.S. dollar reserve and keeping Bitcoin purchases paused. The company raised much of that liquidity through sales of MSTR common stock rather than new STRC issuance.
The $3.75 billion reserve supports the 12% payout
Strategy reported a $3.75 billion U.S. dollar reserve as of July 26. The company said that amount covers approximately 2.1 years of expected preferred-stock dividends and interest on outstanding debt. The reserve can only be used for those obligations unless the board approves another purpose.
The cash cushion has become more important because Strategy’s preferred-stock commitments have expanded. The company recorded $400.7 million in preferred dividends during the second quarter, compared with $49.1 million one year earlier. It has paid or declared more than $1 billion in cumulative preferred distributions.
Strategy also reported an $8.22 billion second-quarter net loss, driven mainly by an $8.32 billion unrealized loss on its Bitcoin holdings. The accounting loss did not represent an equivalent cash outflow, but the preferred dividends must be paid in U.S. dollars.
The company has therefore authorized Bitcoin sales to refill the reserve, cover dividends and interest, or finance approved security repurchases. Strategy had sold approximately $218.4 million of Bitcoin during 2026 through July 26 to fund part of its preferred obligations.
As crypto.news reported, Strategy held 843,775 BTC at an average acquisition cost of about $75,476 as of July 26. The company valued that position at $54.77 billion using Bitcoin’s July 27 market price, compared with its $63.69 billion original cost.
STRC holders receive two payments each month
STRC moved from monthly to semi-monthly distributions after shareholders approved the change in June. Record dates now fall on the 15th and final day of each month, with payments generally following around 15 days later.
Strategy has already declared a payment of $0.50 per share for Aug. 15 to investors recorded as shareholders on July 31. The company’s website lists the 12% rate for August record dates, but future cash distributions still require board or committee approval and are not guaranteed.
For U.S. federal tax purposes, Strategy expects the current payments to be treated as returns of capital to the extent of an investor’s tax basis. That is the company’s expectation rather than a guarantee of each shareholder’s treatment, and Strategy advises investors to seek tax guidance based on their own circumstances.
STRC is also unsecured. Strategy states that its preferred securities are not collateralized by its Bitcoin holdings and only hold a preferred claim on the company’s residual assets. The company further warns that STRC is not a bank deposit, is not FDIC-insured and does not carry the same protections as Treasury securities or money-market funds.
What happens next for STRC and Strategy
Chief Executive Phong Le said management’s objective is for STRC to trade between $99 and $100 “over time.” Strategy has not provided a deadline for reaching that range, and the shares’ $89.46 closing price shows that the market continues to demand a yield above the stated 12% rate.
The next confirmed event is the Aug. 15 distribution. Investors will then watch Strategy’s next monthly rate decision, further STRC repurchases and weekly SEC disclosures covering common-stock sales, Bitcoin transactions and changes to the dollar reserve.
Saylor separately posted “Bitcoin Drive engaged” on Aug. 2 alongside the company’s treasury chart. The message may fuel expectations of a new purchase disclosure, but the post does not confirm that Strategy bought Bitcoin or reversed its recent pause. An SEC filing or company announcement would be needed to verify any transaction.
As of then, Strategy is relying on its existing 12% rate, twice-monthly payments, cash reserves and discounted repurchases rather than offering STRC investors another dividend increase.

The spot exchange-traded funds tracking Ripple’s cross-border token continue with their impressive performance in times of market uncertainty, and saw only one day of no reportable action in the past week, unlike the previous ones.
July also ended in the green for the funds, meaning that only one out of the nine months they have been active was in the red.
The Good Weekly and Monthly
Data from SoSoValue shows that Monday and Wednesday were quite modest in terms of net inflows. On both days, the ETFs attracted just under $600,000. However, the green streak continued and accelerated at the end of the business week, with $6 million in net inflows on Thursday and another $7.7 million on Friday.
Thus, the week ended with $14.86 million in the green, making it the best since the one that ended on July 2, when the funds attracted $17.19 million. On a monthly scale, investors poured in $27.29 million into the spot XRP ETFs.
What’s even better is that the funds have reached another all-time high in terms of cumulative total net inflows, at over $1.5 billion as of Friday’s close. Bitwise’s XRP has extended its lead over Canary Capital’s XRPC, with $511 million in net inflows compared to $467 million for the latter.
The Bad
Although July indeed ended in the green, the actual net inflows were not all that impressive. The $27.29 million places July as just the second-worst month, beating only January when investors inserted $15.59 million into the funds.
In contrast, June was a lot more positive, with the net inflows standing close to $60 million. May was even better, with almost $132 million. The all-time high from November at $666.61 million remains untouchable.
The Ugly
Although this improved at the end of the month, July saw the most days with no reportable action in terms of net flows. Precisely half of the trading days (11 out of the 22) saw no flows, according to SoSoValue, which, aligned with the more modest $27.29 million in net inflows, suggests dwindling interest in the funds.
Separately, the underlying asset’s price performance continues to disappoint despite the numerous positive developments in the broader Ripple ecosystem. Although it managed to defend the $1.05 support during the weekend, XRP is still below $1.10, and it’s down by more than 3% on a monthly scale. What’s even more worrisome is the fact that August has been a particularly painful month for the asset historically.
The post Ripple (XRP) ETF Monthly Recap: The Good, The Bad, and the Ugly appeared first on CryptoPotato.

Andy Burnham insists Labour is restoring control of Britain’s borders despite 2,000 illegal migrant crossings since he became Prime Minister

Stop Acting Like the CLARITY Act Is Everything, Former Regulator Says

India secure top-four finish at 2026 Commonwealth Games after historic 39-medal campaign | Commonwealth Games News


-

 Business4 days ago
Why Trees Belong on the Risk Register
-

 Fashion2 days ago
Weekend Open Thread: Wit & Wisdom
-

 Tech7 days ago
Intel is reversing course and bringing hyper-threading back to its server chips
-

 Politics2 days ago
Meta enters AI-training agreement with far-right ‘propaganda rag’ Newsmax
-

 Politics6 days ago
Luke Littler dismantles Gerwyn Price to retain title in Blackpool
-
 Crypto World1 day ago
MicroStrategy Post-Earnings CLARITY Act Push Could Add New Catalyst for Its Stock
-

 Politics5 days ago
The Part of the Electric Transition Nobody Wants to Discuss
-
 Entertainment5 days ago
‘Stargate’ Creator’s New Sci-Fi Series Returns for Season 3 Tomorrow
-

 News Videos7 days ago
BITCOIN JUST ENTERED THIS CRITICAL ZONE…
-

 Business5 days ago
Major shareholder moves on Canyon
-

 News Videos3 days ago
Bitcoin Enters the 3rd Stage of the Bear Market
-

 Crypto World2 days ago
XRP Ledger v3.3.0 brings five institutional features
-

 Crypto World5 days ago
Kraken Enables Retail Access to Jersey Mike’s IPO via Tokenized Shares
-

 Tech6 days ago
New macOS Sequoia & Sonoma security updates for older Macs
-

 News Videos5 days ago
Claude: Build Financial Dashboards in Minutes (2026)
-

 Politics3 days ago
Luke Littler’s dominance sparks GOAT debate
-

 Business5 days ago
Johnson & Johnson agrees to $5.5B settlement over talc cancer claims
-

 Sports3 days ago
Seema Kaliramna Wins Discus Throw Bronze, Takes India’s CWG Medals Tally To 17
-

 Crypto World11 hours ago
Crypto PAC spending tops $2M in Michigan House race
-

 Business2 days ago
Trump Announces Hamas Disarmament Agreement as Iran Strikes Kuwait Air Base and US Attacks Pause Overnight
You must be logged in to post a comment Login