

Crypto World
Semiconductors Beat Big Tech and Crypto in H1: Is the Trade Turning?

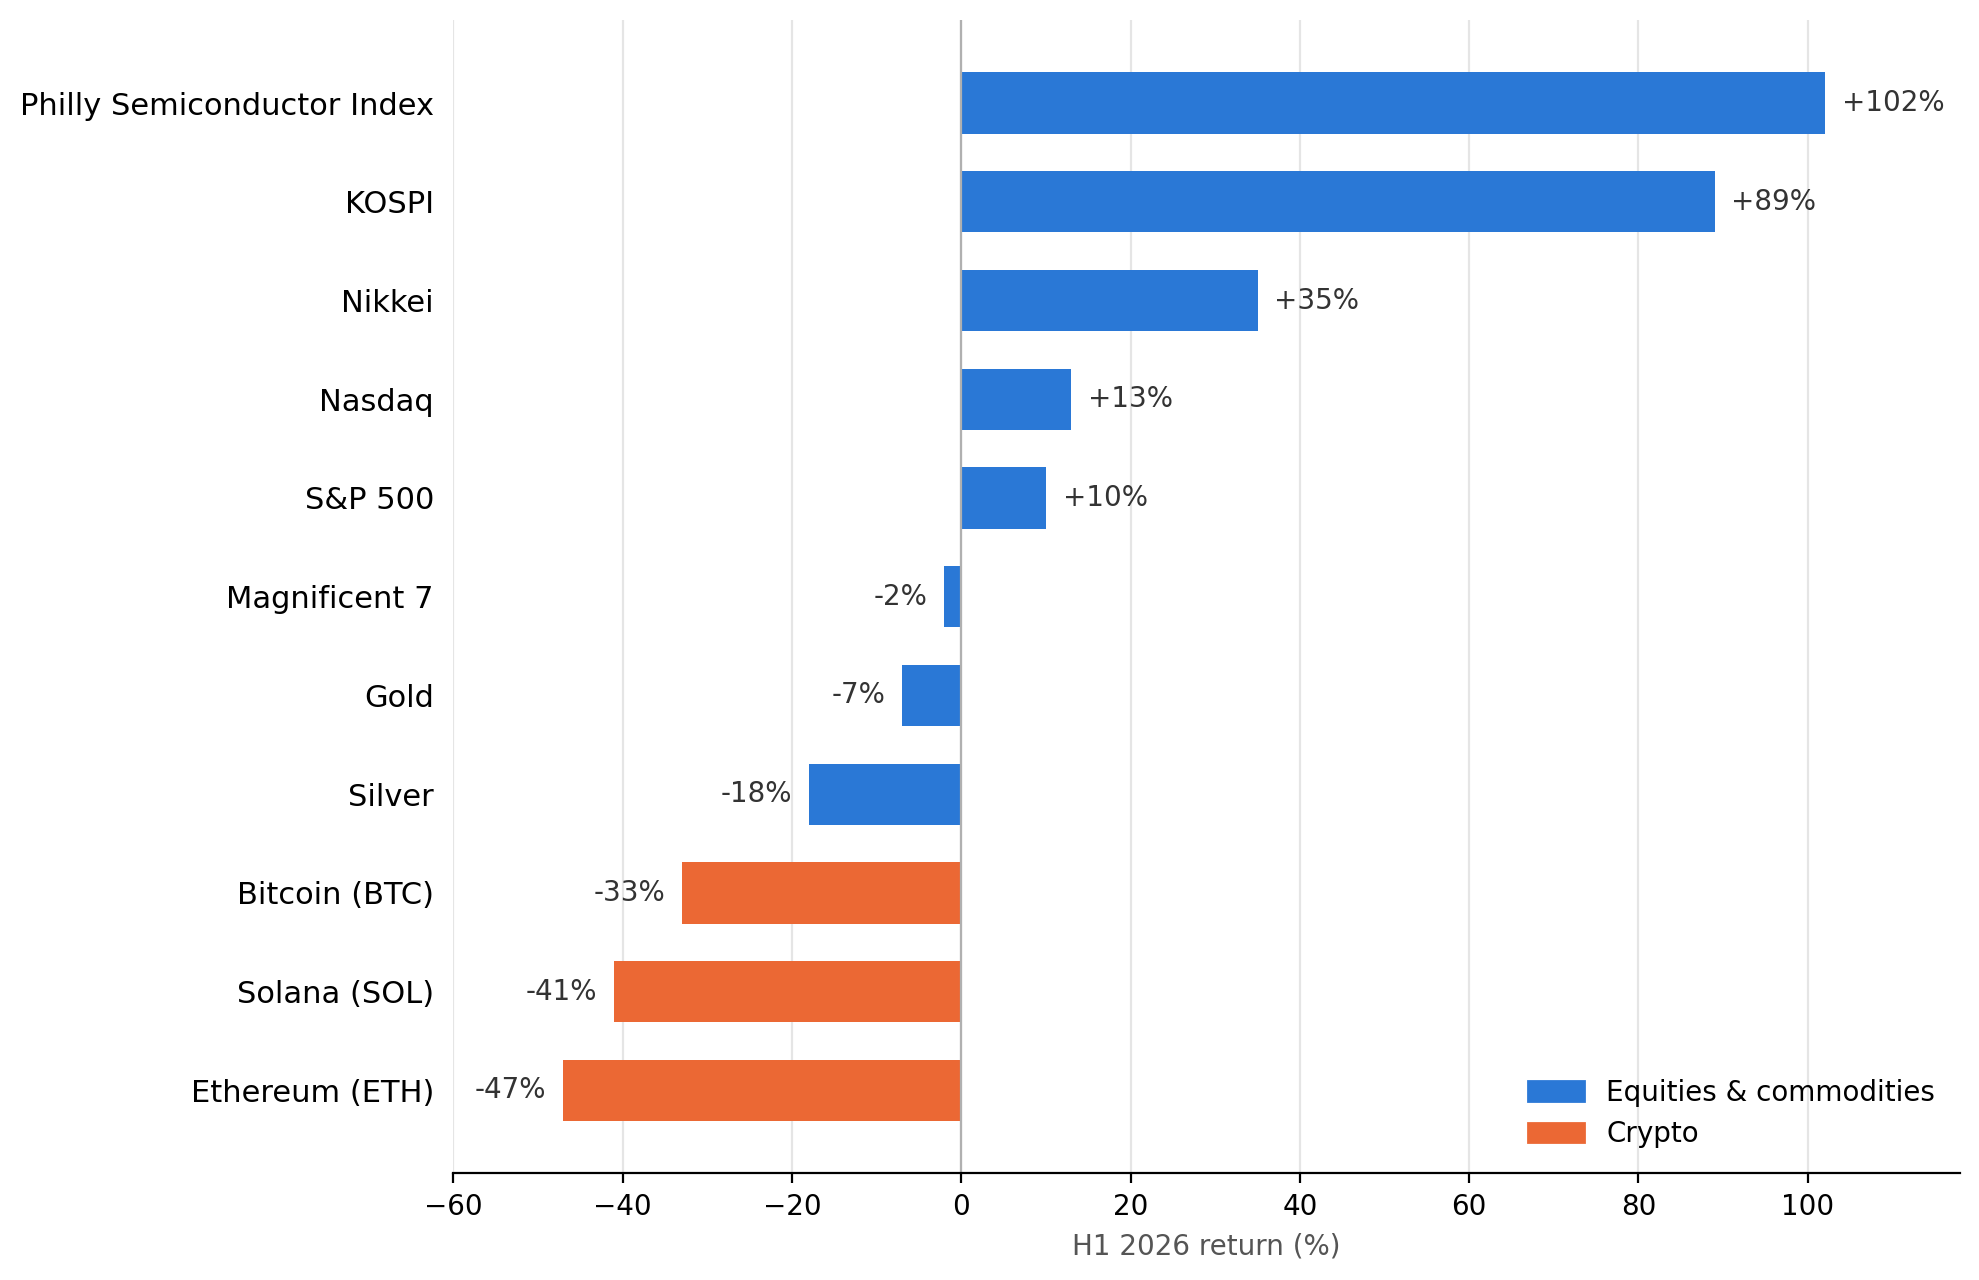
Semiconductor stocks beat both Big Tech and crypto in the first half of 2026. The Philadelphia Semiconductor Index gained 102%, while the Magnificent Seven fell 2% and Bitcoin (BTC) lost 33%, according to Deutsche Bank and CoinGecko data.
Wall Street banks now disagree about the second half. Goldman Sachs expects investors to keep backing chipmakers, while Morgan Stanley argues the trade has already started to unwind.
How Semiconductors Beat Big Tech and Crypto in H1 2026
Deutsche Bank’s half-year scoreboard ranked the Philadelphia Semiconductor Index as the best-performing major asset in the world. The benchmark gained 102% between January and June, according to a chart shared by Schaeffer’s Investment Research.
Korea’s chip-heavy KOSPI followed with an 89% gain, while Japan’s Nikkei added 35%. In contrast, the Nasdaq rose just 13% and the S&P 500 slightly under 10%.
The Magnificent Seven, the group that carried US markets for two years, ended the half 2% lower.

Crypto fared even worse. Bitcoin slid 33% in the first half, falling from roughly $87,500 to below $59,000, CoinGecko data shows. Ether (ETH) dropped 47%, and Solana (SOL) fell 41%. Traditional hedges offered no shelter either, as gold slipped 7% and silver lost 18%.
ETF flows tell the same story. The VanEck Semiconductor ETF climbed 72%, and the iShares Semiconductor ETF gained 99%, while the Roundhill Magnificent Seven ETF declined slightly.
Meanwhile, a shortage of memory and storage has led chipmakers to raise prices as the industry approaches $1 trillion in annual revenue.

Goldman Backs the Earners While Crypto Trades Like a Spender
Goldman Sachs derivatives specialist Brian Garrett explained the divergence in a client note last week, as reported by Stocktwits.
“One of the reasons for the decrease in Mag7 exposure seems almost too simple as it’s been hiding in plain sight for months. The market is rightly rewarding the names that earn (capex beneficiaries, semiconductors, etc) while at the same time questioning the names that spend (hyperscalers).”
Hyperscalers such as Microsoft, Amazon, Meta, and Google pour hundreds of billions of dollars into data centers. Markets increasingly treat that spending as a cost without a proven payoff.
Meanwhile, companies that sell chips, memory, and equipment recognize revenue today.
That logic hits crypto hardest. Bitcoin earns nothing from the AI buildout, so it traded alongside the spenders rather than the earners. The pressure intensified after Michael Burry’s bubble warning sent memory stocks sliding this month.
The same split appeared inside the crypto market. Render (RNDR) gained 17%, and NEAR Protocol (NEAR) added 18% in the first half, while most majors fell over 30%, per CoinGecko. Both tokens sell exposure to computing power, the scarcest resource of this cycle. However, the pattern is not universal, as Bittensor (TAO) and Fetch.ai (FET) still declined.

Bitcoin miners occupy the middle ground. Riot Platforms keeps selling BTC while funding its AI pivot, and rival miners chase similar data center deals.
Morgan Stanley Sees the Chip Trade Turning
Morgan Stanley strategist Michael Wilson argued on Monday that chip momentum is fading as investors rotate toward hyperscalers, Bloomberg reported. The Philadelphia index has dropped almost 14% from its June record, though it remains 123% higher since September.
Cracks appeared before July. A blowout Micron forecast failed to sustain the rally, and the KOSPI triggered circuit breakers in June. Wilson, therefore, favors hyperscalers in the near term and expects them to soften spending plans.
JPMorgan strategist Mislav Matejka believes the rally will broaden beyond technology in the second half.
“AI is unlikely to be the only story in town.”
For crypto, this debate matters more than it appears. If capital exits the crowded chip trade and hunts laggards, Bitcoin ranks among the largest liquid laggards available. The token trades near $61,626 after a weekend short squeeze briefly lifted it toward $64,000.
Still, no major bank has named digital assets as the next rotation target. The coming weeks will show whether hyperscaler earnings confirm the turn, and whether any freed capital finds its way back to crypto.
The post Semiconductors Beat Big Tech and Crypto in H1: Is the Trade Turning? appeared first on BeInCrypto.

Meta Platforms disclosed that four US states want $1.4 trillion in penalties over claims it built Facebook and Instagram to addict teenage users.
California, Colorado, Kentucky, and New Jersey filed the demand ahead of a federal trial in Oakland this August. Meta called the figure unsupported by the evidence.
A Penalty That Nearly Matches Meta’s Market Cap
The demand sits just below Meta’s market capitalization of roughly $1.5 trillion. In other words, the four states want almost everything the company is worth.
The tech giant revealed the number in a court filing that responded to the states’ proposed penalty math. The company argued that no consumer protection case in US history comes close.
“A sanction of that size has no analog in the history of consumer protection enforcement.”
The disclosure caps a bruising year. The stock already saw $175 billion wiped off its market capitalization in one April session after a $145 billion AI spending outlook rattled shareholders.
How the States Calculated the Fine
The states’ filings remain sealed. However, they told the court in June that they multiplied estimated violations against young users by fine amounts set in state law.
The August trial covers far more than four states. Overall, 29 states accuse Meta of collecting children’s data without parental consent under the Children’s Online Privacy Protection Act (COPPA).
Judge Yvonne Gonzalez Rogers rejected Meta’s bid to cancel the trial last month. Meanwhile, the teen mental health debate around the company keeps growing louder.
Meta denies the claims. It argues that social media addiction is not an established psychiatric condition, so its safety statements could not mislead anyone.
A further 14 states will press similar claims at a second trial in February. Therefore, the Oakland case only opens a much longer legal fight.
Meta Stock Shrugs Off the Trillion-Dollar Threat
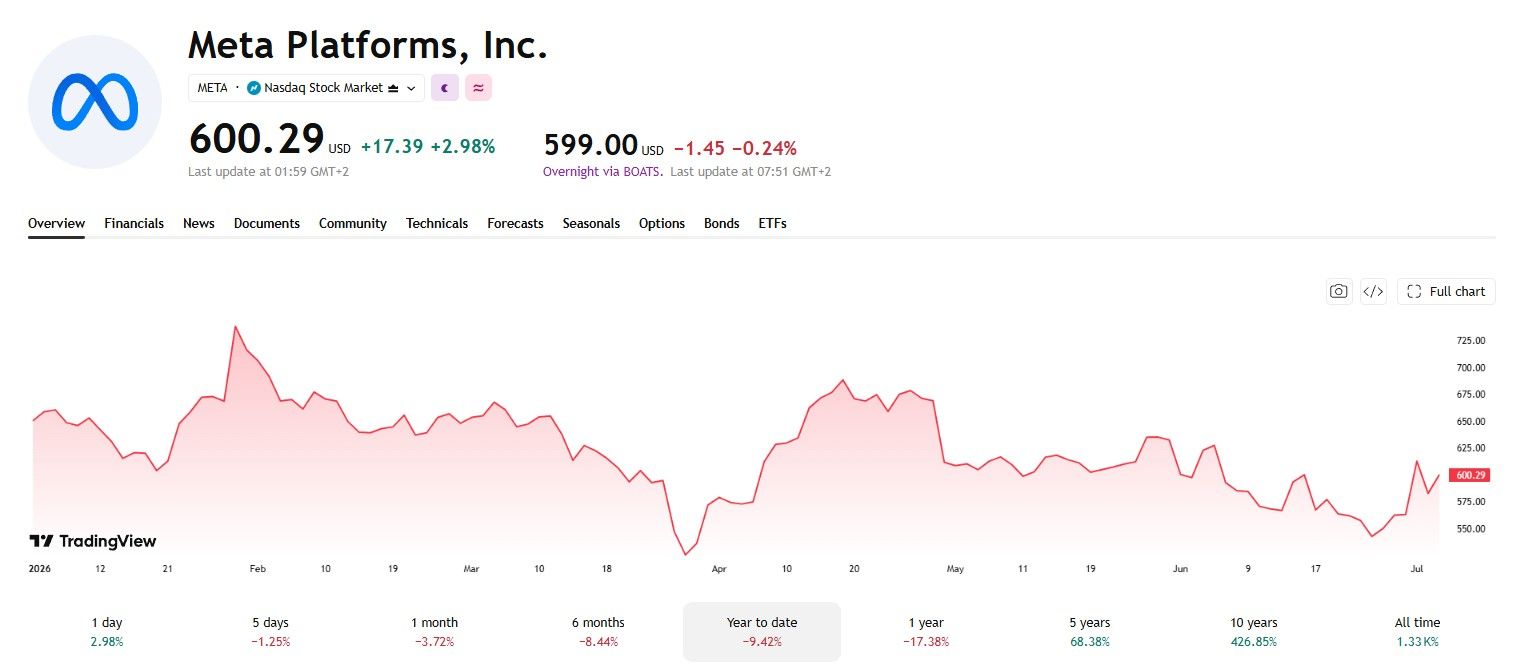
The stock closed near $600 on July 6, up almost 3% on the day. Investors clearly treat the $1.4 trillion figure as an opening bid rather than a likely outcome.

Still, the shares have dropped about 10% in 2026, and large funds keep rotating into Google stock. Polymarket traders also bet on rising tech layoffs as Meta employee morale craters.
New Mexico offers a warning, though. A jury there ordered Meta to pay $375 million in March for misleading consumers about child safety.
The Oakland verdict will show how far state consumer laws can stretch against Big Tech. Meta also faces a separate class action over data sharing, so its courtroom calendar stays full into 2027.
The post Meta Faces $1.4 Trillion Penalty Demand in US Youth Safety Lawsuit appeared first on BeInCrypto.
Gold is attempting to break its medium-term trend, with the latest US labour market data acting as the main catalyst. The US employment report released on 2 July came in noticeably weaker than expected, with the pace of hiring slowing to its lowest level in several months. This may have dampened expectations of a near-term Federal Reserve rate hike, while the minutes of the Fed’s June meeting, due to be released on 8 July, could provide further insight into how long this pause in the central bank’s rhetoric is likely to last. For now, markets are pricing in a more dovish scenario, supporting safe-haven assets such as gold.
Technical Analysis
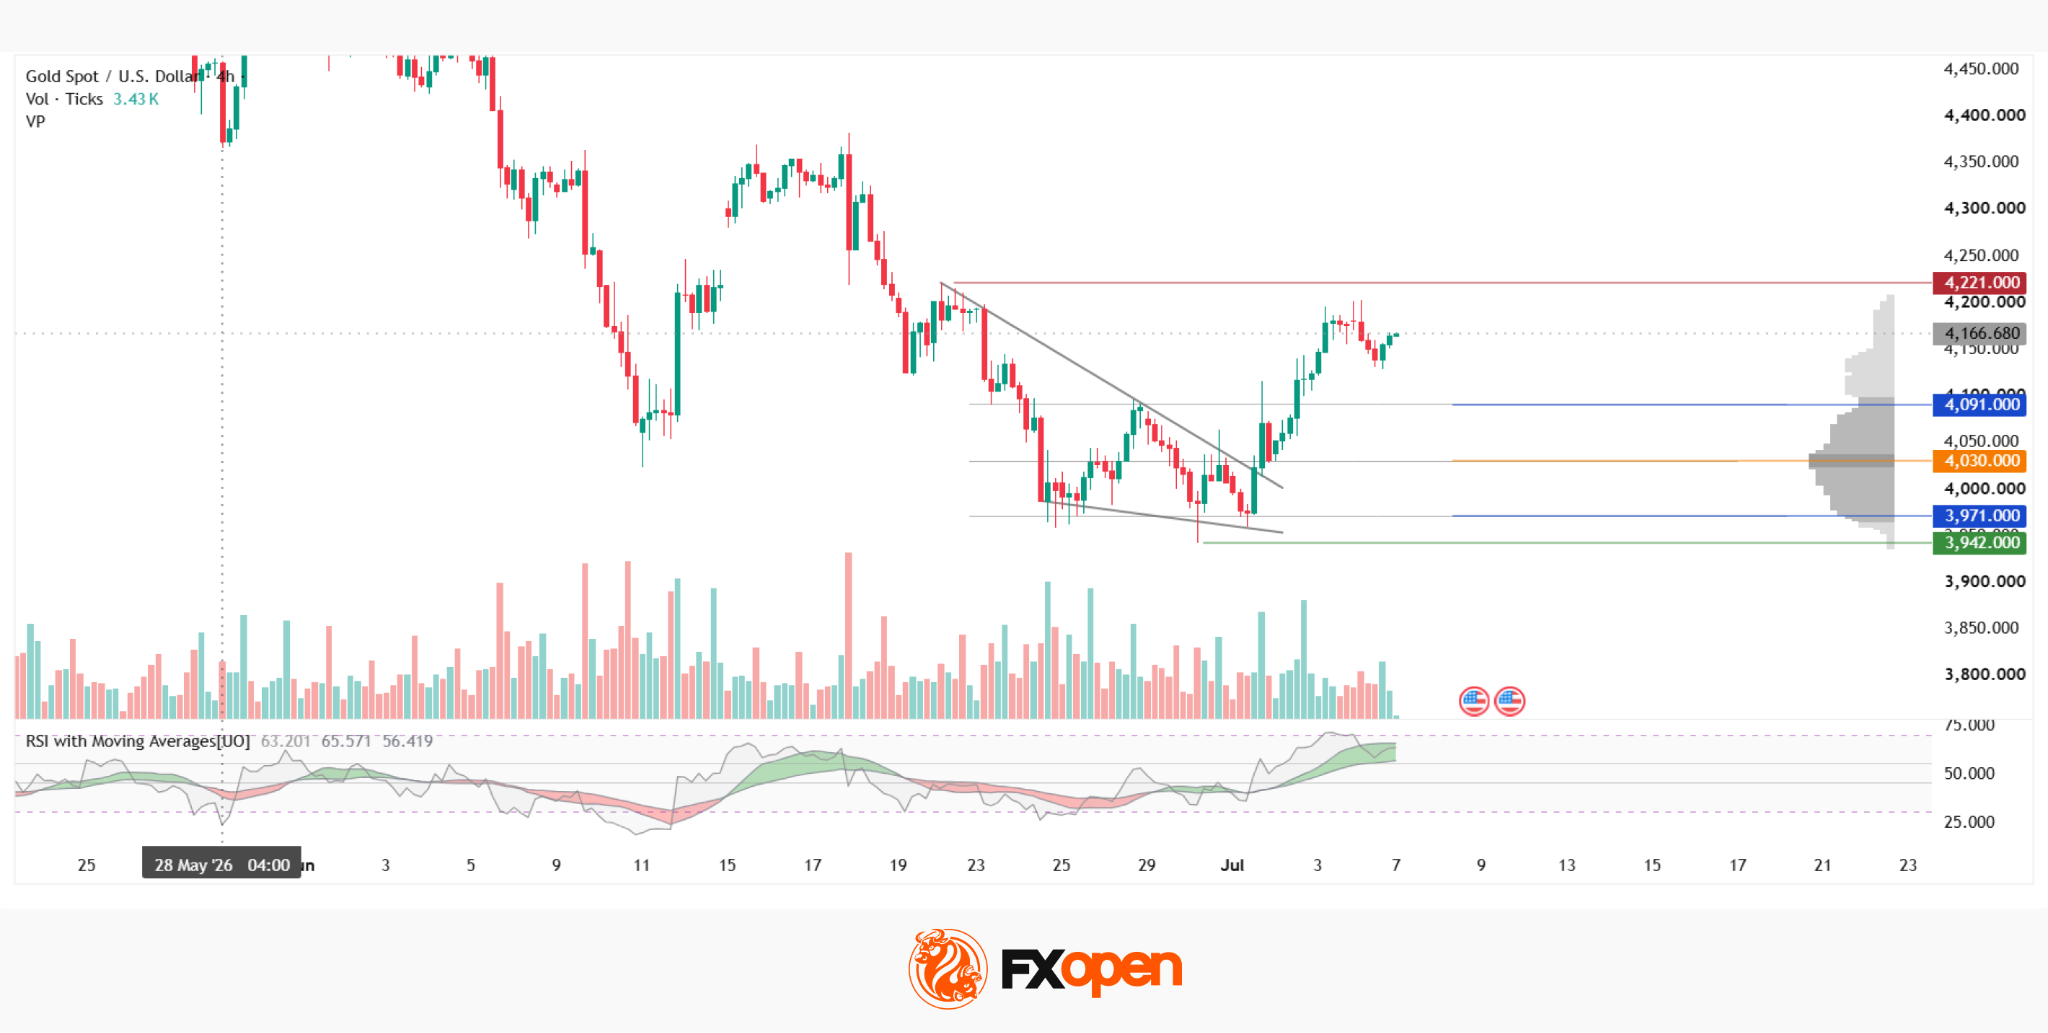
On the four-hour chart, XAU/USD declined from the $4,221 area in late June to around $3,942, where a recovery began. The decline formed a descending wedge, with its lower boundary attracting strong buying interest. This resulted in a sharp rebound, accompanied by a decisive breakout above both the pattern and the current market profile.
On 2 July, price closed above the upper boundary of the market profile at $4,091 and, if the rally continues, could target the base of the wedge. Should the market reverse, price is likely to retest the profile’s high-volume area, while the Point of Control (POC) at $4,030 and the lower profile boundary at $3,971 could provide support for buyers.
The RSI + MAs indicator currently stands at 62, 65 and 55. All three lines remain above the neutral level and continue to point higher, while the moving averages are still signalling bullish momentum. However, it is worth noting that the RSI has already entered overbought territory, suggesting that expectations for a substantial continuation of the rally should remain cautious.
Key Takeaways
The breakout from the descending wedge may have been interpreted by market participants as the beginning of a local trend reversal. However, a move towards the red resistance zone and a test of that area remain highly uncertain, particularly ahead of the release of the Federal Reserve’s June meeting minutes, which could significantly reshape market expectations.
Trade over 50 forex markets 24 hours a day with FXOpen. Take advantage of low commissions, deep liquidity, and spreads from 0.0 pips (additional fees may apply). Open your FXOpen account now or learn more about trading forex with FXOpen.
This article represents the opinion of the Companies operating under the FXOpen brand only. It is not to be construed as an offer, solicitation, or recommendation with respect to products and services provided by the Companies operating under the FXOpen brand, nor is it to be considered financial advice.
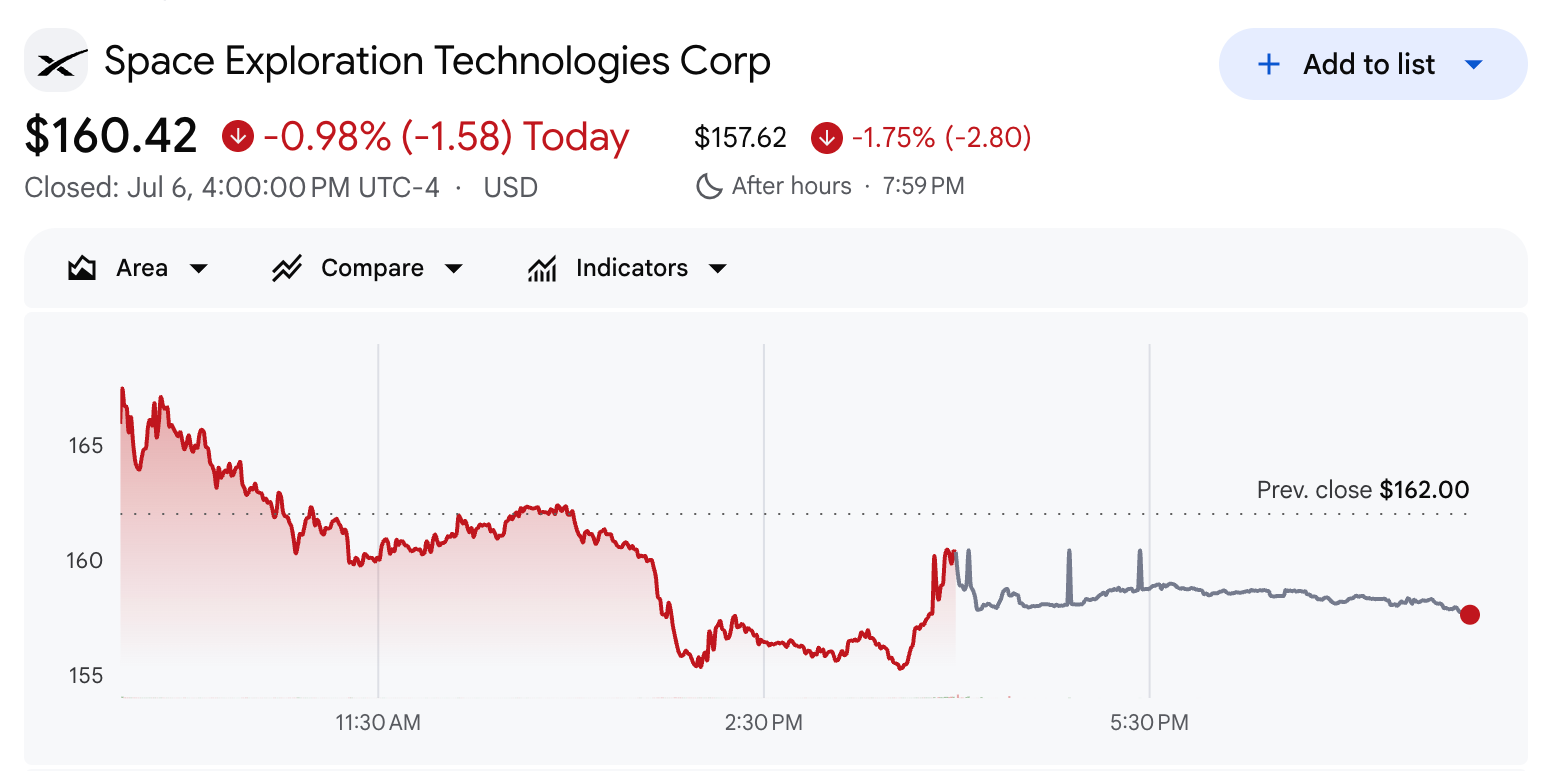
SpaceX stock (SPCX) enters the Nasdaq-100 before US markets open on Tuesday. The move lands as SPCX trades roughly 29% below its recent peak.
Nasdaq confirmed on June 26 that SPCX would join, less than a month after its June 12 listing.
SPCX Stock Gives Back Its Post-IPO Gains
Space Exploration Technologies Corp went public on June 12, reaching a valuation of nearly $2 trillion. The shares opened near $150, well above the $135 IPO price.
The initial rally carried the SPCX stock to an all-time high of $225.64. However, the stock has since retreated sharply.
SPCX has fallen roughly 29% over the past few weeks. The stock closed at $160.42 on Monday, down -0.98%.

What the Inclusion Means for SPCX
Index-tracking funds must buy SPCX to match the benchmark. That demand can lift a stock, though the effect depends on its weight.
Follow us on X to get the latest news as it happens
JPMorgan estimates SpaceX will carry about a 1.3% weight, ranking near 21st, behind names like Nvidia, Walmart, Intel, and Tesla.
“But the smaller the percentage weighting within the index that any given constituent holds, the less stock anybody trying to track that index is going to have,” Mike Khouw, chief strategist at OpenInterest.PRO, told CNBC. “Make no mistake, this is still very high volatility.”
Volatility also remains a concern. JJ Kinahan, senior vice president at Cboe, urged caution over near-term swings.
“We know volatility is high. There’s a sense volatility may increase. Are you comfortable with a $20 expected move over the next 11 days?” he said.
Meanwhile, expiring lockups could work against the buying. Insider restrictions lift in tranches between 70 and 135 days after the June 12 IPO. Shares held by Elon Musk and other large backers stay locked for 366 days.
Susquehanna analyst Charles Minervino called the schedule a near-term overhang for the stock, since fresh supply may hit just as index demand builds. The next sessions will test whether index buying can offset that overhang.
Subscribe to our YouTube channel to watch leaders and journalists provide expert insights
The post SpaceX Joins Nasdaq-100 Tuesday as SPCX Drops Roughly 29% appeared first on BeInCrypto.
Legal questions over which federal department can lawfully manage a national crypto trove have complicated President Donald Trump’s Strategic Bitcoin Reserve, more than a year after he ordered its creation.
Trump directed the reserve into existence last year as part of his pledge to make the United States “crypto capital of the world.” The plan has since run into a structural problem.
Which Agency Can Legally Hold America’s Bitcoin Remains Unresolved
The order intended the reserve to sit inside the Treasury Department. Bitcoin (BTC) would come from federal asset seizures. The order also empowered the Treasury and Commerce secretaries to design budget-neutral ways to buy more Bitcoin, provided the purchases cost American taxpayers nothing.
Concerns then surfaced over whether Treasury could legally manage the assets, Bloomberg reported, citing people familiar with the matter. Housing the reserve inside the Commerce Department is now one option.
Another open question is whether Bitcoin can be held indefinitely, as the order intended, given its price swings.
Follow us on X to get the latest news as it happens
The Justice Department’s Office of Legal Counsel is working with both departments to “determine legally available options to accomplish the president’s policy of establishing a strategic Bitcoin reserve.”
White House spokesperson Liz Huston addressed the matter in a statement shared with BeInCrypto. She said the administration was still working out the right setup for the reserve.
“President Trump campaigned on a vision of cementing America as the global capital of cryptocurrency and other cutting-edge technologies,” Huston said. “To deliver on the president’s vision, the Trump administration continues to evaluate the best structure for a Strategic Bitcoin Reserve and U.S. Digital Asset Stockpile.”
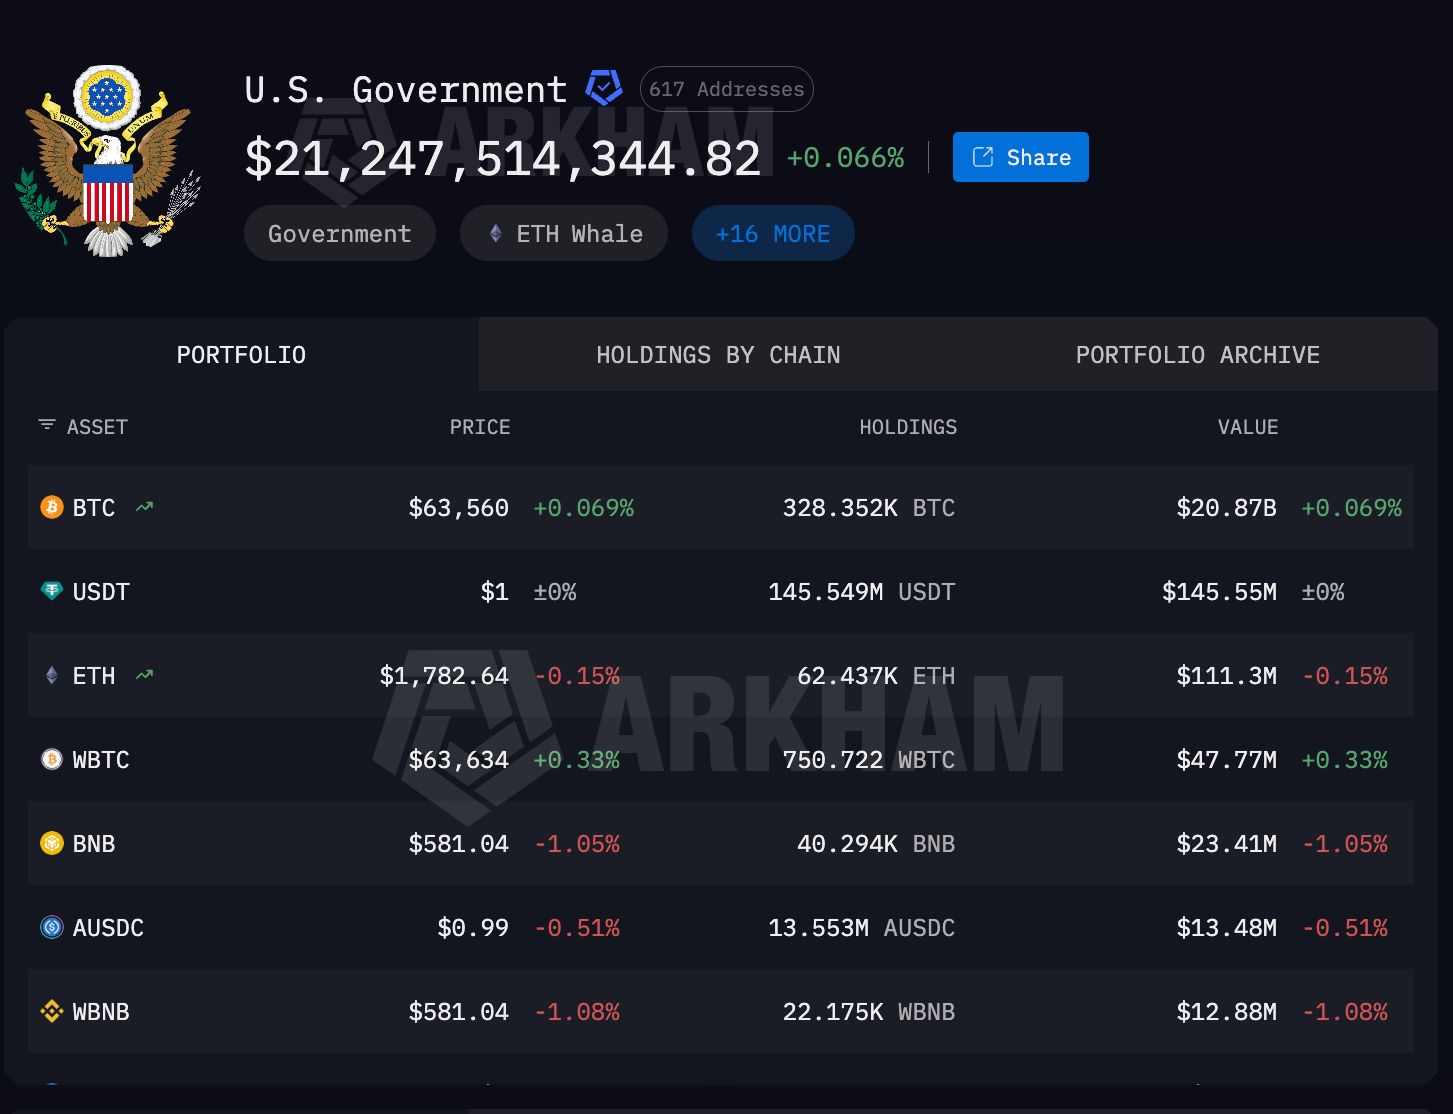
The US government ranks among the largest holders of Bitcoin worldwide. Its holdings exceed $20 billion at current prices, according to Arkham Intelligence.

How the administration resolves the authority question will determine whether one of its signature crypto commitments takes shape or stays on paper.
Subscribe to our YouTube channel to watch leaders and journalists provide expert insights
The post Whose Bitcoin Is It? The Legal Fight Stalling Trump’s $20 Billion Reserve appeared first on BeInCrypto.


Naver Financial has postponed the completion of its all-stock share swap with Dunamu for a second time, extending the closing date to Dec. 31 as regulatory approvals remain pending.
Summary
- Naver Financial and Dunamu have delayed their planned share swap for a second time, with completion now expected on Dec. 31.
- The deal remains subject to multiple regulatory approvals and could face further delays or cancellation if those processes are not completed.
- Dunamu said South Korea’s proposed Digital Asset Basic Act could still influence the structure or outcome of the transaction.
According to a regulatory filing disclosed by Dunamu, the planned comprehensive share exchange with Naver Financial has been rescheduled from Sept. 30 to Dec. 31, following an earlier postponement that moved the timeline from June 30 to September.
Share swap awaits regulatory approvals
The filing kept the exchange ratio unchanged at 2.5422618 Naver Financial shares for every one Dunamu share. It also repeated that completion of the transaction depends on approvals from South Korea’s Fair Trade Commission, clearance for changes in major shareholders under the Credit Information Act, and notifications required under the Act on Reporting and Use of Specific Financial Transaction Information.
Dunamu said in the filing that delays in those approval processes could push the schedule back further or even prevent the share exchange from being completed. The company also noted that ongoing discussions around South Korea’s proposed Digital Asset Basic Act could affect the transaction depending on the final form of the legislation once it is enacted and implemented.
The latest delay comes after Naver Financial previously postponed the transaction in March, when it moved the expected completion date from late June to Sept. 30 while citing regulatory approval procedures and legal developments.
At the time, the company said the deal remained subject to several government approvals and could face additional delays or cancellation depending on the outcome of those reviews.
Merger continues under regulatory scrutiny
Regulatory oversight has also intensified since the transaction was first announced. In April, South Korea’s Financial Supervisory Service ordered Dunamu to correct omissions in its disclosure related to the merger after identifying missing or inaccurate information concerning future corporate restructuring plans and other matters important to investors.
The regulator’s review came as lawmakers continued debating the Digital Asset Basic Act, with local reports indicating that proposed limits on major shareholders of virtual asset exchanges could affect Naver Financial’s plan to acquire full ownership of Dunamu. Dunamu has previously stated that it intends to proceed with the transaction despite the legislative uncertainty.
The all-stock deal, confirmed in late 2024, values Dunamu at around $10 billion and is expected to bring the operator of Upbit under Naver Financial. The companies have also outlined plans to cooperate on digital asset services, including the development of the Silk Pocket stablecoin wallet alongside blockchain investment firm Hashed and the Busan Digital Exchange.


U.S. spot bitcoin ETFs pulled in $265.69 million on Monday, the largest daily inflow in over a month and the second in three sessions after July 2 broke a long run of outflows, per SoSoValue data. Ether ETFs added $20.66 million the same day, led by BlackRock’s ETHA at $23.29 million.
BlackRock’s IBIT absorbed $209.40 million of the bitcoin total, with ARKB taking in $32.98 million and Grayscale’s mini BTC fund adding $42.25 million. GBTC shed $44.45 million, the only fund in the red.
The daily turn has not fixed the weekly picture yet. Spot bitcoin ETFs still lost a net $526.6 million over the shortened holiday week, an eighth straight week of negative flows. Ether ETFs lost $13.7 million on the week.
Total bitcoin ETF assets climbed back to $77.32 billion from a June 30 low of $70.95 billion, helped by both the price recovery and the returning bid. Bitcoin traded near $63,200 as the data landed, per CoinDesk data.
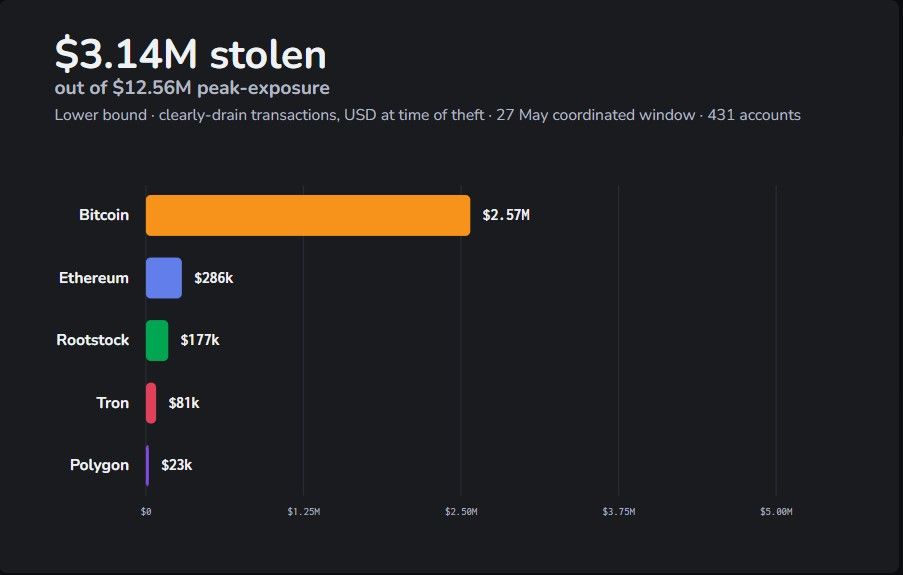
Coinspect has disclosed the Ill Bloom vulnerability, a crypto wallet flaw that created weak recovery phrases on multiple blockchains. Attackers exploited the weakness on May 27, draining 431 wallets for about $3.1 million.
Coinspect traced the flaw to an insecure pseudorandom number generator used during wallet creation. The weakness spans multiple chains, including Bitcoin (BTC), Ethereum (ETH), and Solana (SOL).
How the Ill Bloom Vulnerability Breaks Crypto Wallets
According to Coinspect, the faulty generator produced recovery phrases with far less cryptographic strength than intended. As a result, attackers can regenerate the whole range of possible phrases and sweep any funded address.
The researchers reproduced the attack end-to-end. They derived every address the weak phrases could produce and matched them against funded wallets on public blockchains. Affected addresses date back to 2018, and most trace to lesser-known mobile crypto wallets.
Users are asked to review their historical wallet addresses. Hardware wallet users remain unaffected. Earlier this year, Binance issued a critical iOS alert for mobile users.
Coordinated May 27 Sweep Drained 431 Wallets
According to Coinspect’s analysis, the monitored set contains 2,114 funded addresses across Bitcoin, Ethereum, Tron, Rootstock, and Polygon. On May 27, drained accounts sent their balances to a handful of shared collector addresses within hours.
Bitcoin absorbed the biggest hit at $2.57 million, and one account alone lost over $1.1 million. Historically, the exposed set held up to $12.56 million at its April 2022 peak.
The firm calls the $3.1 million figure a lower bound because new affected accounts keep surfacing. The sweep also adds to heavy crypto theft losses this year, which topped $400 million in January alone.
Compromised keys drain value fast, as the recent private key breach at Humanity Protocol showed. Notably, earlier incidents such as Milk Sad stemmed from the same class of weak randomness.

How Crypto Users Can Protect Their Funds
Coinspect published a checker that compares public addresses against the known vulnerable dataset. However, a negative result does not guarantee safety because the dataset remains incomplete.
Matched users should create a brand-new crypto wallet and migrate funds to its addresses. In contrast, importing the old phrase into another app leaves the money exposed.
Meanwhile, scammers exploit scares like this one, as a recent fake airdrop drain on Hyperliquid showed. Coinspect stressed it will never request secrets.
“We will never ask for seed phrases, private keys, signatures, or approvals, or ask users to send funds to ‘recover’ or protect a wallet”
Wallet vendors keep pushing safer defaults, including Ethereum’s new Clear Signing standard. Still, the coming days should reveal which apps generated the weak phrases. Until then, moving crypto off flagged addresses remains the only reliable fix.
The post Ill Bloom Vulnerability Drains $3.1 Million From Crypto Wallets: Are You Exposed? appeared first on BeInCrypto.
Strategy’s $216 million Bitcoin sale on Monday should be seen as a positive development for the price of Bitcoin and as a move that renews confidence in STRC, according to analysts.
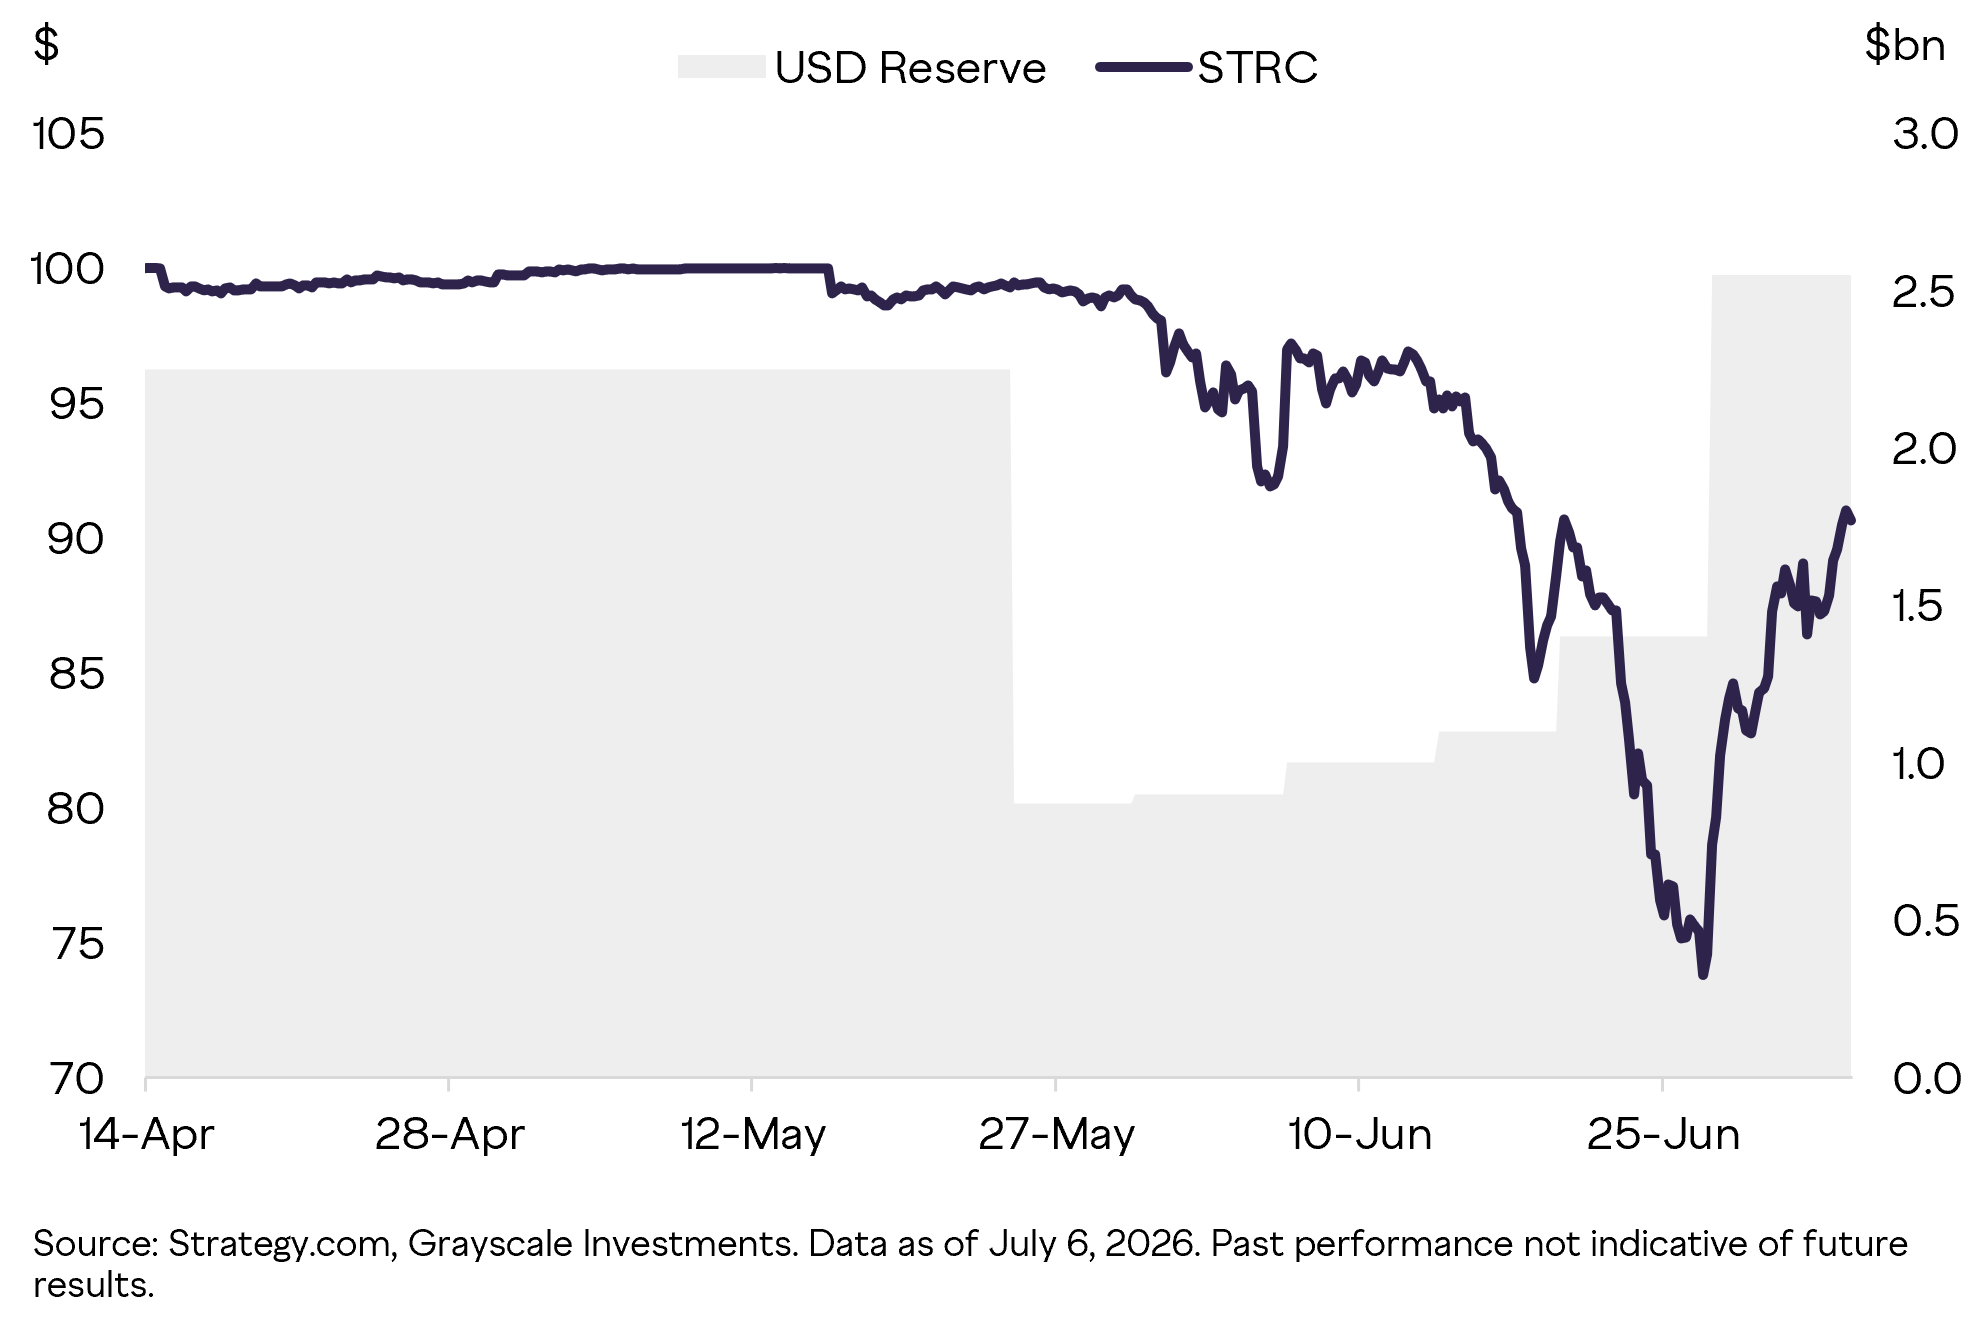
The sale of 3,588 BTC to fund preferred stock dividend payments and replenish cash has boosted Strategy’s dollar reserves to cover 17 months of dividend payments. “The rebound in STRC suggests investors are responding positively to this decision,” Grayscale Research said Monday.
Andri Fauzan Adziima, research lead at Bitrue Research Institute, told Cointelegraph that Strategy’s recent sale was a “smart, stabilizing move that actually strengthens the setup for Bitcoin.”
Zach Pandl, Grayscale’s head of research, said Strategy’s actions should “restore market confidence” in its financing structure, and may help Bitcoin’s price “find a more durable bottom,” as it relieves the pressure of further BTC sales from Saylor’s company.
Strategy’s announcement that it sold Bitcoin caused the asset to drop 2.4% in a matter of hours. However, both Bitcoin and Strategy’s yield-bearing STRC product rebounded soon after, suggesting that investor concern was short-lived.
Restoring market confidence
There is nothing wrong with Strategy’s balance sheet, and the company clearly has sufficient financial resources to service its debt and dividend obligations, Pandl said.
“Nevertheless, shifting market conditions created uncertainty about how Strategy would balance competing priorities.”
Related: Strategy will be ‘less important’ in Bitcoin after STRC incident: Bitwise
Strategy clarified in late June that it would issue shares and sell Bitcoin as needed to maintain sufficient US dollar reserves to cover its dividend obligations.
Strategy’s dollar reserves now total $2.55 billion, or the equivalent of about 17 months of dividend cover. Meanwhile, the rebound in the price of STRC — which topped $91 for the first time in three weeks on Monday — “suggests investors are now more confident about the instrument,” Pandl said.
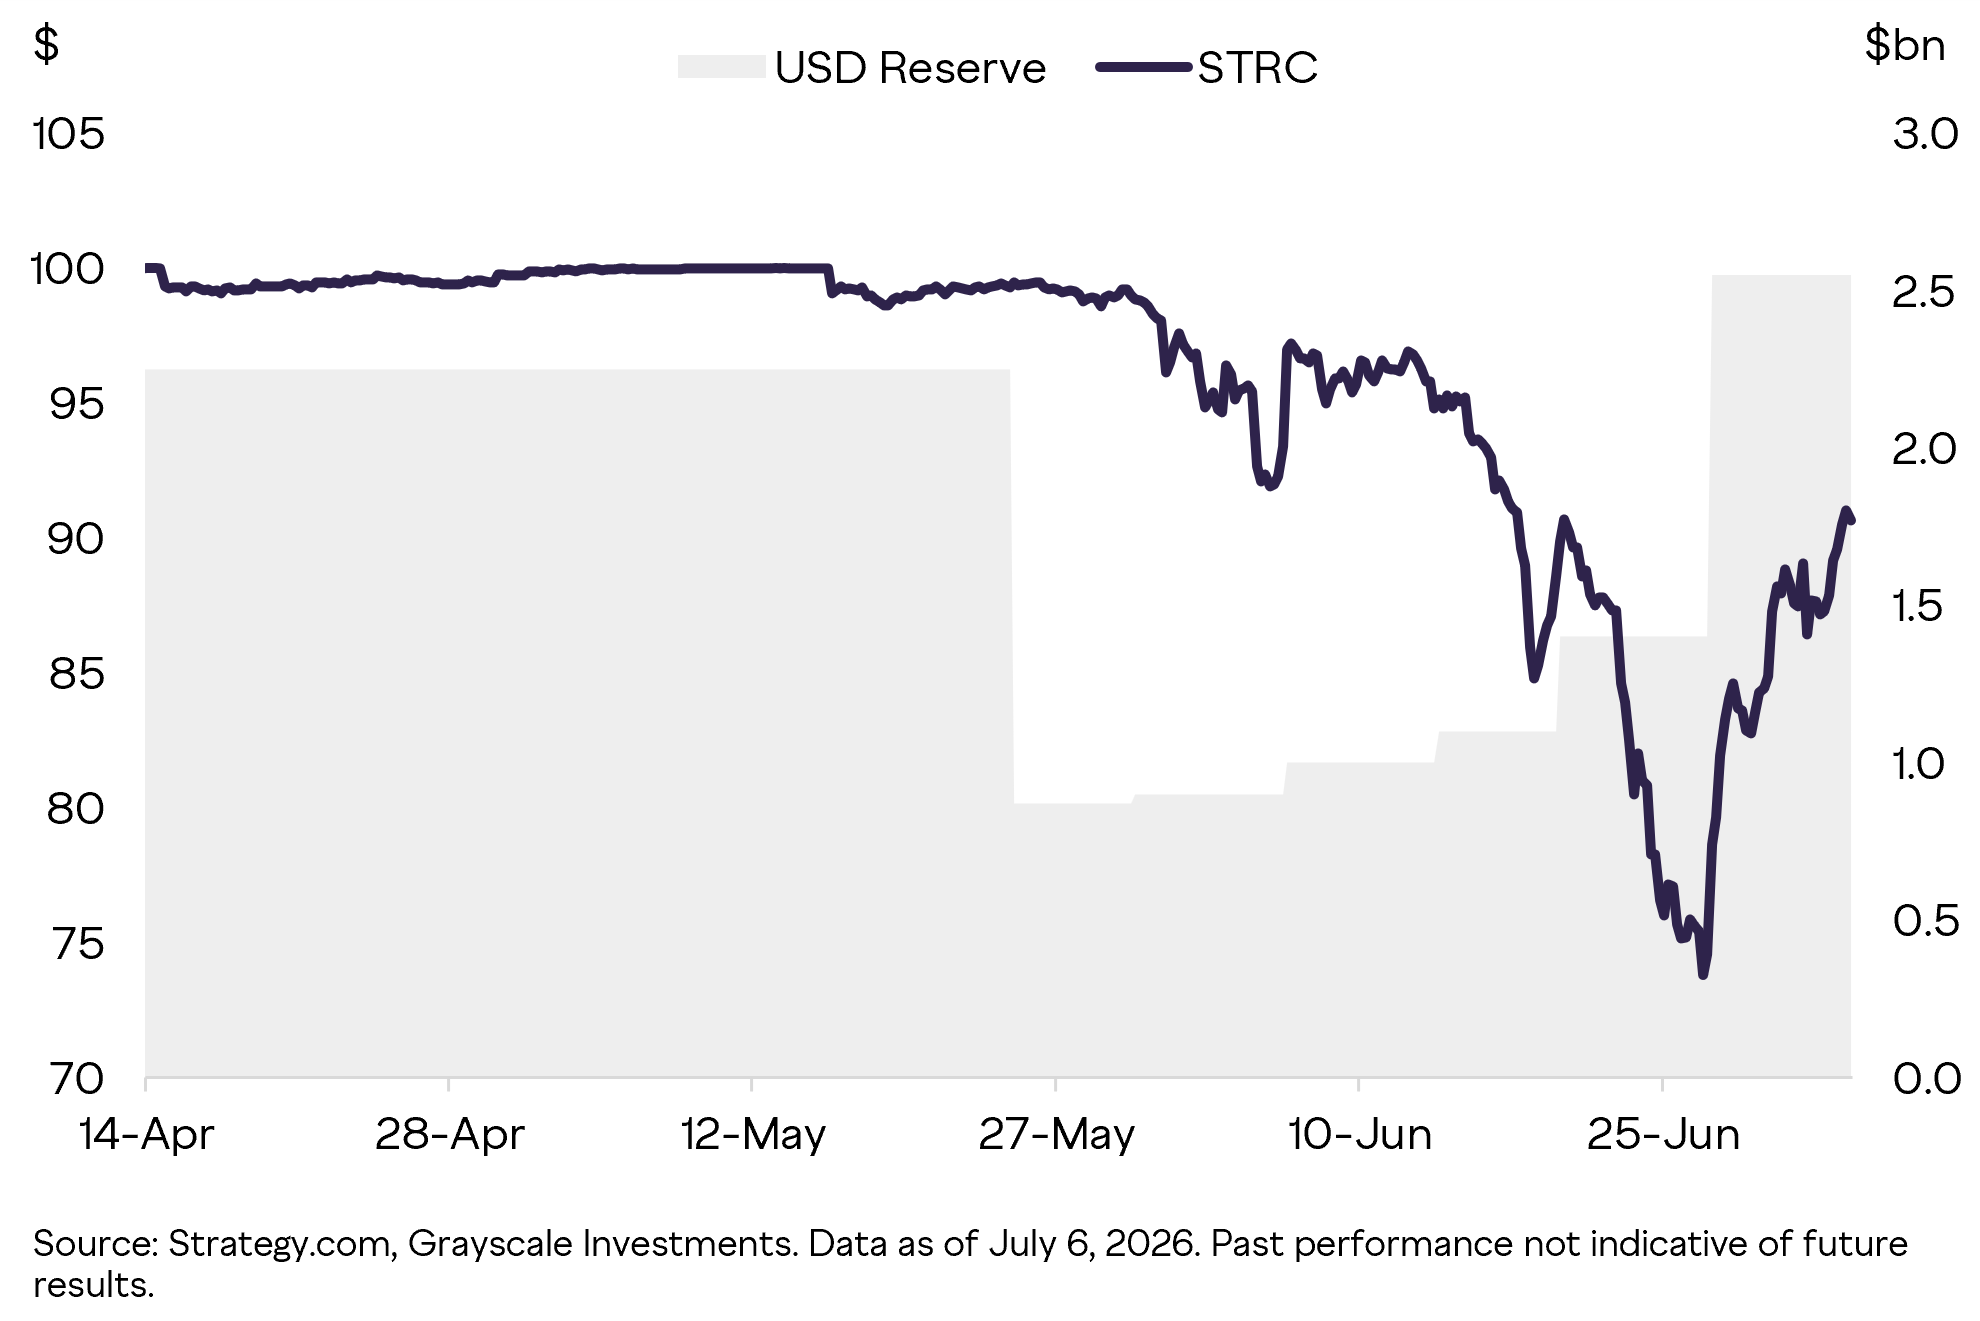
Bitcoin sales funded Strategy’s USD Reserve and bolstered investor confidence. Source: Grayscale
The sale reduces forced-selling risks
“By using the proceeds to pad cash reserves for roughly 17 months of STRC dividends, they’ve cut near-term financing pressure and overhang, which helped spark Bitcoin’s quick recovery above $64k while lifting STRC near $90,” Adziima said.
“In my view, this reduces forced-selling risks, rebuilds confidence in their structure and paves the way for a more durable bottom as other buyers step in, prudent balance-sheet management rather than any kind of capitulation.”
BTC recovered to reach $64,400 in late trading on Monday, but had dipped to $63,120 at the time of writing.
Magazine: AI is banking the unbanked in Africa… faster than crypto

Bitcoin’s dip from just under $64,000 to around $62,000 Monday was not a slow grind lower—it was a fast unwind driven by derivatives positioning, then amplified by a new catalyst from Strategy’s latest regulatory disclosure.
According to Cointelegraph’s coverage of the filing, the move was linked to Strategy’s largest reported Bitcoin sale of 3,588 BTC. While spot demand was only slightly negative during Sunday’s upswing, Monday’s turn showed how quickly leverage can shift when corporate treasury supply hits the tape.
Key takeaways
- Sunday’s rally was largely futures-led, with net futures buying of roughly $415 million, leaving price vulnerable to forced unwind.
- Strategy’s SEC disclosure appears to have triggered Monday’s unwind, with four-hour net futures selling jumping to about $456 million.
- Liquidations ran in both directions during the volatility, totaling roughly $42 million in long liquidations and $49 million in short liquidations.
- Spot buying returned on Monday afternoon—after days of limited spot participation—suggesting a more balanced push-pull between spot and derivatives.
- With open futures positions near $20.6 billion and funding staying positive, the market remains leveraged, but the setup is fragile if new macro headlines or selling pressure extend.
From futures momentum to leverage unwind
Sunday’s move toward $64,000 was dominated by derivatives flows. The session saw net futures buying of roughly $415 million, including a concentrated four-hour window of about $687 million. That burst reportedly force-closed around $33 million in bets against Bitcoin, highlighting how rapidly directional exposure built.
At the same time, spot flows were slightly negative. That matters because when price rises mainly on paper positions rather than cash demand, the move can reverse quickly if traders reduce risk—especially when leverage is crowded and stops or margin calls force synchronized selling.
Monday’s selloff accelerated once the Strategy story landed. The SEC disclosure described the company selling BTC to fund dividend payments, with additional sell capacity still available afterward. As that information reached traders, the derivatives market shifted from buying pressure to selling pressure within hours.
Strategy’s sale: what the filing implies for flow expectations
The filing referenced in Cointelegraph’s reporting described Strategy selling 3,588 BTC for $216 million to fund dividend payments. The disclosure also indicated that an additional $1.25 billion of sale capacity remained unused.
For traders, the near-term question is straightforward: was Monday’s move a one-off repricing of known corporate supply, or the start of a broader selling pattern? The market’s reaction suggests traders treated the disclosure as actionable, at least for positioning purposes.
Immediately after the news hit, futures flows swung to approximately $456 million of net selling in a four-hour window. Both sides were liquidated as price moved sharply, with around $42 million of bullish positions wiped out alongside about $49 million of bearish positions—an outcome consistent with choppy, momentum-driven trading rather than a clean trend.
Funding stays positive, but fragility is rising
Despite the whipsaw, Bitcoin’s funding rate reportedly remained in positive territory for more than a week, including during Monday’s decline. Positive funding typically indicates that leveraged longs are paying shorts—often interpreted as “optimism” in the derivatives market.
That said, the overall structure matters more than a single funding reading. With roughly $20.6 billion in open futures positions, the market still carries significant leverage. In this environment, even modest catalysts can produce outsized price swings if many traders are already crowded on the same side or if momentum traders are forced to exit quickly.
Open interest figures showed the scale of exposure did not disappear—meaning the market may still be susceptible to another round of repricing should catalysts stack up.
One notable difference between Sunday and Monday is the market’s later composition: Monday afternoon recovery included net futures buying of about $568 million paired with spot buying of roughly $143 million. That combination—spot participation joining derivatives—helps explain why the rebound looked less like a pure futures-led bounce and more like a market trying to find support with cash demand.
What to watch next: unused capacity and the Fed’s minutes
Beyond Strategy, the key uncertainty is whether the unused $1.25 billion authorization becomes a lingering overhang for rallies. If traders believe additional corporate sales are likely, rallies can struggle to sustain even when funding remains positive and spot buying appears to return.
On the macro side, attention turns to the Federal Reserve’s minutes from the June meeting. Cointelegraph notes markets are currently pricing a 75.6% chance that rates will remain at 3.50%-3.75% in July. Still, any hawkish language in the minutes could test crowded leveraged long positions.
The article highlights potential pressure zones around $62,300 to $62,800 above current price action, and downside levels around $61,000 and $59,500 if momentum shifts again. In a market where funding has stayed positive and open interest remains elevated, levels tied to forced unwind dynamics can matter as much as long-term valuation arguments.
For now, traders should focus on whether Monday’s spot reappearance persists and whether Strategy’s remaining sale authorization translates into further market-selling expectations. With leverage still embedded in open futures positions and upcoming macro catalysts in play, Bitcoin’s next move may depend less on narrative and more on whether cash buyers can consistently offset derivatives-induced volatility.
Key Highlights
- XRP gained approximately 8% over a seven-day period following a rebound from $1.03
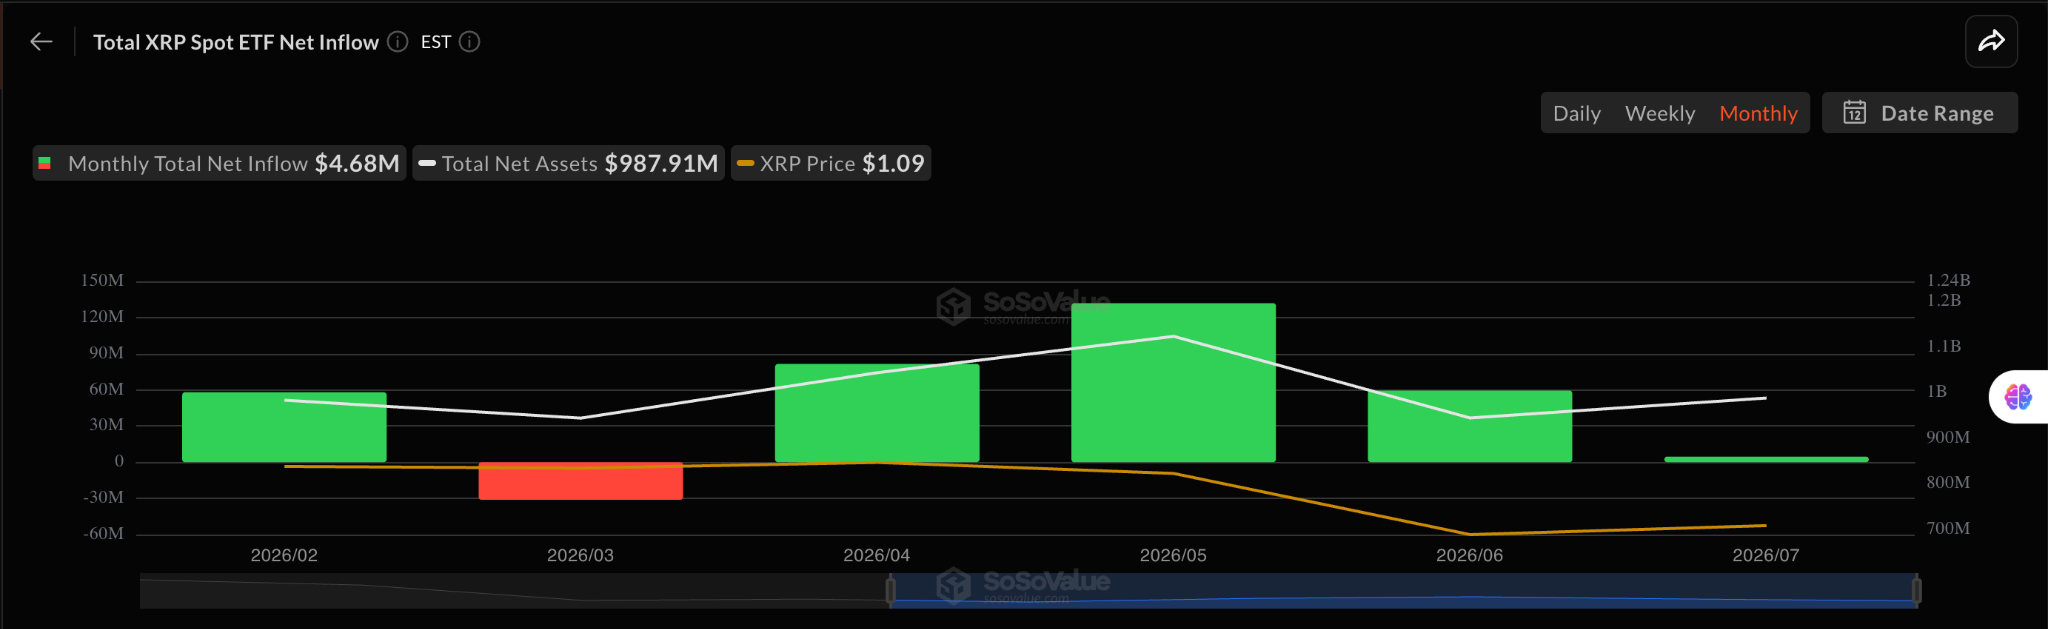
- Spot ETF net inflows decreased by 55% during June, falling from $132M to $59M
- The XRP Binance Scarcity Index reached 0.77, marking its highest reading in over 24 months
- Binance’s XRP holdings have declined 20% since November 2024, currently sitting at approximately 2.6 billion tokens
- Critical resistance level identified at $1.20, with upside target at $1.50 and downside risk at $0.80
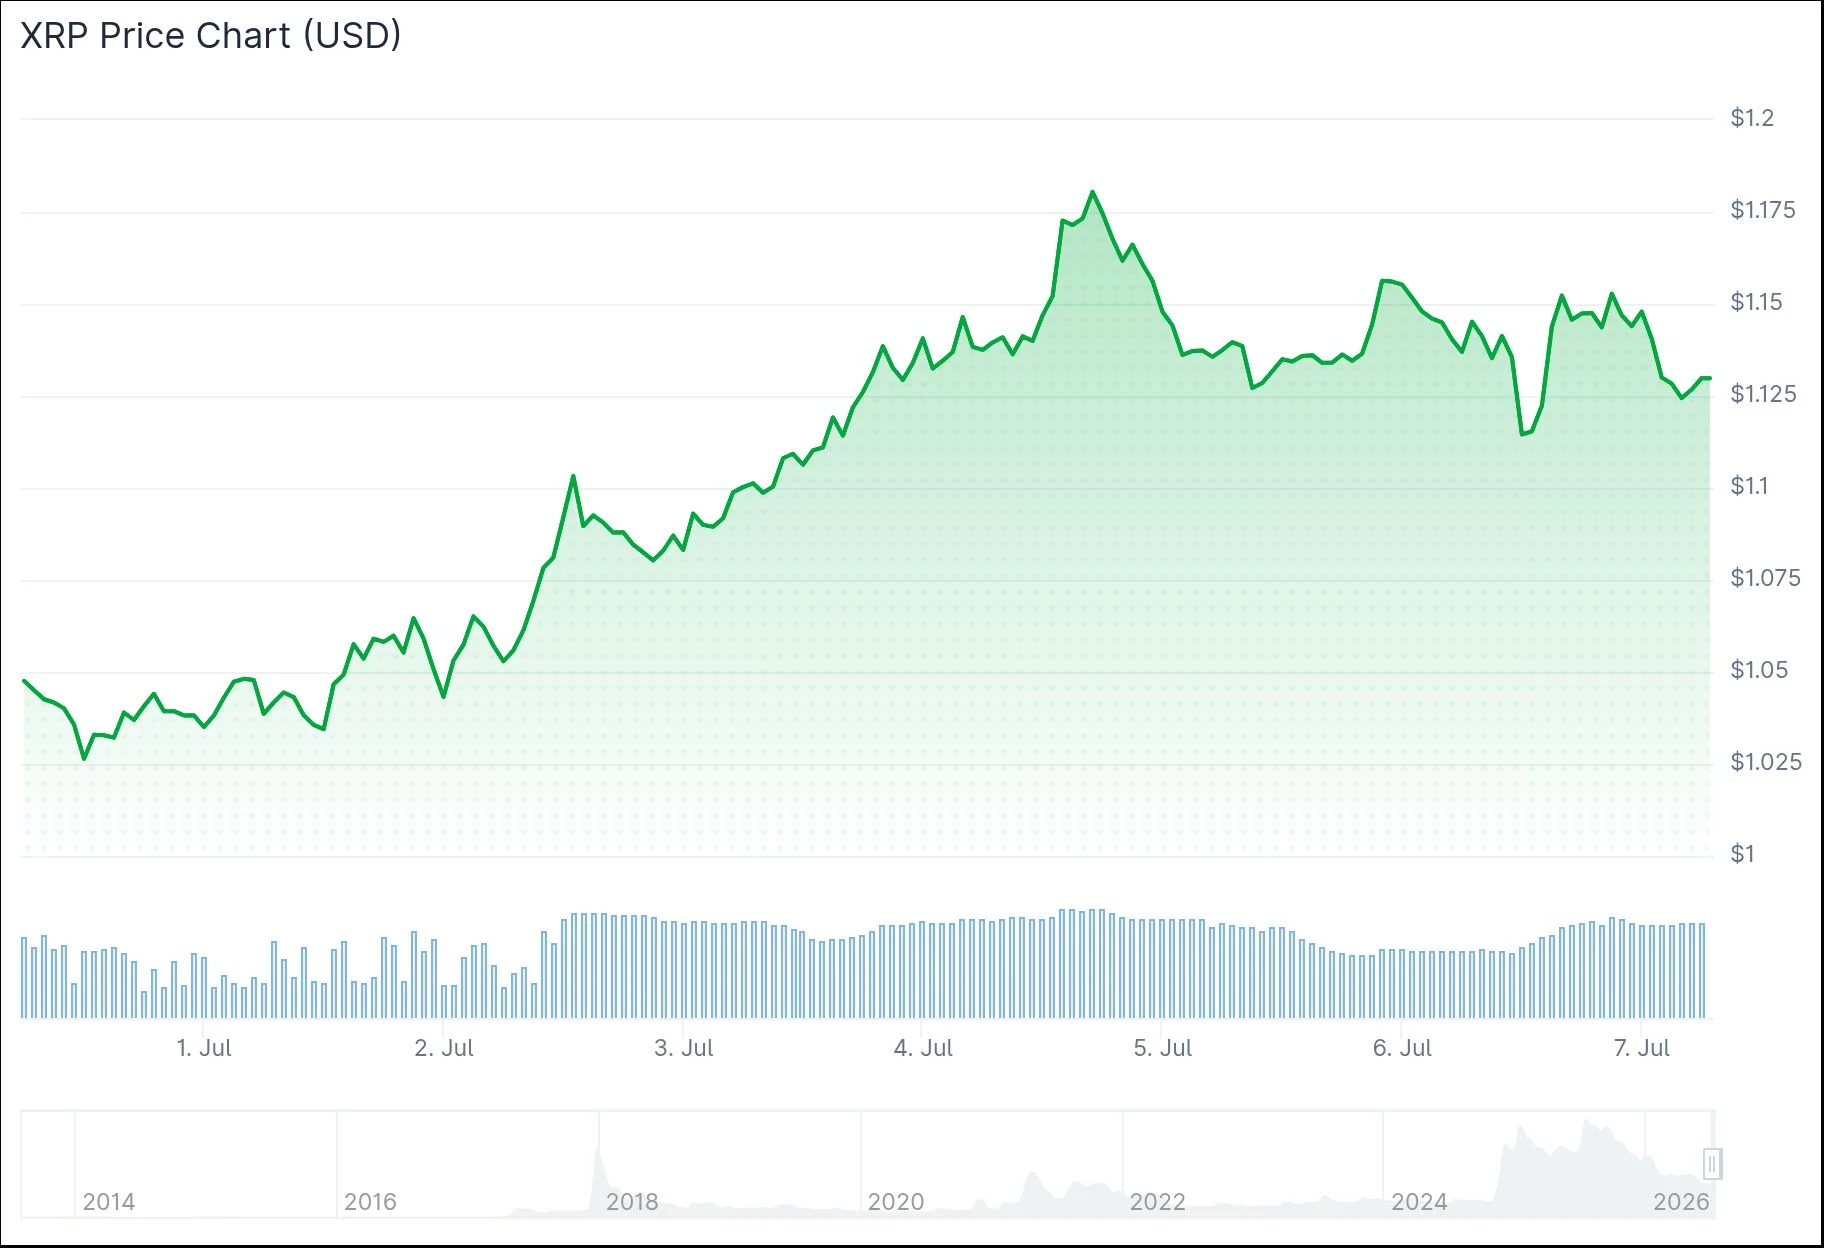
XRP has demonstrated a solid recovery over the past week, posting gains of nearly 8% after establishing support at the $1.03 level. The digital asset is currently changing hands above $1.15, successfully reclaiming a price point that served as a support threshold before the June downturn.
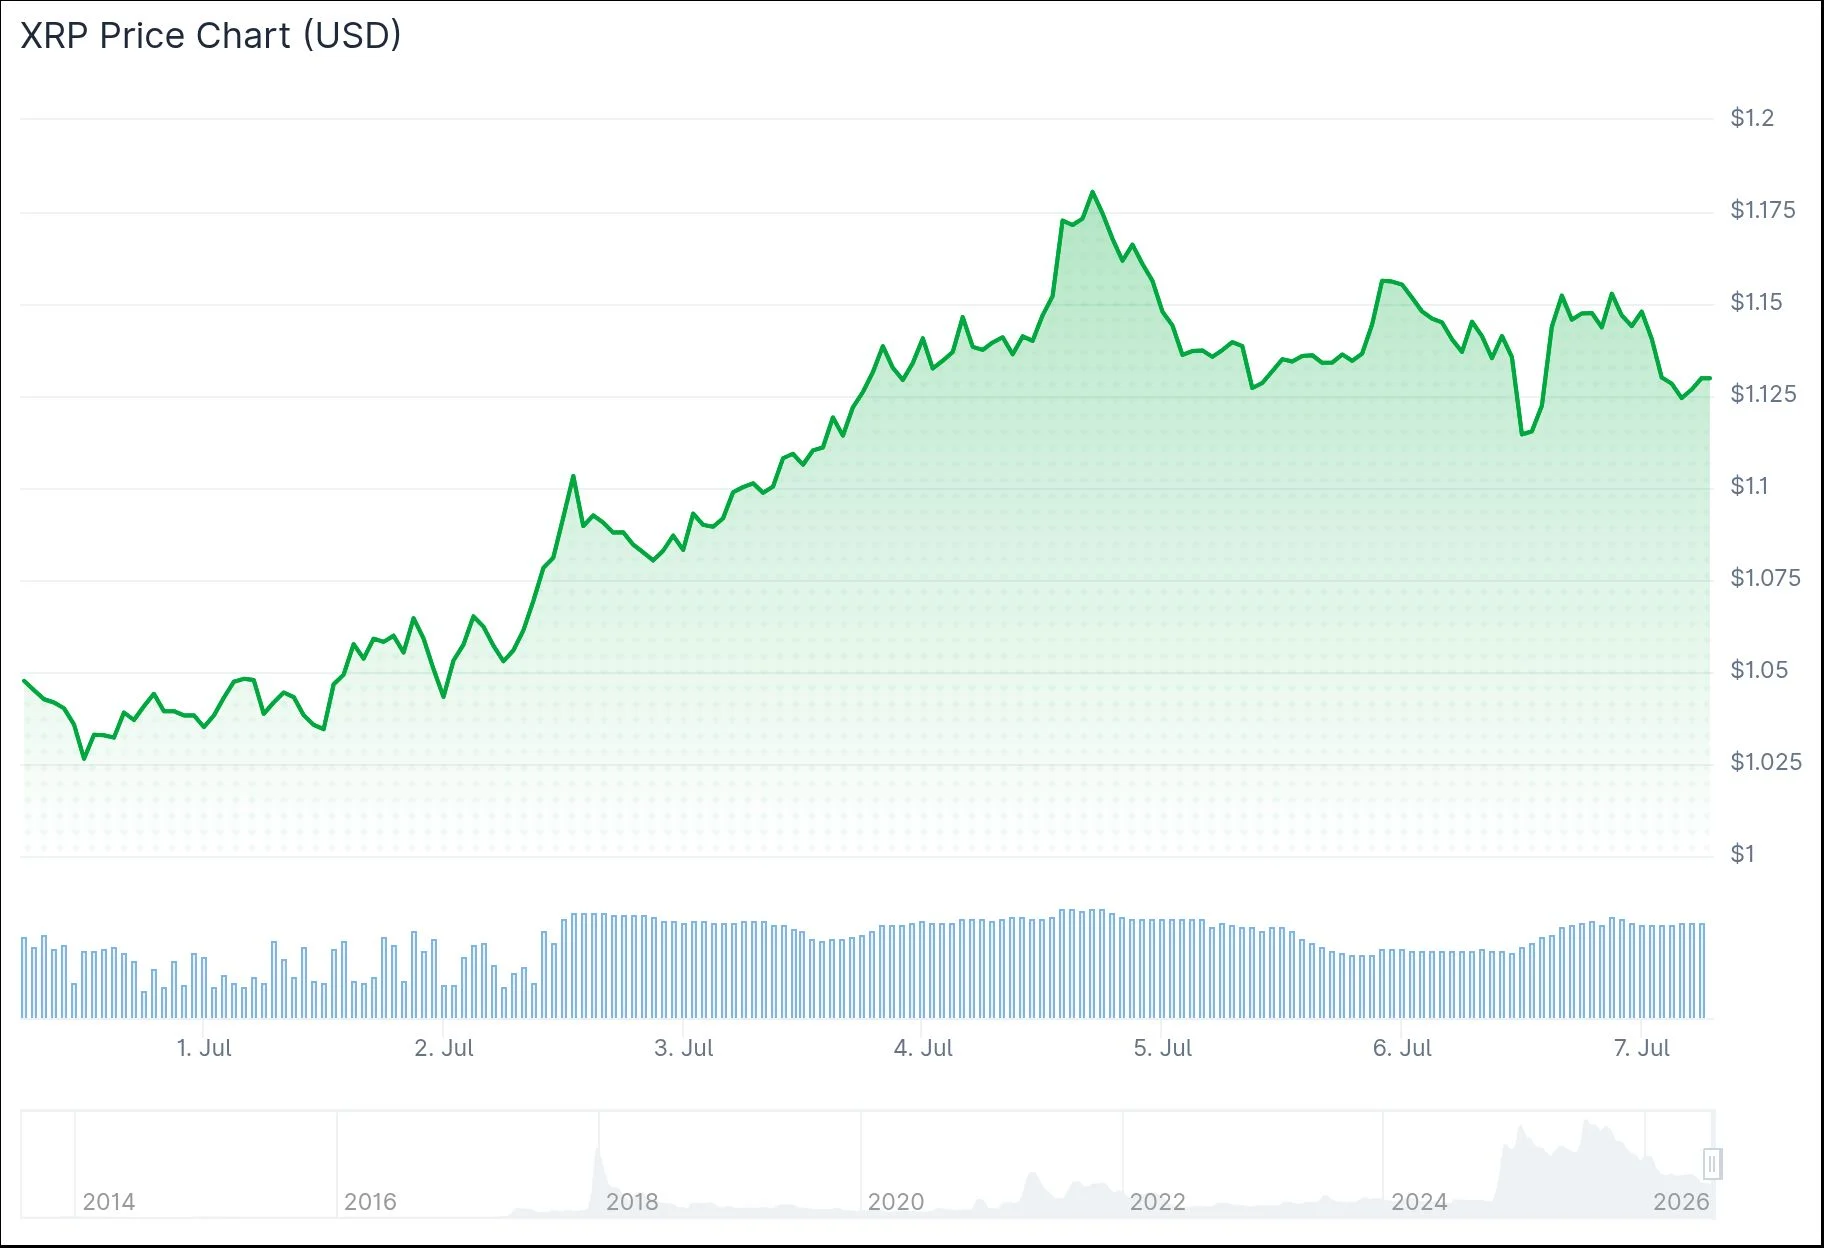
Market activity intensified significantly, with trading volume surging approximately 62% within a 24-hour window to reach $1.8 billion. Such dramatic volume increases typically indicate fresh market participation following periods of subdued trading activity.
This rebound follows a challenging June for XRP holders. The token experienced a significant decline from heights above $1.55 in February, ultimately bottoming out near the $1.00 to $1.04 range by late June—representing the most substantial holder drawdown in over a decade.
Institutional appetite, as measured through ETF flows, painted a cautious picture during this period. Net capital inflows to XRP-linked spot exchange-traded funds contracted from $132 million in May to just $59 million in June, representing a 55% month-over-month decline. Traditional finance interest appeared to wane despite the token’s price compression.
Large Holders Accumulate as Exchange Inventory Tightens
Blockchain metrics revealed a contrasting narrative within the cryptocurrency ecosystem. Daily active addresses on the XRP Ledger surged to levels not witnessed since February, as reported by Santiment. During that February timeframe, XRP traded within a $1.47 to $1.54 range.
Concurrently, the XRP Binance Scarcity Index climbed to 0.77 this week, representing its most elevated reading in more than two years, based on analysis from CryptoQuant researcher ArabxChain. This indicator quantifies XRP’s availability on Binance compared to historical benchmarks.

Binance’s XRP inventory has contracted by approximately 20% since November 2024, declining from roughly 3.27 billion tokens to around 2.6 billion currently. Holdings specifically dropped from about 2.8 billion in May to 2.6 billion by early July, coinciding precisely with the scarcity index’s breakout to new highs.
Market observers at ChartNerd highlighted this technical formation on X, describing XRP’s “3rd Retest” as a favorable entry point for position builders, characterizing it as “a gift” for chart-focused market participants.
Short Position Liquidations Contributed to Initial Rally
Futures market data from Coinglass reveals funding rates plunged into deeply negative territory between June 26 and 28, coinciding precisely with the price bottom. This concentration of short positions created conditions favorable for a squeeze.
The subsequent rally to $1.13 appears consistent with forced short covering rather than organic new demand. Funding rates have since normalized to slightly positive, suggesting a healthier positioning landscape.
Immediate resistance is located at $1.20, which previously contained the mid-June recovery attempt. A confirmed daily close above this threshold would expose the $1.35–$1.40 region, representing approximately 22% upside from current pricing.
The daily Relative Strength Index currently reads near 55, indicating additional headroom exists before overbought territory becomes a concern.
The 200-day Exponential Moving Average is positioned at $1.50, which technical analysts identify as the primary bullish objective if buying momentum persists. Conversely, a breakdown below $1.00 would negate the current recovery thesis.
XRP volume recently exceeded Bitcoin on South Korean platform Upbit, providing an interesting data point as market participants evaluate whether genuine demand is materializing.


World Cup 2026: Is Balogun the scandal that could bring down Infantino?

States seek $1.4 trillion from Meta over social media addiction trial

Ariana Grande Sparks Buzz After Recreating Viral Moment With Ex


-

 Fashion4 days ago
Weekend Open Thread: High Hopes
-

 Politics4 days ago
The House | “Reframing the debate from a binary discussion of winners and losers”: Yuan Yang reviews ‘We Are Not Machines’
-

 Fashion15 hours ago
Open Thread: What Great Books Have You Read Recently?
-
 NewsBeat2 days ago
Taylor Swift and Travis Kelce wedding staffer hilariously struggles to keep her cool while checking in megastars
-

 News Videos7 days ago
How to Build INSANE Live Financial Dashboards With Claude
-
 Crypto World6 days ago
Airdrop Registration Becomes Key Focus For Remittix As RTX Launch Updates Approach
-

 Sports6 days ago
Broncos roster: OL Ben Powers (No. 74) entering final year of contract
-

 Crypto World5 days ago
Binance stock trading tops $1B in first month after launch
-

 NewsBeat6 days ago
Presenter Caroline Flack’s brother Paul Flack dies aged 55
-

 Crypto World5 days ago
Alibaba-affiliate Ant Group enters the humanoid robot market with 12 deals
-
 Crypto World4 days ago
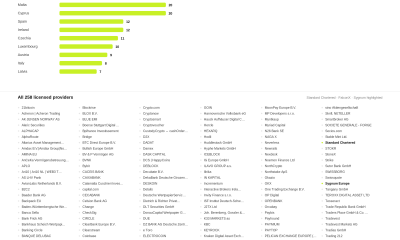
Standard Chartered Secures MiCA License as ESMA Adds 37 New Crypto Firms
-

 Crypto World2 days ago
South Africa proposes crypto tax guidance under existing rules
-

 News Videos16 hours ago
Best Time to Enter Small Caps Right Now? Another Bull Run? | Financially Free
-

 Business5 days ago
Meta Platforms Stock Jumps 7% Today as Bloomberg Reports Company Plans to Enter the Cloud Business
-
 NewsBeat5 days ago
New exhibition reflects five decades of movement between island of Ireland and GB
-

 Tech2 days ago
Lenovo laptops are now shipping with YMTC SSDs, a sign of Chinese NAND entering the mainstream
-

 Business4 days ago
What a 10 Percent Drop Means for Buyers, Sellers and Renters
-

 Crypto World4 days ago
Binance Re-Enters Philippines As EU MiCA Rules Restrict Access
-

 News Videos19 hours ago
Avoid entering in FOMO #bitcoin #cryptocurrency #trading #scalping
-

 News Videos4 hours ago
Whats Hidden Inside This Cash Register? #treasure #reselling #money
You must be logged in to post a comment Login