

Crypto World
Drake Eyes $5 Million Crypto Payout in Spain Vs Argentina World Cup Final

Canadian singer Drake has wagered $1.5 million USDT on Argentina to beat Spain in regulation time at Sunday’s World Cup final. A win would pay the rapper $5,175,000.
He placed the bet through the crypto gambling platform Stake and announced it on Instagram. In contrast, Spain enters the World Cup final at MetLife Stadium as the favorite.
A World Cup Curse Looms Over the Bet
Soccer fans have already invoked the Drake Curse, the belief that teams he backs publicly falter at the worst moment. A similar regulation-time bet cost Drake his last World Cup payout, even though Argentina won it in extra time. The wager only pays out if Argentina wins within 90 minutes, excluding extra time and penalties.
The rapper’s crypto ties run deeper than betting slips. He referenced Bitcoin (BTC) on his new Iceman album this year, calling himself a “crypto big-timer.” This bet, however, relies entirely on a stablecoin rather than a volatile token.
Kalshi Odds Favor Spain in Regulation
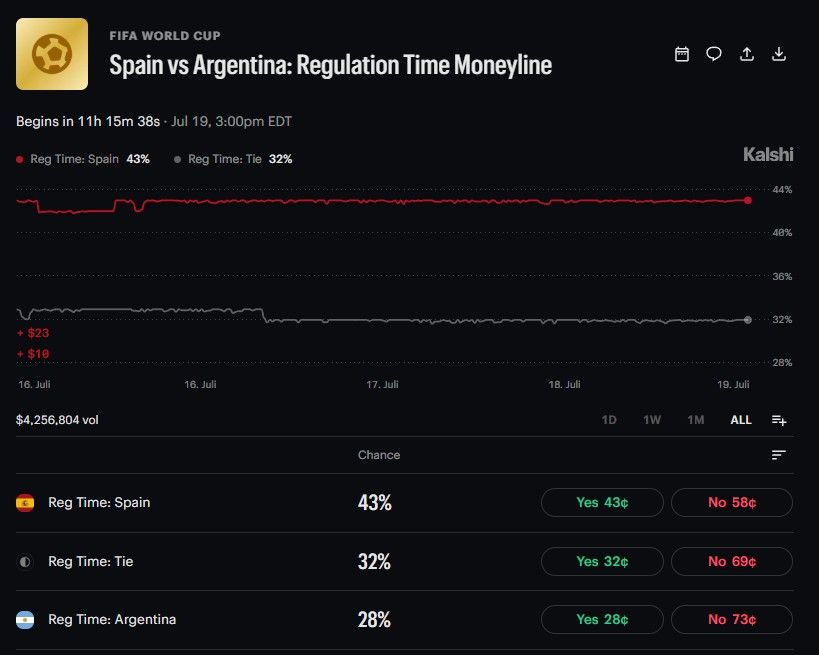
Kalshi’s regulation-time market prices Spain’s win probability at 43%, compared with 28% for Argentina and 32% for a tie. Meanwhile, that gap mirrors how World Cup betting markets have leaned toward Europe throughout the knockout rounds. The Kalshi contract for Sunday’s World Cup game had already logged more than $2.8 million in trading volume.
Prediction markets have grown into a major venue for World Cup wagering this year. Kalshi recently expanded its World Cup prediction hub through a partnership with ADI Predictstreet. Still, Drake’s wager sits well outside that data-driven crowd.

A Historic World Cup Night Beyond the Bet
Tether chief executive Paolo Ardoino shared news of the wager on X, adding an Argentine flag and a heart emoji. Celebrity wagers have become a running theme this World Cup, following a similar betting wave around Taylor Swift’s rumored wedding.
The final also marks a first off the pitch. FIFA will award custom championship rings to World Cup winners for the first time, a tradition borrowed from American sports. Interest has spiked around other World Cup markets, including bets on the halftime show lineup.
Kickoff is set for 3 p.m. ET at MetLife Stadium in New Jersey. If Messi and Argentina deliver in regulation, Drake finally breaks even on a wager that has haunted him for years.
The post Drake Eyes $5 Million Crypto Payout in Spain Vs Argentina World Cup Final appeared first on BeInCrypto.

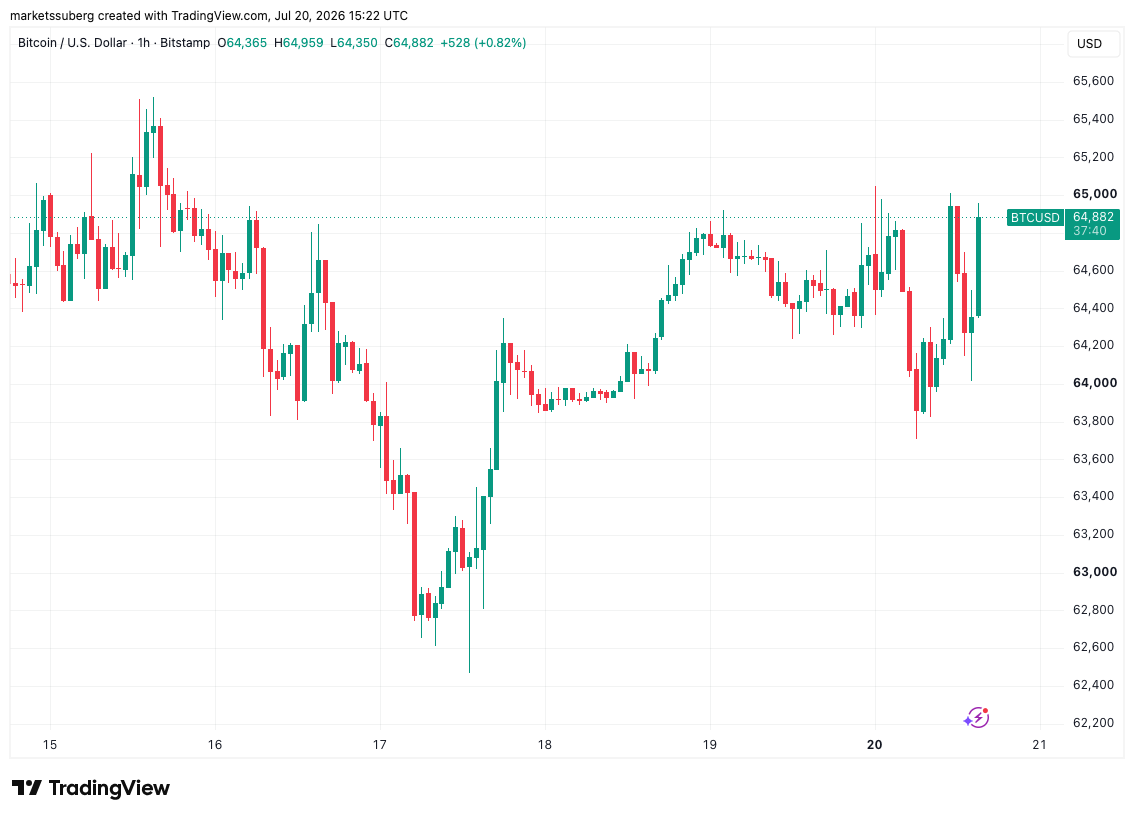
Traders balked on Bitcoin (BTC) at $65,000 on Monday as crypto and risk-assets remained under pressure.
Key points:
- Bitcoin staged several unsuccessful attempts to break and hold $65,000.
- US stocks face pressure from both the Iran war and an ongoing institutional tech sell-off.
- Bitcoin traders stay positive on the odds of BTC/USD heading closer to $70,000 next.
Crypto stocks face “record pace” of US tech-stock selling
Data from TradingView showed BTC price volatility returning around Monday’s Wall Street open.
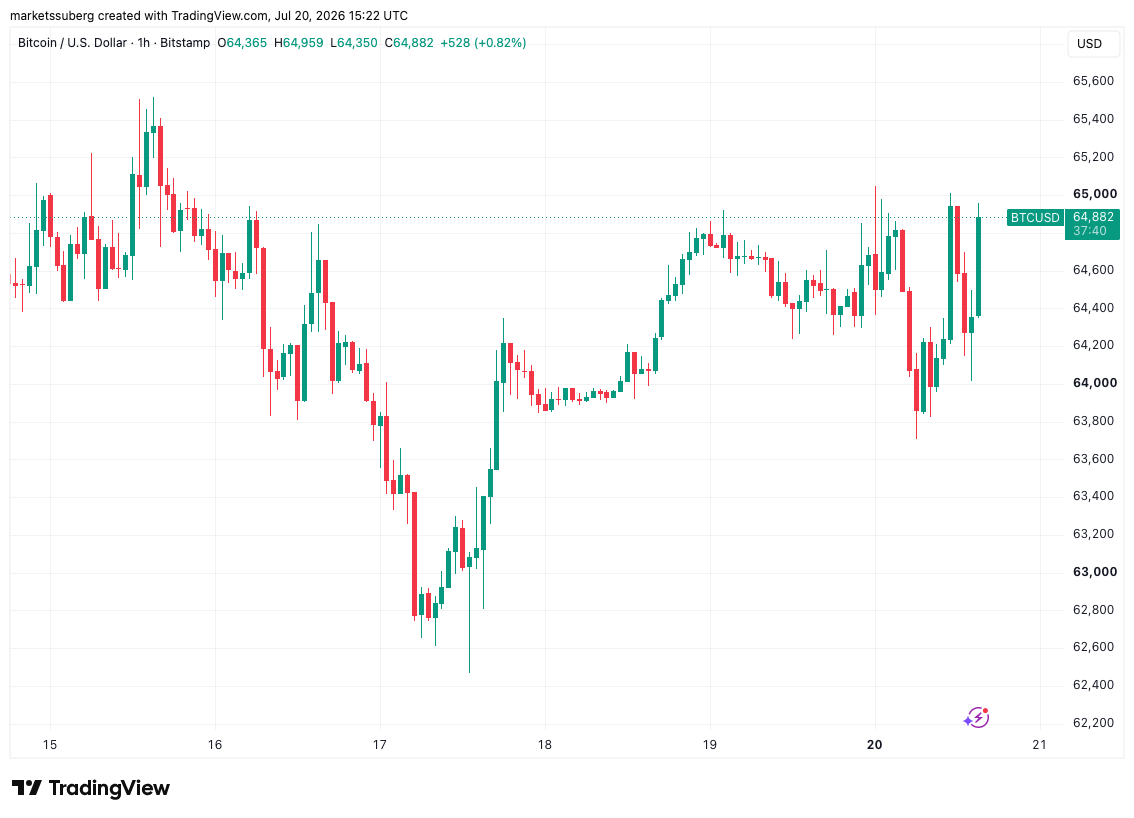
BTC/USD one-hour chart. Source: Cointelegraph/TradingView
US equities faced multiple headwinds to start the week, with the US-Iran war quashing risk appetite and a tech-stock sell-off gaining strength.
Trading resource The Kobeissi Letter reported that hedge funds were selling tech stocks “at a record pace.”
“Hedge funds have sold information technology stocks in 6 of the last 8 weeks. This brings total 8-week sales to the largest in at least 10 years,” it said in a post on X, citing Goldman Sachs data.
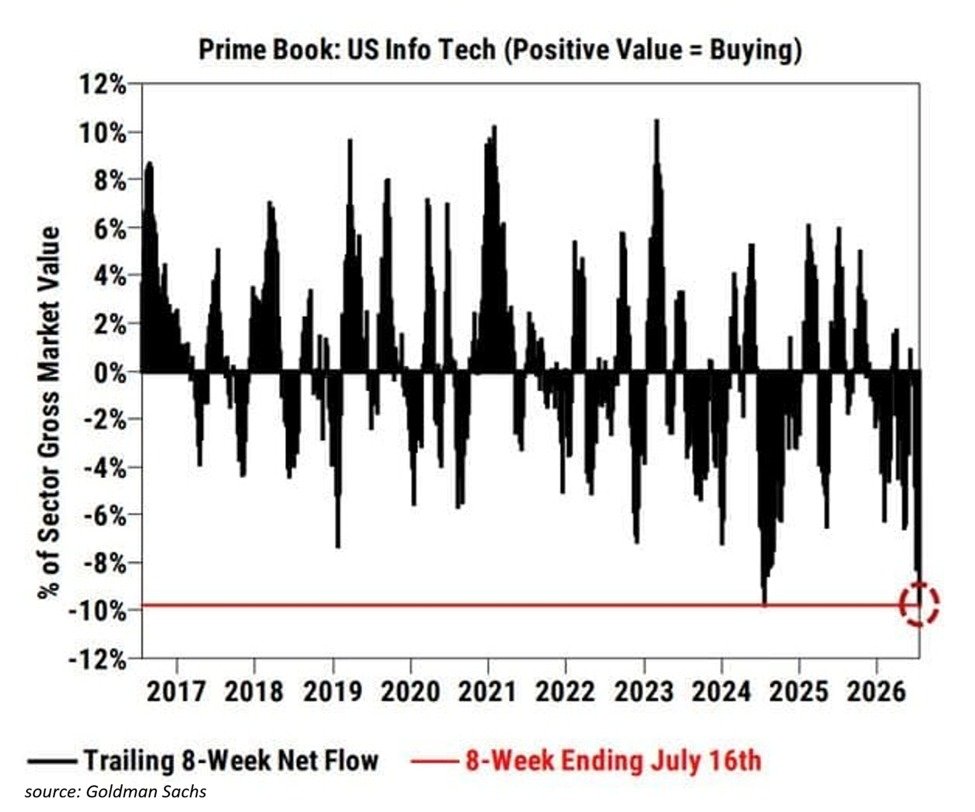
US tech stock investment trend data. Source: The Kobeissi Letter/X
To be sure, the S&P 500 Index and Nasdaq Composite Index were both modestly higher at the time of writing, while the Dow Jones was down 0.3% on the day.
Oil prices remained above $80 per barrel as the Strait of Hormuz looked set to stay closed amid intensifying rhetoric from both the US and Iran.
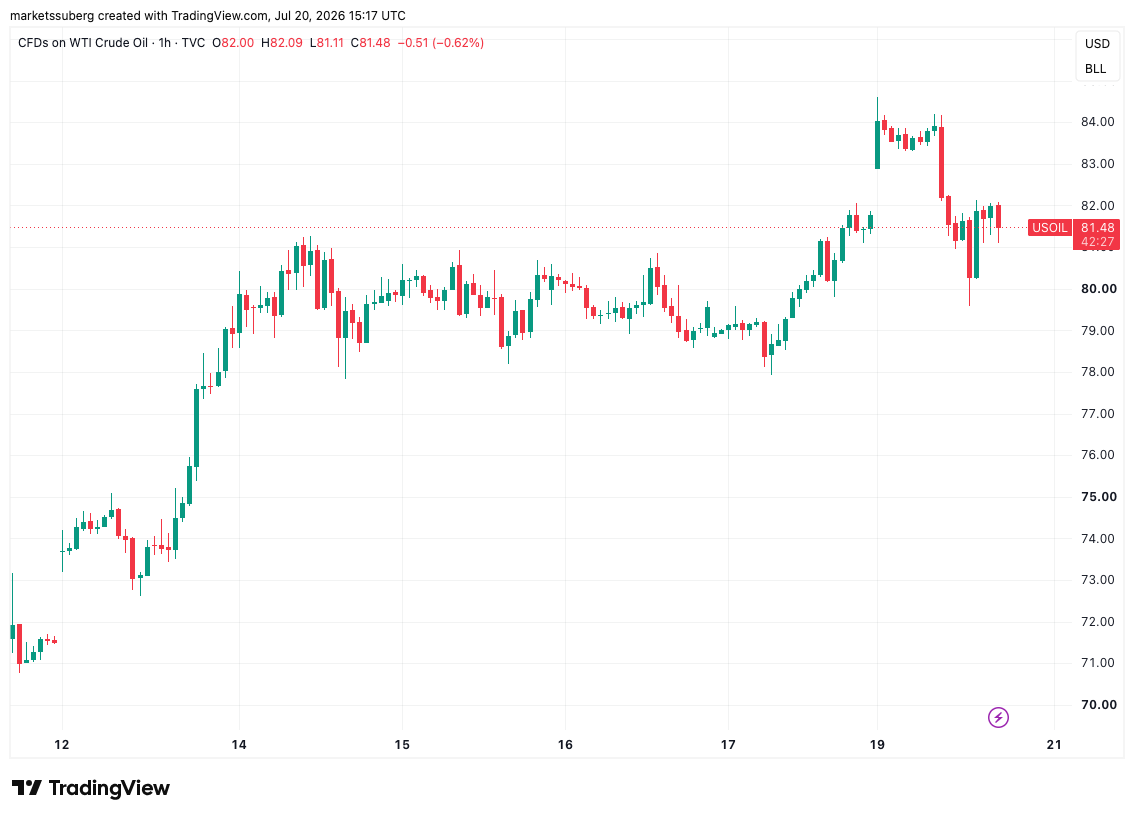
CFDs on US WTI crude oil one-day chart. Source: Cointelegraph/TradingView
In a post on Truth Social at the weekend, US president Donald Trump called for Iran to be included in a sanctions package initially focused on Russia.
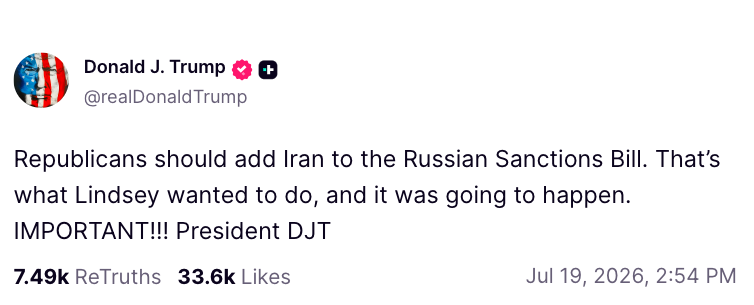
Source: Truth Social
Bitcoin price upside hits $65,000 roadblock
BTC price action found little room for upside as the $65,000 mark became a point of repeated momentum failure.
Related: Trader maintains $67K BTC price target: Five things to know in Bitcoin this week
“The $65K level has capped price for the entirety of July so far,” trader Daan Crypto Trades wrote in an X post.
“But I do think the longer price spends here, the more likely the $65K level is to break. Especially with the higher lows being made over the past 3 weeks.”
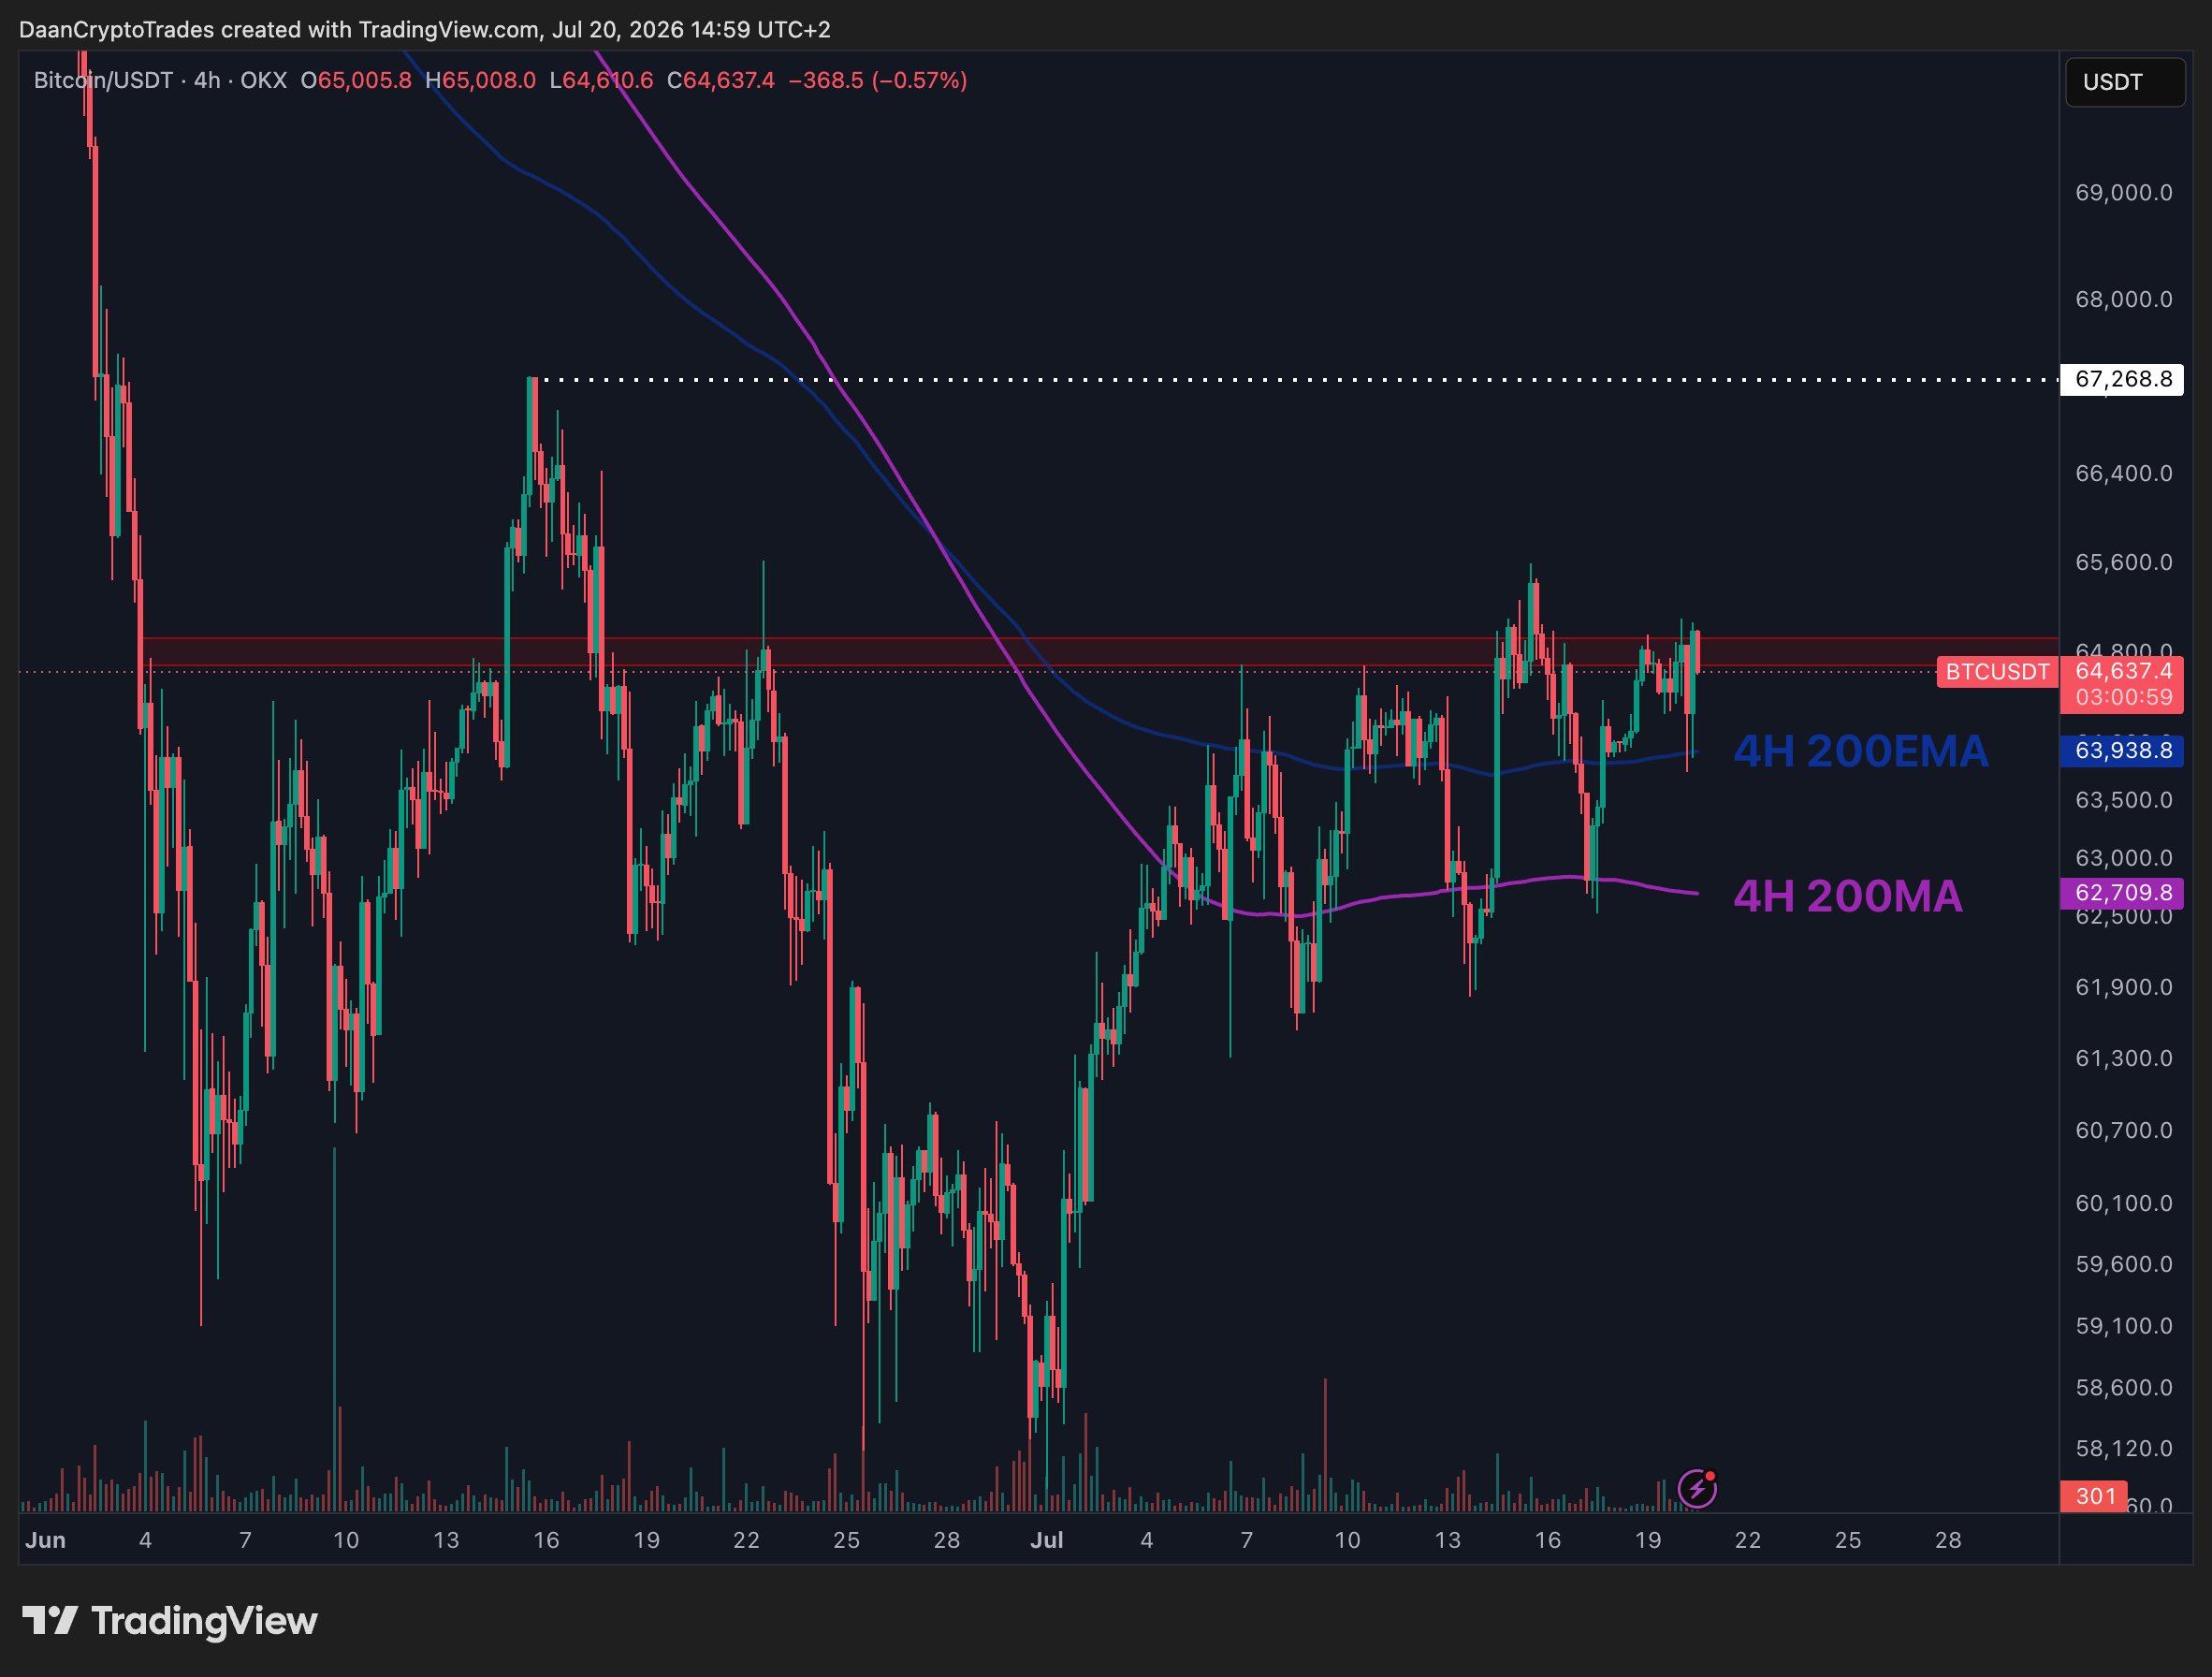
BTC/USD four-hour chart. Source: Daan Crypto Trades/X
Daan Crypto Trades joined those who saw the next likely upside target at just above $67,000. He said this was where BTC/USD would “break into a bullish market structure.”
Others referenced seasonality directing current price behavior, with summer traditionally devoid of major moves up or down.
“The markets are in a summer break, it feels like,” crypto trader and analyst Michael van de Poppe told his roughly 819,000 X followers while discussing largest altcoin Ether (ETH).
In a separate post, Van de Poppe gave a BTC price target of between $67,500 and $69,000 for the “coming weeks.” Earlier, he saw August offering even higher levels of up to $80,000, a level last seen in mid-May.
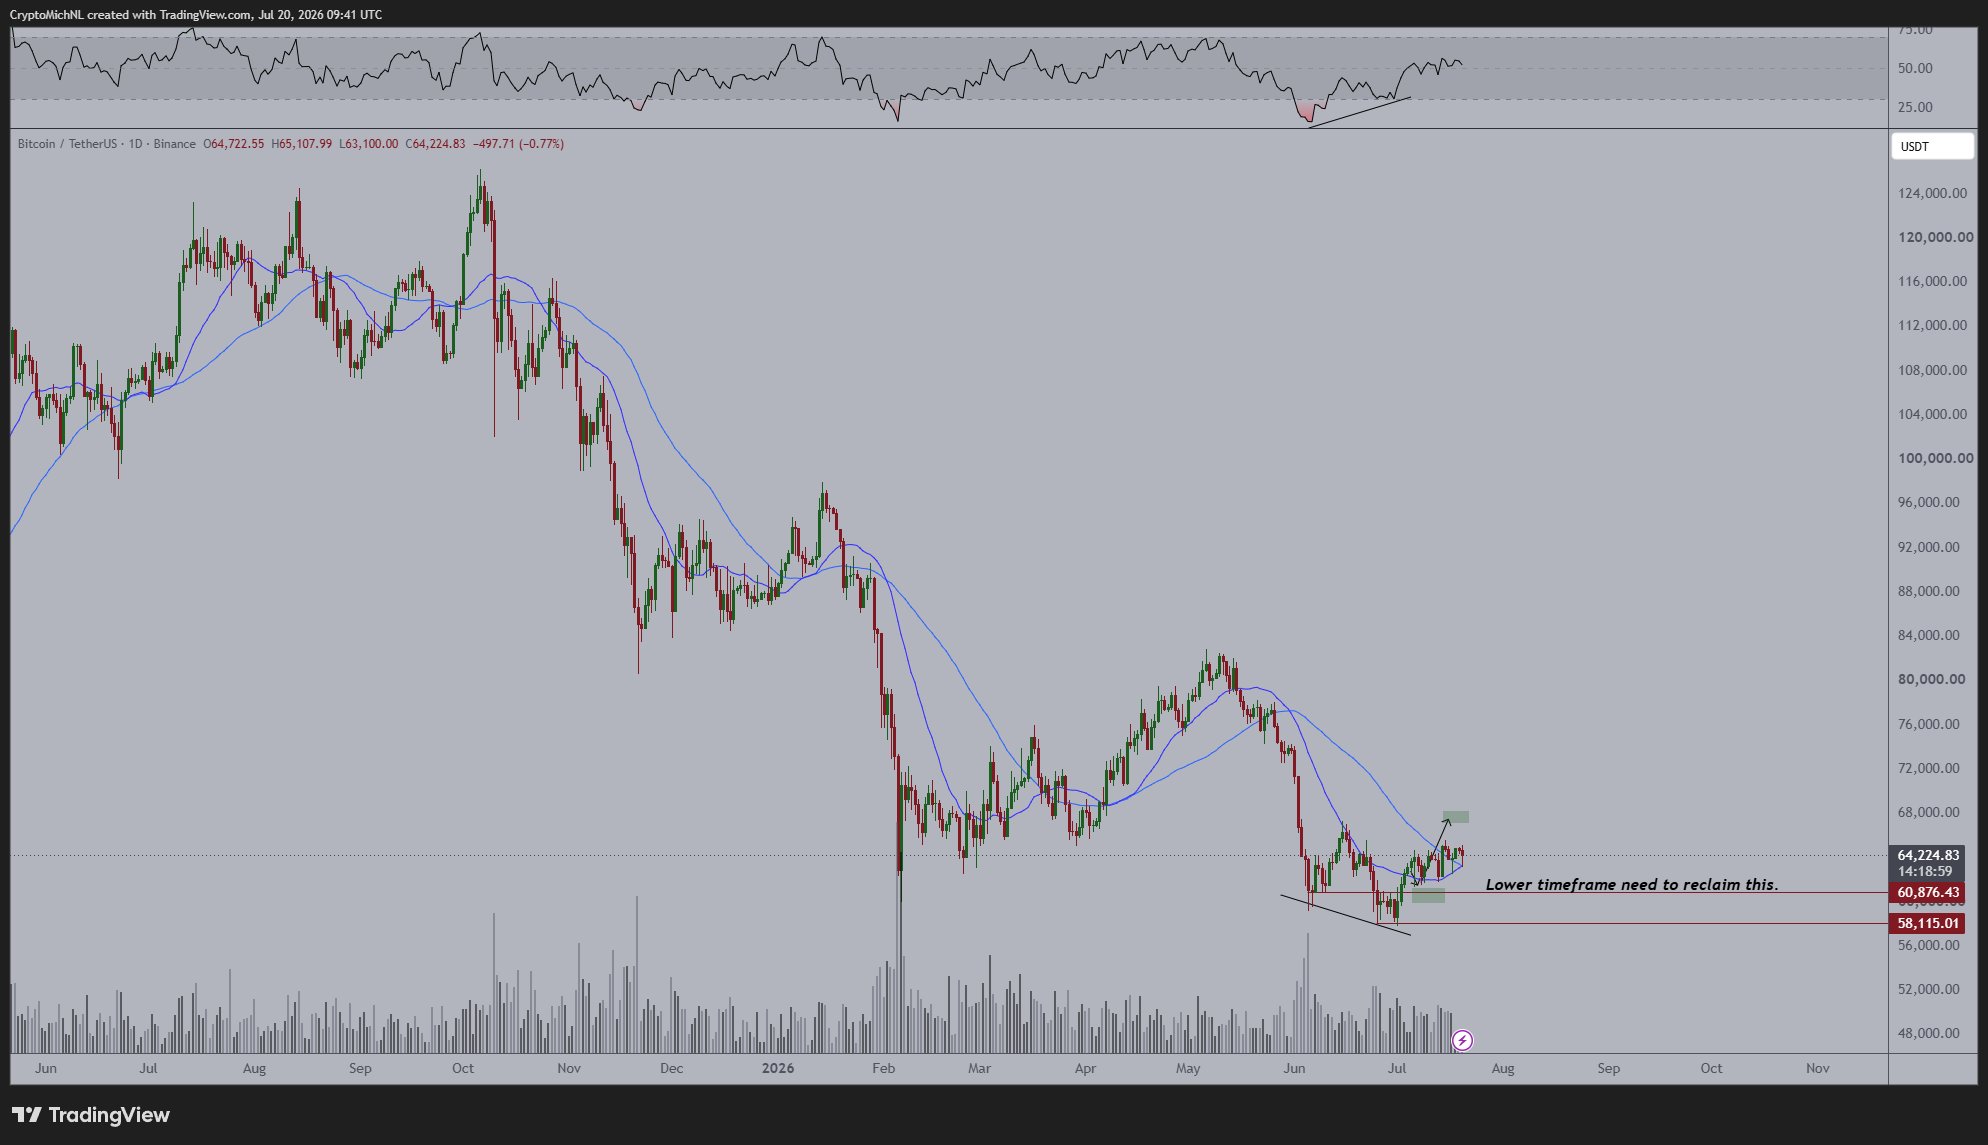
BTC/USDT one-day chart. Source: Michaël van de Poppe/X

Veteran market analyst Peter Brandt believes Bitcoin’s next major drawdown will still have room to run—despite the recent bounce that has kept many traders watching the idea of a “cycle bottom” around the current price range. In an interview with Cointelegraph, Brandt pinned his expected low to October 4, 2026, arguing that markets rarely bottom without the kind of stress and capitulation that is typically absent when sentiment is merely “neutral.”
At the time of publication, Bitcoin was trading at $63,661, according to CoinMarketCap. Brandt’s stance is more cautious: he says price could drop below $50,000 and possibly into the high-$40,000s before the cycle low is set.
Key takeaways
- Peter Brandt expects Bitcoin to bottom on October 4, 2026, framing it as the cycle’s turning point.
- He warns Bitcoin may need to fall below $50,000 before buyers gain enough conviction to reverse the trend.
- Brandt says major bottoms historically align with panic and high volume, not neutral sentiment.
- He doubts the long-term durability of capital rotation into AI stocks and suggests balancing risk with Bitcoin and precious metals.
- Brandt projects a Bitcoin cycle peak in 2029, estimating a range of $250,000 to $300,000.
Why Brandt is waiting for more pain
Brandt acknowledged that calling the exact day of a market low is difficult, but he has maintained his October prediction for a cycle low for some time. His argument centers on both price-range expectations and how bottoms tend to form when traders are forced to reassess their positions.
He said Bitcoin could test levels under $50,000 and potentially trade in the high-$40,000 area before establishing what he expects will be the cycle low. Brandt also pointed to Bitcoin’s historical drawdowns, stating that each major bear market since Bitcoin’s inception has featured an 80% or greater correction. He linked this pattern to his view of where downside could travel if the current cycle follows precedent.
While a number of market participants appear to believe the market is close to a turning point near $60,000, Brandt’s view is that optimism at current levels is still too high for a true bottom to be in.
“Right now it’s neutral [sentiment]. Markets don’t bottom on neutral sentiment. Markets bottom on panic and volume.”
In Brandt’s framing, bottoms form when enough participants abandon the trade—when the most confident holders are forced out and new demand becomes possible. He contrasted “neutral” conditions with the kind of emotion-driven selling that typically accompanies capitulation.
“The same people that are saying Bitcoin’s bottom at some point in time will be giving up on Bitcoin, throwing in the towel, and saying we’re done with Bitcoin, we’re going on to other assets, the Bitcoin phenomenon is done,” Brandt says.
AI optimism vs. crypto’s expected timeline
Brandt also pushed back on the idea that the recent strength in artificial intelligence-themed trades is permanently redirecting capital away from Bitcoin. While some have suggested that the AI boom is pulling liquidity from broader crypto exposure, he does not believe that trade can keep compounding indefinitely.
In his view, investors who chase AI aggressively today may not feel rewarded several years from now. He did not offer specific benchmarks for that judgment, but he described a portfolio split he would make if he had additional funds at current prices: 50% Bitcoin and 50% precious metals.
Brandt’s reasoning is twofold. First, he believes precious metals are closer to a price bottom, implying the timing of entry may be less dependent on waiting for a macro-driven liquidation event. Second, he expects Bitcoin may be closer to a time-based inflection—meaning the market could have to play out before the cycle low arrives, rather than bottoming immediately at current levels.
This distinction matters for traders and investors deciding how to express conviction during drawdowns. If Brandt is right, waiting may not be about “buying lower” alone; it could also be about buying at the moment when sellers finally exhaust themselves.
Forecasts for Bitcoin’s peak and how they compare to major projections
Brandt’s comments extend beyond the expected cycle low. He projected Bitcoin’s next major peak in 2029, estimating a price range of $250,000 to $300,000. In his scenario, the market would have roughly a year to move from that peak range upward toward far larger targets often discussed by influential figures in the ecosystem.
Brandt’s framing also referenced widely circulated, more ambitious longer-term expectations. He noted that Coinbase CEO Brian Armstrong and Ark Invest CEO Cathie Wood have projected a $1 million target for 2030. If Bitcoin does reach Brandt’s 2029 peak range, his timeline suggests a rapid escalation would still be required to bridge the gap to the $1 million narrative by 2030.
For readers, the key tension is not whether any single target is “correct,” but how different forecasts imply different pacing. A range-bound peak followed by accelerated upside has different risk dynamics than a smoother grind higher—especially for traders managing leverage, duration, and event-driven exposure.
What to watch before the October thesis is tested
Brandt’s view hinges on two practical signals: whether Bitcoin experiences the kind of panic and volume that historically accompanies major cycle lows, and whether sentiment truly shifts from neutral into capitulation. The most important question for investors isn’t just where prices trade next, but whether market behavior reflects forced selling rather than selective dip-buying.

Michael Saylor’s bitcoin-accumulating giant continues to refrain from increasing its cryptocurrency stash after a large wave of uncertainty hit the market and its stock performance.
Instead, Strategy continues to focus on rebuilding its USD reserve. In the past week alone, the NASDAQ-listed business intelligence giant ramped up its greenback stash by another $225 million for a total of over $3.2 billion.
Strategy has increased its USD Reserve by $225 million. As of 7/19/2026, we hodl ₿843,775 in our BTC Reserve and $3.2 billion in our USD Reserve. $MSTR $STRC https://t.co/sci7bZHzsy
— Michael Saylor (@saylor) July 20, 2026
Strategy’s bitcoin fortune remains at 843,775 units, accumulated for approximately $63.7 billion at an average price of $75,500 per BTC. The firm remains deep in the red, as the current value of its crypto stash sits around $10 billion lower.
Recent History
Before today’s announcement, Strategy and its co-founder and former CEO changed their course on trading with bitcoin, as it’s no longer a simple buy-and-hold strategy.
Instead, the largest corporate holder of the cryptocurrency made a couple of sales in the past several months, with the second, announced earlier this month, becoming the largest; over 3,500 BTC sold for about $216 million at the time.
Strategy also launched the Digital Credit Capital Framework to enhance its available liquidity to cover monthly dividend payments and increase its long-term bitcoin exposure. It managed to increase its USD reserve to $3 billion before today’s announcement, which was enough to cover payments for over two years.
Although this pivot from consistent bitcoin purchases was described as a safe and good first step, some analysts continue to question the long-term BTC plan.
The post Strategy Extends Bitcoin Buying Pause While Growing Its USD Reserve: Details appeared first on CryptoPotato.
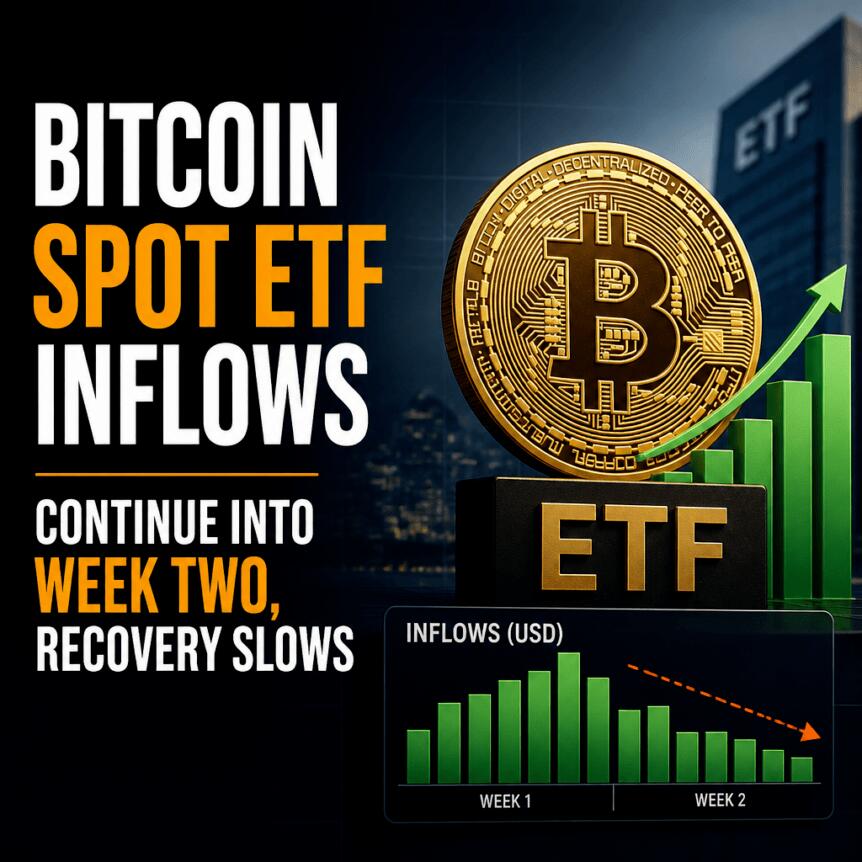
US-listed spot Bitcoin exchange-traded funds (ETFs) have seen a fresh wave of buying, with net inflows returning for a second straight week. However, traders and analysts say the pace of demand is still not strong enough to confirm that the rebound is turning into a durable trend.
According to SoSoValue, spot Bitcoin ETFs in the US recorded $75.7 million in net inflows for the week ending July 17. This followed $197.4 million in net inflows the prior week, lifting total inflows for July to $200.2 million.
Key takeaways
- SoSoValue data shows US spot Bitcoin ETFs posted net inflows for two consecutive weeks, totaling $200.2 million for July so far.
- Analysts caution that even multiple inflow days may only indicate easing selling pressure—not broad, sustained institutional buying.
- Bitcoin’s recovery has not yet produced the decisive price breakout some analysts say is needed to validate a new uptrend.
- Citi’s latest stance remains cautious, cutting its 12-month Bitcoin ETF inflow forecast to zero and lowering its Bitcoin price target.
- ETF analysts compare the product cycle to gold ETFs: rapid adoption followed by longer stretches of weaker performance.
ETFs return to inflows, but momentum remains limited
The renewed inflow streak comes after a difficult period. Cointelegraph previously reported that US spot Bitcoin ETFs recorded $4.5 billion in net outflows in June, leaving 2026 total net flows still negative at $5.2 billion. In that context, July’s partial rebound matters, but it hasn’t erased the bigger picture of persistent withdrawals.
Simon-Peter Massabni, head of business development at XS.com, told Cointelegraph that the return of inflows suggests selling pressure is easing. Yet he stressed that the current buying rhythm does not necessarily signal a broad institutional return.
“Four consecutive sessions of inflows should be interpreted as a sign that selling pressure is easing, rather than clear evidence that institutional investors have returned on a broad scale,” Massabni said, referring to the daily ETF flow data from last week.
Why the market still needs more than “a few green days”
Massabni connected the ETF flow improvement to Bitcoin’s price action. Bitcoin has recovered toward $64,000 after falling from higher levels seen in June, but the move has not yet met the threshold he associates with a convincing reversal.
He argued that Bitcoin needs to “decisively break above the $65,000–$65,500 range” to confirm a new uptrend. In his view, the recovery still “lacks real strength,” implying that spot demand visible through ETFs must align with broader market conviction.
From an investor’s perspective, this distinction is important: inflow streaks can reflect short-term positioning and relief from prior selling, while sustained, higher-volume inflows typically correlate better with durable trend changes. Readers watching the next leg of ETF flows will likely want to see whether weekly inflows continue to scale upward, rather than merely alternating with quieter periods.
Citi turns more cautious as institutional demand remains in question
While ETF flows have improved recently, Citi’s updated outlook underscores how uneven the institutional picture still appears. Massabni pointed to Citi’s revision to its Bitcoin ETF expectations, which he said is rooted in concerns about the strength of institutional demand.
On July 1, Citi cut its 12-month ETF inflow forecast from $10 billion to zero after weaker-than-expected flows and recent outflows. The bank also lowered its 12-month Bitcoin price target from $112,000 to $82,000.
Massabni argued that the market may not lack reasons to buy, but what remains missing is a sufficiently strong driver. “The market does not lack reasons to start buying Bitcoin,” he said, “what is still missing is a sufficiently strong catalyst—most likely a flow of capital large and persistent enough to turn the current rebound into a genuine trend.”
ETF cycles may resemble gold: fast adoption, then long drawdowns
Another lens on the current setup comes from ETF industry comparisons. Bloomberg ETF analyst Eric Balchunas has likened Bitcoin ETF behavior to that of gold ETFs, noting that both products saw rapid adoption followed by extended stretches of weaker performance.
In a post on X on Friday, Balchunas said Bitcoin ETFs may follow a similar pattern of “spectacular gains, painful drawdowns and recoveries,” and that each cycle could potentially set higher highs over time. The point for investors is not that drawdowns are inevitable, but that ETF performance can be nonlinear—driven by waves of positioning rather than straight-line progress.
As July inflows accumulate, the market will likely test whether this resembles the “recovery” phase of prior cycles or whether it remains a modest rebound inside a broader period of net outflows.
What to watch next for Bitcoin ETFs and the broader trend
For now, the most immediate indicators are whether weekly inflows persist and whether Bitcoin can clear the $65,000–$65,500 zone that Massabni highlighted as a confirmation level. The next few weeks of ETF flow data will show whether July’s demand is just a pause in selling or the start of a more sustained institutional bid.

Toobit is one of the most popular centralized cryptocurrency exchanges. It’s built for users who are looking to trade more than just crypto – a model adopted by many exchanges in the industry.
Alongside spot trading, the platform offers perpetual futures, copy trading, automated bots, AI-assisted market analysis, programmable AI-based agent tools, and exposure to traditional financial markets.
If all of this sounds complicated, don’t worry; I will break it all down in the following guide. When it comes down to it, there are four very important features that I will be looking at. These are its AI trading assistant and MCP-based AI Agent Trade Kit, the leverage proposition of up to 500x on eligible markets, zero maker and taker fees for standard spot trading, as well as TradFi products linked to metals, forex, stocks, commodities, and indices.
In this Toobit guide, I will explain how those features work, what else the exchange has to offer, its current fee structure and security measures, as well as the risks you should understand before trading.
What is Toobit?
First things first, though, let’s lay down some fundamentals. As mentioned above, Toobit is a centralized exchange, but this definition doesn’t do it much justice. It would be fairer to say that it’s a multi-product crypto exchange that’s available through a web platform and mobile applications.
Its core trading propositions include spot trading, USDT-margined and USDC-margined perpetual futures, copy trading, and crypto trading bots. The platform, however, has also expanded into decentralized finance, prediction markets, Event Contracts, crypto Earn products, as well as derivatives linked to traditional financial instruments.
The resulting product is an exchange that’s designed primarily for those of you who trade actively. But this doesn’t mean that the platform is not suited for beginners – they do offer a range of different educational materials and simple products which are aimed towards those taking their first steps in the industry.
Once you’ve created an account, you can fund it in several different ways. Users can deposit crypto from another exchange or a self-custody wallet, but you can also buy crypto with a bank card or use a supported third-party payment service.
What Makes Toobit Stand Out in 2026?
And while the exchange offers a product kit similar to those of many of the best cryptocurrency exchanges in 2026, there are a few features that make it stand out, and that’s what I’ll focus on in this section.
AI Trading Assistant and MCP AI Agent Trade Kit
We live in times where artificial intelligence is spreading like wildfire, and people are using it more and more in their everyday tasks. This doesn’t exclude trading. In fact, AI is becoming a more prominent part of the crypto trading experience.
That said, Toobit’s AI goes beyond a conventional chatbot.
The first component is called Toobit Synapse – an AI-powered market assistant that can turn market data into structured analysis, which covers areas such as current conditions, technical indicators, trends, and possible trading strategies.
Users can select an asset and receive an AI-generated market report, rather than having to interpret every chart and indicator manually.
The exchange argues that Synapse takes advantage of the Model Context Protocol (or MCP), to access current market information. The tool is intended to simplify research and help traders identify relevant signals a lot quicker. Planned functions include automated alerts, rule-based order management, and more.
The second component is the Toobit AI Agent Trade Kit. This is an open-source toolkit that lets compatible AI agents interact with Toobit through natural-language prompts or terminal commands.
In essence, the toolkit provides two main interfaces:
- MCP Server connects compatible AI models and applications to Toobit via a conversational interface.
- Command-line interface, which gives those users who are more technically experienced access to trading and account functions from a terminal
According to the exchange, the kit contains 65 tools, which cover spot orders, USDT-margined perps, balances, positions, fees, market data, profit and loss, transaction histories, and fund management.
A simple use case could be for the user to ask a connected AI agent to retrieve available BTC market data, review open positions, check account balances, or prepare a spot futures order. The agent can also work with take-profit and stop-loss orders.
High-Leverage Futures Trading
Toobit provides USDT-margined and USDC-margined perpetual contracts. These allow traders to speculate on rising or falling crypto prices without having to own the underlying asset directly. These contracts have no expiry date, but users have to pay (or receive) funding fees.
A major selling point here (or not) is the leverage of up to 500x on eligible futures markets. Naturally, this means that a 0.2% move in the wrong direction would see your position liquidated, arguably pushing this far beyond the scope of traditional trading.
That said, there are traders who are looking for aggressive strategies, and having this option does make the platform more versatile. Of course, you should be well aware that any type of leverage trading significantly amplifies your risk and the chances of getting liquidated.
Therefore, this high leverage trading style is most appropriate for extremely experienced traders who have very strict position-sizing and risk-management rules, as well as understanding of market dynamics.
Zero Spot Trading Fees
Toobit’s standard spot markets currently have 0% maker fees and 0% taker fees across every single VIP level.
This can make the platform very attractive to frequent spot traders, as well as people who rebalance their portfolios very often or use multiple orders to execute their strategies.
There is an important exception, though. Spot pairs, which are placed in Toobit’s Assessment Zone, are excluded from the zero-fee policy and follow a separate VIP-based schedule. At VIP 0, the current Assessment Zone rate is 0.075% for makers and 0.1% for takers.
Zero trading commission also doesn’t mean that every transaction is free. Users may still encounter:
- Difference between bid and ask prices (spread)
- Blockchain withdrawal fees
- Card-processing or third-party provider charges
- Slippage
- Perpetual-futures funding fees
TradFi Trading: Stocks and Other Traditional Markets
Toobit’s TradFi section allows users to trade different instruments, which are linked to traditional financial markets, while using USDT for margin and settlement.
Available categories include stocks, foreign exchange, precious metals, indices, and commodities. You can both long and short these. You can trade various stocks like Tesla, SpaceX, Nvidia, and more.
There is an important caveat here. You shouldn’t confuse these products with buying shares through a conventional stockbroker. Toobit’s stock products are basically USDT-settled perpetual futures – an instrument designed to track the price of an underlying asset.
You can use various leverage and you can trade 24/7 – something rarely available on existing traditional alternatives. Of course, trading outside the underlying market’s normal hours is likely to have an impact on liquidity, pricing, and funding conditions, so keep that in mind.
Other Toobit Products and Trading Tools
Although the above four are some of the more distinctive features of the platform, this doesn’t mean that there aren’t more.
Copy Trading
This allows you to follow experienced traders and automatically reproduce their positions. You can compare profiles using metrics such as ROI and win rate. Copiers can also adjust their copy mode, leverage, and other settings rather than following each strategy with identical parameters.
One of the interesting features is that Toobit has optimized its system to allow for zero slippage when copy trading.
Trading Bots
There are multiple bots that you can set up, including Futures Grid and Futures DCA or even Martingale strategies. Grid bots palace orders across a predetermined price range, while DCA-style strategies may increase a position as the market moves.
DEX+
This feature provides access to selected Web3 on-chain assets through Toobit’s interface. It’s suitable for those users who are looking for a more crypto-native experience. Users can also trade on-chain using the USDT they have deposited in their spot account, making it for a frictionless experience.
Is Toobit Safe?
Yes, Toobit is considered a safe cryptocurrency exchange. It lists multi-factor authentication, ongoing audits, phishing detection, encrypted infrastructure, real-time account monitoring, as well as cold storage practices among its security measures.
When you create an account, I highly recommend that you activate all of the available protections, such as a unique password and two-factor authentication before depositing funds.
The exchange also publishes a Proof of Reserves system, which helps users see if deposits are matched 1:1. It uses a summation Merkle tree to allow users to confirm these numbers.
Toobit Pros and Cons
Toobit’s principal advantages are its broad range of trading products, AI-assisted research, open-source MCP toolkit, zero-fee standard spot markets and access to both crypto and TradFi-linked derivatives. Copy Trading, bots, APIs, TradingView tools and demo trading give active users several ways to build and test a strategy.
Its main limitations are closely connected to those features. High leverage creates substantial liquidation risk. AI output can be inaccurate. Copy Trading and bots can reproduce losses as efficiently as profitable trades. TradFi contracts do not provide the same rights as owning the underlying shares, and some services may be unavailable in particular jurisdictions.
Like any centralized exchange, Toobit also requires users to accept custodial risk while assets remain on the platform.
Frequently Asked Questions
Is Toobit a cryptocurrency exchange?
Yes, Toobit is a centralized cryptocurrency exchange. It offers spot trading, perpetual futures, copy trading, bots, AI tools, and trading products linked to traditional financial instruments like stocks and commodities.
Does Toobit charge spot trading fees?
Standard spot markets currently have 0% maker and taker fees. There are some pairs which are excluded from the offering.
How much leverage does Toobit offer?
Toobit advertises leverage of up to 500x on eligible markets. The maximum varies by contract, asset, position size and current risk rules, so 500x is not available universally.
Does Toobit require KYC?
Toobit has different verification levels. The required level depends on the service, withdrawal limit and account function. Advanced verification is required for read-and-write API permissions.
Does Toobit publish Proof of Reserves?
Yes. Toobit publishes reserve information and provides Merkle-tree-based tools through which users can check the inclusion of their balances. The exchange says it conducts comprehensive audits monthly.
Conclusion: Is Toobit Worth Considering in 2026?
Over the years, Toobit has developed into a wide-ranging trading platform rather than a basic spot exchange. Some of its strongest differentiators are its AI trading assistant and MCP AI Agent Trade Kit, zero-fee standard spot trading, leverage of up to 500x on some eligible markets, and USDT-settled access to TradFi-linked products.
Those features make Toobit particularly relevant to traders who are active and technically confident.
That said, there is a range of comprehensive tooling for beginners as well. Of course, some of the abovementioned options do come with certain risks, which have to be accounted for – just like any other exchange.
The post Toobit Exchange Guide 2026: AI Trading, Zero Spot Fees, High Leverage, TradFi and More appeared first on CryptoPotato.
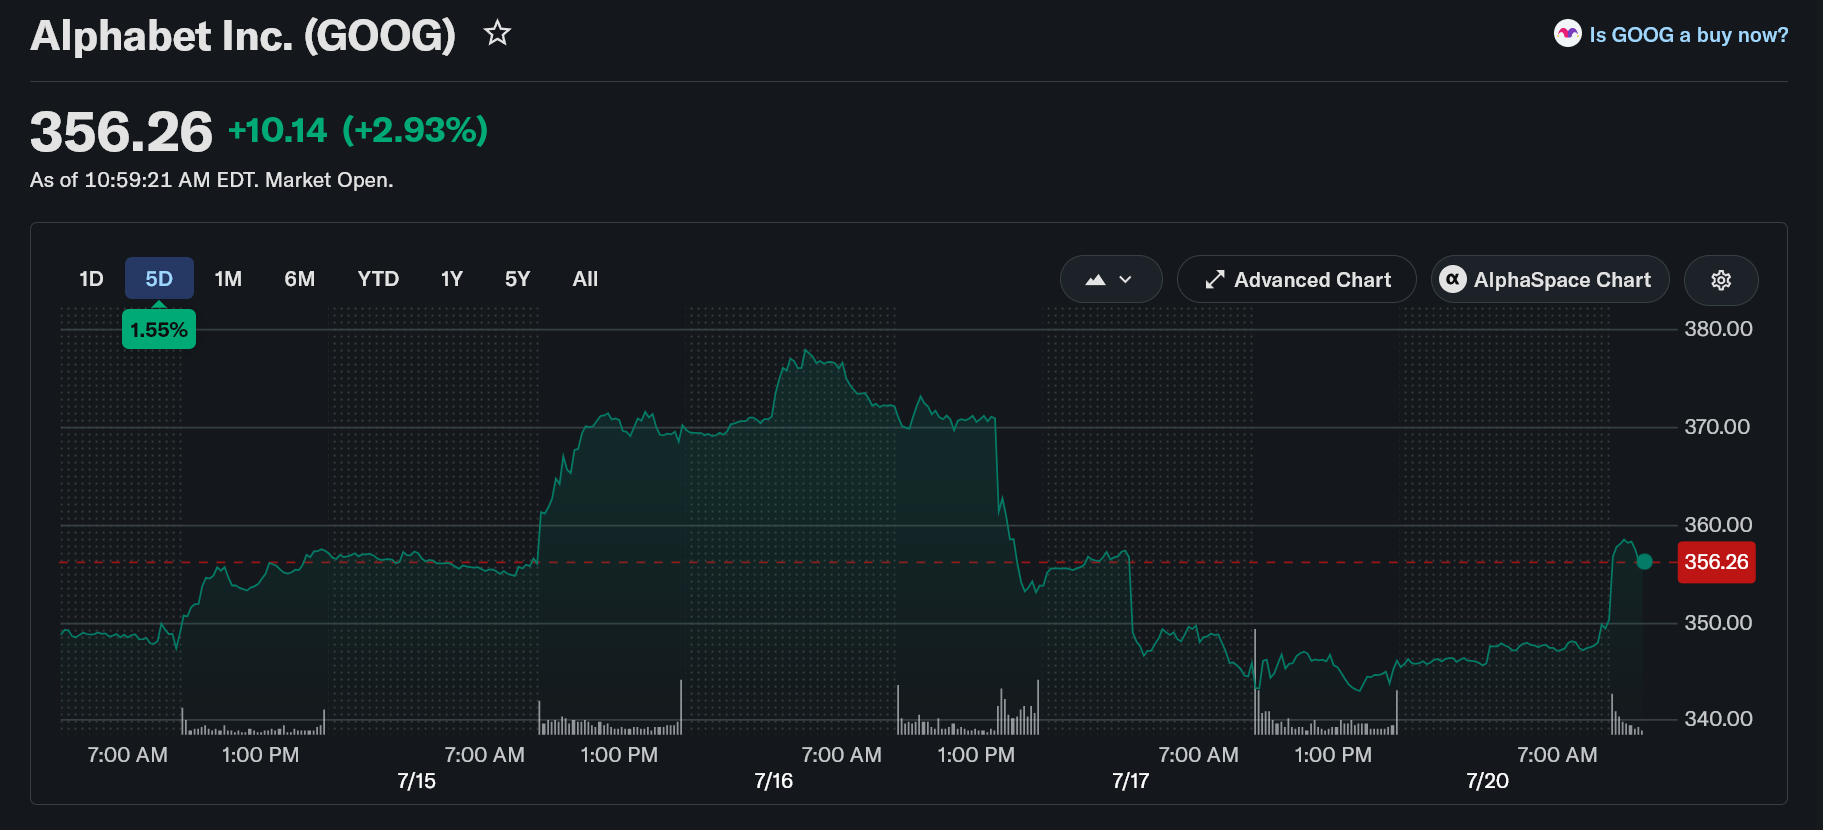
After hitting $370 on July 15, Alphabet (GOOGL) sold off sharply last week, days before an earnings report that could define its place in the AI race. The Google stock slide followed a report that Gemini 3.5 Pro, Alphabet’s most powerful AI model, is delayed.
It also spotlights a bigger shift, since Alphabet just broke a roughly 20-year habit to fund the AI build-out it must defend on Wednesday.

Why Google Stock Just Dropped
Alphabet (GOOGL) fell by more than 9% between July 16 and 17 after the delay was reported, amid heavy selling volume. That volume matters because it suggests large holders, not just regular retail traders, were cutting exposure.

The timing stings. Alphabet reports second-quarter results on July 22 after the close, and Alphabet’s Gemini setback has raised the bar for what those numbers must show.
Want more insights like this? Sign up for Editor Harsh Notariya’s Daily Newsletter here.
Yet the sell-off traces back to one bigger figure. Investors are nervous about the $190 billion Google now plans to spend on AI this year, and whether it will ever pay off.
The $190 Billion Bet It Can No Longer Self-Fund
That budget is the heart of the story. Alphabet’s 2026 capital spending guidance sits between $180 billion and $190 billion, roughly double last year’s $91 billion, with an even higher 2027 already flagged.

For the first time in years, its cash machine cannot cover the bill on its own. Free cash flow roughly halved in the first quarter, even as capital spending more than doubled from a year earlier.

So Alphabet did something it had avoided for roughly 20 years.
It launched an $80 billion equity raise, its first major stock sale in about two decades, that reversed years of buybacks, with Warren Buffett’s Berkshire Hathaway adding $10 billion.
That reversal is why Wall Street now scrutinizes every dollar of this spending.
Depreciation Is the Real Test
Here is the part that few readers see. Chips and data centers are capitalized and depreciated over five to six years, so today’s spending becomes a rising cost that slowly erodes profit, long after the cash leaves.
Think of it like buying a delivery van. The cash goes out all at once, but the cost is booked in small yearly slices as the van wears down.
That shifts the key question. It is no longer how much Google spends, but whether AI revenue grows faster than the depreciation that spending creates.
Google Cloud is where that answer shows up first. It grew 63% last quarter to $20 billion at a record margin, and some previews expect close to $22 billion this time.

If that pace holds, revenue may finally be outrunning depreciation, though AI revenue bubble fears still shadow the sector.
TPUs Are the Swing Factor
Alphabet’s own chips could tip the math. Its Tensor Processing Units (TPUs), custom AI chips built to rival Nvidia, let it avoid paying Nvidia’s rich margins and now pull in outside customers.
The company has backed TPU projects with billions in guarantees and a $5 billion venture with Blackstone. Citadel Securities says it runs some workloads about 30% cheaper and up to four times faster on TPUs.
Doubts remain, however. One cloud provider, Nebius, said in early July that roughly 99% of demand still points to Nvidia, arguing TPU interest is thin outside Google’s own orbit.
What Wall Street Expects on Wednesday
Despite the drop, analysts stay firmly bullish. The consensus rating is a Strong Buy with an average target near $438.

Plus, there are no Sell ratings on record, and Wedbush recently opened coverage at a Street high of $671.

Big money agrees. Buffett personally initiated Berkshire’s stake and still calls the AI spending race real money, a stance laid out in how Buffett backs Alphabet.
Beyond Berkshire, 13F filings show funds run by Ken Fisher and Ray Dalio added shares last quarter, though some rivals trimmed.

The numbers set the stakes. Analysts expect about $116.9 billion in revenue and $2.90 in earnings per share this quarter, both up more than 20% from a year earlier.
Beating those figures, especially on cloud, would show that the spending is converting into growth. Falling short, or raising the capex bar again, would harden the doubts.
So Wednesday reveals whether Google’s $190 billion bet looks visionary or reckless.
The post Google Broke a 20-Year Funding Habit. How Will Its Stock React? appeared first on BeInCrypto.
Shiba Inu (SHIB) price sits near multi-year lows, and its biggest recent headline, a physical collectible coin from Japan’s Rakuten, does nothing to change the token’s weak on-chain reality.
The data tells a blunt story. With burns too small to matter and network usage close to zero, SHIB’s recovery may depend far more on a return of meme coin hype than on anything the project itself controls.
Shibarium Usage Points to a Hollow Utility Case
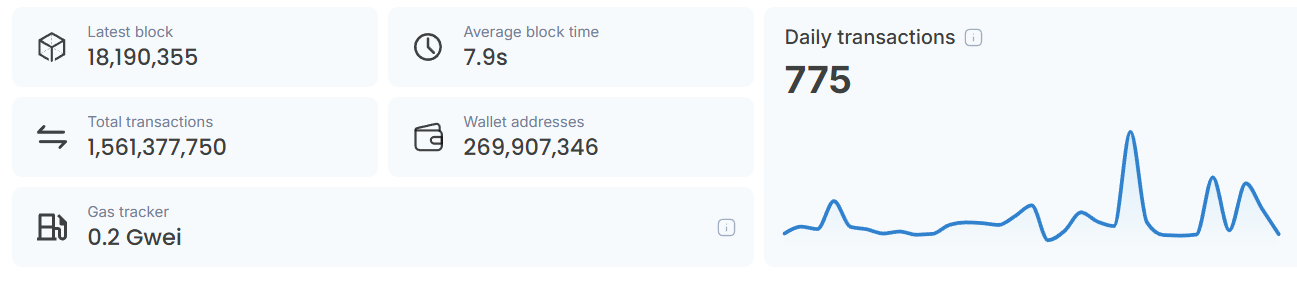
Shibarium, the Layer-2 network designed to give SHIB real utility, processed roughly 775 transactions per day at the time of writing. That figure sits against more than 269 million lifetime wallet addresses and over 1.5 billion cumulative transactions.
The gap between those totals and current activity is the problem. A large installed base means little when daily usage stays this thin.

Burns tells a similar story. Even on active burn days, a microscopic share of the 589 trillion tokens in circulation is removed. As a result, the deflation narrative carries almost no weight.
One community analyst has also questioned recent wallet growth, suggesting that contract auto-generated addresses are used to inflate holder counts.
For the signal to flip, Shibarium would need sustained, order-of-magnitude growth in daily transactions.
The Meme Sector, Not SHIB, Holds the Key
That weak internal picture matters less once the wider sector comes into view. The GMCI Meme Index, which tracks the broad meme coin market, peaked near 160 in January 2026 before sliding to about 66 by late July.
SHIB’s chart maps almost step-for-step onto that decline. The token did not break on its own merit, and it fell as the entire category lost momentum.

This reframes the question. If Shiba Inu moves as a high-beta piece of the meme complex, its next real move is likely to arrive with a sector-wide hype wave rather than a project update.
Such waves have fired before. In early 2026, a single session sent Dogecoin (DOGE) up double digits. That move pulled SHIB and other dog-themed tokens higher alongside it.
However, current conditions look muted. The Altcoin Season Index hovers near its midpoint rather than signaling a rotation into risk.
Shiba Inu Price Prediction Rests on the $0.0000055 Ceiling
On the daily chart, Shiba Inu trades around $0.0000041, little changed over the past day and pinned inside a tight accumulation zone near its multi-year low. Its market cap sits close to $2.4 billion, placing it in the mid-30s among all crypto assets.
Two overhead supply zones frame the path higher. The first sits near $0.0000055 and the second near $0.0000065, both former support levels that flipped to resistance during June’s sell-off.
A move from current levels to the first zone would mark a roughly 30% gain. A push to the second implies closer to 55%. Reclaiming both would signal that a genuine trend change is underway.

Momentum offers little conviction for now. The Relative Strength Index (RSI) sits near the 40 midline rather than in oversold territory, and volume has thinned through July. That combination suggests a market basing quietly, not one coiled for an immediate rebound.
The catalyst that could accelerate any move is external. Rakuten’s SHIB support in Japan may lift brand awareness, yet a broad return of meme coin demand remains the clearest trigger.
Absent that wave, Shiba Inu looks more likely to grind sideways than to stage a fundamentals-driven recovery. Whether SHIB reclaims $0.0000055 or slips back toward its lows may come down to the sector, not the project.
The post Is Shiba Inu (SHIB) Dead? On-Chain Data Shows a Sad Reality appeared first on BeInCrypto.


The boom in glucagon-like peptide-1s for weight loss has led some people to seek out other peptides in the hope that they too will have health benefits.
However, because these alternative compounds aren’t approved for medical use, you can’t acquire them with a prescription and a trip to Walgreens; people instead are turning to gray and black market sources to purchase them.
These sources, often online, tend to not be serviced by traditional payment processors, and so, according to a report from Bloomberg, these sites and the consumers who use them have turned to cryptocurrency to solve their payment needs.
Read more: Russian darknet marketplace launches memecoin on Solana
These research compounds, which are often marketed with health benefits like weight loss or longevity, are generally considered research chemicals and aren’t meant to be used for medicinal use.
According to data from Chainalysis, the annual run rate for crypto spent on gray market peptides has recently exceeded $100 million.
This same Chainalysis report also emphasized that, according to forums where users discuss these compounds, there have been problems with the purity and safety of compounds that users have received.
Crypto, BTC in particular, has been marketed since the beginning as a censorship-resistant payment tool. Useful, in comparison to other payment methods, when the payment in question is one that the state, payment processors, or banks don’t want to occur.
This is why crypto was useful for various dark markets like Silk Road and why it’s is now useful for those interested in obtaining peptides not approved for human beings.
Got a tip? Send us an email securely via Protos Leaks. For more informed news and investigations, follow us on X, Bluesky, and Google News, or subscribe to our YouTube channel.
Solana price has stalled near $76 after repeated failures at $80, as two ecosystem exploits, weak momentum, and geopolitical stress have kept traders cautious.
Summary
- Solana price remains below $80 as security incidents weigh on trader sentiment.
- Bearish daily momentum contrasts with positive 4-hour capital flows near $76.
- Losing $73 could expose SOL to $70 and the mid-$60s region.
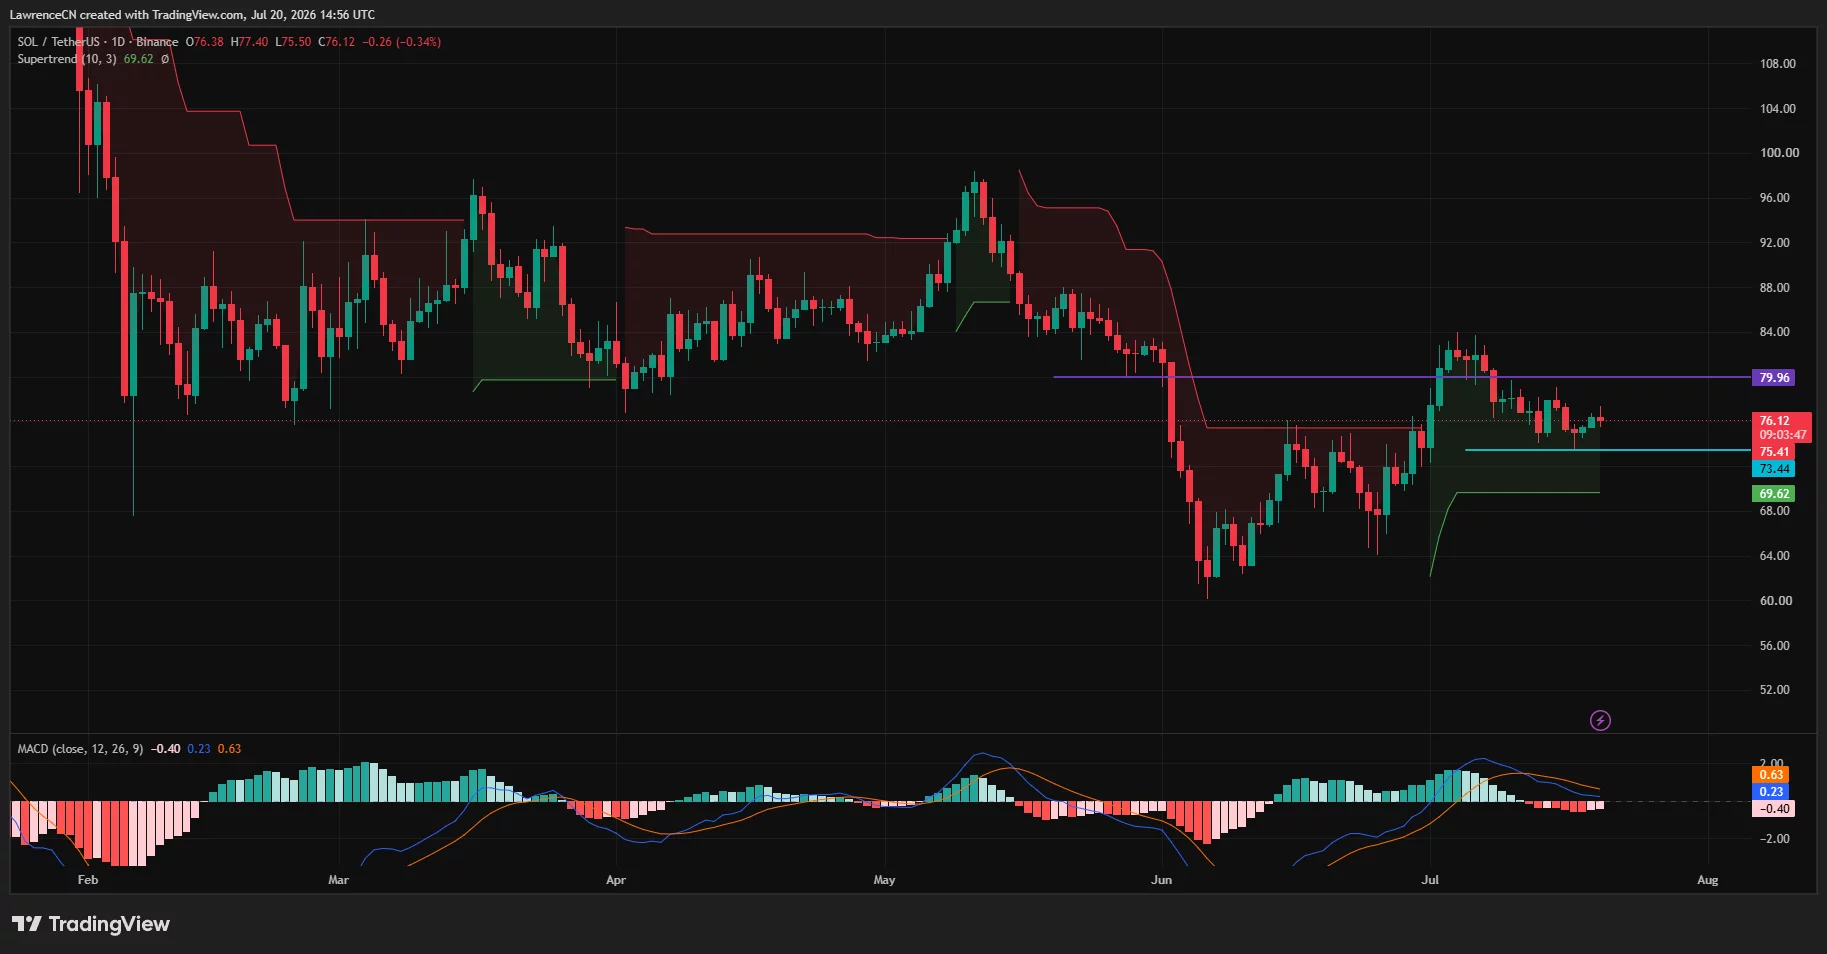
According to data from crypto.news, Solana (SOL) price traded at $76.12 at the time of writing, down 0.34% on the daily candle after moving between $75.50 and $77.40. The token has gained only about 0.3% over the past seven days, compared with a 3% rise across the global crypto market.
Security concerns have weighed on sentiment throughout July. An attacker drained roughly $20 million from BonkDAO after spending about $4.4 million to acquire enough BONK to pass a malicious governance proposal. Only seven wallets voted, and the proposal received 99.9% approval.
Another attack hit Allbridge Core on July 20. crypto.news reported that the exploiter borrowed $1.12 million in USDC through Kamino, manipulated the protocol’s USDC-USDT pool and extracted more than $1.1 million before routing the funds through privacy tools. Some estimates placed the total liquidity loss near $1.65 million, while Allbridge paused the protocol and began investigating the incident.
Phantom also reported degraded performance for token transfers and swaps on July 12. Account balances and other wallet functions remained available, but the disruption added friction for users during a week in which SOL was already struggling to draw enough demand for a break above $80.
Network activity has provided little relief. Trading on Pump.fun and other speculative venues has fallen from previous peaks, reducing the fee activity that once accompanied Solana’s memecoin boom. Stablecoin balances on the network may offer deployable capital, but holders must exchange those assets for SOL before that liquidity can support the token directly.
Solana price must reclaim $80 to confirm a bullish reversal
The daily chart places the main resistance at $79.96, where SOL’s early-July recovery failed, and sellers pushed the price back toward $75. A daily close above $80 would clear the psychological barrier and reopen the route toward the July swing high around $83, followed by the $90–$98 region.
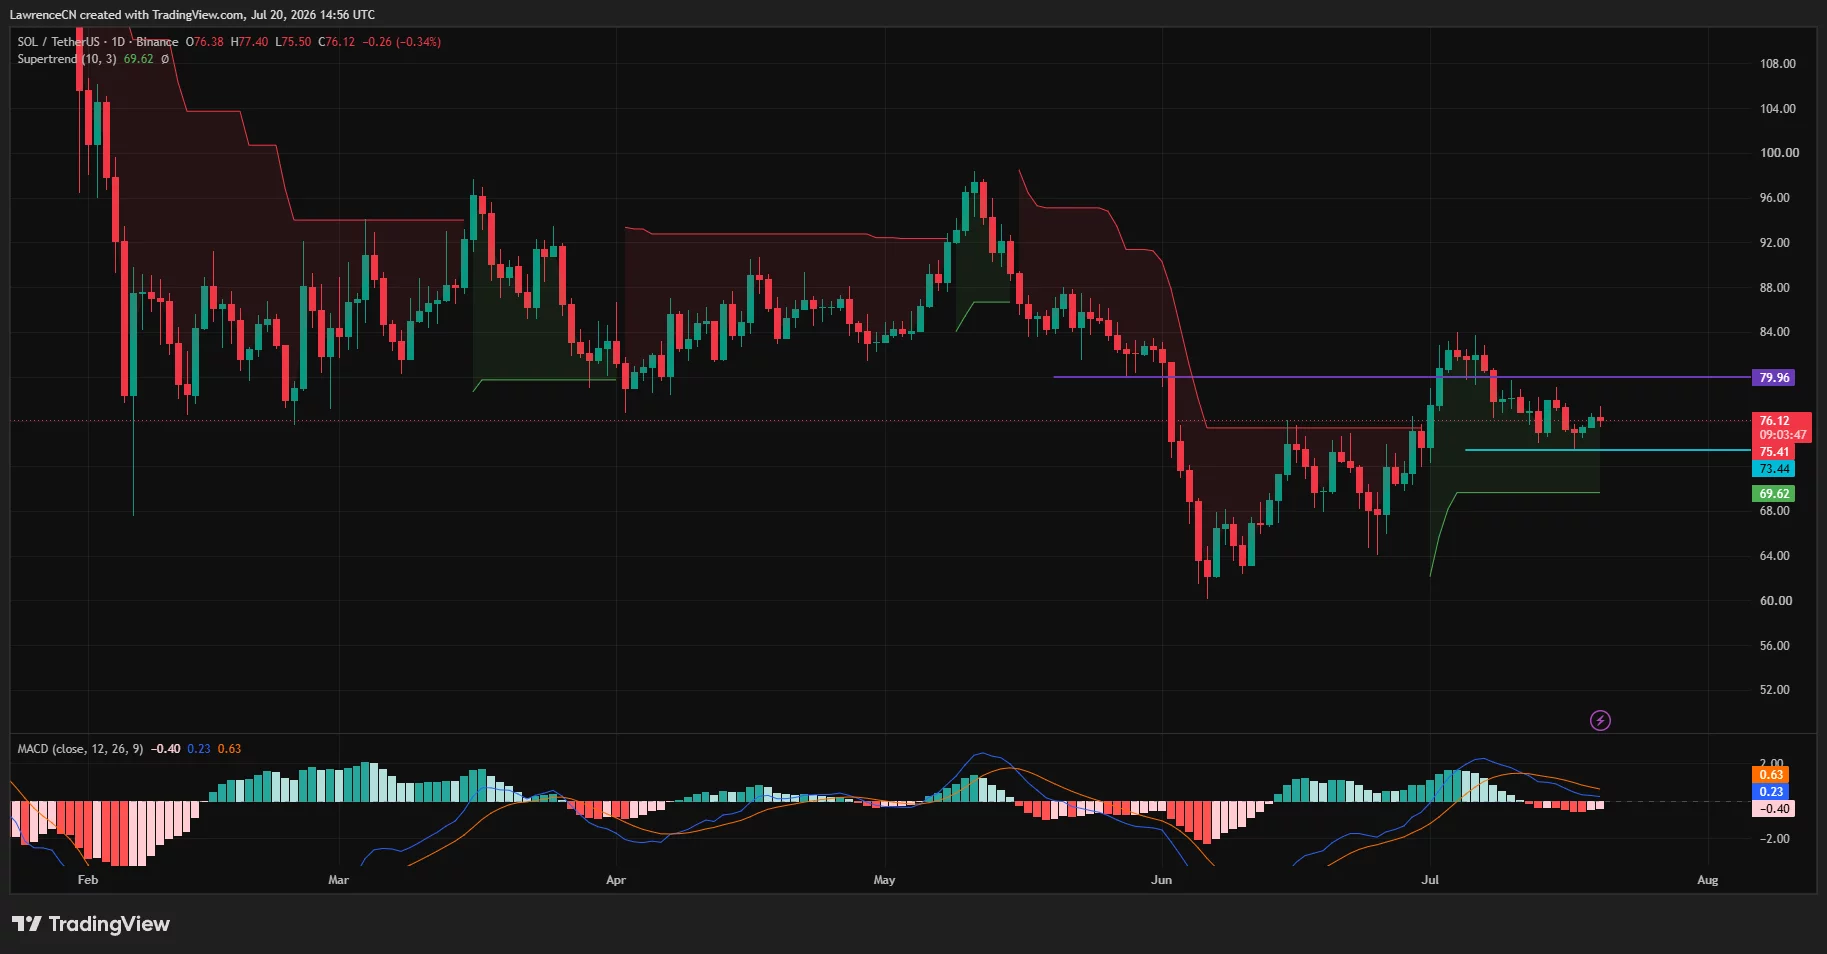
According to analyst Daan Crypto Trades, SOL now sits at a decisive high-time-frame area where its next reaction could set the direction for the coming weeks.
“Either the bulls push through and set a higher low here to take a stab at the range high in the $90s. Or this rejects here and dribbles back down to that mid $60s area.”
Daily momentum has weakened since the early-July rally. The moving average convergence divergence line has dropped to 0.23, below its 0.63 signal line, while the histogram has slipped to minus 0.40. Buyers still control the medium-term structure above the daily Supertrend at $69.62, but the bearish MACD crossover leaves SOL exposed to another test of support.
On the 4-hour chart, SOL remains inside a descending parallel channel that began after the July 3 peak near $83. Price has reached the upper boundary around $76–$77, making a confirmed close above the trendline necessary before traders can treat the latest advance as a breakout.
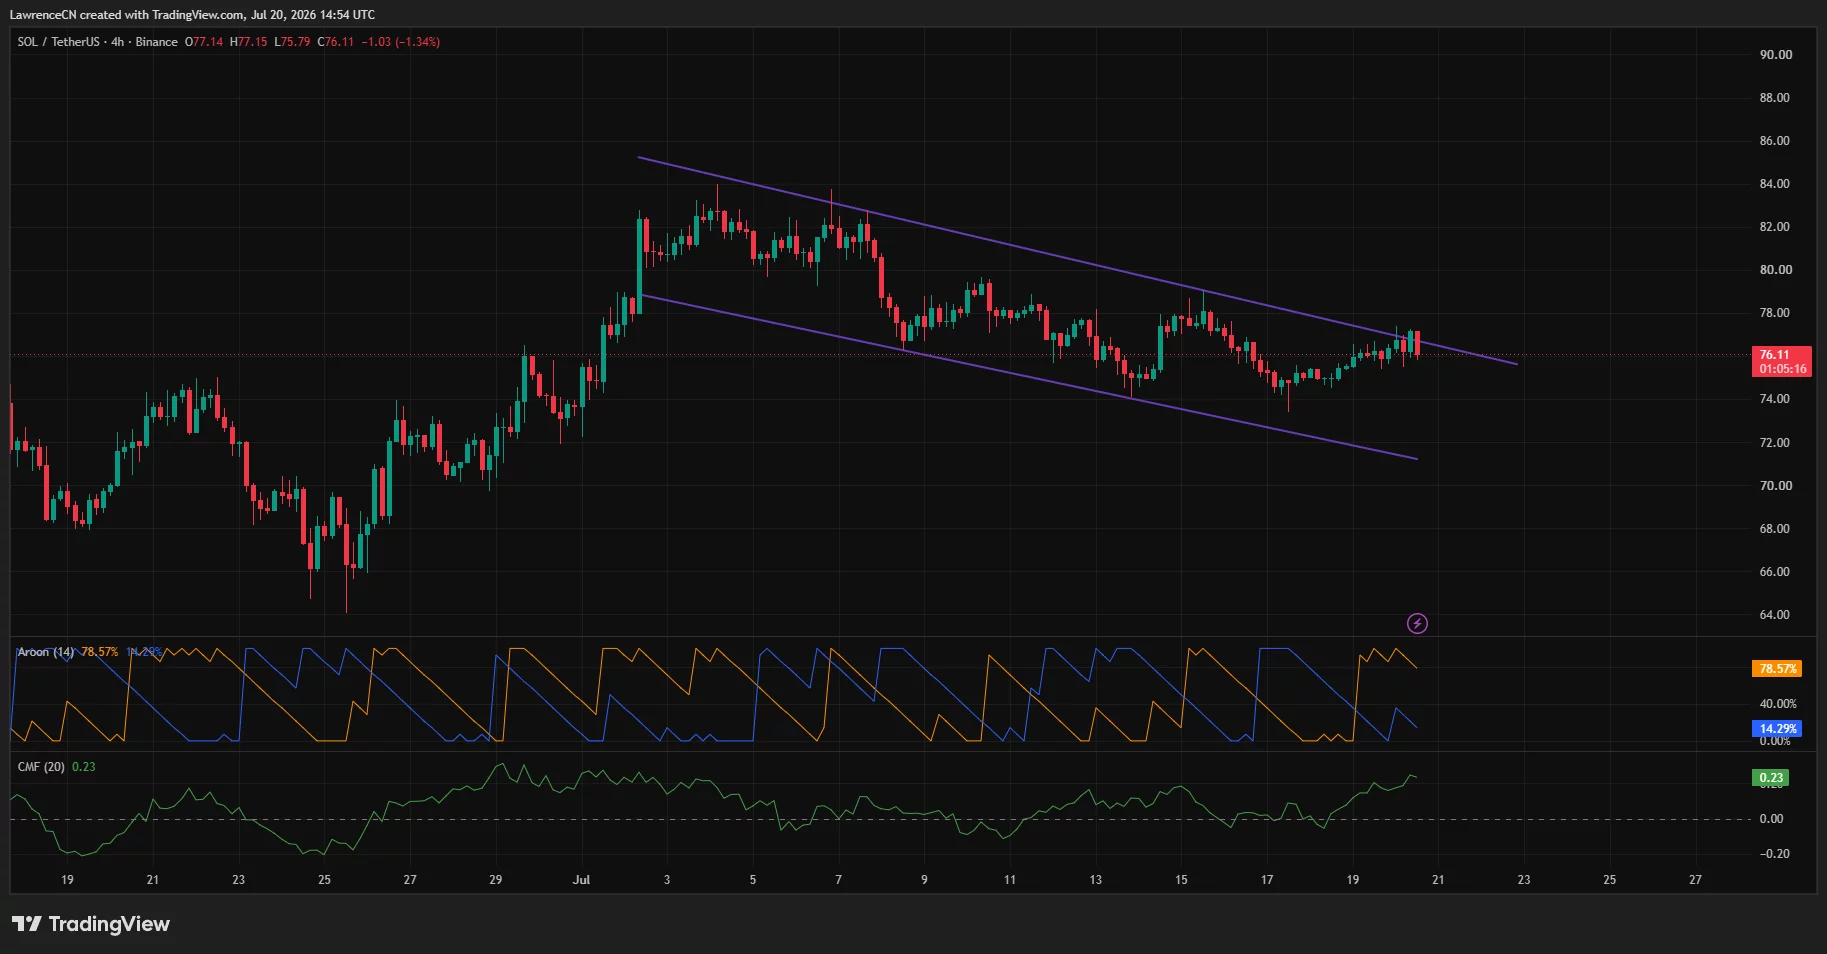
Conflicting momentum readings keep that setup unresolved. Aroon Down stands at 78.57%, compared with Aroon Up at 14.29%, giving sellers the stronger recent trend reading. Chaikin Money Flow, however, sits at 0.23, which shows that net capital flow over the measured period remains positive despite the lower highs.
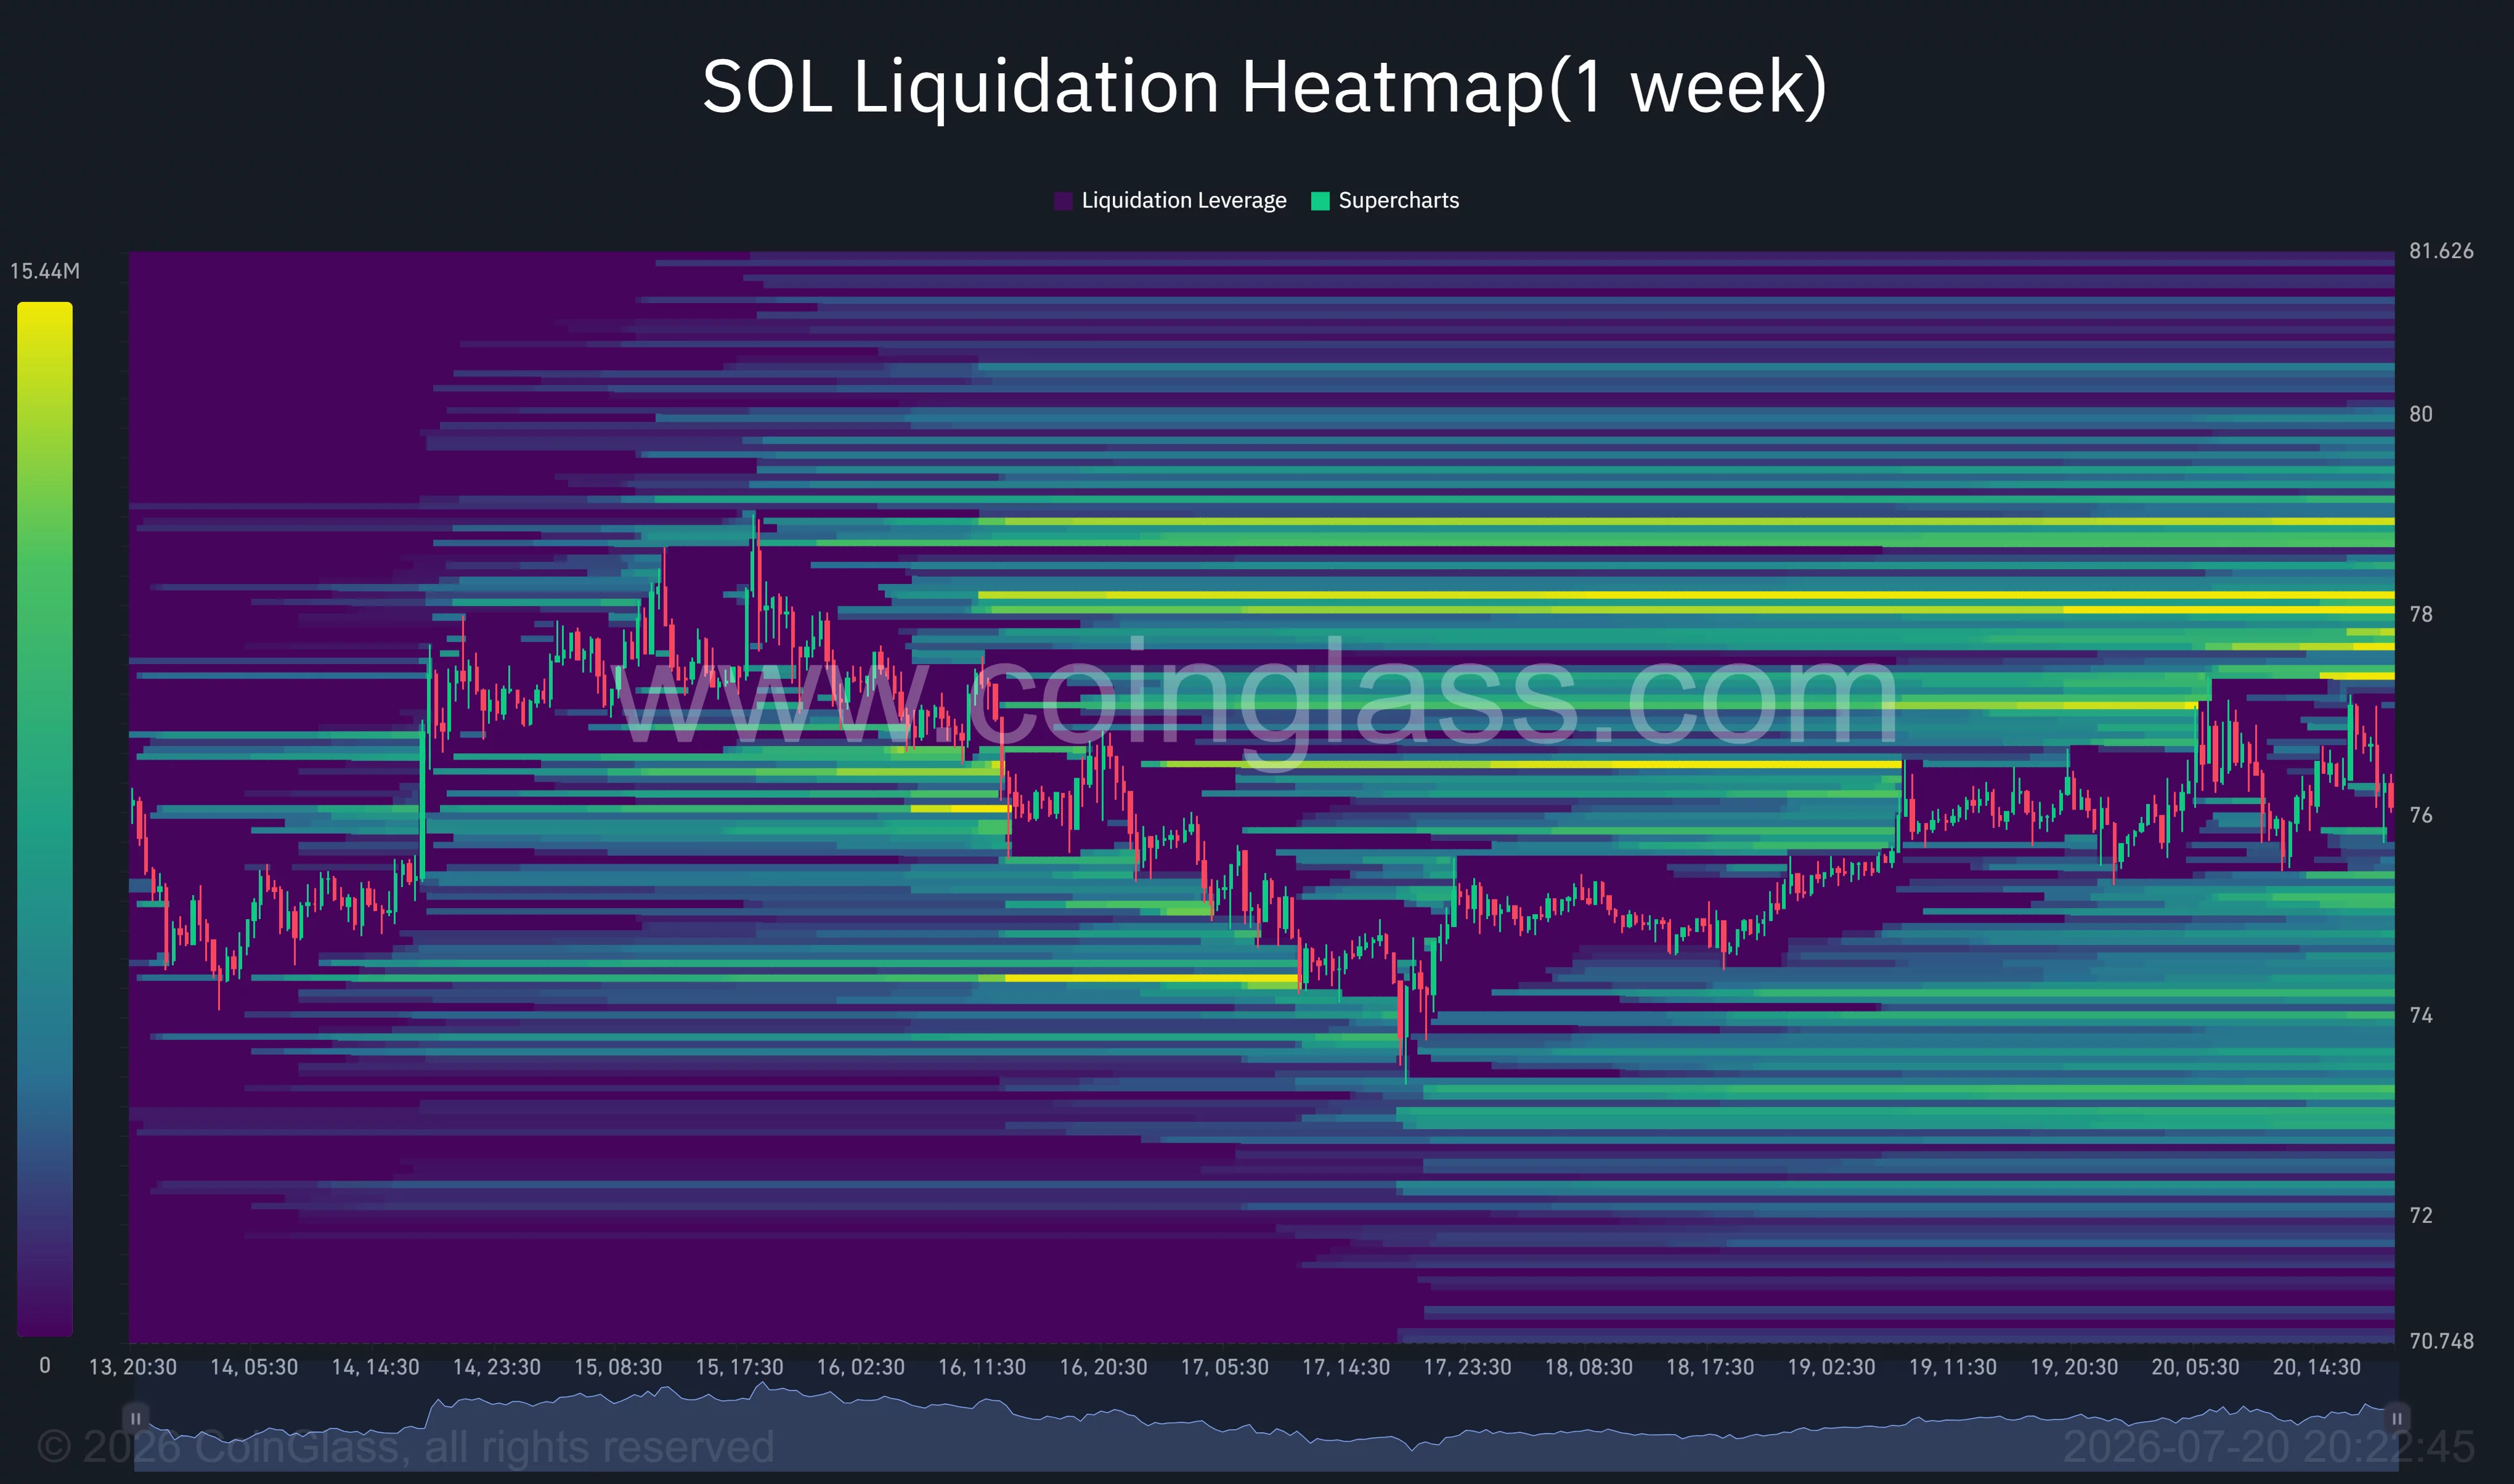
The one-week liquidation heatmap shows concentrated leverage above the market at $77.50–$78.20, with another dense band near $78.80. A move through those levels could force short liquidations and help SOL retest $80. Smaller liquidity pockets sit near $76.40, while downside clusters around $74.20–$75 could draw price lower if buyers lose control of $75.41.
Break below $73 would invalidate the recovery attempt
Immediate support rests at $75.41, followed by the stronger daily level at $73.44. A close below the latter would weaken the higher-low structure and expose the lower edge of the 4-hour channel near $71. The Supertrend at $69.62 would then become the last major defense before Daan’s mid-$60s bearish target returns to view.
Macroeconomic conditions also threaten the setup. Renewed U.S.-Iran hostilities have pushed oil above $90 per barrel and lifted the average U.S. gasoline price back to $4, according to AP. Higher energy costs could keep inflation elevated and limit the Federal Reserve’s room to reduce interest rates.
The 10-year Treasury yield rose to about 4.56% on July 20, while the dollar index held near 100.8. Persistently high yields and a firm dollar could keep institutional portfolios defensive and restrict capital flows into volatile altcoins.
For bulls, the clean confirmation remains a daily close above $80 followed by a successful retest. Until then, SOL remains trapped between positive spot inflows on the 4-hour chart and a weakening daily momentum structure, with $73–$80 defining the next decisive range.
Disclosure: This article does not represent investment advice. The content and materials featured on this page are for educational purposes only.
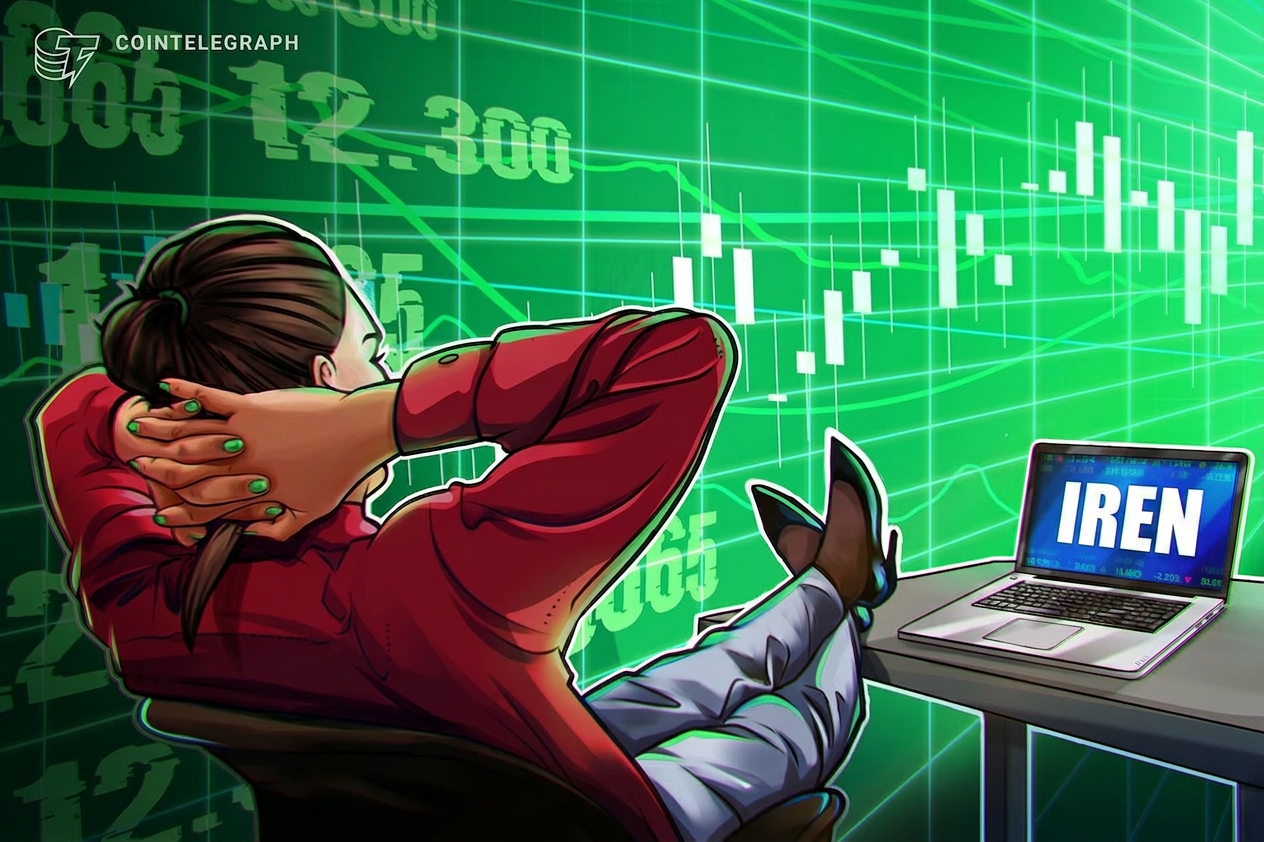
The Bitcoin miner raised its year-end AI cloud revenue target to more than $4 billion after signing $2.8 billion in new contracts with AI developers.

Bitcoin Struggles At $65,000 Amid US-Iran War, Tech-Stock Selling Hurdles
5 Car Brands That Are Bringing Back The V8 Engine

India’s ‘cockroach’ party clashes with police using batons and tear gas in New Delhi


-
 NewsBeat4 days ago
London Mayor Sadiq Khan handed a peerage by Keir Starmer alongside 15 other Labour figures… just days before the PM leaves No10
-

 Fashion3 days ago
Weekend Open Thread – Corporette.com
-
 Politics2 days ago
The House | The City of London can help the new chancellor deliver growth in every postcode
-

 Politics5 days ago
Young campaigners urge incoming PM to act on outdoor junk food ads
-

 Crypto World5 days ago
CFTC blocks Kalshi from unwinding Michigan trades after court order
-
 Crypto World3 days ago
Two July Windows Left: The CLARITY Act’s Senate Fight and What Failure Means
-

 Business5 days ago
Nvidia Stock Slips After Big Tuesday Rally as Huang Confirms Vera Rubin Chip Is Now in Production Today
-
 Crypto World2 days ago
Ripple Payments Joins MiCA With 14 Firms, Does It Mean Anything For XRP?
-

 Politics1 day ago
Democrats look to World Cup watch parties to register thousands of voters
-
 Entertainment5 days ago
Disney’s Most Ambitious Failed Star Wars Attraction Is Coming to SDCC
-

 Crypto World3 days ago
Ripple wins EU-wide access as ESMA adds it to MiCA register
-

 Business5 days ago
Palantir Shares Rise After Expanded Nvidia Partnership and Fresh Analyst Upgrades Ahead of Earnings Day
-

 Crypto World4 days ago
Injective Submits SEC Transfer-Agent Registration to Onchain Ownership Records
-
 Tech6 days ago
Get Your ESP32 Sunny Side Up With This Solar Dev Board
-

 NewsBeat3 days ago
Registration is now open for March for Men with Kev 2026
-

 News Videos6 days ago
XRP BOMBSHELL… XRP OMBOARDED FOR TRANSACTIONS!!!
-

 Tech6 days ago
Dark Secrets Emerge When Jailbreaking LLMs
-

 NewsBeat5 hours ago
Unregistered fitter used Gas Safe logo on business flyers
-
 Sports5 days ago
New Cornerback Enters Vikings Trade Rumor Mill
-

 News Videos3 days ago
Money | Class 12 Economics | CBSE Board Exam 2026-27
You must be logged in to post a comment Login