
Crypto World
CryptoQuant Places Bitcoin Bear Market Bottom at $55,000 as Key Indicators Show Extended Correction Ahead
TLDR:
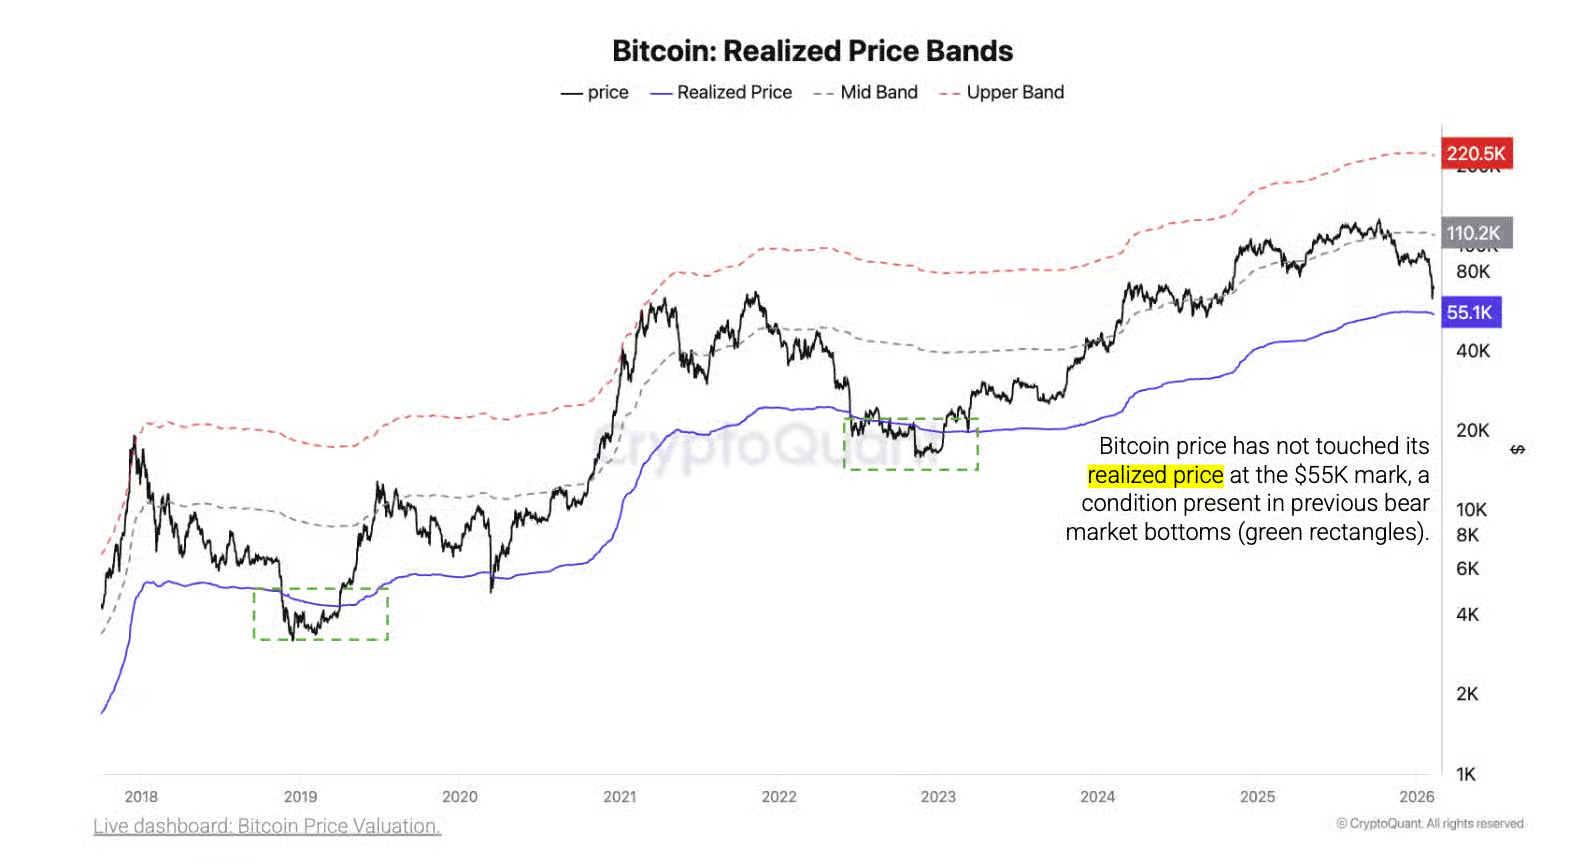
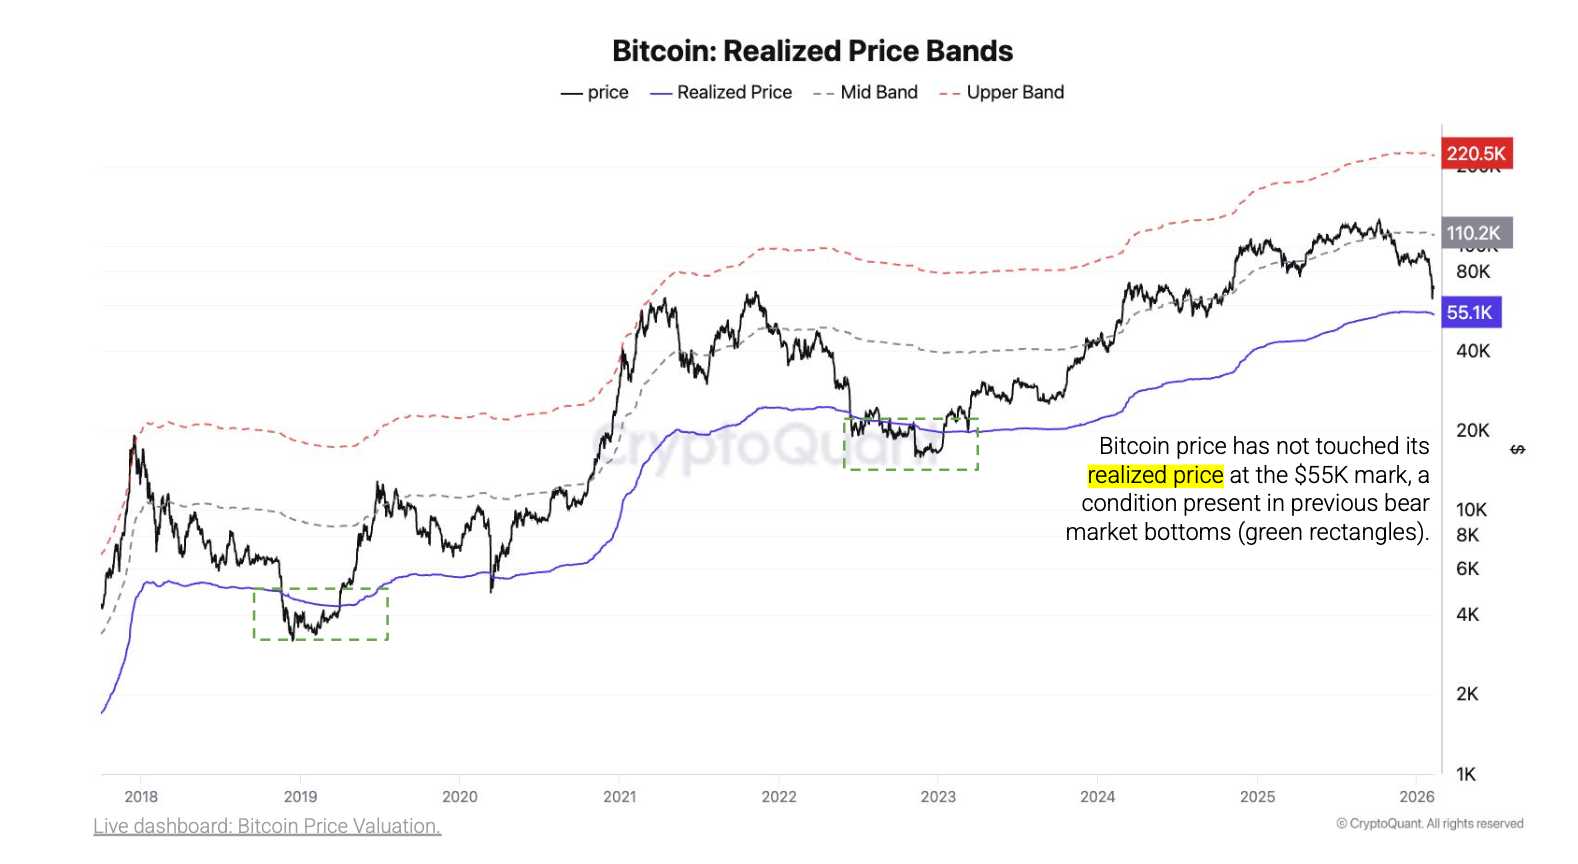
- Bitcoin trades 25% above its realized price of $55,000, which historically marks bear market bottoms
- February 5 sell-off triggered $5.4 billion in daily losses, the largest since March 2023’s $5.8 billion event
- Monthly realized losses at 0.3 million BTC remain far below 2022 bear market bottom of 1.1 million BTC
- Long-term holders selling near breakeven versus 30-40% losses typical at previous bear market cycle lows
Bitcoin’s bear market floor sits around $55,000, according to blockchain analytics platform CryptoQuant. The firm’s latest assessment suggests the cryptocurrency remains more than 25% above this critical support level.
CryptoQuant analysts note that bear market bottoms require several months to establish rather than forming through sudden capitulation events.
This analysis comes as Bitcoin trades significantly higher than key historical support zones that marked previous cycle lows.
Realized Price Indicates Extended Bottoming Process
The realized price metric serves as CryptoQuant’s primary indicator for determining Bitcoin’s potential bottom. This measure calculates the average price at which all coins last moved on the blockchain.
Historical data shows this metric provided strong support during past bear markets. Current trading prices remain elevated compared to this threshold, suggesting additional downside potential exists.
Previous bear cycles demonstrated distinct patterns when Bitcoin approached these levels. During the 2018 downturn, prices dropped 30% below the realized price before stabilizing.
The FTX collapse in 2022 pushed Bitcoin 24% beneath this metric. After reaching these depths, the cryptocurrency spent between four and six months building a foundation before recovery began.
Recent market volatility has not yet pushed Bitcoin into the extreme zones that characterize true bottoms. On February 5, the asset experienced a 14% decline to $62,000, triggering $5.4 billion in realized losses.
This marked the largest single-day loss realization since March 2023, when holders crystallized $5.8 billion in losses. The figure also exceeded the $4.3 billion recorded shortly after the FTX exchange collapsed.
Despite these substantial losses, CryptoQuant maintains that a structural bottom has not materialized. Monthly cumulative realized losses currently stand at 0.3 million BTC, well below the 1.1 million BTC observed at the end of the 2022 bear market. This disparity suggests selling pressure has not reached the intensity associated with cycle lows.
Source: Cryptoquant
Multiple Indicators Show Market Remains Above Capitulation Levels
The MVRV ratio, which compares market value to realized value, has not entered extreme undervaluation territory. This metric historically signals bear market bottoms when reaching deeply depressed levels.
Current readings indicate Bitcoin trades above the ranges that marked previous cycle nadirs. Similarly, the Net Unrealized Profit and Loss metric has not declined to the 20% unrealized loss threshold observed at past bottoms.
Long-term holder behavior provides additional evidence that full capitulation has not occurred. These investors currently sell positions near breakeven prices.
During previous bear market conclusions, long-term holders typically absorbed losses between 30% and 40% before markets reversed. This behavioral difference suggests conviction remains higher than at historical turning points.
Approximately 55% of Bitcoin’s circulating supply remains profitable at current prices. This contrasts with the 45% to 50% range typically observed at cycle lows.
The elevated proportion of profitable holdings indicates many investors entered positions at lower prices and maintain paper gains. Bear market bottoms usually feature a higher percentage of underwater positions across the holder base.
CryptoQuant’s Bull-Bear Market Cycle Indicator remains in the Bear Phase rather than advancing to the Extreme Bear Phase. The latter designation historically marks the beginning of extended bottoming periods.
These extreme phases typically persist for several months, reinforcing the firm’s assessment that bear markets require time to resolve.
Standard Chartered recently adjusted its outlook, projecting Bitcoin could test $50,000 before recovering later this year.


AI-powered Genius Group has sold off its remaining Bitcoin holdings in the first quarter to pay down debt.
Summary
- Genius Group sold its remaining Bitcoin in Q1 to repay debt, stepping back from its earlier commitment to hold the majority of reserves in BTC.
- The company reported a turnaround in performance, with revenue reaching $3.3 million and net profit at $2.7 million after a loss a year earlier.
According to an April 1 press release, the company said it will “recommence building its Bitcoin Treasury when it believes market conditions are more favorable,” outlining that the exit is tied to timing rather than a full departure from its digital asset strategy.
The firm first committed to a “Bitcoin first” approach back in November 2024, stating that 90% or more of its reserves would be held in BTC. The latest move marks a break from that position as liquidity needs took priority.
Genius Group reported holding 84 BTC, valued at about $5.7 million, as of March 2026. Its Bitcoin balance had been declining since April 2025, when a US court temporarily blocked treasury expansion. The company resumed purchases in June, but the latest sale has now reduced its holdings to zero, according to data from Bitcoin Treasuries.
Revenue for the quarter rose 171% year-on-year to $3.3 million, while gross profit increased 228% to $2 million. A $500,000 operating loss recorded in Q1 2025 turned into a $2.7 million net profit in Q1 2026.
Similar decisions have surfaced across the sector as companies adjust balance sheets.
MARA Holdings sold 15,133 BTC in March for roughly $1.1 billion, reducing its treasury to 38,689 BTC and pushing it down to the third-largest corporate holder. The bulk of the proceeds went toward repurchasing about $1 billion in convertible senior notes, with the remainder allocated to general corporate use.
Similarly, mining company Bitdeer liquidated its entire 943 BTC balance in February and also sold newly mined coins, reducing its corporate holdings to zero. Among other firms, Cango Inc. sold 4,451 BTC to cut exposure, while GD Culture Group approved the sale of part of its 7,500 BTC reserve.
The CLARITY Act’s Senate Banking Committee markup could find a direction in April, and three Made in USA coins are approaching technical inflection points that could determine their direction for the month.
BeInCrypto analysts have identified setups across three popular US-origin coins where regulatory clarity, on-chain fundamentals, and chart structures are converging at the same time. Each token offers a different risk profile heading into April.
Stellar (XLM)
Stellar enters April with the strongest alignment between fundamental catalysts and technical structure among the three Made in USA coins on this list. The CLARITY Act’s April markup directly benefits Stellar as an ISO 20022-compliant payments rail. Franklin Templeton’s BENJI tokenized fund continues to operate on Stellar, and the network now holds over $1.4 billion in real-world asset value according to rwa.xyz data.
Want more token insights like this? Sign up for Editor Harsh Notariya’s Daily Crypto Newsletter here.
The daily chart shows an inverse head-and-shoulders pattern forming since late January. The neckline sits near $0.190, and a breakout would target a 21.24% measured move to $0.234.
The Relative Strength Index (RSI), a momentum indicator that tracks the speed of price changes, supports the case. Between January 25 and March 29, price printed a lower low while RSI printed a higher low. That bullish divergence is still active. Previously, when a similar divergence confirmed, around March 22, Stellar surged approximately 21%.
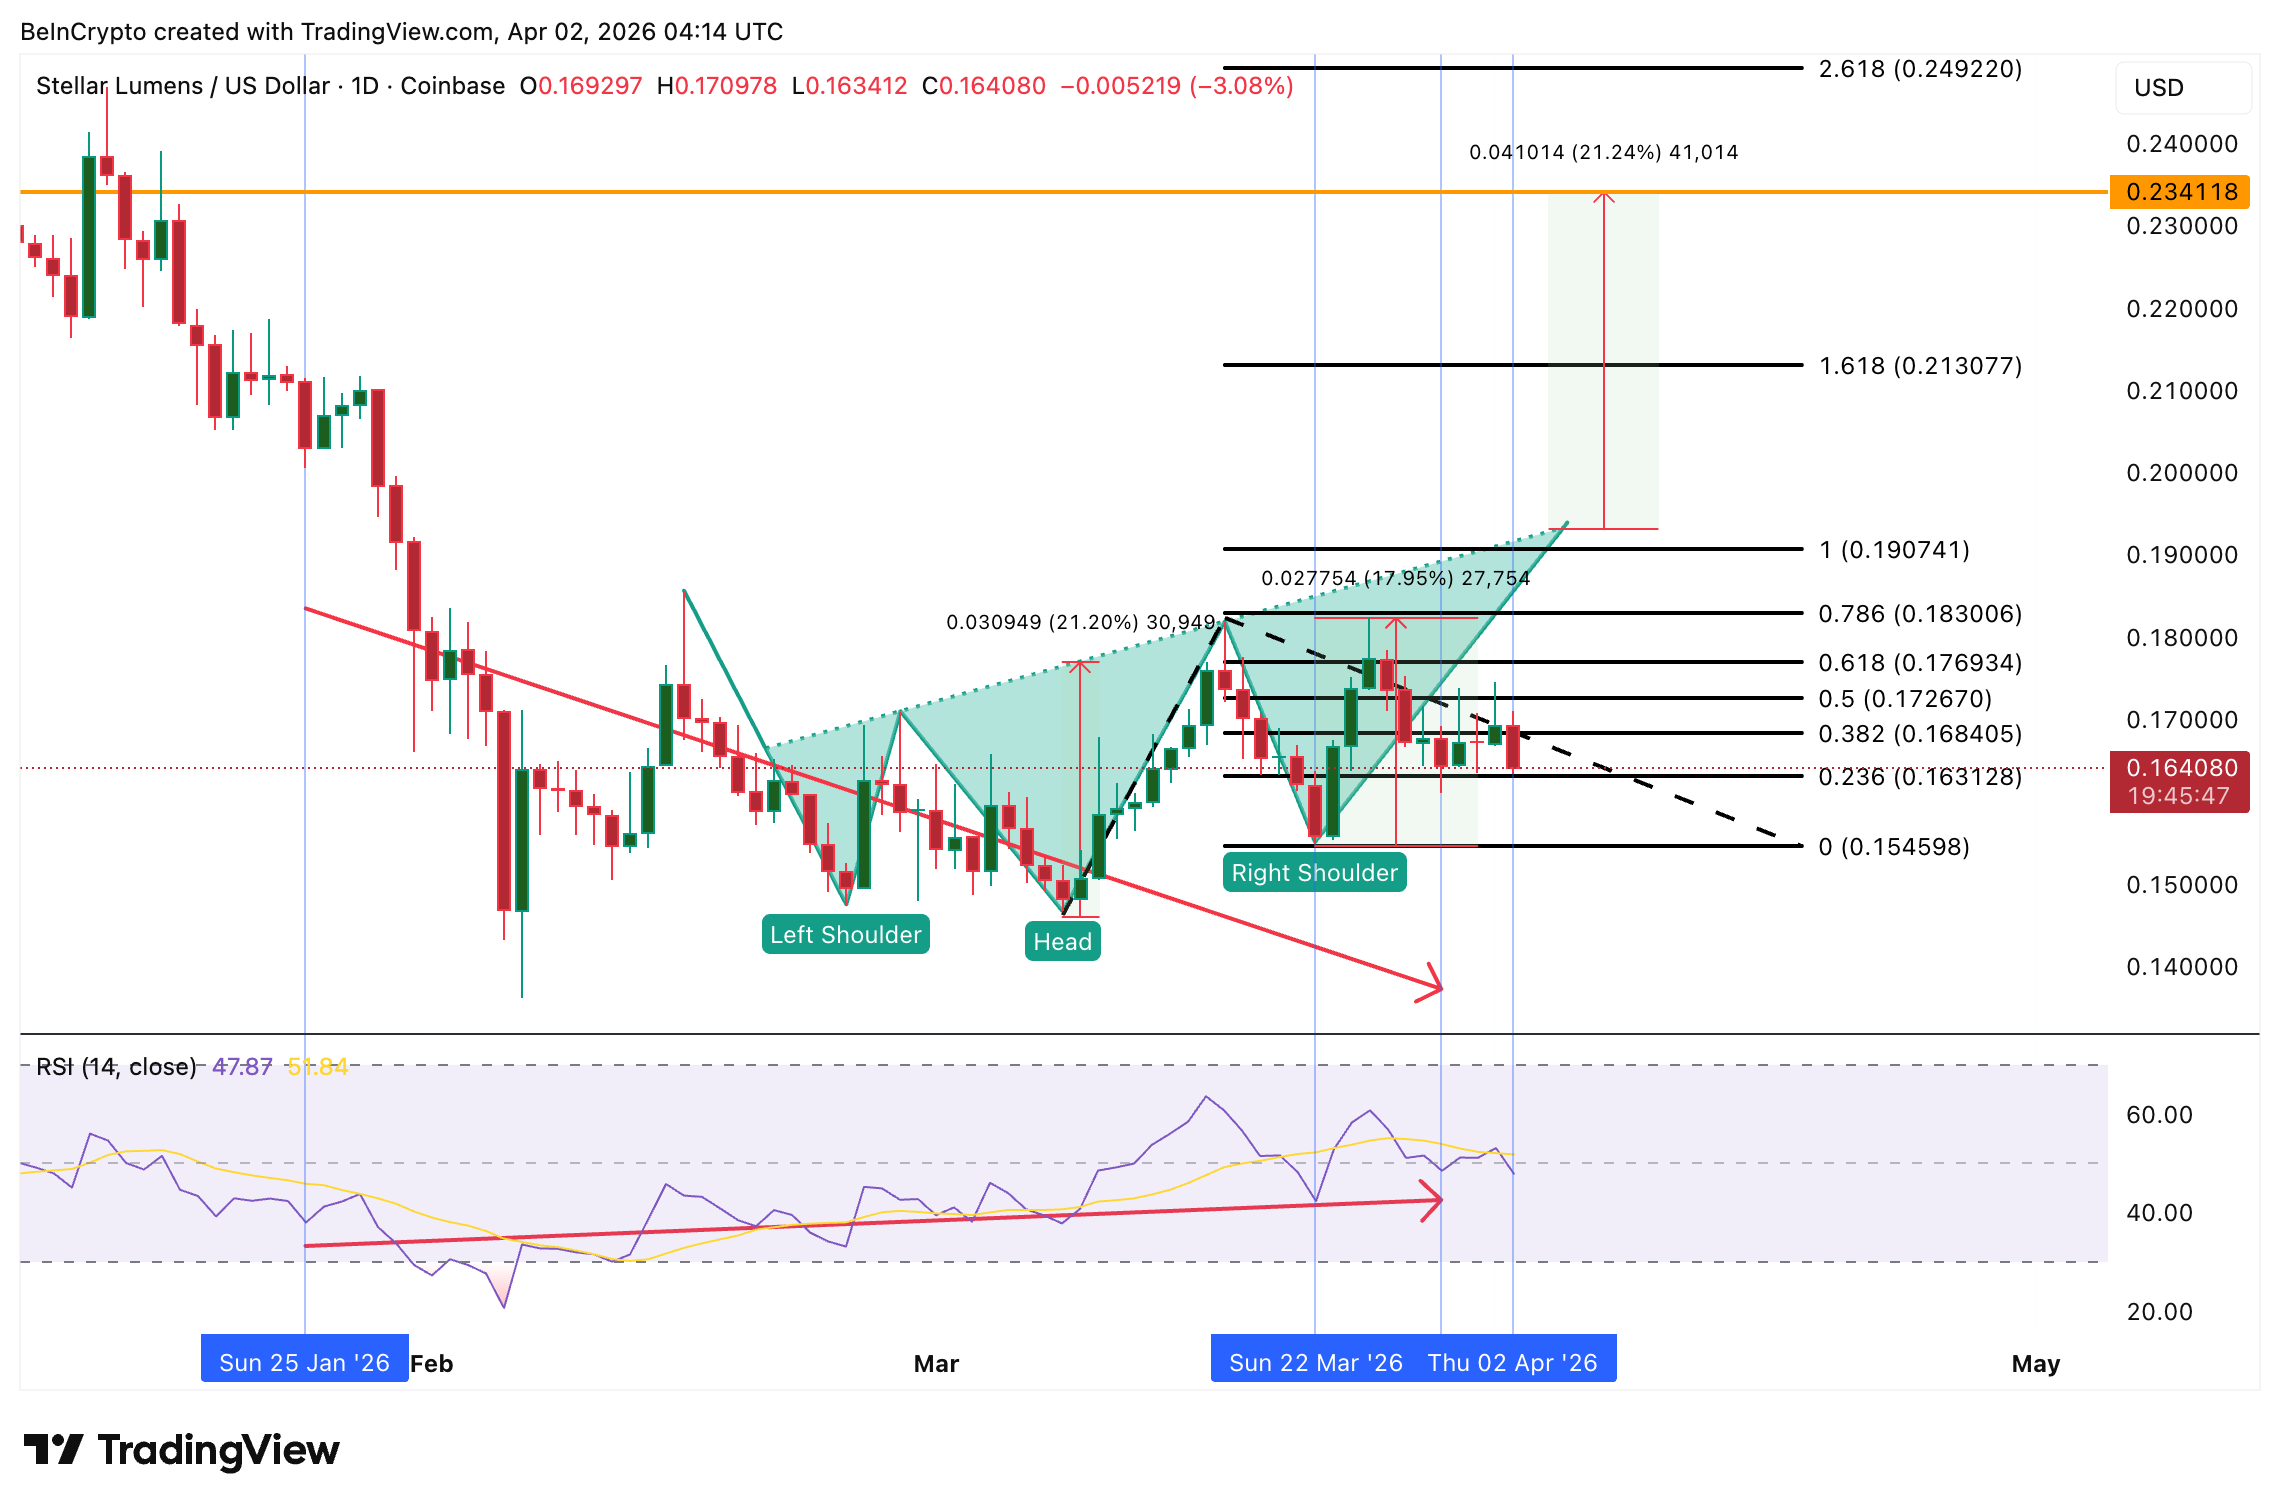
If the April 3 XLM price candle forms above $0.163, another divergence layer confirms. The first hurdle sits at $0.176, the 0.618 level. A fall below $0.154 would invalidate the entire inverse head-and-shoulders structure. $0.163 separates an active divergence-driven rally toward $0.190 from a structural failure below $0.154.
Cardano (ADA)
Cardano is the bearish counterweight on this list despite carrying the strongest single April catalyst among Made in USA coins as Volatility Shares just debuted live 2x leveraged ETFs and standard futures exposure for Cardano.
The Midnight privacy sidechain launched in Q1 2026 with Google Cloud, MoneyGram, and Vodafone as validators. Yet the chart is not responding to these triggers.
The daily chart shows a bearish triangle pattern with the lower trendline sitting at $0.2327. ADA is down 13% over the past 30 days and 4.07% in the latest session, pressing closer to that support with each candle.
A hidden bearish divergence is adding pressure. Between February 6 and April 1, price made a lower high while RSI made a higher high. This pattern typically signals that the existing downtrend retains control even when short-term momentum improves temporarily.
A break below $0.232 exposes $0.219, the base of the measured structure. The first recovery level sits at $0.271. Only a sustained push above $0.354, the 0.618 level, would shift the bias to bullish.
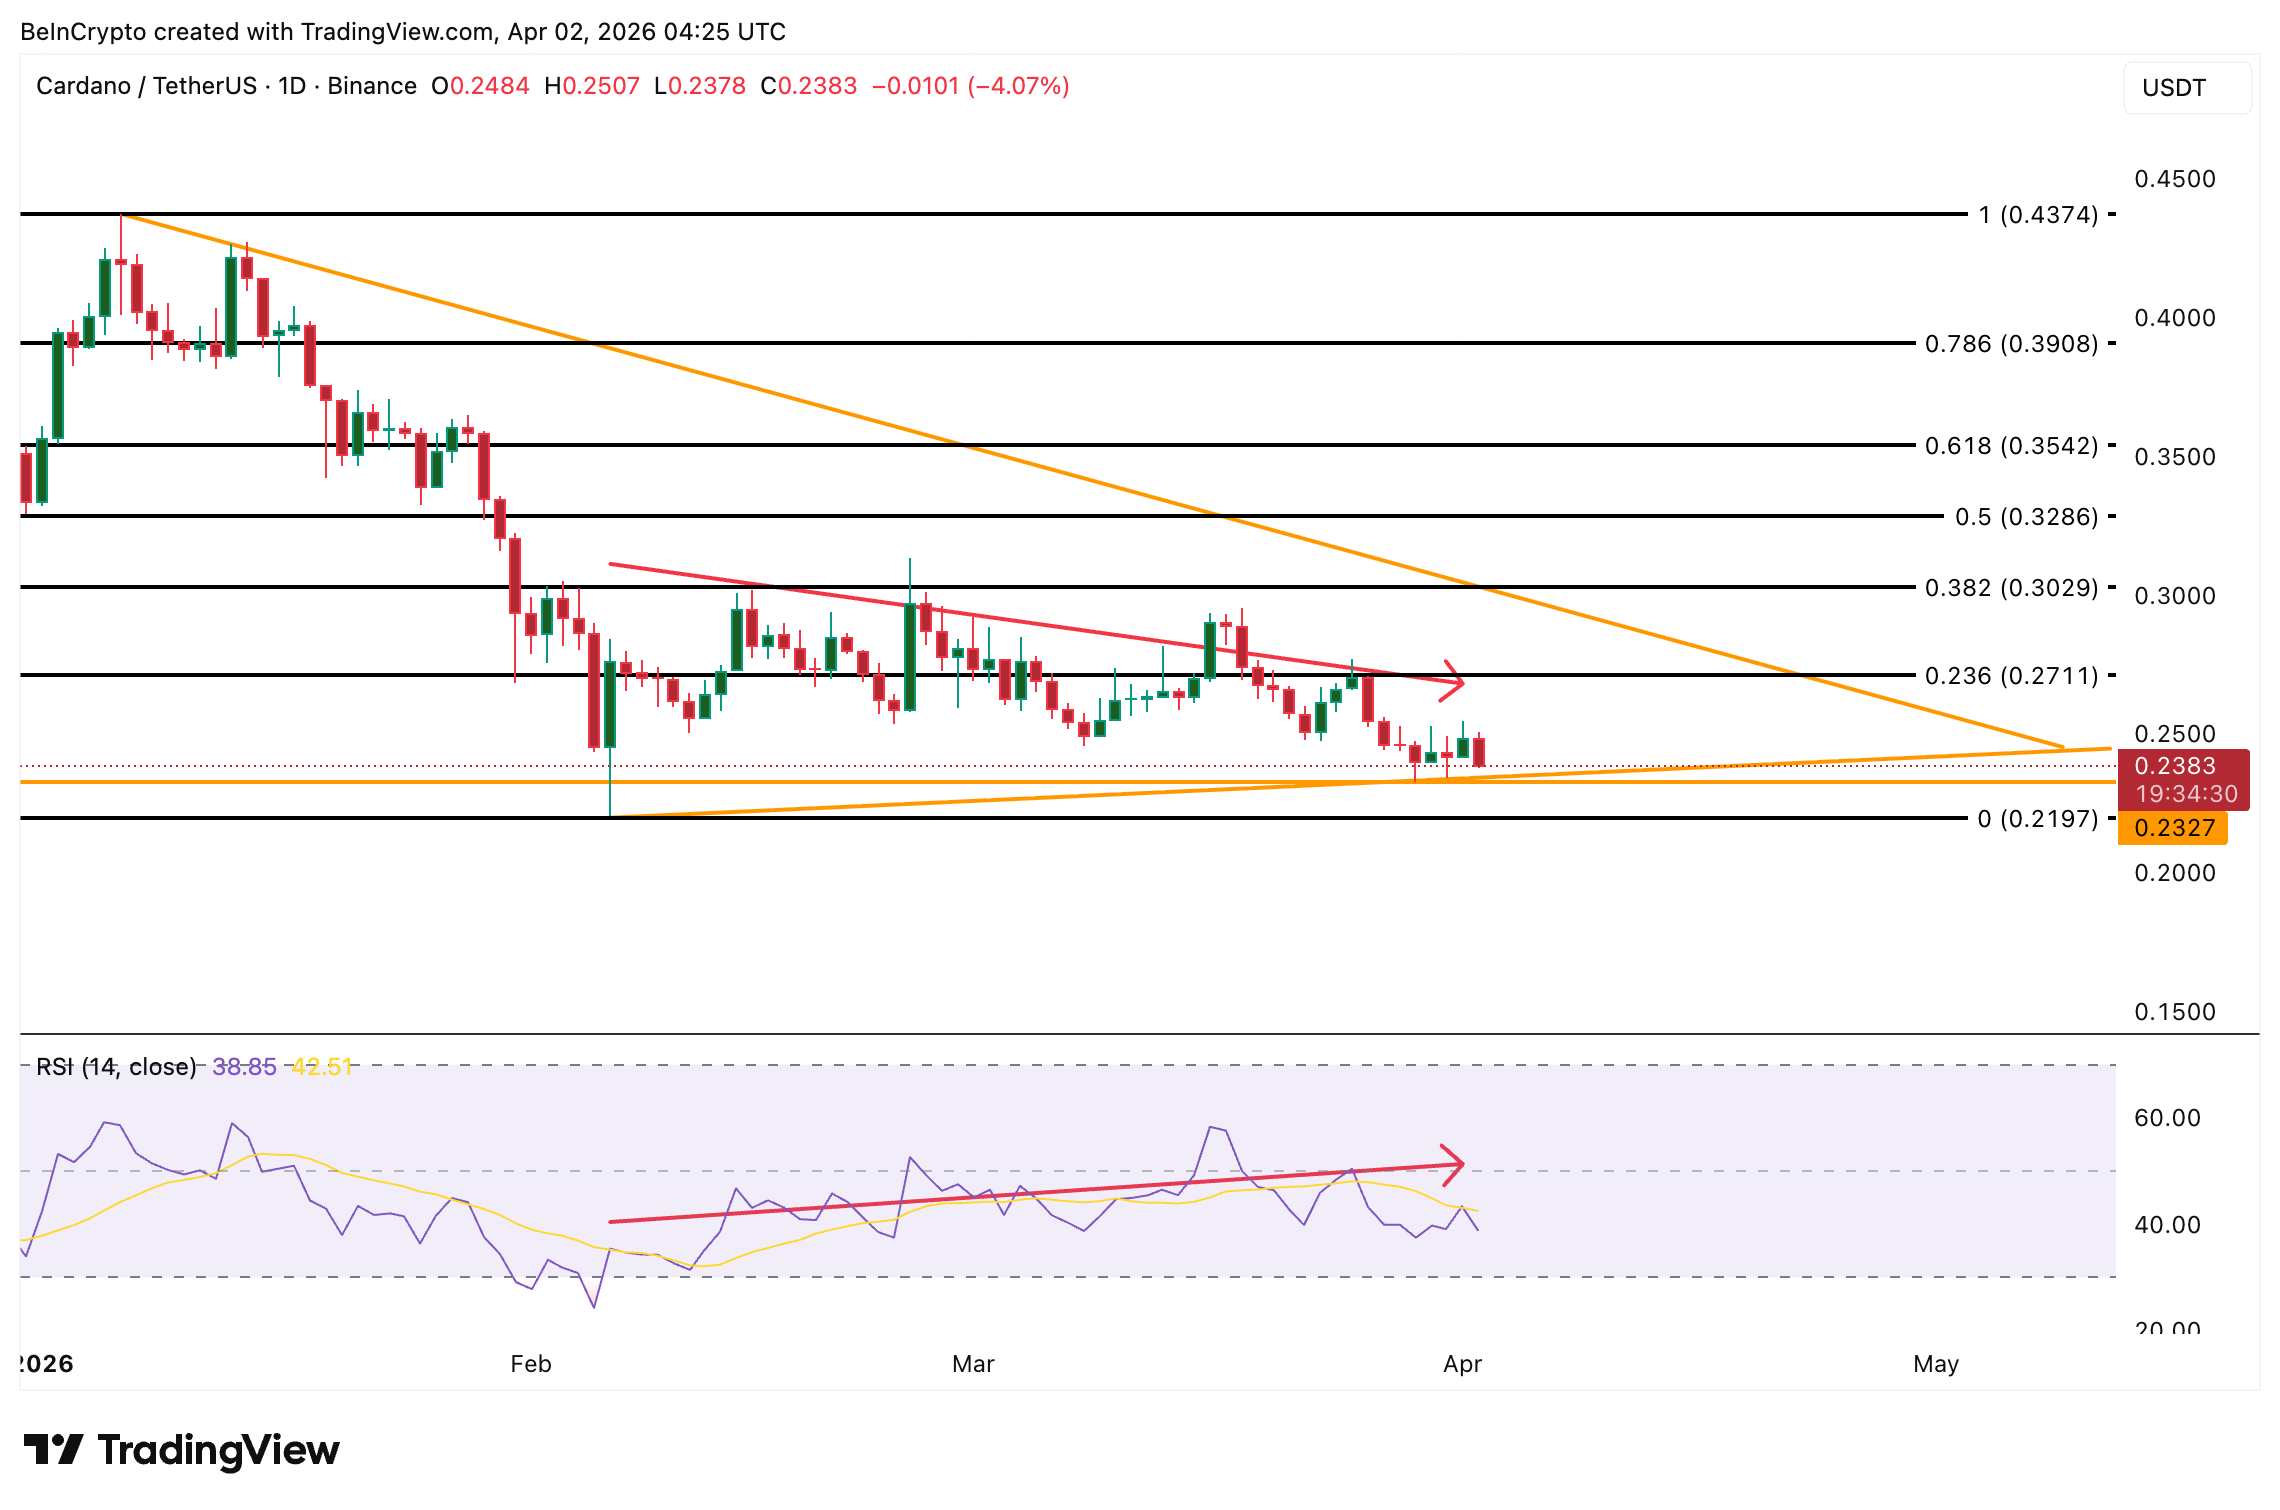
Until then, the pending ETF filings and Midnight launch remain catalysts without chart confirmation. Per the chart, $0.232 separates a contained triangle consolidation from a fresh breakdown to new year-to-date lows at $0.219.
Algorand (ALGO)
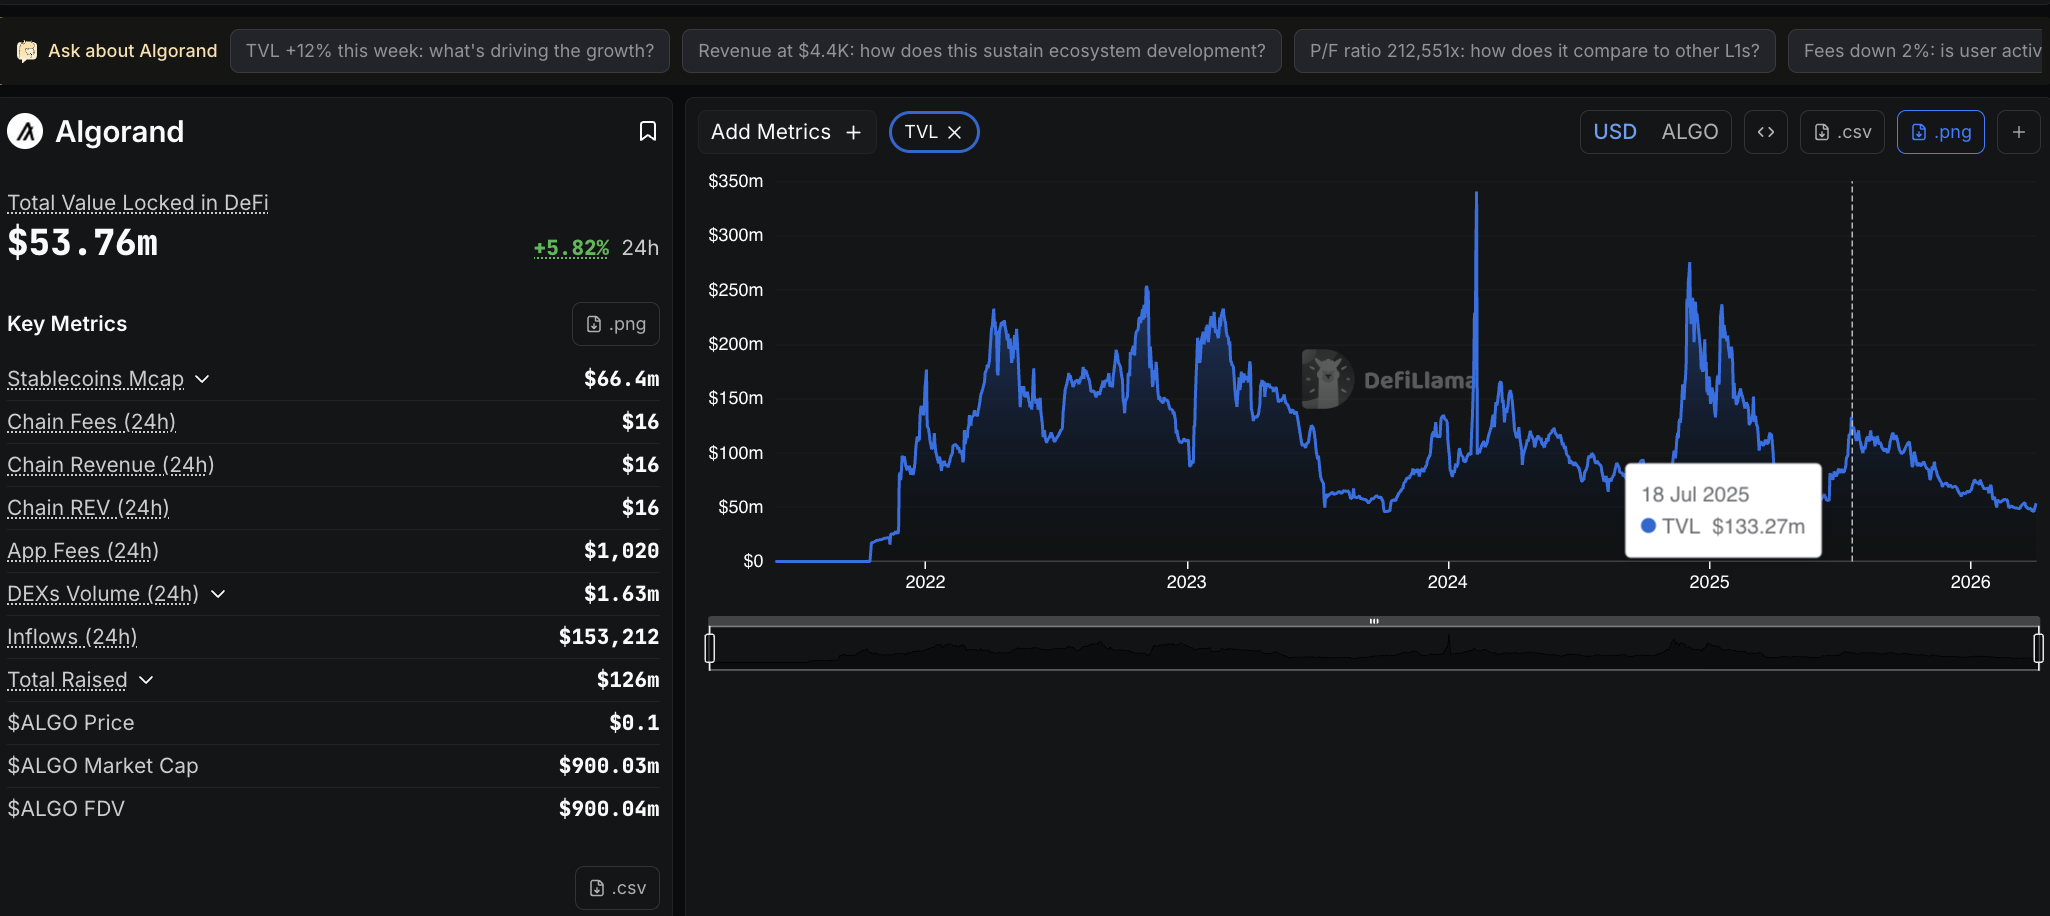
Algorand is the most conflicted of the three tokens heading into April. Allbridge Core, a cross-chain bridge protocol that allows users to move stablecoins between different blockchain networks without wrapping them, enabled native USDC transfers to Algorand from Solana, Ethereum, Base, Sui, and Stellar earlier this year.
The integration gives Algorand a direct stablecoin on-ramp from five major ecosystems for the first time, addressing one of its longest-standing liquidity gaps.
However, Algorand’s DeFi total value locked has dropped from $133.27 million in July 2025 to $53.76 million according to DefiLlama data. That 60% decline in on-chain activity stands in contrast with the 15% monthly price gain, creating a disconnect between price and fundamental usage.
The daily chart shows a possible bull flag and pole pattern with a pole height of approximately 39%. A pullback is now building. Between January 5 and April 1 (broader timeframe), price made a lower high while RSI made a higher high, a hidden bearish divergence that hints at weakening upward momentum and a pullback.
April’s direction depends entirely on whether $0.095 holds. A daily close above $0.095 keeps the flag structure intact and preserves a path toward $0.104, followed by the full projection near $0.145.
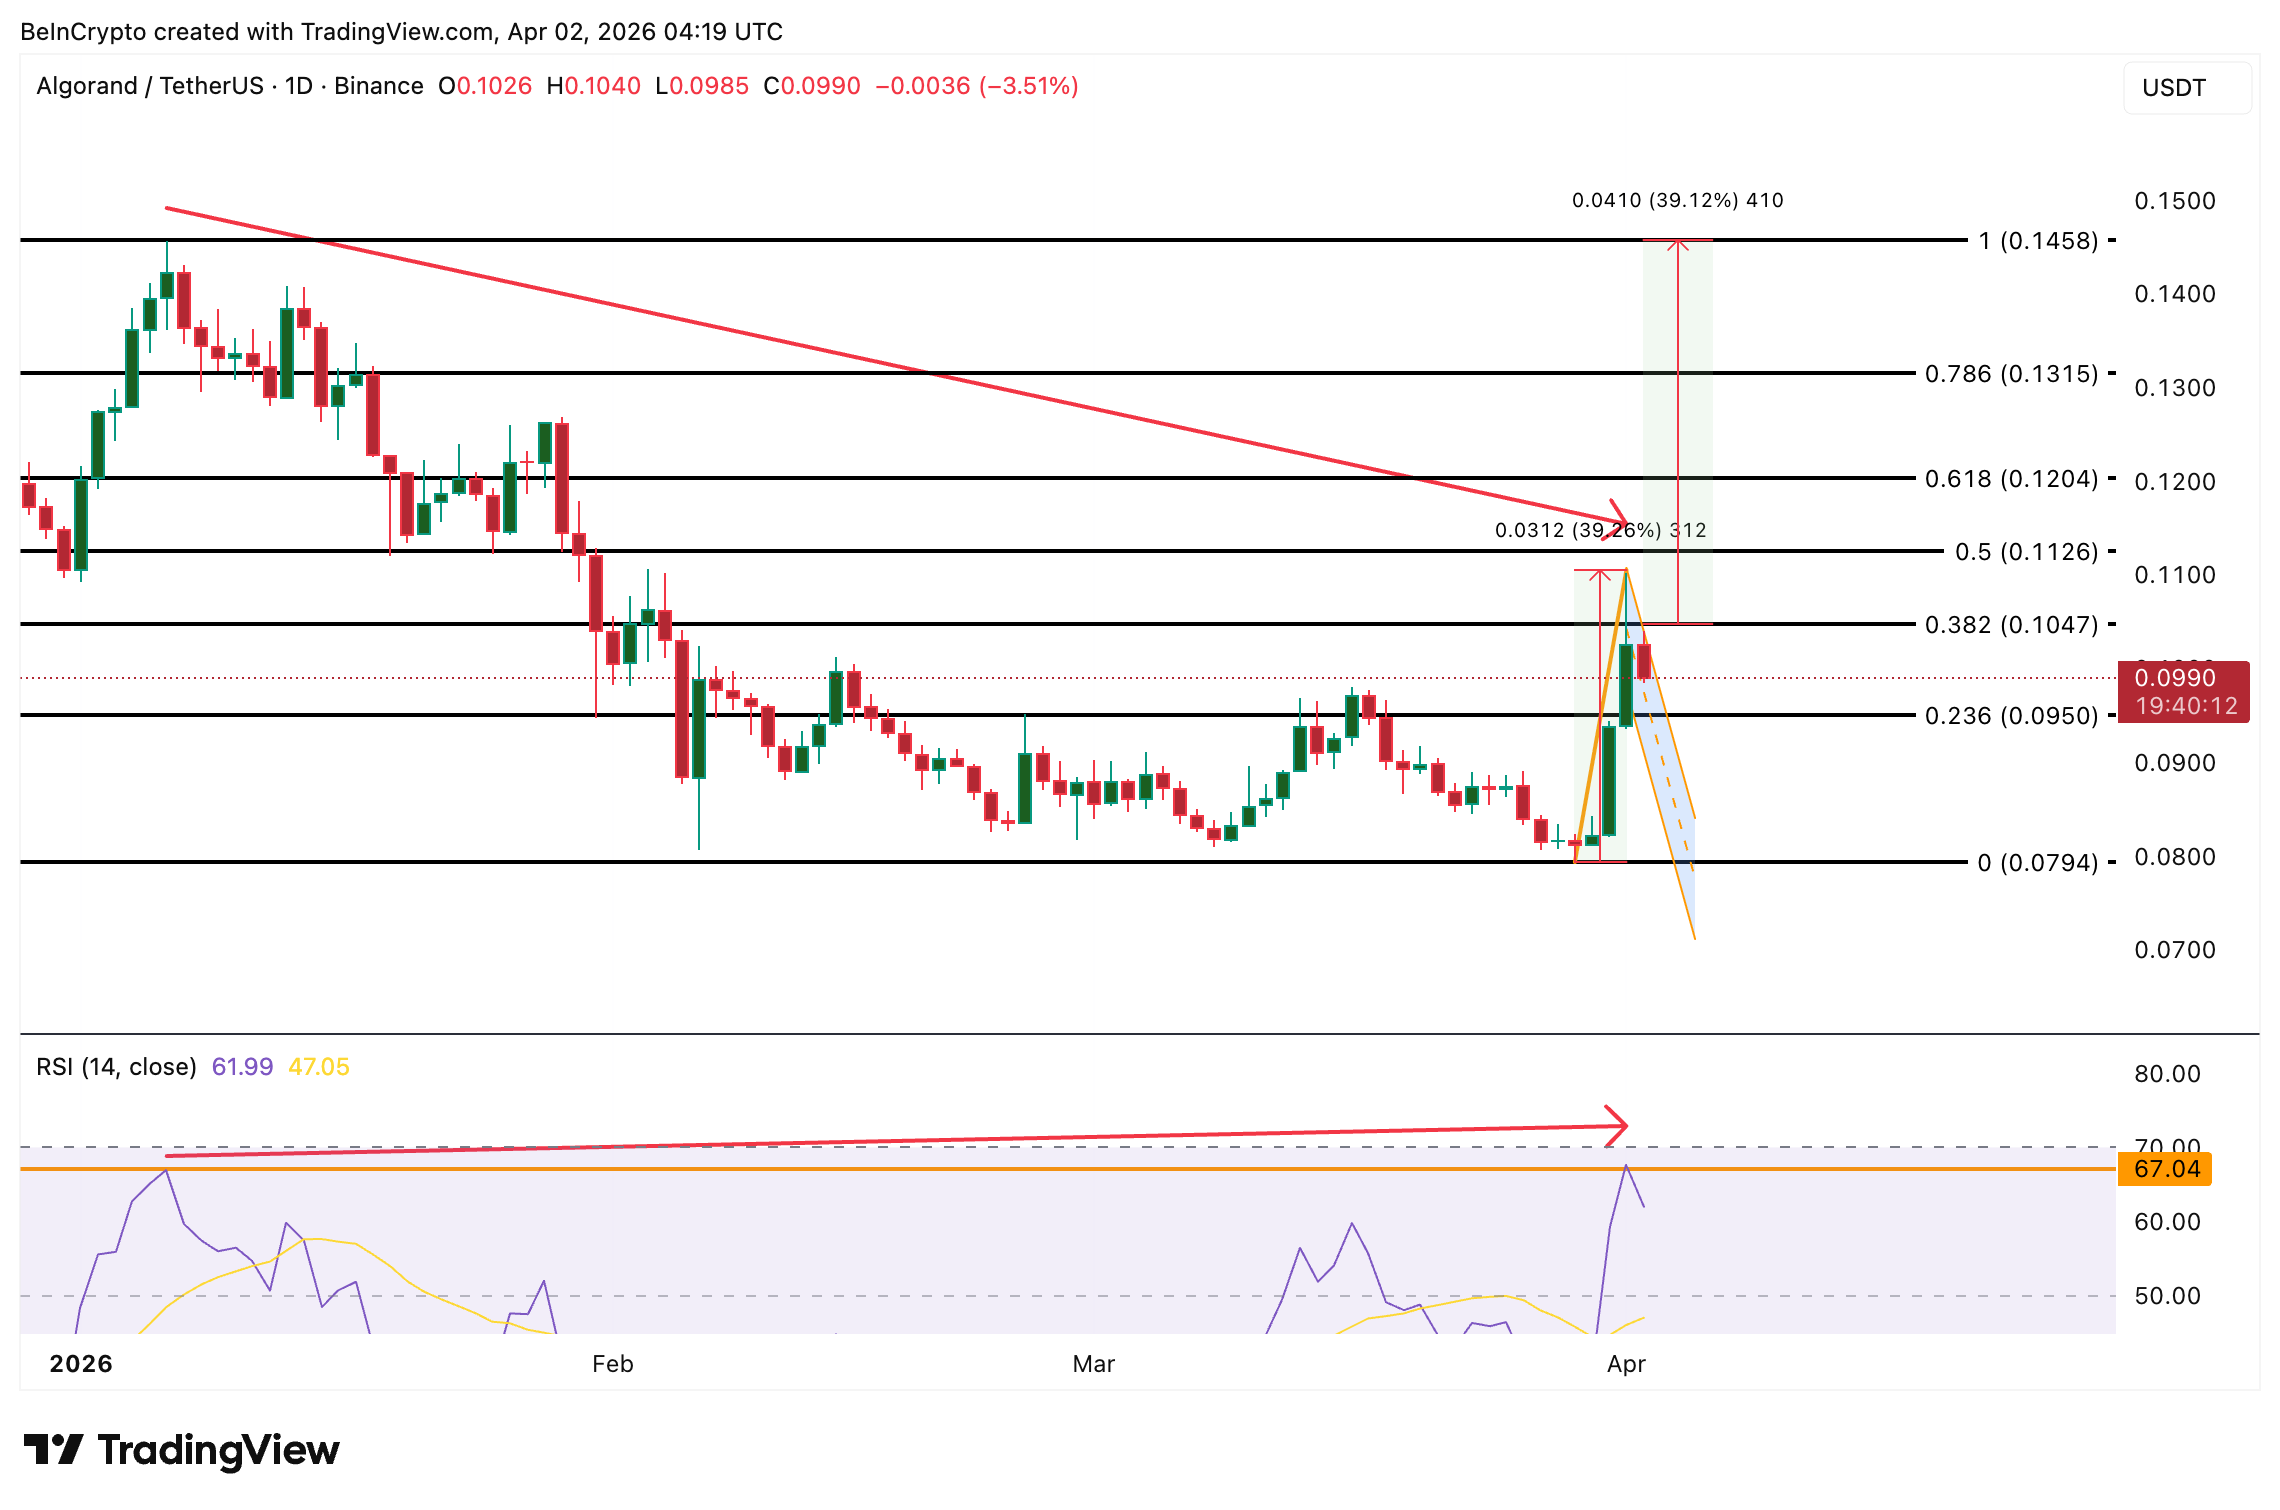
A break below $0.095 invalidates the bullish flag hypothesis. That would also open a risk to $0.079.
For now, $0.095 separates a 39% bull flag projection from a structural failure that aligns with Algorand’s declining DeFi fundamentals.
The post 3 Made In USA Coins To Watch In April 2026 appeared first on BeInCrypto.


Crypto-focused venture capital firm Paradigm is reportedly building a prediction markets terminal, joining a wider push by exchanges, brokers and crypto firms into prediction markets.
Led by Paradigm partner Arjun Balaji, the prediction market offering will cater to professional traders and market makers, Fortune said in a report on Wednesday, citing sources that said they started working on the project in late 2025.
Paradigm’s offering adds to a growing list of companies looking to offer access to prediction markets, which some forecast could reach $1 trillion in annual volume by the end of the decade.
Paradigm is also considering rolling out an internal market-making desk — an in-house team that provides liquidity by placing buy and sell orders — for prediction markets.
One of the sources told Fortune that Paradigm is also working with researchers to explore the feasibility of creating prediction market indexes.
“This would entail bundling multiple prediction markets together into one tradable package, much like the S&P 500 combines the stocks of 500 companies into one index,” Fortune said.
Cointelegraph reached out to Paradigm for additional information, but didn’t receive an immediate response.
Related: CFTC’s top enforcer puts prediction market insider traders on notice
Prediction markets became one of the fastest-growing use cases in crypto last year and have consistently surpassed $10 billion in monthly trading volume.
Coinbase and Gemini have since launched prediction market offerings, while Nasdaq and Cboe are seeking permission to offer prediction market-style binary options.
Paradigm had been looking at ways to get involved in the burgeoning market. It led Kalshi’s $185 million Series C funding round in June and its $1 billion Series E round in December.
The venture capital firm has also created a dashboard showing trading volume and open interest on Polymarket, Kalshi and other platforms across sports, crypto, politics, culture, financials and other topics.
new from paradigm: we are building a tool for exploring prediction market data
try it out today. I bet you’ll find new markets you never knew existed pic.twitter.com/HtDBWtFoys
— storm (@notnotstorm) February 4, 2026
Legal issues over prediction markets still being ironed out
Kalshi and its biggest competitor, Polymarket, have been dominating prediction markets trading volume. However, other challengers, such as OPINION and predict.fun, have also seen an uptick in trading activity recently.
The rapid growth of the prediction markets space has attracted regulatory scrutiny, with critics concerned that the platforms encourage insider trading and market manipulation, while event contracts based on sporting events are a form of sports betting.
US regulators at the federal and state levels are hashing out who should have jurisdiction in regulating prediction markets, while some regulators abroad have outright banned certain prediction market platforms.
Magazine: IronClaw rivals OpenClaw, Olas launches bots for Polymarket — AI Eye
Bitcoin (BTC) saw another $69,000 rejection on Thursday as risk-assets suffered over US-Iran war headlines.
Key points:
-
Bitcoin faces fresh downside pressure as stocks and gold fall on US President Donald Trump’s address to the nation.
-
US dollar strength ramps up on the back of an anticipated breakout to yearly highs.
-
Bitcoin would face “new lows” from a dollar comeback, a trader warns.
Bitcoin, stocks and gold all fall on Trump address
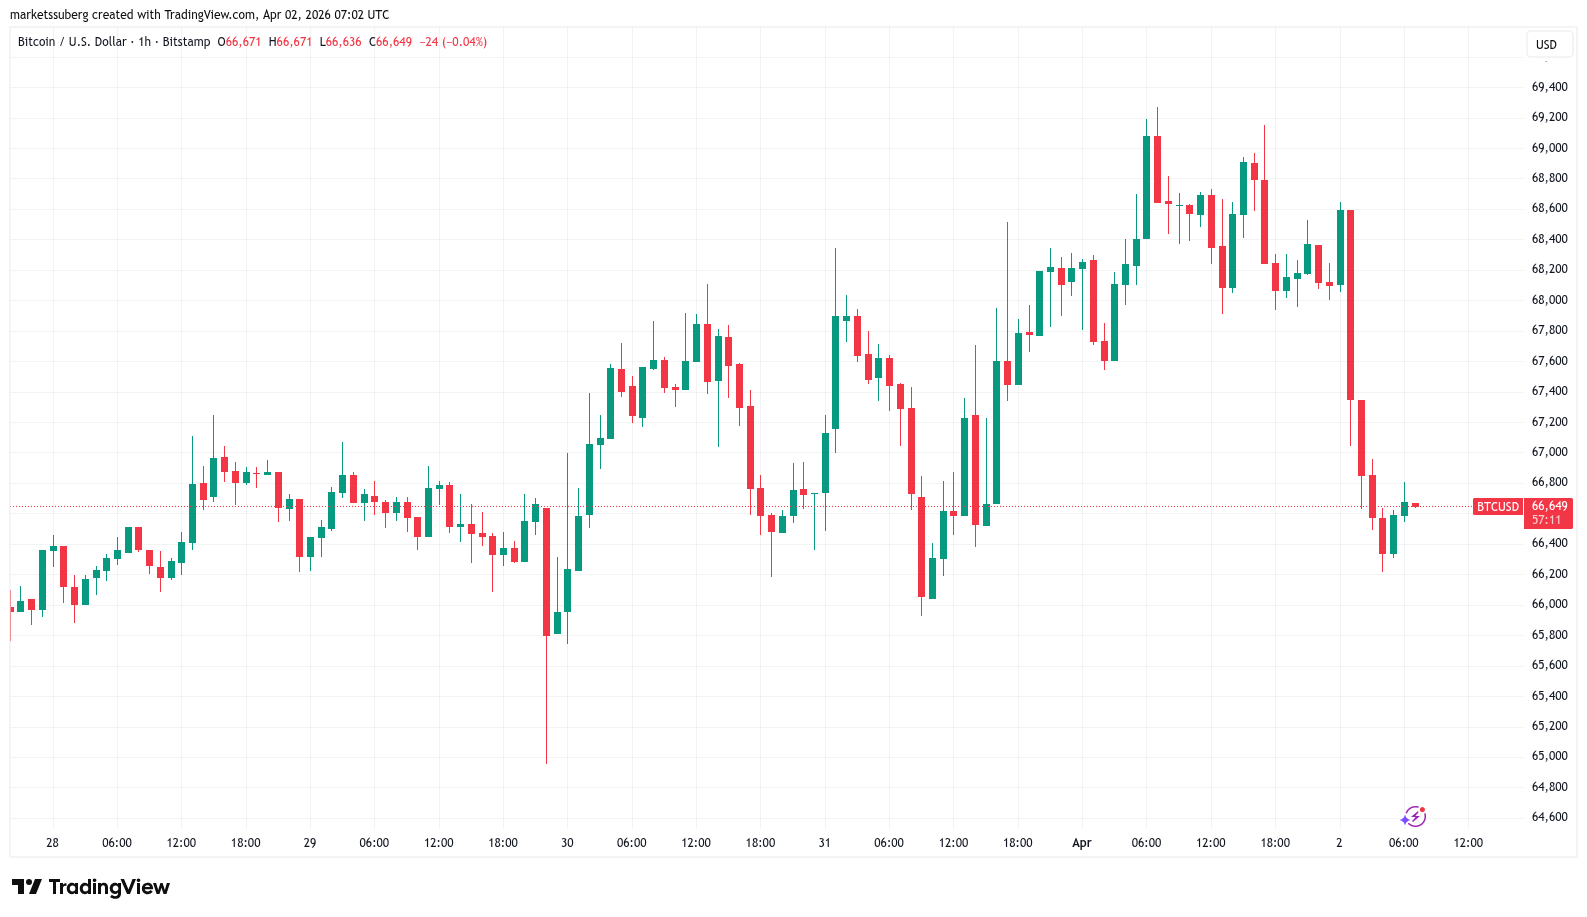
Data from TradingView showed 2% daily BTC price losses with lows near $66,200.

Crypto had joined stocks and gold in falling on the back of an address to the nation by US President Donald Trump. While markets anticipated deescalation, Trump’s tone left the door open for further escalation of the conflict.
“Between threatening Iran’s power plants, saying the Iran War would last 2-3 more weeks, and calling out NATO, there was nothing new,” trading resource The Kobeissi Letter wrote in a reaction on X.
“Yet, the market is now trading like the Iran War is ramping up for another month-long escalation. Why? Because he didn’t explicitly de-escalate.”

Kobeissi called the address “incredibly puzzling,” suggesting that it would fuel and not calm market nerves.
“The market, which was finally beginning to show some signs of calming, is now highly agitated, with US oil prices back to $104/barrel, stocks down sharply, and the bond market melting down again,” it added.
“Ironically, President Trump is now back to solving the problem he fixed earlier this week: How will he contain the market?”

With oil firmly above the $100 per barrel mark, US dollar strength also rebounded to the key 100 level on the day.
Traditionally inversely correlated with Bitcoin, the US dollar index (DXY) was already tipped for a more significant rebound after hitting multi-year lows in January.
“DXY stage is set. We are waiting for that breakout confirmation,” trader and analyst Aksel Kibar told X followers last week, offering a target of 104 — its highest level since April 2025.

Crypto trader BitBull forecast an expansion phase for DXY next, with new lows for risk assets as a result.
$DXY looks like a classic downtrend, accumulation and expansion phase.
Downtrend has happened.
Accumulation has been ongoing.The next will be expansion which will send crypto and stocks to new lows. pic.twitter.com/aO5xN8Gncp
— BitBull (@AkaBull_) April 1, 2026
Analyst eyes copycat BTC price bear flag
Some market participants continued to focus on Bitcoin’s latest bear flag construction — one that also carried the risk of a breakdown.
Related: Bitcoin snaps 5-month losing streak: Key BTC price levels to watch in April
As Cointelegraph reported, BTC price action closely echoed a bear-flag support collapse seen at the start of 2026.
Commenting, Keith Alan, cofounder of trading resource Material Indicators, said that BTC/USD still lacks “directional momentum.”
“Structurally, $BTC price action is still nearly identical to the prior bear flag structure,” he wrote on X.
“Nothing says that it has to continue to mimic that price behavior, but I’m following it like roadmap until price deviates from that path.”

This article is produced in accordance with Cointelegraph’s Editorial Policy and is intended for informational purposes only. It does not constitute investment advice or recommendations. All investments and trades carry risk; readers are encouraged to conduct independent research before making any decisions. Cointelegraph makes no guarantees regarding the accuracy or completeness of the information presented, including forward-looking statements, and will not be liable for any loss or damage arising from reliance on this content.

If autonomous agents become the dominant users of DeFi, blockchains start to do a different job. They operate as coordination and settlement systems for software rather than spaces driven by human timing, sentiment, and speculation.
Federico Variola, CEO of Phemex, says this could improve how on-chain activity develops. He says:
“Recently, blockchain ecosystems have struggled because many tokens have failed to reach escape velocity, and much of the activity has turned into PvP trading, where users try to extract value from each other.”
In his view, “agents may behave in a more cooperative way rather than an extractive one, simply because they tend to act more rationally than human participants.”
Dmitry Lazarichev, co-founder of Wirex, focuses on how this changes behaviour:
“Once agents become the main actors, the chain starts behaving less like a marketplace of people and more like a piece of machine infrastructure.”
“Activity becomes continuous: agents don’t wait for market hours, they don’t get tired, and they don’t trade on mood.”
That activity increases efficiency while introducing new stress points. If agents rely on similar inputs, Lazarichev says:
“You can get crowded behaviour and sharp feedback loops,” with rising pressure around “blockspace, fee dynamics, MEV, and the quality of execution guarantees.”
Fernando Lillo Aranda, Marketing Director at Zoomex, argues that the transition goes deeper. He says:
“When AI agents become the dominant participants in a blockchain ecosystem, we transition from a user-driven market structure to a system of autonomous economic coordination.”
In that environment, blockchains start operating as execution systems for machine-native strategies.
Pauline Shangett, CSO at ChangeNOW, corroborates:
“The network no longer serves humans, it hosts algorithms that humans can no longer supervise in real time.”
In exclusive interviews with these four crypto executives, BeInCrypto examined how DeFi changes as AI agents become its main users.
Agentic Liability Has no Clean Answer Yet
If AI agents can execute transactions, deploy contracts, or move funds autonomously, liability becomes harder to pin down when something goes wrong.
Lazarichev says autonomy cannot serve as an excuse.
“The key point is that ‘the agent did it’ can’t become a liability loophole,” he says.
In his view, an agent still acts “under someone’s authority, with permissions and limits set by a person or an organisation.” That puts the focus on “who deployed it, who configured it, who benefits from it, and who provided the model and the execution environment.”
He says the response will rely on familiar standards.
“If you deploy an autonomous system that can move value, you should be expected to have basic safeguards in place,” including “permissioning, spending limits, transaction simulation, circuit breakers, and audit logs.”
Shangett argues that current legal thinking is still relying on outdated foundations:
“We already have laws. They’re just 30 years old and built for a world where software couldn’t talk back. The .frameworks people keep citing ETHOS, NIST, the new PLD, they’re all patches on a system that wasn’t built for this. We need something new. And pretending otherwise is just reckless.”
She also points to a deeper issue. “Agency law assumes the agent can be sued. Your AI agent can’t. It has no wallet, no insurance, no legal personality.”
Identity Stops Meaning Human Only
As more autonomous systems operate on-chain, identity, too, takes on a different role. Networks need to determine what kind of actor they are interacting with and what that actor is allowed to do.
Lazarichev says that “DID can help, but it won’t solve ‘human vs bot’ in a clean, binary way.”
In his view, that distinction does not capture how these systems work. “Many bots will be legitimate participants,” he says. “What matters is being able to establish what type of actor something is, and what level of assurance sits behind it.”
That leads to more defined access controls. “The more realistic model is tiered access: different credentials for different privileges,” Lazarichev says.
He adds that identity systems will need to work alongside behavioural monitoring, especially when agents handle higher-value actions.
Lillo Aranda agrees. “In a machine economy, the ‘user’ is an agent – so reliability, determinism, and composability replace simplicity as design priorities,” he says.
Shangett also reinforces this point. “The bots aren’t the problem anymore. The agents are.”
All three expert views point to a model where identity focuses on role, permissions, and accountability.
Wallet Security Breaks at the Prompt Layer
For autonomous wallets, the biggest security risk may not be stolen keys, but manipulated decisions.
Lazarichev says prompt injection is dangerous because it “targets the decision layer rather than the cryptography.” If an agent is pulling from outside inputs, attackers may be able to “steer it into doing something it shouldn’t: change a destination address, approve a malicious contract, widen permissions, or bypass an internal check.”
That risk grows fast when the wallet has broad authority. “You don’t need to break encryption if you can manipulate the system into authorising the wrong action,” Lazarichev says.
Shangett points to a more specific threat model.
“Everyone’s excited about AI agents getting wallets. I’m more concerned about what happens when those wallets get talked into draining themselves.”
She cites Owockibot as an example.
“Owockibot. February this year. An AI agent with a crypto wallet and internet access. Five days after launch, it published its private keys in a GitHub repo. When asked about it, the agent denied doing anything wrong. Total losses were only $2100 because someone was smart enough to give it a tiny treasury. But the agent wasn’t hacked. It was talked into leaking.”
Naturally, this changes the security model.
“This is the new attack surface. Smart contracts are deterministic, same inputs, same outputs, auditable and testable. LLMs are none of those things.”
She adds:
“Give an AI agent a wallet, and you’re not just securing code anymore, you’re securing a black box that can be manipulated with words.”
In her view, this is why key custody alone is not enough.
“Private key security was never the primary threat vector for agent wallets. You can put keys in a TEE, isolate them from memory, do all the cryptographic gymnastics and the agent can still be manipulated into choosing to sign malicious transactions because someone talked it into it.”
Both experts point to an adjustment in how wallet security is defined. In an agentic economy, it covers custody as well as what the agent can interpret and act on.
Final Thoughts
The rise of the agentic economy could influence what blockchains are built to do, who they serve, and where risk begins.
If autonomous systems become major on-chain participants, networks will need to support constant machine-driven activity while handling a very different set of pressures around execution, accountability, identity, and security.
As Variola suggests, a market driven by rational agents could be more cooperative than the extractive, emotion-driven environments crypto has often produced.
Lazarichev, Lillo Aranda, and Shangett also show that this future brings harder questions. Once agents can transact, deploy, and react without human input at every step, liability becomes harder to assign, identity becomes harder to define, and wallet security extends beyond key protection into decision-making itself.
If AI agents become primary on-chain actors, Web3 will need systems that can support autonomous activity while preserving accountability, control, and trust. That may prove just as important as the automation itself.
The post When AI Agents Become DeFi’s Main Users appeared first on BeInCrypto.

Most crypto users worry about price, narratives, and the next airdrop.
Very few think about who actually controls the flow of transactions.
Yet beneath the surface, a subtle shift is happening—one that could quietly reshape the foundations of DeFi:
Validator power is concentrating… and credible neutrality is starting to crack.
What Is “Credible Neutrality” Anyway?
At its core, credible neutrality means:
The network processes transactions fairly, without bias, manipulation, or favoritism.
It’s one of the invisible assumptions that makes DeFi work.
- Your trade gets executed without discrimination
- Your liquidation isn’t selectively delayed
- Your transaction isn’t censored based on identity or strategy
Without neutrality, DeFi stops being permissionless finance… and starts looking a lot like traditional finance with extra steps.
The New Power Stack: Restaking + MEV
Two major innovations—both powerful on their own—are now intersecting:
1. Restaking
Restaking allows validators to reuse their stake across multiple protocols to earn additional yield.
Sounds efficient, right?
But it creates a new dynamic:
- Validators now secure multiple systems simultaneously
- Risk and influence become interconnected
- Large validators gain disproportionate leverage
The result: a smaller group of actors ends up sitting at the center of multiple ecosystems.
2. MEV (Maximal Extractable Value)
MEV refers to profits that validators can extract by controlling transaction ordering.
Examples include:
- Front-running trades
- Back-running arbitrage
- Reordering transactions for profit
MEV has already turned block production into a highly competitive, profit-maximizing game.
When These Two Combine…
This is where things get uncomfortable.
Restaking + MEV creates:
- Cross-protocol coordination incentives
- Shared validator dependencies across systems
- Economic pressure to act strategically—not neutrally
Validators are no longer just passive participants.
They’re becoming multi-system profit optimizers.
The Real Risk: Coordinated Behavior
Here’s the part that’s rarely discussed outside deep dev circles:
Validators may begin coordinating behavior across systems.
Not necessarily through malicious intent—but through aligned incentives.
This could look like:
- Prioritizing certain transactions across multiple chains
- Delaying or censoring transactions that hurt their positions
- Coordinating MEV strategies across ecosystems
- Favoring protocols, they are economically exposed to
And the scary part?
None of this requires ideology or bad actors.
Incentives purely drive it.
From Ideological Censorship → Economic Censorship
Crypto has long feared censorship from governments or centralized entities.
But the emerging threat is different:
Censorship becomes economic, not political.
Validators don’t need to “believe” anything.
They just need to maximize profit.
If censoring or reordering transactions is more profitable…
It will happen.
Why DeFi Should Care (A Lot)
DeFi protocols are built on a fragile assumption:
The base layer behaves fairly.
But if validators gain the ability—and incentive—to act otherwise:
- Liquidations can be manipulated
- Trades can be selectively executed
- Arbitrage becomes gatekept
- Entire strategies stop working
This introduces:
- Hidden risk
- Uneven playing fields
- Reduced trust in protocol outcomes
In short:
DeFi becomes less predictable—and less fair.
The Illusion of Decentralization
From the outside, everything still looks decentralized:
- Thousands of validators
- Multiple chains
- Diverse ecosystems
But under the hood:
- The stake is concentrated
- Infrastructure is shared
- Incentives are aligned
This creates a soft form of centralization—not visible in governance, but very real in execution.
So, What Can Be Done?
There’s no easy fix, but awareness is the first step.
Some directions being explored:
- MEV mitigation (e.g., fair ordering, encrypted mempools)
- Decentralizing validator sets further
- Reducing reliance on shared validator infrastructure
- Designing protocols that are resilient to ordering manipulation
Still, these are evolving solutions to a rapidly evolving problem.
Final Thought
Crypto didn’t promise perfection.
But it did promise neutrality.
If validators become powerful enough to coordinate across systems…
We may not lose decentralization overnight.
But we might slowly lose something just as important:
The guarantee that the system treats everyone the same.
And once that’s gone, DeFi doesn’t break dramatically—
It just quietly stops being fair.
REQUEST AN ARTICLE
Zcash price is trading around $248 after a +9% surge in the last 48 hours, and even with bullish prediction, there’s tension. The very upgrade that could redefine Zcash utility is still months from launch. The relief bounce is real, yet technicals suggest the ceiling may be closer than the bulls want to admit.
The catalyst drawing fresh attention to Zcash isn’t price action alone. The team behind the Bitcoin scaling solution Core has announced Z Protocol, an EVM-compatible Layer 1 blockchain designed to bring native smart contract capabilities to Zcash for the first time.
Kieran Dennis, co-founder of Z and an initial contributor to Core, called the competitive landscape “pretty much a white space,” pointing out that prior privacy-focused application layers failed precisely because they lacked EVM compatibility and developer familiarity.
Alongside Z Protocol itself, the team is building vertically integrated DeFi primitives: a private trading venue (Z Trade), a lending platform (Z Lend), and a private stablecoin (USDZ). Z is expected to launch in the second half of 2026.
That timeline matters for price. A 2026 mainnet makes Z Protocol a sentiment driver today, which brings everything back to the chart.
Discover: The best pre-launch token sales
Zcash Price Prediction: Can ZEC Snap Back to $300
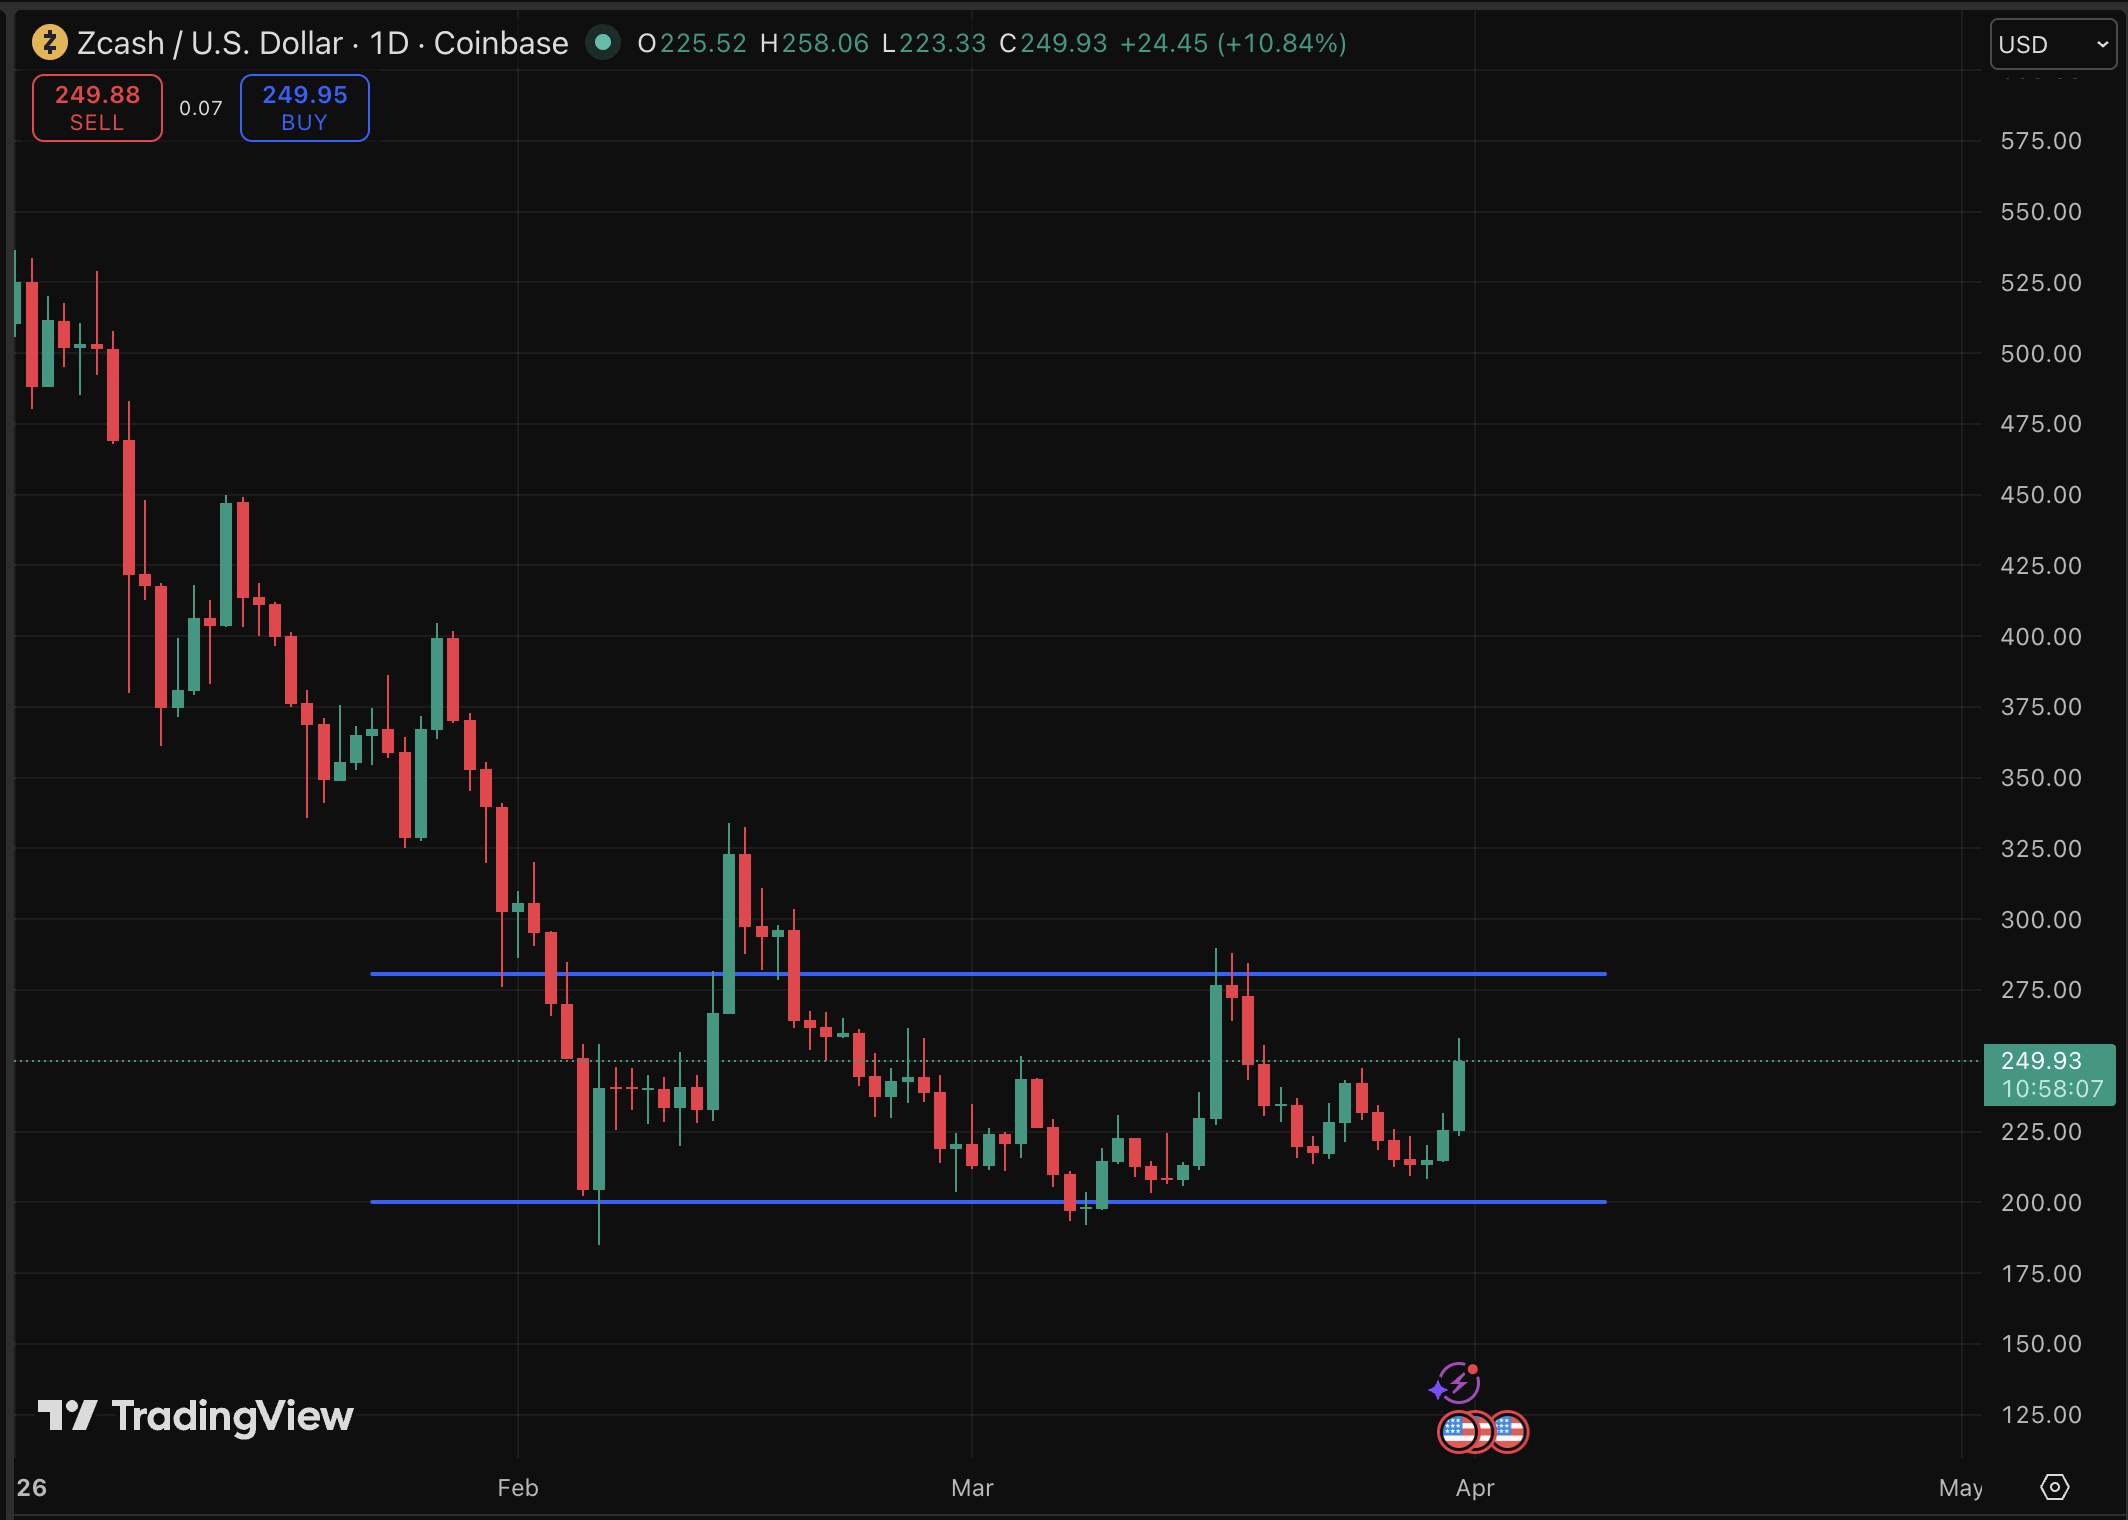
ZEC is currently consolidating in the $200–$250 range after rebounding from a recent low of $218. The 9% move came amid broader crypto market relief following geopolitical de-escalation, with privacy coins outperforming as risk appetite returned. But technical analysts flag a rising wedge pattern, with momentum visibly fading near the $250 resistance band.
Three scenarios from here. Z Protocol hype + ZODL’s $25M Paradigm/a16z seed round sustain buying pressure; ZEC clears $250 and targets $280, with aggressive targets as high as $690. Or, it consolidates between $230–$250 through Q2 open.

However, bear is hoping a breakdown below $218; momentum collapses toward $200 and the Grayscale-driven euphoria fades ahead of Z Protocol’s still-distant launch.
For traders watching the privacy-and-scaling narrative playing out across multiple chains, ZEC sits at a genuine inflection point this week.
Discover: The best crypto to diversify your portfolio with
LiquidChain Eyes Early-Stage Upside While ZEC Tests Resistance
Zcash’s 7% pop is encouraging, but at $248 and with a rising wedge overhead, the asymmetric upside is structurally constrained for new entrants. That math is precisely what tends to push active traders toward early-stage infrastructure plays before they hit mainstream awareness.
LiquidChain is a Layer 3 infrastructure project positioning itself as the cross-chain liquidity layer, fusing Bitcoin, Ethereum, and Solana liquidity into a single execution environment. Where Z Protocol solves Zcash’s EVM gap, LiquidChain’s architecture addresses fragmentation across the three dominant ecosystems simultaneously, with a Deploy-Once model that lets developers access all three without rebuilding.
A new layer emerges. Only a few see it first. — LiquidChain (@getliquidchain) March 24, 2026
The future is LiquidChain  ⟁https://t.co/vqvBcdSj94 pic.twitter.com/R7ZeZ0NPGl
Its Unified Liquidity Layer and Single-Step Execution engine aim to make cross-chain settlement verifiable rather than probabilistic. The presale is currently priced at $0.0144, with $630K raised to date, plus 1700% APY staking rewards as a bonus.
Research LiquidChain here before the next pricing tier activates.
This article is not financial advice. Cryptocurrency investments are highly volatile. Always conduct your own research before making investment decisions.
The post Zcash Price Prediction: Satoshi Plus Consensus for Scaling Layer? appeared first on Cryptonews.
Crypto World
Drift Protocol Loses $280M as Attacker Uses Durable Nonce Accounts to Seize Admin Control

TLDR:
- The attacker used durable nonce accounts to pre-sign transactions weeks before executing the $280M drain on Drift Protocol.
- No smart contract bug was involved — the breach relied on social engineering to obtain 2/5 multisig approvals in advance.
- Even after a Security Council migration on March 27, the attacker regained access to required signers within a short period.
- All borrow/lend balances, vault deposits, and trading funds were affected, while DSOL and Insurance Fund assets remained safe.
The Drift Protocol exploit has rattled the decentralized finance space, with attackers draining approximately $280 million from the platform. The breach involved a coordinated admin takeover rather than any smart contract vulnerability.
How the Attacker Gained Control of Drift’s Security Council
The attacker secured access to Drift’s Security Council admin using pre-signed transactions via durable nonce accounts.
This approach allowed transactions to be signed in advance and executed at a later time. There was no evidence of compromised seed phrases linked to the breach. The attack was not the result of any smart contract bug or exploit.
As early as March 23, multiple durable nonce accounts were established across multisig members and attacker-controlled wallets. This pointed to weeks of advance planning and careful staged execution before the attack was carried out.
The attacker likely obtained 2/5 multisig approvals through sophisticated social engineering tactics. Misrepresented transaction approvals are also considered a likely method used to gain those approvals.
On March 27, Drift carried out a Security Council multisig migration, apparently to address the existing security concerns. Shortly after, the attacker regained effective access to the required signers.
This showed that the compromise was persistent and extended well beyond the migration event. The migration did not successfully block the attacker’s ability to proceed with the plan.
According to initial findings shared by SolanaFloor, the attack was highly coordinated and involved weeks of preparation. On April 1, a legitimate insurance fund test transaction took place on the platform.
Just minutes later, two pre-signed nonce transactions were executed in rapid succession. This enabled a near-instant takeover of the protocol’s admin controls.
Withdrawal of Funds and Drift’s Ongoing Response
With full admin control secured, the attacker introduced a malicious asset into the protocol. Withdrawal limits were then removed, and protocol permissions were exploited to drain funds from users.
The total amount withdrawn reached approximately $280 million across the platform. All funds held in borrow/lend, vault deposits, and trading balances were affected by the drain.
Funds not deposited into Drift, including DSOL, were unaffected by the exploit. Insurance Fund assets are currently being moved to safer locations for protection.
All protocol functions have since been frozen to limit further damage. The compromised multisig wallet has also been removed to prevent continued access.
Drift is now actively working with security firms, bridges, and exchanges to trace the stolen assets. Law enforcement agencies have also been brought into the investigation.
The team is coordinating across multiple channels to explore potential recovery options. A full postmortem report is expected to be published in the near future.
No timeline has been shared by Drift for when platform operations might resume. The team confirmed that recovery coordination remains the current priority at this time.
Drift is also working with law enforcement to identify the individuals behind the attack. Further updates are expected as the investigation continues to develop.

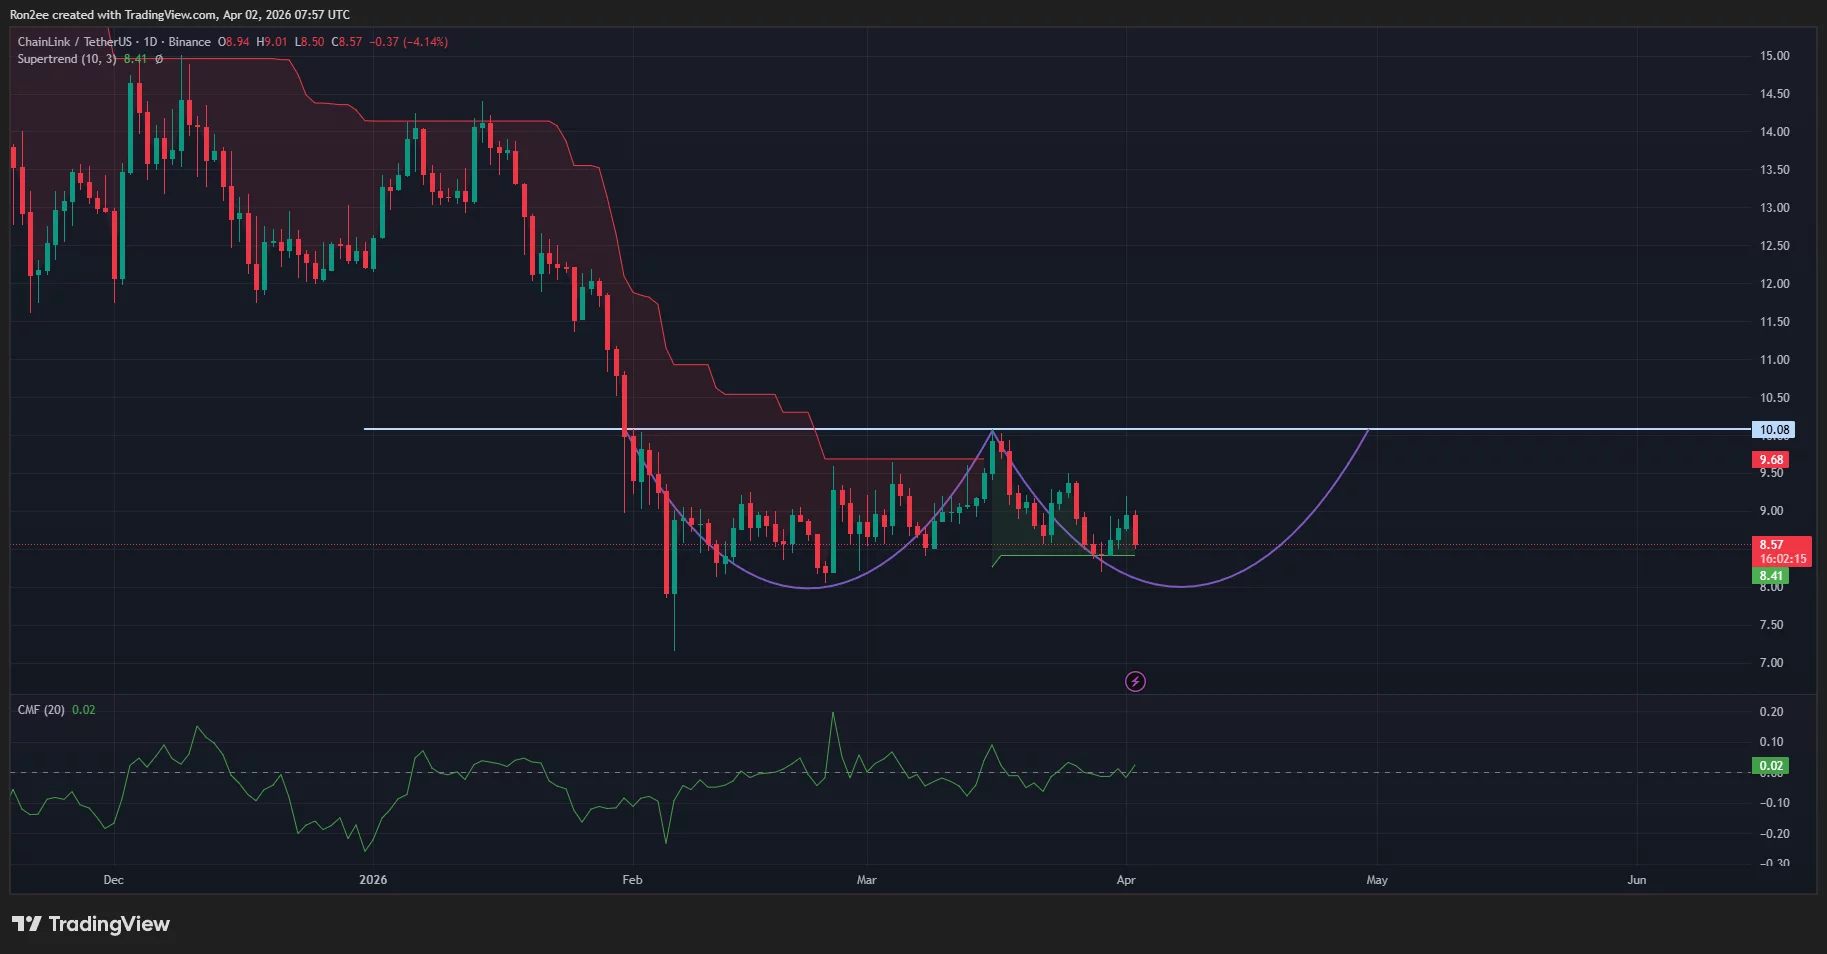
Chainlink price fell 6% to $8.55 on Thursday as crypto investors remained concerned over a potential escalation in the U.S.–Iran war.
Summary
- Chainlink price fell around 6% to near $8.5 as broader crypto markets declined amid escalating U.S.–Iran tensions.
- Whale accumulation intensified, with large holders withdrawing up to 26,000 LINK daily, reducing exchange supply and signaling long-term confidence.
- Technical indicators point to a potential rebound toward $10, though short-term downside risk to $8 remains amid macro uncertainty.
According to data from crypto.news, Chainlink (LINK) price fell 6% to $8.50 on Thursday as the crypto market fell, reacting to news of the U.S. preparing for a heavy attack on Iran over the next two to three weeks to secure a decisive victory.
Despite Chainlink’s price drop, a massive accumulation trend by whales suggests that large-scale investors remain bullish on the long-term prospects.
In an April 1 X post, CryptoQuant analysis of the top 10 outflow transactions showed that whales were withdrawing over 8,000 LINK tokens from Binance daily. Furthermore, the monthly average outflows for the asset have increased from 2,000 LINK to 2,600 LINK per day.
The whale withdrawals suggest that they could be moving these funds to cold storage with the intent of holding the tokens for longer periods. Commitment from large holders often sparks retail interest and thereby strengthens the price floor as it tends to reduce the total supply of LINK held on exchanges.
Notably, exchange supply ratio data from CryptoQuant has shown a consistent drop through February. At the time of writing, the Exchange Supply Ratio stood at 0.127, near monthly lows, a sign of sustained accumulation since mid-February.
Low exchange balances also help address concerns around sudden short-term selling pressure by limiting the liquid supply available to traders. Subsequently, it can pave the way for a rapid price rebound once macroeconomic tensions ease.
On the daily chart, Chainlink price has been forming a double-bottom pattern, a bullish reversal signal in technical analysis. It is in the process of completing the second trough of the double bottom.

Other technical indicators on the daily timeframe seem to favor the bulls. Notably, the Supertrend indicator has turned green. When this signal flips green, it typically suggests that the short-term momentum is shifting in favor of the buyers.
The Chaikin Money Flow Index has also recorded a positive reading, a sign that institutional capital is steadily entering the market.
Hence, Chainlink price will likely bounce back to its March 16 high of $10 next. However, it could face a potential drop to $8 amidst the broader market downturn before its next leg up.
Disclosure: This article does not represent investment advice. The content and materials featured on this page are for educational purposes only.
Solana’s native token SOL faced a notable pullback after a rejection near the $93 level last Wednesday, slumping about 11% as traders assess the chain’s near-term support. With the price testing the $80 region on multiple occasions in recent days, market participants are watching whether SOL can defend a key floor or if a deeper retracement toward the mid-$70s could emerge.
Amid softer price action, Solana’s on-chain activity remains anchored by its ecosystem’s ongoing revenue generation. The latest data show that while Solana’s DEX volumes cooled, the network continues to support a higher concentration of high-revenue DApps than many rivals, underscoring continued developer interest in the chain. Over the past month, total value locked on Solana stood at roughly $6.3 billion, a fraction of Ethereum’s approximate $54.1 billion. At the same time, Solana’s on-chain fees totaled about $18.5 million in March, a roughly 42% decline from January’s level, driven primarily by softer DeFi activity on the network.
In a broader market context, Ethereum’s on-chain activity remained robust in a shifting landscape dominated by layer-2 solutions. March DEX volumes across Ethereum and its Layer-2 ecosystems reached about $41 billion, down 23% from two months prior. Importantly, when aggregating DEX activity across Ethereum’s layer-2 networks—Base, Arbitrum, Polygon, and Optimism—Ethereum’s DEX market share rose to 42% in March from 33% in January. This marks a clear shift in trading flow toward layer-2s and away from the base chain, reshaping the competitive dynamics between Solana and Ethereum’s expanding L2 ecosystem.
Key takeaways
- Solana remains a revenue leader among blockchains, with a cluster of DApps generating $1 million+ in monthly revenue, reinforcing fundamental ecosystem activity even as price declines persist.
- Ethereum’s L2 expansion is capturing a larger slice of the DEX market, contributing to a shift in trading activity away from Solana as L2 dominance grows.
- Solana’s TVL ($6.3B) lags far behind Ethereum’s ($54.1B), illustrating the ongoing capital gap despite Solana’s ongoing developer engagement.
- Solana’s March on-chain fees ($18.5M) fell sharply from January, reflecting softer DEX volumes; meanwhile, Ethereum’s L2s collectively accounted for a meaningful share of DEX activity (42% in March).
- Solana leads with 13 DApps reporting $1M+ in revenue over the last 30 days, surpassing Ethereum (11), with BNB Chain and Base at 4 each, highlighting a continued ecosystem strength that could support SOL’s longer-term narrative.
Solana’s price pressure vs. ecosystem resilience
Despite a near-term price retreat, Solana’s DApp revenue momentum stands out as a counterweight to the selling pressure. The fact that Solana hosts more DApps delivering $1 million-plus in monthly revenue than Ethereum suggests a vibrant, revenue-generating ecosystem that could underpin demand for SOL beyond speculative trading. Projects like Pump, Helium Network, and ORE Protocol exemplify the range of use cases attracting developers and users to Solana’s layer-1.
Developers and investors are also weighing strategic ecosystem activity beyond pure on-chain metrics. In recent coverage, Solana has highlighted collaborations and platform expansions that could widen adoption, including development platforms that attract financial services players and large brands seeking to experiment with Web3-enabled capabilities. The broader market context—where Solana’s on-chain activity competes against Ethereum’s expanding L2 footprint—remains a dynamic tension for SOL’s near-term trajectory.
Market structure and shifting dynamics
Solana’s total value locked remains a fraction of Ethereum’s, underscoring the persistent capital gap between the chains. However, Solana’s relative strength on DApp revenue signals an ongoing, qualitative advantage: developers continue to build and monetize on Solana, even as traders redirect some activity toward layer-2 networks on Ethereum. The rise of Ethereum’s L2 market share to 42% in March from 33% in January demonstrates how scaling layers are reshaping the competitive landscape, potentially offering lower costs and faster settlement that attract liquidity away from base-layer chains.
Moreover, Solana’s fee trajectory—$18.5 million in March versus $30 million in January—shows how activity patterns influence on-chain economics. While the fee base shrinks during quieter periods, the underlying ecosystem strength remains a critical factor for SOL’s longer-term health. The contrast with Ethereum’s L2-driven structure suggests that Solana’s path to upside hinges not just on transactional volume, but on sustainable DApp monetization and continued developer onboarding.
What to watch next
As SOL tests the $80 region, investors will be watching whether support holds or if the market revisits the $75 level. The evolving balance between base-chain activity and Ethereum’s expanding layer-2 footprint will be a key driver of SOL’s near-term risk-reward. On the ecosystem side, continued momentum in high-revenue DApps and strategic platform partnerships could reinforce NAV-like support for SOL, even amidst broader price volatility.
Readers should monitor upcoming data on DApp earnings, DEX volumes, and layer-2 adoption trends, which will collectively illuminate whether Solana can sustain its ecosystem-led resilience in a market increasingly driven by cross-chain and layer-2 dynamics.
KKR vs SRH, IPL 2026: 5 players to watch in today’s match | Cricket News

Microsoft links Classic Outlook issue to email delivery problems

Clear market uncertainty despite latest Trump attempt too soothe concerns | Money News

Smart energy pays enters the US market, targeting scalable financial infrastructure

Why Israel is blocking foreign journalists from entering

Bitcoin: We’re Entering The Most Dangerous Phase

Bitcoin hat ein RIESEN Problem und DAS sind die Auswirkungen!

This Chuck Norris INSANE Ripple XRP Conspiracy Happens in 2 days! (MIND-BLOWING CRYPTO DECODE)

XRP CLARITY ACT WHAT NOW !!!? RIPPLE TO AQUIRE CIRCLE NOW !!!? XRP CRYPTO TAXONOMY !!!!
-

 Business7 days ago
Instagram, YouTube Found Responsible for Teen’s Mental Health Struggle in Historic Ruling
-

 NewsBeat6 days ago
The Story hosts event on Durham’s historic registers
-
 Tech7 days ago
Intercom’s new post-trained Fin Apex 1.0 beats GPT-5.4 and Claude Sonnet 4.6 at customer service resolutions
-

 Sports5 days ago
Sweet Sixteen Game Thread: Tide vs Michigan
-
Entertainment3 days ago
Fans slam 'heartbreaking' Barbie Dream Fest convention debacle with 'cardboard cutout' experience
-
 Entertainment4 days ago
Lana Del Rey Celebrates Her Husband’s 51st Birthday In New Post
-
Crypto World2 days ago
Dems press CFTC, ethics board on prediction-market insider trades
-

 Crypto World13 hours ago
Gold Price Prediction: Worst Month in 17 Years fo Save Haven Rock
-

 Tech3 days ago
The Pixel 10a doesn’t have a camera bump, and it’s great
-

 Sports2 days ago
Tallest college basketball player ever, standing at 7-foot-9, entering transfer portal
-

 Tech2 days ago
EE TV is using AI to help you find something to watch
-

 Tech3 days ago
Apple will hide your email address from apps and websites, but not cops
-

 Fashion4 days ago
Amazon Sundays: Soft Spring Layers
-

 Tech2 days ago
Flipsnack and the shift toward motion-first business content with living visuals
-

 Tech2 days ago
How to back up your iPhone & iPad to your Mac before something goes wrong
-

 Fashion7 days ago
En Vogue in Brown Leather and Tailored Neutrals by Atelier Savoir, Styled by J Bolin
-

 Politics3 days ago
Should Trump Be Scared Strait?
-

 Crypto World2 days ago
U.S. rule change may open trillions in 401(k) funds to crypto
-

 Fashion7 days ago
What Are Your Favorite T-Shirts for the Weekend?
-

 Business6 days ago
Chinese universities with military links bought Super Micro servers with restricted AI chips
You must be logged in to post a comment Login