
Crypto World
Tether clears $1.5 billion in profit as its safety cushion shrinks by half



Tether reported $1.5 billion in net operating profit for the second quarter of 2026, driven by returns from its U.S. Treasury and repurchase agreement holdings.
The issuer of USDT, the world’s largest stablecoin, reported holding $187.75 billion in assets against $183.64 billion in liabilities as of June 30, leaving it with $4.11 billion in excess reserves, according to the BDO attestation released Friday. Those excess reserves are down from just over $8.23 billion three months earlier.
The second quater report shows Tether increased its physical gold holdings by 14 tons to roughly 146.2 metric tons from 132.2 tons during the quarter. The value of those holdings, however, fell to $18.84 billion from $19.84 billion because the price of gold dropped about 15% to just over $4,000 per ounce.
The company lifted bitcoin holdings by roughly 1,796 coins to 98,933 BTC. The value of those holdings fell to $5.80 billion from $6.62 billion as the bitcoin price used in the reports declined to $58,600 from $68,200, during the period.
Tether’s USDT issuance increased by about $446 million to $184.6 billion during the quarter.

Tether’s reserve surplus grew to $4.11 billion in the second quarter as USDT supply rose despite a weaker stablecoin market and continued pressure across the crypto sector.


Most companies treat anxiety as a problem to solve. When employees feel stressed, they are offered meditation apps, mental-health days, and employee-assistance programs. These can be valuable resources. But they carry an underlying message: Anxiety is an obstacle to performance, and the goal is to make it disappear.
I saw this mindset clearly during a recent consultation with the CEO of a midsize company. I asked what comes to mind when an employee says they are experiencing anxiety. Her discomfort was immediate, as though merely hearing the word “anxiety” activated her own.
She then named three concerns: the employee might need accommodations, benefits costs may rise, and the company could face legal exposure. Her managers, she explained, were trained not to ask too many questions about anxiety. Instead, they were supposed to document the interaction, direct employees toward support, and avoid saying anything that could create additional risk.
That may be prudent from a legal perspective, but it also reveals a problem. Corporate America is getting anxiety all wrong.
I don’t fault the C-suite for thinking this way. For much of my career as a clinical psychologist, I made a similar mistake. I was trained to regard all anxiety as a symptom to reduce, manage, or eliminate.
In reality, the word “anxiety” is used to describe two very different experiences.
On the one hand, clinical anxiety is persistent, excessive, and disruptive. In professional nomenclature, these conditions are known as anxiety disorders. They interfere with work, sleep, relationships, and everyday functioning. Clinical anxiety typically requires professional treatment, workplace accommodations, or other meaningful support.
On the other hand, most anxiety is not a disorder at all. It is an ordinary and healthy human emotion involving apprehension we feel when an important matter is uncertain. The emotion of anxiety shows up before difficult conversations, major presentations, high-stakes decisions, and periods of change. Yes, it tends to be uncomfortable, but discomfort is not the same as a dysfunction or disorder. Fundamentally, anxiety is simply evidence that we care about what happens next.
We readily distinguish between depression, a clinical disorder, and sadness, which is a normal human emotion. Yet when it comes to anxiety, that nuance often disappears. We use the same word for everything from fleeting nerves to debilitating psychiatric conditions.
When companies pathologize ordinary anxiety, a self-reinforcing cycle develops. Employees become reluctant to admit they feel anxious because they fear being seen as unwell, unable to cope, or a professional liability. Managers, worried about saying the wrong thing, avoid honest conversations about emotions altogether. Leaders lose access to important information, psychological safety erodes, productivity suffers, and tensions tend to rise for all parties.
Companies have long treated emotional wellness and performance as separate agendas: one soft, the other serious. That is a false divide. When people know how to use anxious feelings well, they become both healthier and more productive.
Corporate America needs a different approach. Instead of trying to eliminate anxiety, business leaders and managers should help employees to use it constructively.
Here are four steps that can help.
First, identify anxiety as information. When anxiety occurs, resist the instinct to dismiss it or make it disappear. Get curious. What specifically feels concerning? Is there a risk being overlooked? What does anxiety suggest is at stake?
The emotion of anxiety is not always accurate, but it is often informative. It can sharpen attention, improve preparation, and expose blind spots. The most anxious person in a meeting is often voicing questions everyone else is avoiding.
Second, employees and leaders alike should feel freer to share their anxiety with others. Of course, work should not become group therapy, and thoughtful disclosure is not the same as oversharing. But work colleagues should be able to acknowledge pressure in a grounded, professional way.
When appropriate, managers should respond to anxiety with validation: “I’m concerned about this, too. Here is what we know, what we don’t know, and how I think we should proceed.” That kind of honesty does not weaken authority or credibility. It builds trust, invites candor, and allows anxiety to move from a private burden to shared experience.
Third, embrace anxiety instead of avoiding it. Many of the best employees are anxious. I’m not talking about clinical impairment or paralysis due to fear. I mean team members who care enough to worry about quality, consequences, deadlines, and the people affected by their work. Managers should view anxiety as evidence of investment, not inadequacy.
Human Resources teams should treat healthy anxiety as a positive criterion in hiring and promotion. Constructive anxiety often signals foresight, conscientiousness, and genuine commitment when outcomes are uncertain. Those are qualities companies claim to value, but tend to overlook when they favor polished confidence over thoughtful concern.
Finally, let go of the illusion of control. This is the most important step in the age of AI. Jobs will change. Industries will be disrupted. Employees and leaders alike will have to make decisions without complete information.
Leaders who pretend to know exactly what will happen may look confident at first, but this quickly becomes hubris. A healthier response is to acknowledge uncertainty, identify what can be controlled, and accept what cannot. Letting go is not resignation. It is doing our best without pretending that effort guarantees the outcome.
In a recent keynote for business managers and executives, I asked audience members to raise their hands if they had felt any anxiety during the previous two weeks. Nearly every hand went up. “Thank God,” I said, and the room burst out laughing.
The joke landed because the alternative was alarming. In this era of uncertainty, a room full of business leaders who felt no anxiety would not be a picture of perfect mental health or corporate excellence. It would have signaled disengagement, denial, or even worse, emotional numbness.
Anxiety means you are human. It means you care. And it means you are living and working in a world no one can fully predict or control.
The future of work will not belong to the people who feel no anxiety. It will belong to the people who know how to use it.


The exchange hit record market share and crossed $100 million in prediction market revenue, but a $1.36 per share loss and declining transaction fees show the Everything Exchange still runs on a shrinking engine.
Summary
- Coinbase reported a $359.5 million GAAP net loss in Q2 2026, missing consensus estimates by a wide margin with earnings per share of negative $1.36 versus expectations near breakeven.
- Total revenue fell 18.5% year over year to $1.22 billion, marking the third consecutive quarterly miss against Wall Street forecasts.
- Crypto trading volume market share hit an all time high of 10.3%, up from 9.1% in Q1, even as spot volumes across the industry declined 25% quarter over quarter.
- Subscription and services revenue reached a record 48% of net revenue, with average USDC held on the platform hitting an all time high of $20 billion.
- Prediction markets revenue grew 106% quarter over quarter, crossing $100 million in annualized run rate, while Coinbase ditched the traditional earnings call for a live AMA on X.
Coinbase delivered its third consecutive quarter of missed revenue estimates on July 30, posting a $359.5 million net loss that turned a year of strategic diversification into a question about whether any amount of product expansion can offset a sustained decline in trading fees.
The headline numbers were difficult to frame positively. Revenue of $1.22 billion missed consensus by roughly $80 million. Earnings per share came in at negative $1.36, far below estimates that ranged from negative $0.01 to positive $0.14 depending on the source. Adjusted EBITDA of $207.8 million missed by 31%. The stock dropped more than 5% in after hours trading before partially recovering the following day.
Yet beneath the miss, the structural story is changing. Bitcoin now accounts for just 12% of total revenue, down from more than 50% historically. Subscription and services revenue has grown from $6 million per quarter in 2020 to $555 million today. Prediction markets crossed $100 million in annualized revenue. The company Brian Armstrong calls the Everything Exchange is genuinely becoming one. The question is whether it is becoming one fast enough to survive the quarters when its original business contracts.
The revenue miss, decomposed
The $80 million revenue gap was not concentrated in a single segment. It was distributed across nearly every line item, suggesting the problem was market wide conditions, not a specific operational failure.
Transaction revenue came in at $599 million against an estimate of $640 million. Consumer trading, still the largest single revenue source at $452 million, missed by $40 million and declined 30.5% year over year. The total crypto market capitalization fell 11% during the quarter, and spot trading volumes dropped 25%. Coinbase was swimming against a current that pulled the entire industry down.
Institutional trading was the exception. Revenue of $100 million beat estimates of $116 million in absolute terms but represented a 64.6% year over year increase. Coinbase is gaining institutional share even in a declining volume environment, a pattern that suggests its expansion into tokenized stocks and international markets is generating durable demand instead of speculative volume.
Subscription and services revenue of $555 million missed its $601 million estimate by roughly $45 million. Within that category, stablecoin revenue of $292 million came in below the $339 million consensus, down 12.1% year over year. The $47 million stablecoin miss was the largest single line item shortfall in the subscription segment and represents the first time USDC revenue has disappointed at this scale since the revenue sharing arrangement with Circle began generating material income.
Blockchain revenue of $83 million missed by $13 million and declined 42.3% year over year, reflecting lower activity on Base chain during the broader market cooldown. Other transaction revenue of $47 million also came in light at $53 million estimated. Only interest and finance fees, at $66 million, beat estimates, rising 11.5% year over year. The interest income beat is a direct consequence of elevated USDC balances earning yield in a high rate environment, a tailwind that could reverse if the Federal Reserve begins cutting rates.
The market share paradox
The most striking number in the report was not the loss. It was the 10.3% crypto trading volume market share, an all time record and the third consecutive quarter of gains.
This creates a genuine paradox. Coinbase is winning a larger share of a shrinking market. In Q1, market share was 9.1% on roughly $1.93 billion in revenue. In Q2, market share rose to 10.3% on $1.22 billion. Revenue fell 36.8% quarter over quarter while market share increased by 1.2 percentage points. The math is stark. A rising share of a declining pie still means a smaller serving.
The paradox matters because it defines the investment thesis. If you believe crypto trading volumes are cyclical and will recover, Coinbase is building a dominant position that will compound on the upswing. If you believe the fee compression that characterizes mature markets has arrived permanently, the market share record is a consolation prize.
The competitive dynamics behind the market share gain deserve scrutiny. Coinbase achieved the record during a quarter when derivatives trading volumes hit an all time high for the third consecutive quarter. The exchange is no longer competing solely on spot trading, where fee pressure from zero commission competitors has been relentless. Derivatives, institutional prime brokerage, and international expansion are all contributing to the share number in ways that did not exist two years ago.
The evidence from Q2 favors the cyclical interpretation. Monthly transacting users of 7.6 million missed the 8.15 million estimate, but assets on platform of $245.9 billion, while below the $295 billion consensus, still represent an enormous custody position. Coinbase stores more cryptocurrency than any other company in the world. The $50 billion gap between actual and expected assets on platform reflects bitcoin price declines, not customer departures. When volumes return, it will capture them at a rate no competitor can match.
The stock price reflected Wall Street’s difficulty in reconciling these contradictions. Shares dropped from $160.09 to $155.16 in after hours trading, a 5.15% decline, before rebounding to $163.58 the following day. The 52 week range of $139.18 to $402.16 captures the full spectrum of market sentiment about Coinbase: from existential concern during drawdowns to euphoric conviction during rallies. At a market capitalization of roughly $42 billion, Coinbase trades at approximately 8.7 times trailing revenue, a premium that assumes the Everything Exchange thesis will eventually deliver.
The subscription pivot reaches 48%
The story Coinbase has been telling investors for two years is that it is evolving beyond a trading fee business. Q2 provided the strongest evidence yet that this transformation is real, even if it is not yet sufficient.
Subscription and services revenue represented 48% of net revenue, up from 29% just seven quarters earlier in Q4 2024. The shift is structural, not cosmetic. In Q2 2020, subscription and services generated $6 million per quarter. Six years later, it generates $555 million. That is a 92 fold increase in a business segment that barely existed when Coinbase went public.
The composition of that revenue is important. USDC related income remains the largest component at $292 million. Average USDC held on the platform reached an all time high of $20 billion, representing more than 30% of all USDC in circulation. Coinbase captures approximately 50% of all USDC economics through its relationship with Circle.
The stablecoin business is also gaining broader tailwinds. Market stablecoin transaction volume reached $37 trillion year to date, with 79% flowing through USDC and partner stablecoins, up from 51% in full year 2024. Base chain stablecoin volume rose 7x year over year. These are not Coinbase specific numbers. They are infrastructure adoption metrics that compound regardless of crypto price direction.
The significance of the USDC position becomes clearer when viewed through the lens of revenue durability. Unlike trading fees, which evaporate when volumes decline, stablecoin revenue is a function of USDC in circulation and the interest rate environment. As long as USDC balances remain elevated and interest rates stay above zero, Coinbase earns yield on reserves. The Fed’s sustained rate environment has made this revenue stream more valuable than Coinbase’s early projections anticipated.
But the stablecoin revenue miss of $47 million below consensus also reveals vulnerability. If interest rates decline or USDC loses market share to competing stablecoins, Coinbase’s highest margin business could contract. The entry of traditional financial players like Visa into the stablecoin infrastructure market introduces competitive pressure that did not exist twelve months ago. Coinbase’s bet is that its head start, its custody position, and its platform distribution will be sufficient to maintain USDC dominance.
Prediction markets and the new growth engine
The fastest growing segment in the quarter was also the newest. Prediction markets revenue grew 106% quarter over quarter, crossing $100 million in annualized run rate. The crypto binaries product, launched during the quarter, generated three times the daily traders and four times the daily revenue compared to its May average within weeks of launch.
This segment is worth watching for reasons beyond the topline number. Prediction markets operate on a fundamentally different cycle than crypto spot trading. They are event driven rather than price driven. A regulatory crackdown on competitors like Kalshi could accelerate the shift of prediction market volume toward regulated platforms like Coinbase. New York’s lawsuit seeking $36 billion in damages from Kalshi, combined with 38 state attorneys general aligned against prediction market operators, creates a regulatory moat that benefits companies already holding federal registrations and exchange licenses.
The fact that prediction markets generated $100 million in annualized revenue during a quarter when crypto spot volumes fell 25% suggests the business may be naturally counter cyclical. Political events, sports outcomes, and economic indicators create trading catalysts that are orthogonal to crypto price cycles. If Coinbase can sustain 100% quarter over quarter growth for even two more quarters, prediction markets would become a meaningful contributor to total revenue rather than a rounding error.
Coinbase One subscribers also crossed one million for the first time, another recurring revenue stream that is less sensitive to crypto price movements. The subscription product bundles zero fee trading, higher staking rewards, and priority support, essentially converting volatile transaction revenue into predictable subscription revenue. The one million subscriber milestone, combined with the $100 million prediction market run rate, suggests Coinbase is building multiple independent revenue engines that do not require crypto prices to rise for the company to grow.
The cost structure under pressure
The loss was not driven solely by declining revenue. Coinbase’s cost structure amplified the impact of the miss.
Operating margin deteriorated to negative 9.3%, down from negative 1.6% a year earlier. Transaction expenses consumed 16% of net revenue. Sales and marketing spending was dialed back in Q2 in response to market conditions, but the pullback was not sufficient to offset the revenue decline. The operating leverage that makes Coinbase profitable in strong markets works in reverse during weak ones. Fixed costs for compliance, engineering, and infrastructure do not scale down proportionally when trading volume falls 25%.
The balance sheet remains strong. Cash and equivalents of $8.6 billion, with total available resources of approximately $10 billion, provide a substantial buffer against an extended downturn. For context, the $10 billion in available resources exceeds one full year of total operating expenses at the current run rate. Coinbase could theoretically operate for more than twelve months with zero revenue before facing a liquidity constraint. No other publicly traded crypto company has a comparable cash position.
The company has maintained 14 consecutive quarters of positive adjusted EBITDA, a streak that survived even this quarter’s GAAP loss. The distinction matters. GAAP accounting includes non cash charges, particularly stock based compensation and unrealized losses on crypto holdings, that adjusted EBITDA excludes. The gap between reported profitability and cash generation is widening as Coinbase increases equity compensation to retain engineers during headcount reductions.
Free cash flow of $197.3 million at a 16.2% margin remained positive, down 5.8 percentage points year over year but still meaningfully above zero. Coinbase is not burning cash despite the macro pressure. It is generating less of it. The company’s ability to remain free cash flow positive during a quarter that produced a $359.5 million GAAP loss speaks to the underlying economics of the business model. Custody fees, staking revenue, and USDC economics generate cash regardless of whether Coinbase reports a profit or loss under GAAP rules.
The X AMA and what it signals
Coinbase replaced its traditional earnings call with a live AMA on X, the first major public company to do so for a quarterly earnings report. The format shift was not random. It was a statement about who Coinbase considers its primary audience.
Traditional earnings calls are designed for institutional analysts. They follow a scripted format: prepared remarks, then questions from buy side and sell side analysts who have been pre screened by investor relations. The X AMA inverted that hierarchy. Brian Armstrong took questions from anyone in the replies, including retail investors, crypto developers, and critics.
Armstrong used the format to deliver the quarter’s most quotable line: “Coinbase is no longer a bet just on the price of Bitcoin. All of financial services are getting updated by crypto technology, whether that is trading or payments or lending. And Coinbase is the best positioned company in the world to power this.”
He also emphasized the diversification narrative: “We are diversifying revenue both on the trading fee side and on subscription and services with non trading fees.” The framing was deliberate. In a quarter where every line item missed estimates, the message was that missing by less next time will require looking at a different set of numbers.
The claim is ambitious. But the numbers partially support it. With bitcoin at 12% of revenue, prediction markets at $100 million annualized, USDC generating $292 million per quarter, and institutional trading growing 64.6% year over year, the diversification strategy is producing measurable results. The problem is that all of these new revenue streams combined still could not offset a quarter of declining trading fees. The Everything Exchange is still powered primarily by the original engine, and that engine runs slower when crypto prices fall.
The engineering efficiency argument
Buried in the shareholder materials was a data point that received almost no analyst attention: pull requests per engineer increased 2.2 times year over year, and integration test coverage grew 2.5 times in six months.
These are operational metrics, not financial ones. But they matter for the long term thesis. Coinbase’s strategy requires it to ship products faster than market conditions can erode its core business. If the Everything Exchange needs prediction markets, tokenized stocks, agentic payments, and international expansion to work simultaneously, it needs an engineering organization that can execute on multiple fronts without proportional headcount growth.
The 14% workforce reduction announced earlier in the quarter makes the productivity data more significant. Coinbase is cutting headcount while increasing output per engineer. The new CTO appointment that accompanied the layoffs signals a deliberate shift toward smaller, more productive teams instead of the growth at all costs hiring pattern that characterized the 2021 bull market.
If the trend holds, it suggests the cost structure can improve even without revenue recovery. A company that ships twice as much code with 14% fewer engineers is building operating leverage that does not appear in quarterly revenue figures but compounds over time.
The Singapore expansion provides a concrete example of how engineering efficiency translates into market access. Coinbase announced plans to grow its Singapore workforce to 200 by year end 2026, focusing on compliance engineering and product localization. If a smaller but more productive engineering team can support simultaneous launches in Canada, Singapore, and other international markets, the per market cost of expansion falls materially. The Everything Exchange thesis depends on geographic reach as much as product breadth. Engineering efficiency is the prerequisite for both.
The question is whether engineering velocity translates into product market fit across enough segments to offset the structural decline in consumer trading fees. Shipping code faster does not help if the products do not find users. The prediction market and Coinbase One traction suggests at least some of the new products are finding demand. But the consumer trading segment, which still generates more revenue than any other single line, continues to shrink.
What to watch
- Q3 trading volumes and the ETF stabilization signal. Coinbase noted that Bitcoin ETF outflows, which hurt custody revenue in Q2, had already stabilized entering Q3. Positive custody inflows excluding ETFs continued. The question is whether spot volumes recover alongside stabilized custody.
- Prediction markets regulatory landscape. With Kalshi facing lawsuits in multiple states, Coinbase’s regulated prediction market offering could capture displaced volume. Watch for quarterly prediction market revenue to exceed $30 million, which would put it on track for a $120 million annualized rate.
- USDC market share trajectory. USDC’s rise from roughly one fifth to more than one quarter of the stablecoin market directly drives Coinbase’s highest margin revenue. If Base chain continues gaining stablecoin volume at the current 7x year over year rate, this line item could offset trading fee declines.
- The stock’s valuation versus fundamentals. At a forward price to earnings ratio of 117.65 and a beta of 3.35, Coinbase trades as a high volatility growth stock. The analyst consensus target of $214.94 implies roughly 32% upside from current levels. If the Everything Exchange thesis holds, the current price reflects the market’s skepticism about execution.
- Revenue growth deceleration. Analysts project only 5.1% revenue growth over the next 12 months, a sharp deceleration from the 15.4% annualized rate of the prior two years. Whether Coinbase can beat this projection will determine whether the stock recovers or continues trading at depressed multiples.
Frequently asked questions
How much revenue did Coinbase report in Q2 2026?
Coinbase reported total revenue of $1.22 billion, missing the consensus estimate of $1.30 billion by approximately $80 million. Revenue declined 18.5% year over year from roughly $1.50 billion in Q2 2025.
What was Coinbase’s earnings per share in Q2?
Coinbase reported GAAP earnings per share of negative $1.36, far below consensus estimates that ranged from negative $0.01 to positive $0.14. The total GAAP net loss was $359.5 million.
What is Coinbase’s crypto trading volume market share?
Coinbase achieved an all time high crypto trading volume market share of 10.3% in Q2 2026, up from 9.1% in Q1. This was the third consecutive quarter of record market share gains.
How much revenue do prediction markets generate for Coinbase?
Prediction markets revenue grew 106% quarter over quarter in Q2, crossing $100 million in annualized run rate. The newer crypto binaries product generated three times the daily traders compared to its May average.
How much USDC does Coinbase hold?
Average USDC held on the Coinbase platform reached an all time high of $20 billion in Q2, representing more than 30% of all USDC in circulation. Coinbase captures approximately 50% of all USDC economics.
Why did Coinbase replace its earnings call with an X AMA?
Coinbase became the first major public company to replace a traditional quarterly earnings call with a live AMA on X. The format shift signals a strategic pivot toward retail and crypto native audiences rather than the institutional analyst community.
Is Coinbase still profitable on an adjusted basis?
Yes. Despite the GAAP net loss, Coinbase maintained its 14th consecutive quarter of positive adjusted EBITDA at $207.8 million. Free cash flow was $197.3 million at a 16.2% margin. Cash and equivalents stood at $8.6 billion.
What is the analyst price target for Coinbase stock?
The analyst consensus price target is $214.94, implying approximately 32% upside from the post earnings trading price of roughly $163. The stock trades at a forward price to earnings ratio of 117.65 with a beta of 3.35.
Disclaimer: This article is for informational purposes only and does not constitute financial or investment advice. The information presented reflects publicly available data as of July 31, 2026. Readers should conduct their own research and consult qualified financial advisors before making investment decisions.


The United States and Iran are again at war. The renewed conflict is not about Iran’s nuclear program or regime change, but over the Strait of Hormuz through which a fifth of the world’s oil must pass.
For two weeks, American missiles have struck Iran. In turn, Iran has retaliated against American allies: Kuwait, Bahrain, and Jordan. Four U.S. soldiers have been killed and 142 wounded; at least 53 Iranians have been killed and 592 injured since July 6. Iran’s Islamic Revolutionary Guards Corps (IRGC) claimed to have destroyed an oil tanker in the Strait of Hormuz. Traffic in the strait has slowed to a trickle and oil prices have jumped again.
The ceasefire and the initial agreement signed on Jun. 17 lasted barely three weeks, undone by rival readings of a deliberately vague text. Washington wanted free navigation in Hormuz restored; Tehran insisted that it was the master of the strait. When traffic resumed, ships and tankers avoided the mined central route of the strait and hugged its southern coast close to Oman under American protection or sailed along the northern coast of Hormuz close to Iran, where it levied a “toll” for safe passage.
On July 7, the IRGC fired on ships defying routes designated by Iran; American airstrikes followed. Three days later, on July 10, President Donald Trump notified Congress that the war between the U.S. and Iran had resumed. Iran formally suspended the agreement, citing strikes, sanctions and Israel’s operations in Lebanon.
The costs are mounting. For decades, maritime traffic from Saudi Arabia, whose eastern border sits on the Persian Gulf, has passed through Hormuz to reach the Arabian Sea and the Indian Ocean. Since the closure of Hormuz, the Kingdom has been moving roughly four million barrels a day—around four times its pre-war volume—through the port of Yanbu on the Red Sea, along its western border.
But the Red Sea has a chokepoint of its own: the Strait of Bab al-Mandab, at its southern end, off the coast of Yemen, which connects it to the Gulf of Aden and the broader Arabian Sea. On July 20, the Houthis, Iran’s allies in Yemen, declared a maritime embargo on Saudi Arabia at Bab al-Mandab, invoking “an eye for an eye.” They have already struck two Saudi tankers in the Red Sea. With the chokepoints of Hormuz and Bab al-Mandab now contested simultaneously, the Gulf’s energy systems face an unprecedented strain.
American strikes have targeted Iran’s southern coastline and the approaches to Hormuz, with inland strikes largely reserved for the missile bases that allow Iran to reach the U.S. bases across the region. Its intensity is lower than the 40-day military campaign that preceded it, and it is an open-ended campaign: a war of attrition fought over a waterway. This is, for now, a bilateral contest, with Washington keeping Israel outside the frame for as long as Iran refrains from striking Israeli territory directly.
American objectives have contracted to reopening the Strait of Hormuz. Having survived the war and denied the U.S. and Israel their stated aims, Iran now regards the outcome as a victory and is working to shape and cement its terms.
Why Iran thinks it has won
Iran has managed to impose significant human and material costs. The war has already cost the U.S. more than $37.5 billion, 18 U.S. service members have been killed and 624 have been injured. Wartime learning, intelligence and technological cooperation with Russia and China, and better access to satellite imagery have markedly improved Iran’s missile and drone strike accuracy. And Iran has been able to rattle the global energy markets by closing the Strait of Hormuz, weaponizing a chokepoint that offers continuous leverage over the global economy.
Iranian strategists are aiming for something more ambitious: raising the cost of hosting American forces until the U.S. thins out its regional military presence. The U.S. has indeed moved some military assets away from the Persian Gulf toward Jordan and Israel. American radars, bases and surveillance systems across the Arab states also function as early-warning systems for Israel. Iran’s concentrated attacks on those systems in March and April likely improved its ability to attack Israel with its long-range missiles.
Tehran seems to hope that a combination of its control of Hormuz and the coercive power of its drones and missiles would make the Gulf states reluctant to host U.S. forces and facilitate military operations against Iran. That instead, the Gulf states would seek security arrangements with the Islamic Republic.
Iran is also tailoring its approach to different Gulf countries: it has no appetite for a direct war with Saudi Arabia, so the Houthis in Yemen carry the Saudi file. The Houthis imposed their embargo on the Bab al-Mandab Strait on July 20, days after Iranian officials signaled that the strait would close if American strikes on Iran’s infrastructure continued. The Houthis had their own reasons to move, especially Riyadh’s siege of Yemeni ports and a military strike on Sanaa airport. But either way, Tehran gained a second strategic chokepoint.
Intense Iranian attacks on Kuwait are the lesson intended for every Gulf state hosting U.S. forces. Kuwait facilitated American strikes on Iran from its territory, and Iranian drones have answered by striking the power and desalination plants that Kuwait depends on for roughly 90% of its drinking water. The strikes on Kuwait are also aimed at degrading a potential staging ground for a potential U.S. ground operation in southern Iran.
What this strategy lacks is a clear account of how Iran would convert wartime leverage into a durable political settlement. Tehran has shown how it can disrupt global energy supplies and impose costs on the U.S. and its allies, but it is not clear how it can remain in a permanent state of confrontation with America and the Gulf states.
Iran, America, and the limits of force
The first challenge Iran faces is the asymmetry of pain thresholds. American credibility is on the line, but Iranian territory is being hit hard. Year-on-year inflation in Iran reached an astonishing 88.6% by late June. In southern provinces, which are facing the brunt of the renewed conflict, inflation has crossed 101% in Hormozgan, 99% in Khuzestan, and 96.5% in Bushehr. Iran’s energy ministry has asked the citizens to ration electricity in extreme heat as American strikes strain the electricity grid. The Islamic Republic crushed a nationwide uprising in January, has an economy in free fall, and is fighting a war with America. Its most dangerous front may prove to be the domestic one.
Iran’s coercion of the Gulf states may produce the very coalition it fears. Attacks on Kuwaiti power and desalination plants are pushing Kuwait, Saudi Arabia, and the United Arab Emirates toward closer security cooperation with each other, with Washington, and eventually, with Israel. Given the disparity in economic resources between Iran on one side of the Persian Gulf, and Saudi Arabia, the United Arab Emirates, and Qatar on the other side, a counterbalancing bloc would hold the stronger hand over time.
The biggest challenge Iran faces: Israel’s secretive nuclear powers. Iran has been trying to destroy the U.S. surveillance and radar systems in the Gulf that serve as early warning systems for Israel. If Iran continues succeeding in degrading those early warning systems, Israel would have to confront its missiles with less warning and thinner interception depth. A more vulnerable Israel could lean harder on its nuclear deterrent. Iran’s success could turn out to be extremely dangerous.
Washington’s options are no better. Trump has promised to destroy “one bridge or power plant” for every ship Iran fires on. A war on infrastructure would amount to war crimes by Washington, and it would not change Tehran’s calculations. Iran would retaliate against Gulf infrastructure, and the destruction would spread across states that are party to none of this.
Airstrikes on Iran’s most sensitive nuclear facilities would also yield little. Trump has threatened to “very heavily” hit the area around Pickaxe Mountain, a fortified underground site near Natanz, one of Iran’s primary nuclear enrichment facilities. Such an attack would produce symbolic effects and trigger Iranian retaliation against energy and other critical infrastructure in the Gulf.
With the International Atomic Energy Agency locked out of Iran since June 2025 and the fate of nearly 400 kilograms of highly enriched uranium unverified, fresh air strikes on nuclear facilities in Iran would make it even harder to determine what nuclear material and capabilities remain, where they are located, and how quickly the program could be rebuilt. Subsequently, greater ambiguity around Iran’s nuclear capabilities would make any settlement harder to negotiate and verify.
That leaves ground operations. On July 15, Trump reportedly convened a meeting to weigh seizing Kharg Island, through which some 90% of Iran’s crude exports pass, and other territory along the strait. U.S. officials told the Wall Street Journal that Trump remained reluctant to commit ground forces. The threat of a ground invasion is only a threat as long as it stays a threat. Kharg and other such Iranian islands are hard to take and harder to hold. Their occupation would sharply reduce Iran’s oil revenue, but it would not necessarily compel Tehran to reopen the Strait of Hormuz or accept American terms. Iran could respond by intensifying attacks on Gulf energy infrastructure and shipping, while presenting the seizure of its territory as proof that the war had become one of national defense.
Neither Iran nor America has a credible military path to a durable settlement that ends the fighting, restores freedom of navigation through the Strait of Hormuz, and prevents another rapid return to war. Iran’s problem is the long-term cost of its current strategy; Washington’s problem is the diminishing returns on each additional night of bombing.
The choice Tehran and Washington have to make
The way out runs through the initial agreement. Its basic bargain remains workable: Iran would restore freedom of navigation through the Strait of Hormuz and halt attacks on U.S. forces, while Washington would lift its naval blockade of Iran, end its air campaign and suspend the punitive measures imposed after the agreement collapsed.
Pakistani and Qatari mediators are still working. What sank the previous deal was ambiguity: obligations without sequencing, commitments without monitoring, and no mechanism for containing an incident at sea before it became a campaign. Any new agreement will have to specify who verifies what, in what order, and what happens when a ship is hit.
Iran faces a larger decision. It cannot strike American assets in Gulf states indefinitely while expecting those states to put up with the attacks. Tehran must choose between a region organized around coexistence and one it hopes to dominate. Bids for hegemony summon their own opposition: the counter-coalition Iran could provoke, backed by Washington and Israel, would leave it more encircled than the war that began in February ever did. That is the calculation Tehran has yet to make, and the one on which everything else now depends.


SBI Holdings has reaffirmed its exposure to Ripple, telling investors that its Ripple shareholding carries an estimated value of $41.2 billion despite weaker XRP prices and sluggish crypto market conditions.
Summary
- SBI cited a ¥6.6 trillion valuation for its Ripple shareholding during its first-quarter earnings presentation.
- SBI’s crypto asset business posted a ¥1.4 billion pretax loss, although market maker B2C2 remained profitable.
- First-quarter net profit rose 149.9% year over year to ¥148.1 billion.
- SBI is also expanding through the Canton Network and a ¥3 billion crypto fund.
SBI maintains its Ripple position despite XRP weakness
SBI discussed its Ripple investment while reporting results for the first quarter, during which the Japanese financial group described its cryptocurrency business as sluggish.
Management linked the muted operating environment partly to uncertainty over whether the U.S. Senate will pass the CLARITY Act, a proposed market structure bill intended to define oversight responsibilities for digital assets.
“The cryptocurrency business remains sluggish, as if waiting to determine whether the CLARITY Act will be enacted,” SBI said in its earnings presentation.
The company added that its “Ripple shareholding alone is worth ¥6.6 trillion,” equivalent to about $41.2 billion at current exchange rates. The figure represents SBI’s stated valuation and should not be confused with cash realized from selling the investment.
SBI has maintained a relationship with Ripple for roughly a decade. The companies formed SBI Ripple Asia in 2016 to promote blockchain-based payments and settlement services across Japan and other Asian markets.
XRP’s recent decline has weakened sentiment around Ripple-linked assets, but SBI’s comments indicate that the group continues to treat the relationship as a long-term strategic investment rather than a short-term position tied solely to the token’s price.
CLARITY Act remains a key US catalyst
SBI’s comments placed part of the focus on Washington, where lawmakers have continued negotiations over the CLARITY Act before the Senate’s August recess.
Sen. Cynthia Lummis said Senate Majority Leader John Thune had retained space for the legislation on the chamber’s agenda, although nominations, government funding and a sanctions vote were competing for floor time.
“I believe he does intend to go through with it,” Lummis said, adding that a vote could occur within days.
Passage is not guaranteed. Senate leaders would need enough support to overcome procedural hurdles, while any amended version could also require further action in the House.
For Ripple and other U.S.-linked crypto businesses, the bill could provide clearer boundaries between the Securities and Exchange Commission and Commodity Futures Trading Commission. SBI’s remarks suggest the Japanese group views progress on U.S. regulation as relevant to both market activity and Ripple’s longer-term prospects.
SBI reports record first-quarter earnings
Weakness in SBI’s digital asset division did not prevent the broader group from recording its strongest first quarter.
Revenue reached ¥571 billion, while profit before tax climbed to ¥225.8 billion. Net profit attributable to shareholders rose 149.9% from a year earlier to ¥148.1 billion.
SBI reported a 29% return on equity over the past year, exceeding its medium-term target of 15%. However, the crypto asset segment recorded a ¥1.4 billion pretax loss. SBI said institutional crypto market maker B2C2 remained profitable during the period.
The group is also seeking to expand its domestic digital asset business through crypto lending, stablecoin-related services and its planned acquisition of Bitbank. SBI expects the deal to help increase its crypto customer base to about three million accounts and lift assets under custody to approximately ¥870 billion.
SBI expands beyond Ripple and the XRP Ledger
SBI’s blockchain strategy is no longer limited to Ripple. Earlier this week, the group restructured a wholly owned subsidiary to focus on the Canton Network, an institutional blockchain designed for regulated financial markets.
SBI Security Solutions was renamed SBI Digital Practice Co. Ltd. The company will develop financial infrastructure and applications for institutions, including regulatory compliance tools and systems supporting cross-border and multi-currency transactions.
SBI Financial Services has also partnered with Japanese game developer Gumi on SBI Crypto Fund I. The private fund began operating on Aug. 1 with roughly ¥3 billion in committed capital and will invest mainly in Bitcoin and major listed altcoins. Daiwa Securities Group and other investors have backed the vehicle, although individual commitments and planned allocations were not disclosed.
Together, the Ripple holding, Canton Network unit and new investment fund show SBI is broadening its digital asset exposure even as XRP and its crypto division face near-term pressure.


Pump.fun co-founder Noah Tweedale reportedly attributed the layoffs to said the company growing too quickly.

“This year’s honorees come from more than a dozen countries, reach audiences across every major platform, and are shaping everything from science, fashion, technology, sports, and entertainment,” TIME’s CEO Jessica Sibley said in her welcome remarks, stepping behind the DJ booth to address the crowd. “Together, you command a combined social following of more than 1 billion across the world’s leading digital platforms,” she continued. “You’re driving the economy—building businesses, creating opportunities, and delivering real value for your audiences.”
Throughout the night, influencer and skin-care brand founder Alix Earle, who appears on the TIME100 Creators cover, posed for photos with guests. Maura Higgins and Serena Page, both supernovas in the Love Island cinematic universe and beyond, reunited with a big hug. Creator mental-health advocate Shira Lazar and psychiatrist turned creator Judith Joseph chatted in the bathroom line. And Kane Parsons—the 21-year-old YouTuber turned director of A24’s Backrooms, which this year became the studio’s highest-grossing feature to date—stopped by the red carpet for an interview conducted by 2025 listee Cyrus Veyssi.
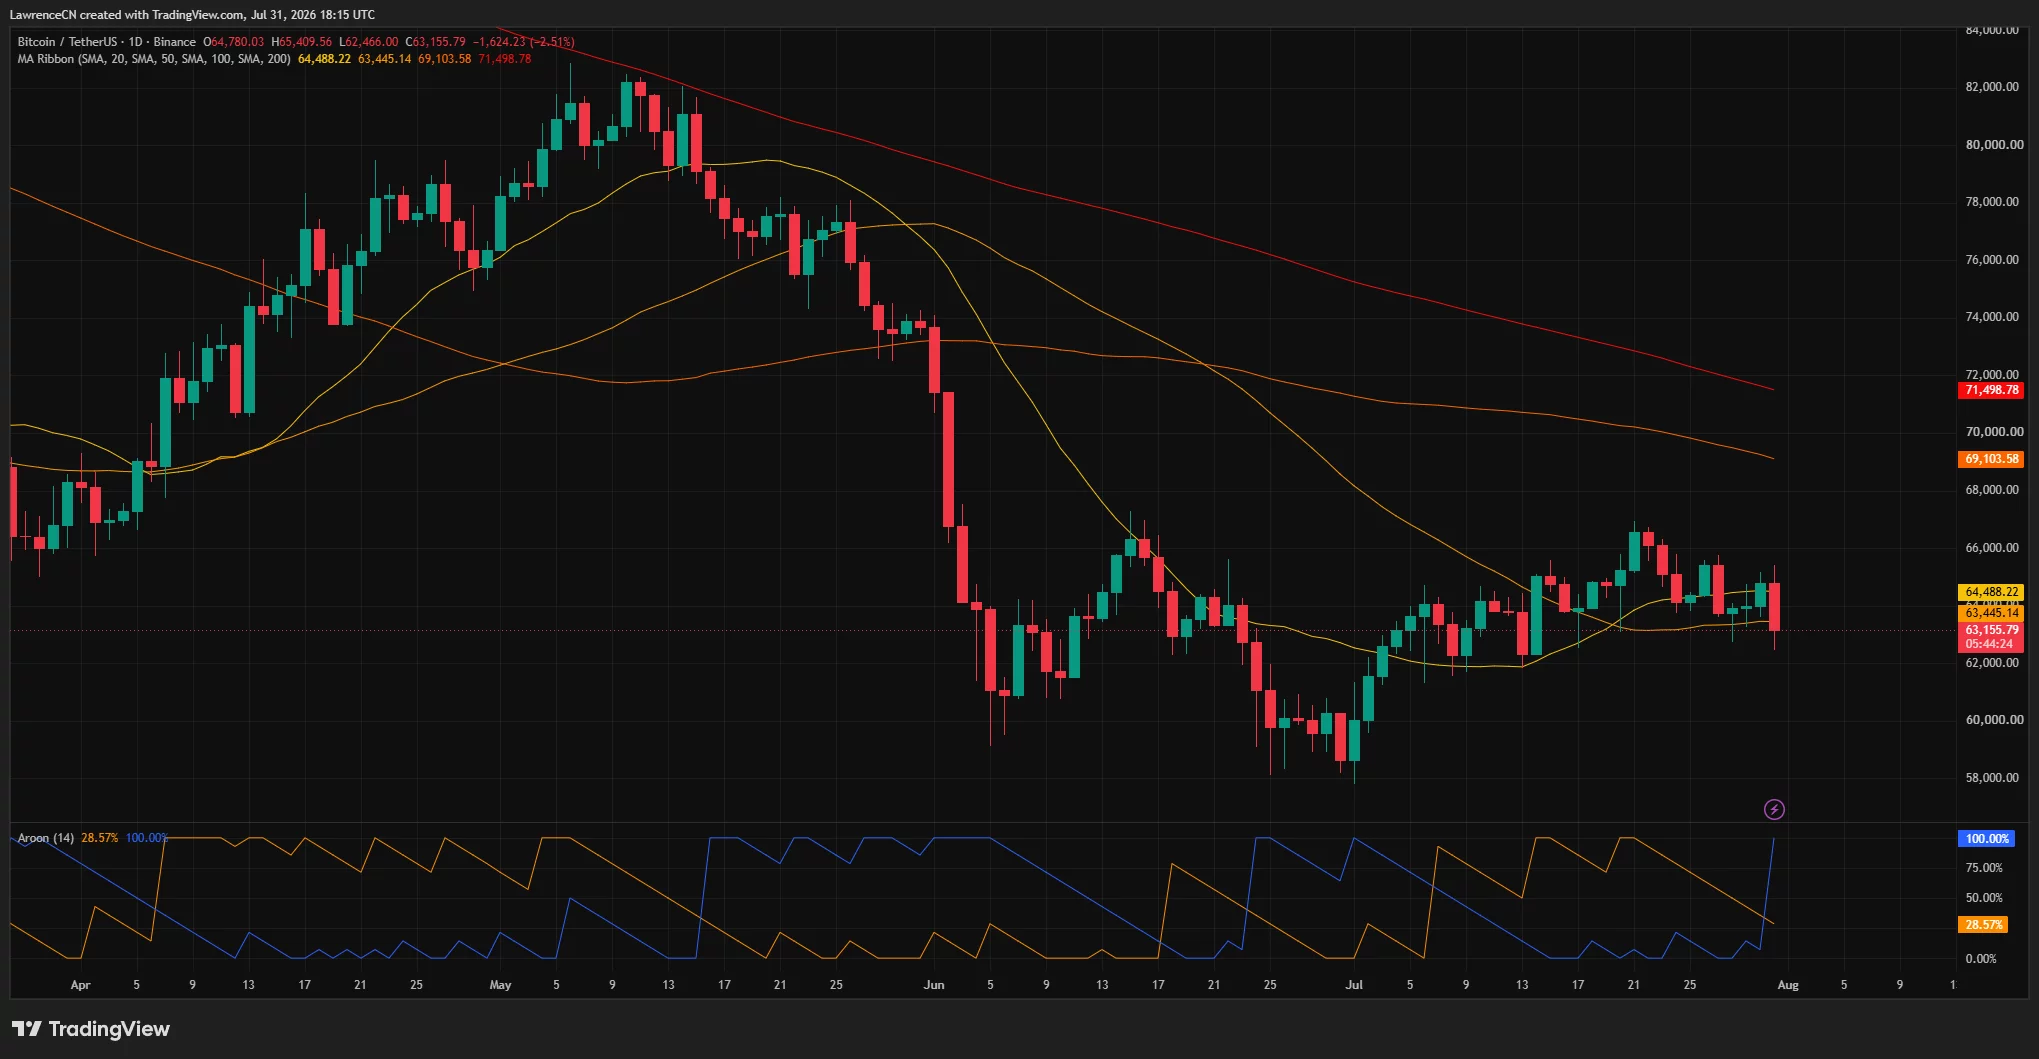
Bitcoin price fell below $64,000 on July 31 as renewed U.S.–Iran tensions lifted oil prices and strengthened the dollar, while its 4-hour chart formed a bearish rounded-top structure.
Summary
- Bitcoin price fell as low as $62,466, extending its rejection from the $65,000 area.
- A rounded-top breakdown points toward $59,000 if support near $62,000 fails.
- Iran reportedly attacked two tankers under U.S. escort in the Strait of Hormuz.
- Oversold momentum and concentrated liquidity near $62,000 could produce a short-term rebound.
Bitcoin price falls below key moving averages
According to data from crypto.news, Bitcoin (BTC) price dropped as much as 3.6% from its intraday high on Friday, sliding from $65,410 to a low of $62,466. It was trading near $63,155 at the time of the daily-chart snapshot, down 2.5% for the session.
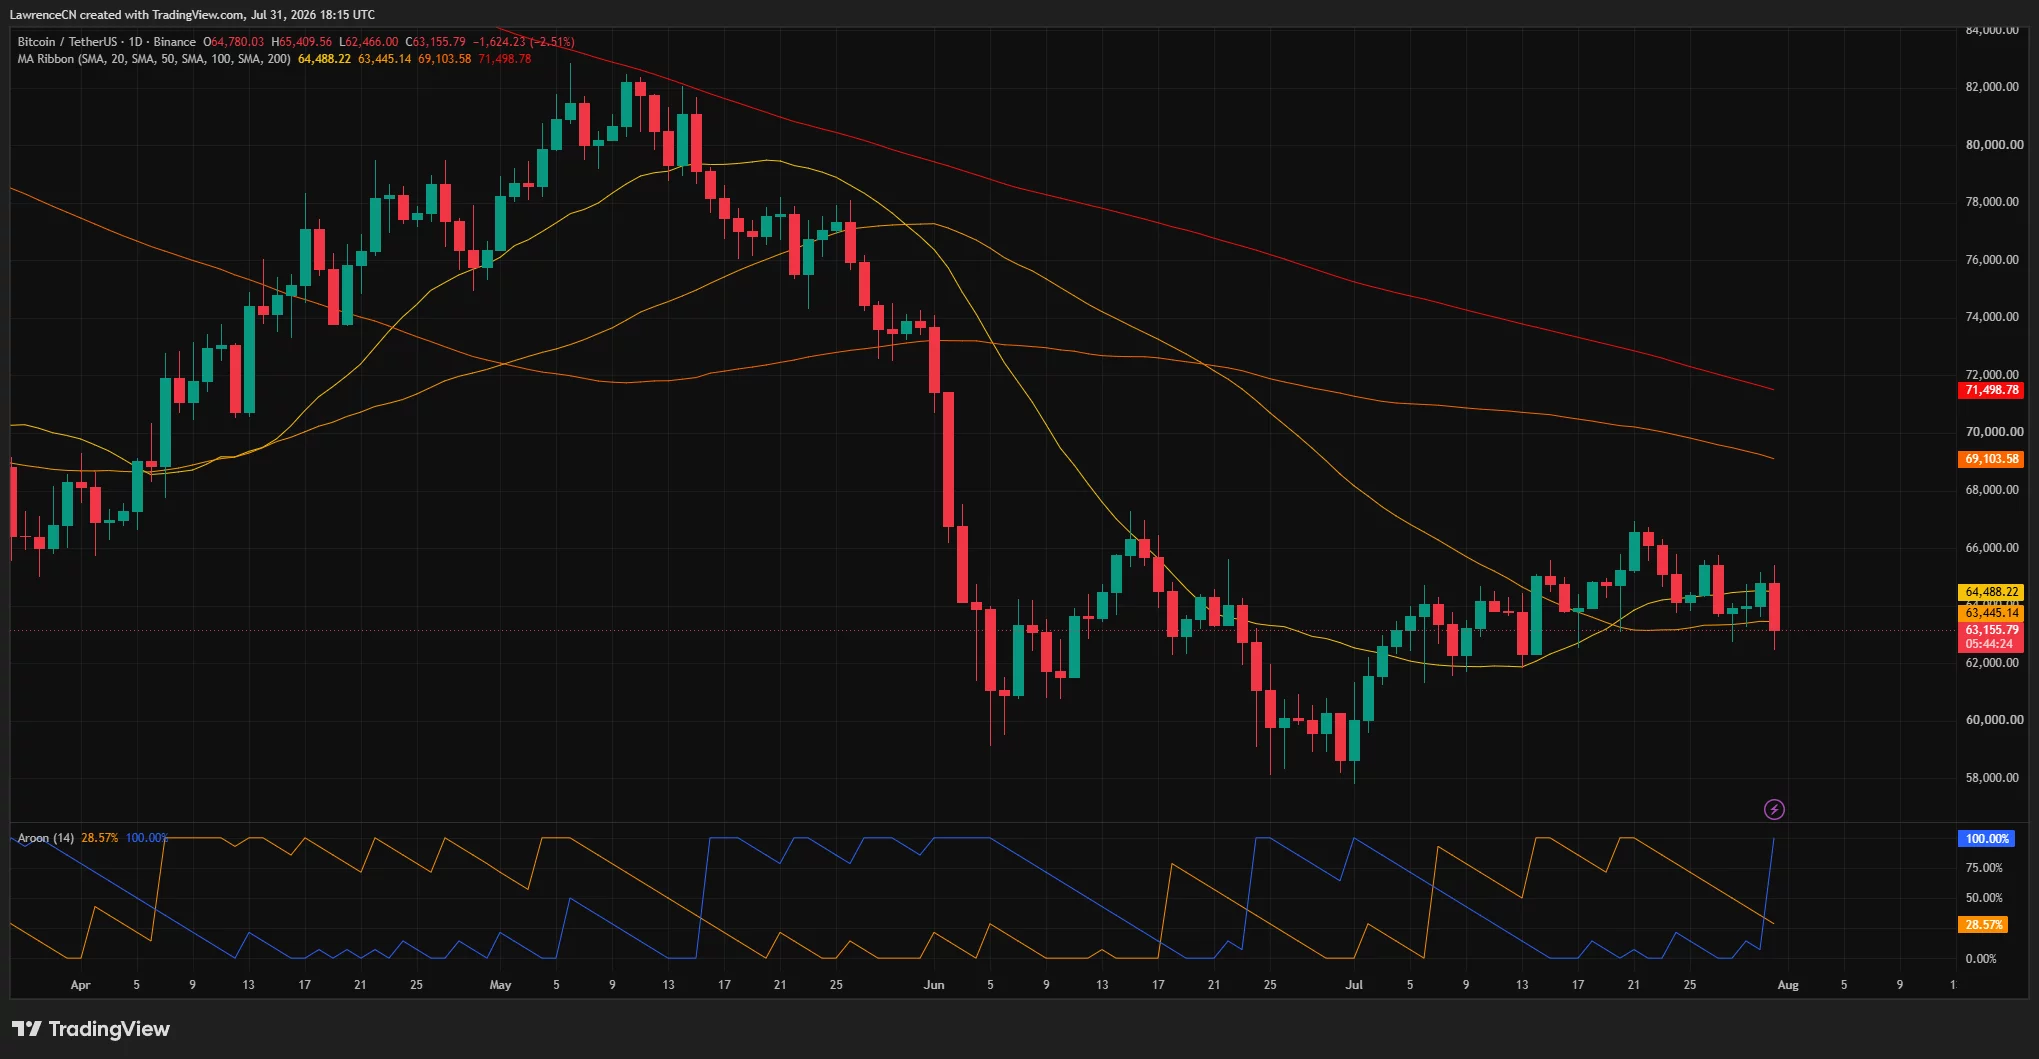
The decline pushed Bitcoin below its seven-day and 25-day simple moving averages at approximately $63,445 and $64,488. Losing both levels indicates that short-term sellers have regained control after BTC failed to sustain its July recovery.
Bitcoin also remains far below the 50-day SMA at $69,104 and the 200-day SMA near $71,499. These averages represent major overhead resistance and reinforce the wider bearish structure that has remained in place since the asset fell from above $82,000 in May.
The daily Aroon indicator supports the bearish reading. Aroon Down jumped to 100%, while Aroon Up stood at 28.57%, showing that the latest low occurred much more recently than the last meaningful high.
However, Bitcoin has not yet broken the broader range between approximately $58,000 and $67,000. Sellers would need to force a sustained move below $62,000 to expose the lower end of that structure.
Iran escalation adds to risk-off pressure
Bitcoin’s latest decline coincided with another escalation in the U.S.–Iran conflict and renewed concerns about energy supplies passing through the Strait of Hormuz.
Iran said it attacked two oil tankers attempting to cross the waterway under U.S. military escort. Tehran also claimed it turned back four other vessels, while ship-tracking data showed that traffic through the strait remained thin.
The development carries greater market risk than an isolated attack on commercial vessels because the presence of a U.S. escort raises the possibility of a direct military response.
Iran separately launched drone attacks targeting U.S.-linked military facilities in Kuwait and Bahrain. Kuwait said it intercepted the drones and reported no casualties.
President Donald Trump also convened his Cabinet at Camp David as the administration considered its next steps in the conflict. No new military operation was formally announced during the meeting.
Meanwhile, the U.S. Senate failed in a 49–50 vote to advance a measure restricting Trump’s authority to continue hostilities. The result left the administration’s short-term military options largely unchanged.
These developments lifted oil prices and renewed concerns that higher energy costs could keep U.S. inflation elevated. A stronger dollar and rising Treasury yields added pressure on Bitcoin and other non-yielding risk assets.
The reported U.S.–Israeli proposal for a land blockade of Iran remains an option under discussion rather than an announced policy. It would reportedly involve persuading neighboring countries to restrict Iranian imports and exports.
Bitcoin rounded top targets $59,000
Bitcoin’s 4-hour chart shows a rounded-top formation developing since late June. BTC climbed from approximately $59,000 to a July 22 peak near $66,700 before forming a gradual series of lower highs.
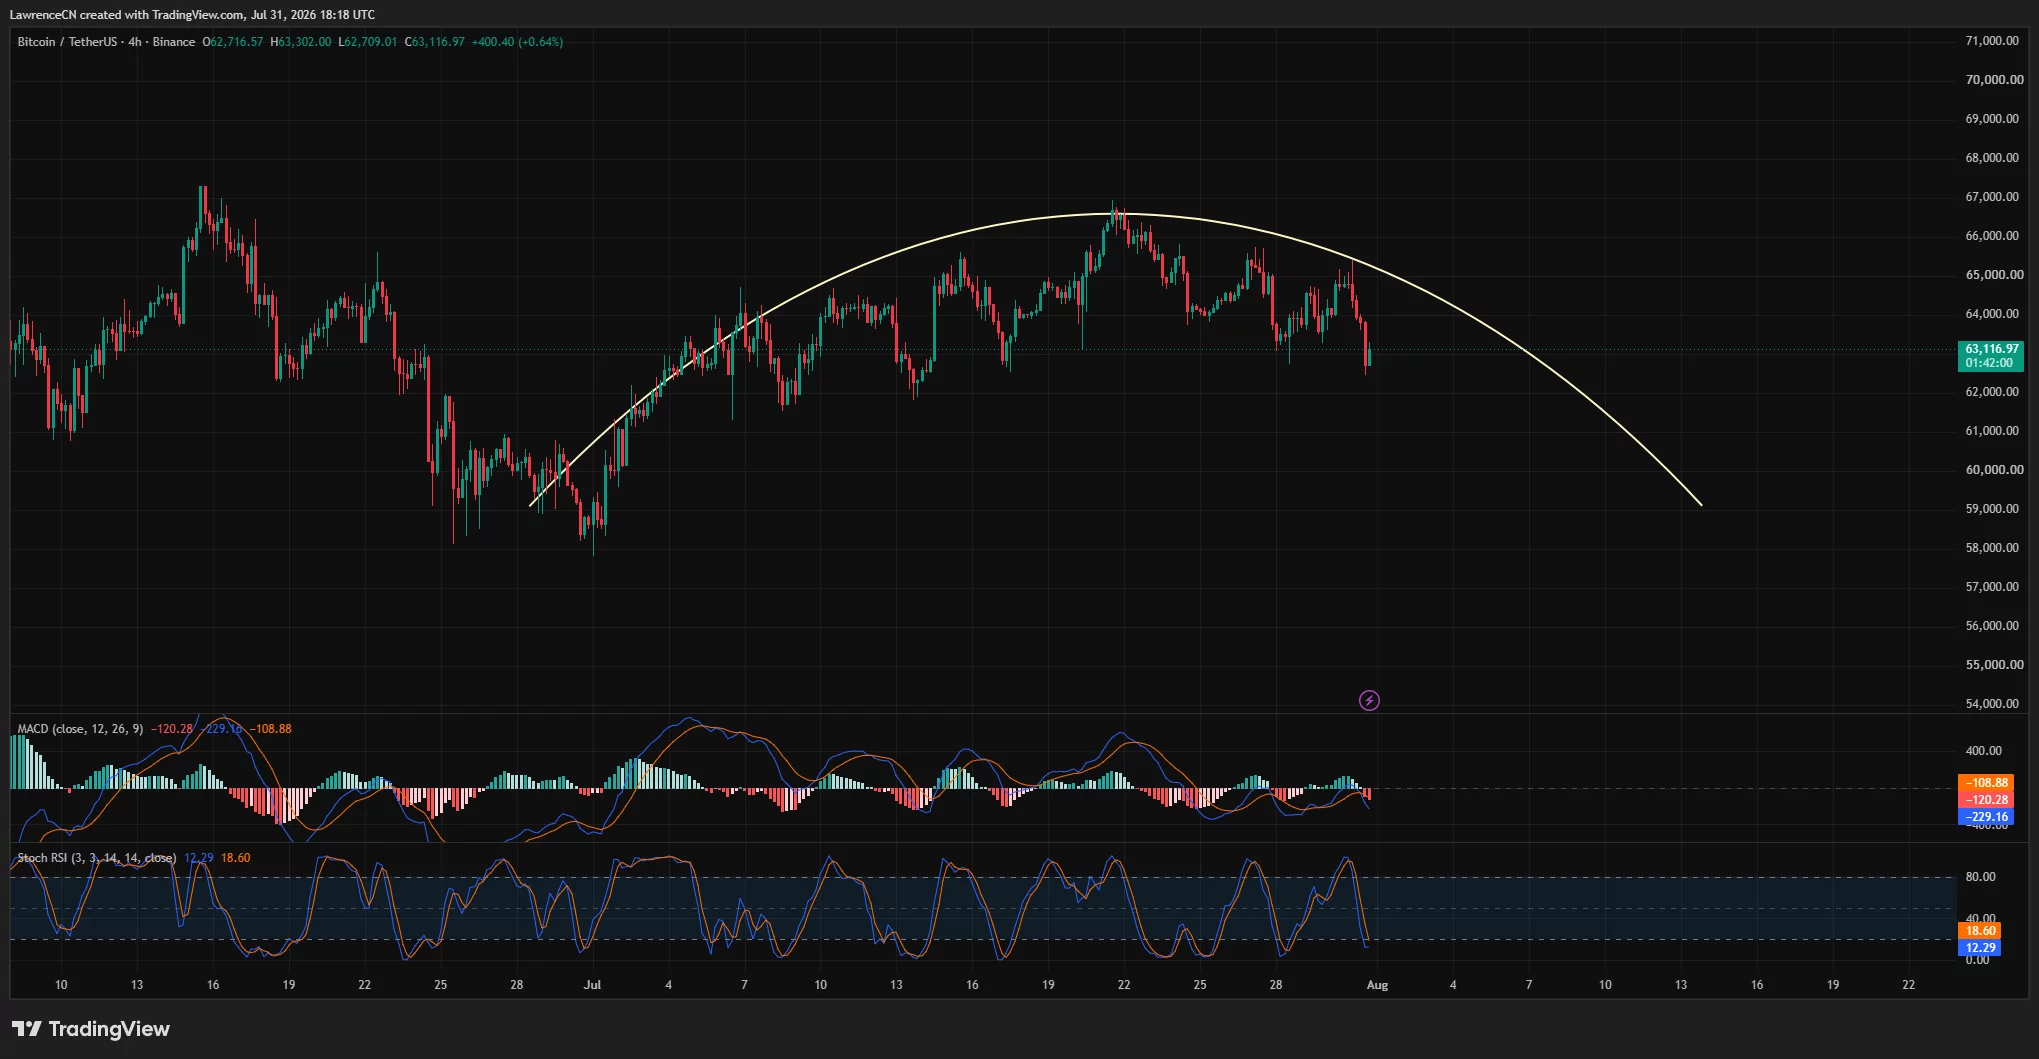
The latest rejection from around $65,000 pushed the price toward the pattern’s neckline between $62,000 and $63,000. A confirmed 4-hour close below that area could validate the breakdown and place $59,000 back in focus.
Momentum indicators currently favor sellers. The 4-hour MACD line fell to approximately minus 229, below its signal line near minus 109. The negative histogram widened to around minus 120, showing that bearish momentum accelerated during the latest decline.
Still, the Stochastic RSI has reached oversold territory. Its two lines stood at 12.29 and 18.60, both below the 20 threshold. That reading does not guarantee an immediate recovery, but it suggests that the sell-off may be becoming stretched over the short term.
Bitcoin may therefore retest the broken $63,400–$64,500 area before deciding its next direction. Reclaiming $64,500 would weaken the immediate bearish setup, while a move above $65,500 would challenge the rounded-top structure.
Liquidity near $62K could trigger a reversal
Trader Ted Pillows identified another possible downside target using Bitcoin’s liquidation map. He said the decline had already cleared much of the liquidity beneath the previous trading range, leaving a remaining concentration close to $62,000.
“There’s still one cluster around the $62,000 level, which might be next. But after that, a reversal might happen.”
The $62,000 area aligns with the rounded top’s neckline and several recent intraday lows, making it the most important near-term level.
A sweep below that support could trigger leveraged long liquidations before buyers attempt a recovery. Failure to attract demand would instead open the path toward $60,000 and the rounded-top objective near $59,000.
On the upside, Bitcoin must first reclaim $63,445 and $64,488. Stronger resistance sits between $65,000 and $66,700, where several July rallies stalled.
Geopolitical headlines remain the immediate external risk. Further attacks involving U.S. forces, tankers, or major shipping routes could lift oil and extend the risk-off move. Conversely, evidence of negotiations or safer passage through Hormuz could ease inflation concerns and help Bitcoin stabilize.
Disclosure: This article does not represent investment advice. The content and materials featured on this page are for educational purposes only.

AMLBot, a crypto compliance and forensics firm, has introduced “AI Tracer,” a new self-service blockchain analysis tool designed to help users follow funds across networks starting from a single transaction hash. The company positions the product as a way to reduce reliance on specialist tracing software and deep internal expertise when investigating how crypto moves on-chain.
In an announcement shared with Cointelegraph, AMLBot says AI Tracer automatically builds a transaction graph, follows movements of funds through intermediate wallets, and attempts to map the journey toward the endpoint addresses the funds ultimately reach. As it walks the trail, the tool matches wallet activity against known entity labels such as exchanges, related services, and flagged addresses.
Key takeaways
- AI Tracer is a self-service tracing tool that begins with a transaction hash and maps visible fund movements across supported blockchains.
- The tool is designed to follow cross-chain transfers through bridges and to handle cases where assets are split among multiple wallets.
- According to AMLBot, AI Tracer cannot view transfers between internal exchange accounts or explain the intent behind payments.
- Reports are intended as an investigation starting point and do not replace audits, legal processes, or asset recovery.
- The product includes a free check and paid plans that increase the number of automated checks.
How AI Tracer works for on-chain investigations
The core premise behind AI Tracer is graph-based transaction tracing. AMLBot states that the process is automatic: the system traverses the transaction graph from a starting transaction, follows where funds move through intermediary wallets, and continues until it reaches the money’s endpoint. This approach is aimed at giving users a structured view of the transfer path instead of requiring manual analysis across many hops.
A key added layer is entity labeling. AMLBot says it “matches known entity labels — exchanges, services, flagged addresses — against every wallet it encounters” during the traversal. For traders, compliance staff, and researchers, this can matter because addresses that look unrelated at first glance may in fact map to familiar services, custody providers, or previously identified risk clusters—information that can shape how an investigation is prioritized.
Cross-chain and split-funds tracing—plus clear limits
AMLBot highlights two real-world situations where tracing often becomes complicated: cross-chain activity and value fragmentation. The company says AI Tracer can trace through bridges that move assets between networks. It also claims it can follow cases where assets are split across multiple wallets, which is a common pattern in laundering attempts and in complex payment workflows.
At the same time, AMLBot lays out boundaries to prevent users from over-interpreting outputs. The tool, it says, cannot see transfers between internal exchange accounts. That limitation reflects a broader constraint in public blockchain data: while blockchains can show withdrawals and on-chain transfers, they do not reveal internal bookkeeping decisions inside centralized services. AI Tracer also cannot determine why a payment was made, cannot freeze assets, and does not guarantee recovery.
In the company’s description, AI Tracer’s findings are meant to help form hypotheses and provide a lead for next steps. Reports are positioned as a starting point rather than a substitute for audit procedures, legal processes, or formal enforcement action.
Networks supported and who the tool is for
AI Tracer is currently designed to work across a wide set of networks, according to AMLBot. The supported list includes Bitcoin, Bitcoin Cash, Litecoin, TRON, Ethereum, BNB Chain, Ethereum Classic, Polygon, Arbitrum, Base, Optimism, Solana, Cardano, and Ripple.
AMLBot says the tool is meant for multiple user groups, including journalists, researchers, traders, and crypto users who want to understand transaction paths. It also names law enforcement agents investigating crypto crime, along with independent investigators and compliance teams that need fast, repeatable analysis for due diligence or incident triage.
That “self-service” framing is significant: investigators often face a trade-off between speed and depth. By automating the tracing and labeling steps, AI Tracer aims to lower the initial friction for routine inquiries—especially when someone has a transaction hash but lacks the time or tooling to manually map intermediate hops across chains.
Pricing model and what to watch next
AMLBot states that AI Tracer offers a free check, with paid plans that raise limits on the number of automated checks users can run. While the announcement emphasizes usability and coverage, the practical value for compliance teams will likely depend on those limits and on the consistency of label matching over time.
For readers considering the tool, the biggest takeaway is to treat AI Tracer outputs as a structured visualization of on-chain movement—not as proof of culpability or intent. The company’s own limitations—no visibility into internal exchange transfers, inability to infer payment purpose, and no asset-freezing or recovery guarantees—signal that users should still pair the tool’s results with further verification and formal processes when stakes are high.
Going forward, attention should focus on how effectively AI Tracer handles increasingly complex cross-chain routes and entity labeling as bridge usage and address clustering tactics evolve. Users should also watch for updates that expand network support or refine what the system can reliably infer from public transaction data.


Several users of the long-defunct crypto exchange reported that distribution agents had begun releasing funds to reimburse creditors for some of their 2022 losses.

Marvel Studios Casts Samara Weaving as Emma Frost in X-Men Reboot

Dr. Markus Krall: Financial repression

Greater Manchester mayoral election live: First results announced as Labour’s Bev Craig and Reform UK’s Sian Astley go to second round


-
 Sports5 days ago
Commonwealth Games boxing: Jadumani Singh seals dominant 5-0 win over Pakistan’s Sumama Rehman to enter quarter-finals | Commonwealth Games News
-

 Business2 days ago
Why Trees Belong on the Risk Register
-

 Tech5 days ago
Intel is reversing course and bringing hyper-threading back to its server chips
-

 Crypto World6 days ago
Ripple bought a bank in pieces. The $4 billion audit
-

 Politics4 days ago
Luke Littler dismantles Gerwyn Price to retain title in Blackpool
-

 Fashion2 hours ago
Weekend Open Thread: Wit & Wisdom
-

 Politics3 days ago
The Part of the Electric Transition Nobody Wants to Discuss
-

 News Videos5 days ago
BITCOIN JUST ENTERED THIS CRITICAL ZONE…
-
 Entertainment3 days ago
‘Stargate’ Creator’s New Sci-Fi Series Returns for Season 3 Tomorrow
-

 Crypto World6 days ago
XRP Ledger adds $2.6B as RWA inflows rank second
-

 Business3 days ago
Major shareholder moves on Canyon
-

 News Videos1 day ago
Bitcoin Enters the 3rd Stage of the Bear Market
-

 Politics5 days ago
Spain sweeps the board at 2026 World Cup with individual awards
-

 Entertainment6 days ago
Sara Gilson Killed By Husband After Viral “Pedophile” TikTok Video
-

 Crypto World3 days ago
Kraken Enables Retail Access to Jersey Mike’s IPO via Tokenized Shares
-

 Tech7 days ago
Anthropic launches Claude Opus 5, a cheaper AI model for coding, agents and enterprise workflows
-

 Tech4 days ago
New macOS Sequoia & Sonoma security updates for older Macs
-

 News Videos3 days ago
Claude: Build Financial Dashboards in Minutes (2026)
-

 Politics1 day ago
Luke Littler’s dominance sparks GOAT debate
-

 Crypto World6 days ago
Upbit expands KRW market with two major DeFi token listings
You must be logged in to post a comment Login