
Crypto World
What is a testnet? Blockchain testing explained



A testnet is a separate blockchain network that mirrors a production chain’s rules and functionality but uses tokens with no monetary value. It is where developers break things, test upgrades, and discover bugs before those bugs can cost anyone real money.
Summary
- A testnet is a blockchain network that runs the same software as a mainnet but uses valueless tokens, allowing developers to test smart contracts, protocol upgrades, and applications without financial risk.
- Ethereum has run multiple testnets over its history, with Sepolia and Holesky serving as the primary public testing environments as of 2026 after the deprecation of Goerli.
- Testnet tokens are free and can be obtained from faucets, which are web services that distribute small amounts of test tokens to developer wallet addresses.
- Major protocol upgrades like Ethereum’s Pectra and Cardano’s van Rossem hard fork were deployed to testnets months before reaching mainnet, where they were tested under conditions designed to surface edge cases and failure modes.
- Testnets are not perfect replicas of mainnet conditions. They typically have fewer validators, lower transaction volume, and different economic incentives, which means some categories of bugs only appear after mainnet deployment.
Every piece of software ships with bugs. The question is whether those bugs are discovered in a controlled environment or in production, where they can destroy value. In traditional software development, staging environments and QA processes serve this function. In blockchain, testnets serve the same function but with a critical difference: blockchain bugs are often irreversible.
A smart contract that contains a vulnerability on a testnet loses nothing because the tokens are worthless. The same vulnerability on a mainnet can drain millions of dollars in minutes. The history of decentralized finance is littered with exploits that could have been caught on a testnet if the testing had been more thorough.
This article explains what testnets are, how they work, why they matter for the security of every blockchain protocol, and what their limitations are. If you interact with any blockchain application, the quality of its testnet phase directly affects the safety of your funds.
How testnets work
A testnet runs the same node software as its corresponding mainnet but operates on a separate network with its own genesis block, its own chain of blocks, and its own set of validators or miners. Transactions on a testnet are processed using the same consensus rules, the same virtual machine, and the same transaction format as mainnet transactions. The only fundamental difference is that the tokens have no market value.
This separation is enforced at the network level. Testnet nodes connect to other testnet nodes, not to mainnet nodes. The chain IDs are different, which prevents testnet transactions from being replayed on mainnet and vice versa. When a developer deploys a smart contract to a testnet, that contract exists only on the testnet and has no effect on the mainnet state.
Testnet tokens are distributed through faucets, which are simple web applications that send a small amount of test tokens to any wallet address that requests them. Most faucets impose rate limits to prevent abuse. Some require completing a captcha or connecting a social media account. The tokens have no monetary value by design, though there have been instances where testnet tokens have traded on secondary markets, which defeats their purpose and is generally discouraged by protocol teams.
Developers use testnets to deploy and interact with smart contracts exactly as they would on mainnet. They can test function calls, simulate user interactions, measure gas consumption, and verify that error handling works correctly. Wallet applications, decentralized exchanges, lending protocols, and NFT marketplaces all go through testnet deployment before launching on mainnet.
Types of testnets
Not all testnets serve the same purpose. Public testnets are open to anyone and mirror mainnet conditions as closely as possible. They are used for final stage testing before mainnet deployment and for community members who want to try new features. Ethereum’s Sepolia and Holesky are public testnets. Base’s Beryl testnet is another example of a public testnet used to test protocol upgrades before mainnet deployment.
Private or permissioned testnets are operated by specific development teams and are not open to public participation. These are used for early stage development where the protocol may be unstable or where the team wants to control the testing conditions. Many projects run private testnets for months before opening a public testnet.
Local development networks, sometimes called devnets, run on a developer’s own machine. Tools like Hardhat and Foundry for Ethereum allow developers to spin up a local blockchain instance, deploy contracts, and run tests in seconds without connecting to any external network. These are not true testnets but serve a similar function for unit testing and rapid iteration.
Shadow forks are a newer concept where a testnet replays real mainnet transaction data against a modified version of the protocol. This allows developers to test upgrades against realistic transaction patterns and state sizes rather than the synthetic and often unrealistic conditions of a standard testnet. Ethereum used shadow forking extensively during the preparation for The Merge in 2022.
Why testnet phases matter for protocol upgrades
Major blockchain upgrades follow a predictable lifecycle: specification, implementation, testnet deployment, monitoring, and finally mainnet activation. The testnet phase is where the implementation meets reality. Bugs that were invisible in unit tests become apparent when the code runs on a distributed network with independent operators, network latency, and concurrent transactions.
Ethereum’s Pectra upgrade, which introduced account abstraction and increased blob capacity, was deployed to the Hoodi testnet months before reaching mainnet. During the testnet phase, developers discovered edge cases in the account abstraction implementation that would have caused transaction failures for a subset of users. These were fixed before mainnet deployment.
Cardano’s van Rossem hard fork followed a similar pattern, with the upgrade reaching its public testnet weeks before the mainnet governance vote that activated it. The testnet phase allowed stake pool operators to update their nodes and verify compatibility before the hard fork went live.
The length of the testnet phase varies by the complexity and risk of the upgrade. Simple parameter changes might spend days on a testnet. Fundamental consensus changes like The Merge spent months across multiple testnets. The pressure to move quickly is always present, but the cost of shipping a mainnet bug that could have been caught on a testnet is high enough that most serious protocol teams err on the side of longer testing periods.
The gap between testnet and mainnet
Testnets are valuable but imperfect. Several categories of problems are difficult or impossible to reproduce on a testnet. Economic attacks, where an attacker exploits the relationship between token prices and protocol mechanics, require real economic incentives that do not exist on a testnet. Miner or validator extractable value strategies, front running, and sandwich attacks depend on real financial motivation.
Scale related bugs also often escape testnet detection. A testnet with 100 validators processes transactions differently than a mainnet with 1,000 validators. Network congestion patterns, state bloat, and the behavior of the peer to peer gossip layer under load all change with scale. Some bugs only manifest when the state database exceeds a certain size or when transaction volume spikes above levels that testnets rarely experience.
The social and governance dimensions of blockchain also differ between testnet and mainnet. On a testnet, there are no real stakeholders with financial exposure who might resist an upgrade. The politics of hard fork coordination, which can involve exchanges, wallet providers, major token holders, and application developers, do not exist on a testnet. A protocol change that works perfectly on a testnet can still fail on mainnet if the coordination required to activate it breaks down.
This gap is why many blockchain projects now use incentivized testnets, where participants earn rewards for finding bugs, stress testing the network, or running validators. Robinhood’s chain testnet recorded 4 million transactions in its first week, partly because of incentive programs that attracted real users performing realistic interactions rather than synthetic test scripts.
What testnets do not cover
Testnets do not test economic security. The value of tokens on a testnet is zero, which means rational economic actors behave differently than they would on mainnet. A protocol that appears secure on a testnet may be vulnerable to economic exploits that only become apparent when real money is at stake.
Testnets do not test long term stability. Most testnets are reset periodically, which means issues related to state growth, database performance over time, and the accumulation of edge cases in long running chains are not tested. Some protocols run long lived testnets specifically to catch these issues, but the practice is not universal.
Testnets do not test user behavior. On a testnet, users have no reason to optimize gas usage, rush to complete transactions before a deadline, or engage in arbitrage. The transaction patterns on a testnet are fundamentally different from mainnet patterns, which means performance metrics measured on a testnet may not translate to mainnet conditions.
Practical checks for using testnets
If you are a developer, always deploy to a testnet before mainnet. This sounds obvious but a surprising number of smart contract exploits involve code that was deployed directly to mainnet without adequate testnet coverage. Use automated testing frameworks to run your test suite against a testnet deployment, not just a local node.
If you are a user, check whether the applications you use went through a public testnet phase. Serious projects publish testnet addresses, invite community testing, and often run bug bounty programs during the testnet phase. A project that skips the public testnet phase and launches directly to mainnet is taking a risk with its users’ funds.
When interacting with testnets, use a separate wallet from your mainnet wallet. While testnet transactions cannot affect mainnet, using the same private key on both networks is a bad security practice. If a testnet application is compromised or contains malicious code, having your mainnet private key in the same wallet creates unnecessary risk.
Monitor the testnet phase of upgrades to networks where you hold assets. If a major upgrade encounters problems on a testnet, it may be delayed or modified before mainnet deployment. Understanding the testnet timeline gives you advance notice of potential disruptions or opportunities.
Frequently asked questions
What is a testnet in simple terms?
A testnet is a practice version of a blockchain. It works the same way as the real blockchain but uses fake tokens that have no value. Developers use it to test their applications and find bugs before launching on the real network where real money is involved.
Are testnet tokens worth anything?
No. Testnet tokens have no monetary value by design. They exist solely for testing purposes and can be obtained for free from faucets. While there have been cases of people trading testnet tokens on secondary markets, this is discouraged and defeats the purpose of having a free testing environment.
How do I get testnet tokens?
Testnet tokens are available from faucets, which are web services that distribute free test tokens. For Ethereum’s Sepolia testnet, you can search for a Sepolia faucet, enter your wallet address, and receive test ETH within seconds. Most faucets have rate limits to prevent abuse.
What is the difference between a testnet and a mainnet?
A mainnet is the production blockchain where transactions involve real tokens with real value. A testnet is a separate network that runs the same software but uses valueless tokens. Testnets are for development and testing. Mainnets are for actual use. They share the same rules but operate independently.
Why do blockchains need testnets?
Blockchain transactions are generally irreversible, so bugs in production can result in permanent loss of funds. Testnets allow developers to find and fix these bugs in a safe environment where mistakes cost nothing. Major protocol upgrades are always tested on testnets before being activated on mainnet.
Can I test my own smart contract on a testnet?
Yes. Anyone can deploy smart contracts to public testnets like Ethereum’s Sepolia. You need a wallet, free testnet tokens from a faucet, and a development framework like Hardhat or Foundry. The deployment process is identical to mainnet deployment, just using a different network endpoint.
What happens when a testnet is deprecated?
When a testnet is deprecated, its validators stop processing transactions and the network eventually shuts down. Any contracts deployed on it become inaccessible. This happens periodically as protocols evolve. Ethereum deprecated the Ropsten, Rinkeby, and Goerli testnets in favor of Sepolia and Holesky.
Is it safe to use testnets?
Testnets themselves are safe because the tokens have no value, so you cannot lose money. However, you should use a separate wallet from your mainnet wallet and never share private keys between networks. Be cautious of testnet applications that ask for mainnet wallet connections or permissions.
Disclaimer: This article is for informational purposes only and does not constitute financial, investment, or legal advice. Cryptocurrency investments carry significant risk. Always conduct your own research before making any investment decisions. Information is accurate as of August 1, 2026.



Bitget has upgraded its Bitcoin-backed BGBTC asset with daily BTC-denominated rewards, cross-chain transfers through Chainlink CCIP, and independent oversight from Gauntlet.
Summary
- BGBTC holders will receive daily rewards denominated in Bitcoin following the upgrade.
- Chainlink CCIP will serve as BGBTC’s canonical cross-chain infrastructure.
- Gauntlet will independently oversee the asset’s underlying yield strategies.
- BGBTC remains backed by Bitcoin at a 1:1 ratio, according to Bitget.
Bitget adds daily Bitcoin rewards to BGBTC
Bitget said the upgraded BGBTC will distribute daily rewards denominated in BTC to token holders. The asset is designed to maintain a 1:1 peg with Bitcoin while allowing users to earn yield without selling their underlying exposure.
The exchange is positioning BGBTC as an alternative to holding idle Bitcoin or moving BTC into separate yield strategies. Those strategies can require users to transfer assets between platforms, manage additional protocols, or accept reduced liquidity.
BGBTC already has several uses within the Bitget ecosystem. Holders can use the asset as futures margin, lending collateral or for participation in the exchange’s Launchpool and PoolX products.
The upgrade also introduces support for large-volume and faster redemptions, according to Bitget. The company said it has added institutional-grade risk controls and greater transparency, although specific reward rates and redemption thresholds were not provided in the announcement.
Rewards remain tied to the performance and sustainability of the underlying yield strategies. A Bitcoin-backed token can also carry platform, custody, smart-contract and liquidity risks that differ from holding BTC directly.
Chainlink CCIP supports cross-chain BGBTC transfers
Bitget selected Chainlink’s Cross-Chain Interoperability Protocol as the canonical infrastructure for distributing BGBTC across multiple blockchain networks.
CCIP provides the messaging layer needed to move the asset between supported chains. The integration could allow holders to access decentralized applications and financial services outside Bitget’s centralized platform while retaining exposure to the Bitcoin-backed token.
Bitget already uses Chainlink Proof of Reserve to verify the assets supporting BGBTC. Proof of Reserve provides on-chain data intended to help users assess whether sufficient collateral exists behind the issued supply.
Combining Proof of Reserve with CCIP addresses two separate functions. The reserve system focuses on collateral verification, while CCIP handles communication and token transfers across blockchains.
Bitget did not identify every blockchain that will initially support BGBTC through CCIP or provide a schedule for additional network deployments.
Gauntlet will oversee BGBTC yield strategies
Gauntlet has been appointed as BGBTC’s independent curator and will supervise the strategies used to generate rewards for holders.
The quantitative risk-management firm will monitor the underlying portfolio, assess risks and help determine how capital is deployed. Bitget said the framework is intended to support the long-term sustainability of BGBTC’s yield rather than relying on an unmanaged set of strategies.
Independent curation adds another layer of oversight, but it does not eliminate losses. Reward levels may change based on market conditions, available strategies, and the performance of the assets or protocols involved.
Bitget is also working with infrastructure providers, including Chainlink and Morph, as it seeks to connect centralized and decentralized financial services through a broader Bitcoin yield network.
The company cited USDGO Holderyield as another part of its effort to let users earn returns from assets that would otherwise remain idle.
What the upgrade means for Bitcoin holders
BGBTC combines Bitcoin exposure, daily rewards and cross-chain utility in a single token. Users can potentially earn BTC-denominated returns while deploying the asset as collateral, margin or capital in supported decentralized applications.
For US investors, access to BGBTC and related Bitget services may depend on geographic and product restrictions. Users should confirm whether the exchange, token, and associated yield products are available in their jurisdiction before transferring funds.
Yield paid in BTC may also create tax-reporting obligations for US holders, depending on how the rewards are classified and when users gain control of them. Bitget did not announce any US-specific rollout or regulatory approval alongside the upgrade.
Future adoption will depend on the reward rate, redemption performance, supported networks, and transparency around the underlying strategies. Bitget has not yet disclosed a fixed annual yield or a complete cross-chain deployment timeline.
SpaceX stock remained under pressure near a record low as traders prepared for the company’s first post-IPO earnings report and the release of 911.5 million insider shares.
Summary
- SpaceX shares fell 3.41% to $108 on July 31, their lowest close since the June IPO.
- SPCX lost about 36% in July, extending its decline from the July 1 price of $171.
- About 911.5 million insider shares are expected to become eligible for sale on Aug. 6.
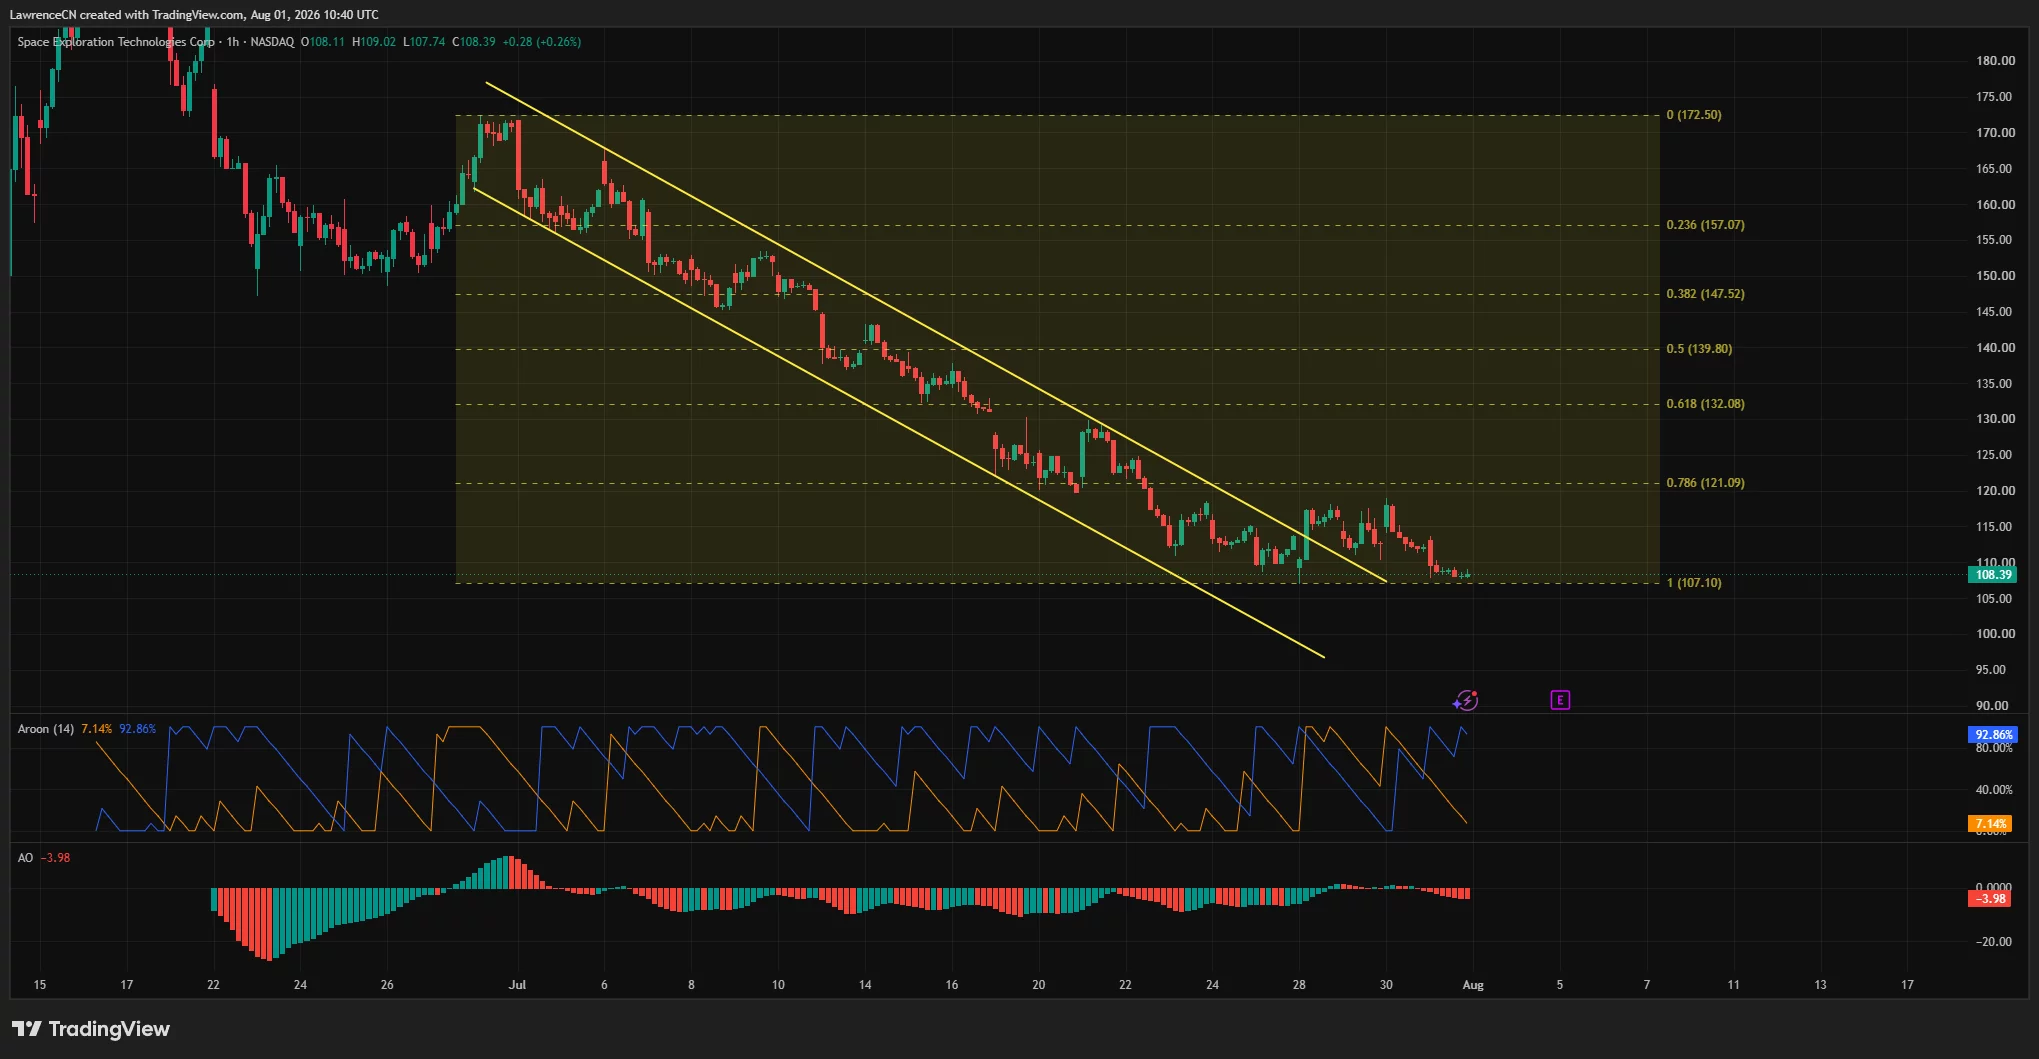
- The one-hour chart places immediate support at $107.10, with resistance near $121.09.
SpaceX stock extends its post-IPO decline
SpaceX stock closed July 31 at $108, down 3.41% during the session and about 36% from its July 1 price of $171. The decline left the shares at their lowest closing level since the company’s June 12 initial public offering.
SPCX has now fallen by more than 50% from the record high of $225 reached on June 16. The sustained pullback has raised the prospect of a move below $100 as two major catalysts approach.
SpaceX is scheduled to publish its first quarterly results as a public company on Aug. 4. Two days later, restrictions covering 911.5 million insider shares are expected to expire, allowing their holders to sell the stock.
Those events could produce large price swings because investors must assess the company’s operating performance while preparing for a possible increase in available supply.
Earnings and short sellers drive the move
Wall Street expects SpaceX to report quarterly revenue of between $6.72 billion and $6.9 billion. Results above that range could ease concerns about the company’s valuation and encourage buyers to return after four consecutive weeks of losses.
A revenue miss could have the opposite effect, particularly because the stock has not established a reliable support base. Traders will also watch management’s guidance for Starlink, launch operations, and the company’s emerging data-center business.
Short positioning has added pressure. S3 Partners data showed that investors had shorted 219.3 million shares, representing about 39% of the stock available for public trading.
The large position means short sellers could continue benefiting if SPCX falls. However, unexpectedly strong earnings could force some traders to cover their positions, creating a short-term rebound.
Bernstein recently maintained an outperform rating and a $239 target after SpaceX completed its 13th Starship test flight. William Blair also reportedly increased its adjusted earnings-per-share estimate from $8.20 to $8.60, citing potential growth from the company’s data-center operations.
Share unlock threatens to increase selling
The Aug. 6 unlock represents the main downside risk because it will make 911.5 million insider shares eligible for sale. At a price of about $108, those shares would carry a market value approaching $98.4 billion, although eligibility does not mean that all holders will sell.
S3 Partners research director Sam Pierson argued that the additional supply could outweigh a positive earnings report.
“There won’t be anything announced on earnings that will overcome the volume of unlocked shares coming to market,” Pierson said.
Actual selling will depend on insider decisions, liquidity and market demand. Even so, the scale of the unlock may discourage investors from buying before Aug. 6, particularly while short interest remains elevated.
For US investors, both events fall within the same trading week. That concentration could increase volatility, widen intraday price ranges and make execution prices less predictable around the earnings release and unlock date.
SpaceX stock tests $107.10 support
The one-hour SPCX chart shows the stock trading around $108.39 after declining within a broad descending channel. Price is now testing the $107.10 Fibonacci level, which forms the most immediate support.
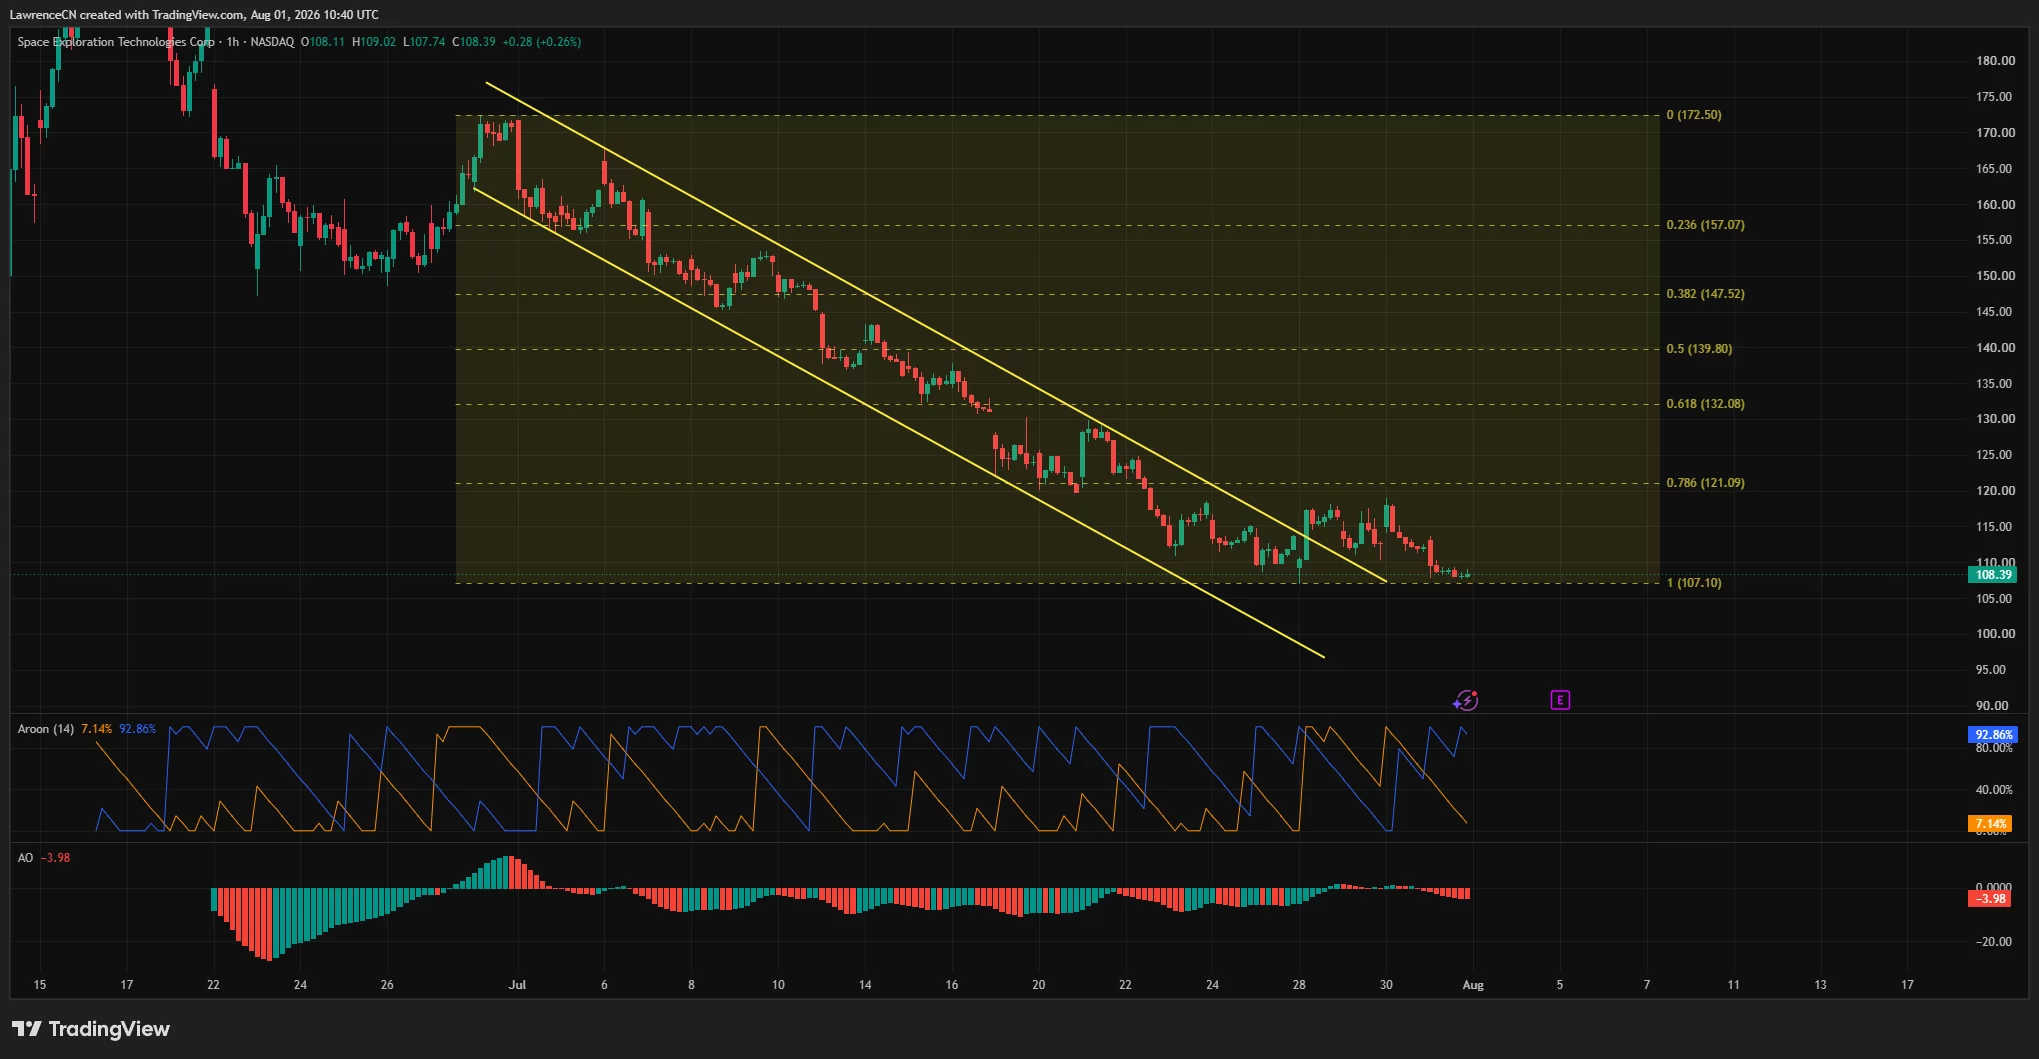
A confirmed break below $107.10 would remove the final marked retracement support on the chart. That could expose the psychological $100 level, followed by the descending channel’s lower boundary near $97.
Trend indicators continue to favor sellers. Aroon Down stands at 92.86%, compared with Aroon Up at 7.14%, showing that recent lows are occurring much more frequently than recent highs.
The Awesome Oscillator is also negative at minus 3.98. Its red histogram bars indicate that bearish momentum remains active as SPCX trades near the bottom of its recent range.
The first upside barrier sits at the 78.6% Fibonacci retracement level of $121.09. Reclaiming that price would weaken the immediate bearish setup, but it would not reverse the broader downtrend.
Further resistance appears at $132.08, corresponding to the 61.8% retracement, followed by $139.80 at the 50% level. SPCX would need to move above the descending channel and hold those levels before the chart supports a more durable recovery.
What comes next for SPCX
The near-term direction will likely depend on whether earnings demand can absorb the potential supply created by the share unlock. A revenue beat and stronger guidance could help SPCX defend $107.10 and challenge $121.09.
Failure to hold $107.10 would increase the risk of a decline below $100. Conversely, a sustained break above $121.09 would provide the first meaningful technical evidence that selling pressure is easing.
With earnings due Aug. 4 and the unlock expected Aug. 6, traders face two separate catalysts capable of moving the stock sharply. Until SPCX reclaims nearby resistance, its descending trend and negative momentum indicators leave sellers in control.

Russia is tightening its cryptocurrency mining policy again, extending restrictions beyond the regions it targeted earlier and adding Moscow and nearby areas to a long-running ban schedule. A new government resolution takes effect on Aug. 15, 2026, with the prohibition set to run through Dec. 31, 2032.
The update is set out in Resolution No. 936, signed by Prime Minister Mikhail Mishustin on July 25, 2026, according to records published on Pravo.ru. It revises an earlier mining restriction order from December 2024 and updates the list of places where mining activities are limited due to local electricity concerns.
Key takeaways
- Resolution No. 936 introduces a mining ban for Moscow, the Moscow Region, and parts of Russia’s Kursk Region, beginning Aug. 15, 2026.
- The restrictions will remain in force through Dec. 31, 2032, effectively creating a multi-year compliance horizon for operators.
- The rules follow earlier regional bans launched in December 2024 and other orders that began in 2026 across select parts of Buryatia and Zabaykalsky Krai.
- Officials have previously justified the approach by citing rising electricity demand and the power grid pressure associated with growing data-center loads.
Moscow and Kursk move into the restricted zone
Under the amended framework, the restricted geography expands to include Moscow, the Moscow Region, and additional territories listed within Russia’s Kursk Region. The rules also cover eight municipal districts and the city of Lgov in that region, broadening the affected footprint beyond the original set of localities.
The stated objective remains consistent with earlier restrictions: to limit cryptocurrency mining in areas considered to be facing strain on electricity supply. For miners and infrastructure providers, the practical impact is straightforward—new or continued mining operations in the designated areas may need to pause or restructure well before the Aug. 15, 2026 start date to avoid enforcement risks.
Resolution No. 936 revises the December 2024 order
Resolution No. 936 was signed on July 25, 2026 and amends an earlier prohibition order issued in December 2024. According to Pravo.ru, the change is not a one-off ban: it updates the list of jurisdictions where mining restrictions apply and extends the same restriction concept to additional regions.
That matters for market participants because Russia’s approach is being refined through successive legal instruments rather than replaced wholesale. In practice, operators are being pushed to manage regulatory uncertainty through long planning windows and contingency plans, especially in data-center-heavy regions where power allocation decisions can determine feasibility.
Why authorities linked the bans to power demand
In an earlier statement covering the Moscow Region’s rationale, the energy ministry said the ban was needed because of growing electricity demand. As reported by TASS, the ministry estimated that Moscow and the Moscow Region have 65 data centers connected to the power grid, with a combined capacity of 734 megawatts (MW). The same reporting cited 19 data centers in the Moscow Region with 233 MW of capacity.
Even though the mining restrictions are aimed at cryptocurrency operations, the logic used by officials is tied to the overall electricity system—particularly the growing load from digital infrastructure. For miners, that creates an indirect but significant link between crypto activity and broader regional power planning: where electricity is already earmarked for data centers and other high-consumption uses, regulators may treat mining as additional pressure that the grid cannot easily absorb.
Not the first wave: bans already planned in other regions
This latest expansion builds on restrictions introduced earlier in other parts of Russia. The earlier framework referenced by Pravo.ru points to mining restrictions being introduced in several regions in a prior phase, including parts of Buryatia and Zabaykalsky Krai.
As indicated in the published records, the bans in those areas are scheduled to run from April 1, 2026 through March 15, 2031. That staggered timing creates a rolling pattern: some jurisdictions begin restrictions in 2026 while others—like Moscow—enter a later phase starting Aug. 15, 2026, but continuing for longer overall through 2032.
Investors and operators watching Russia’s policy direction should note the implication: rather than lifting restrictions once an initial window expires, the government is instead layering in additional territories and sustaining multi-year prohibitions. That tends to shift mining activity away from restricted power grids and toward jurisdictions not covered by the latest legal orders—or toward arrangements that can demonstrate compliance with local limits.
For the next phase, the key question is how enforcement will work in the newly included jurisdictions, and whether regulators will continue expanding the restricted map beyond Moscow and Kursk or refine exemptions for specific infrastructure arrangements. Miners with assets near the updated boundaries should monitor local implementation details closely as Aug. 15, 2026 approaches.
The cryptocurrency market is back in the red after bitcoin’s rejection on Friday and a subsequent drop to a multi-week low, but, as usual, there are some exceptions.
Pi Network’s native token is among those, which might sound surprising given its recent calamity. Nevertheless, PI is up by 5% daily after an important reminder was issued by the team.
The Reminder
The Core Team announced on X that the blockchain has already begun the process of migrating to the next major protocol version, 26. As with previous similar statements, the post highlighted the importance of Pi Validators having to complete the upgrade by the deadline of August 11 to remain connected to the network.
Protocol version 26 will be among the biggest updates implemented by the team, and perhaps the most significant one since v20.2, which laid out the fundamentals for smart contract building. It’s designed to improve contract safety, state management, interoperability, and cryptographic capabilities.
Moreover, it comes before the final planned upgrade, protocol version 27, which is likely to be introduced in late August or September.
Reminder: the Pi Mainnet is upgrading to Protocol v26. All Mainnet node operators must complete the upgrade by August 11 to remain connected to the network.
Protocol v26 is a major milestone that improves contract safety, state management, interoperability, and cryptographic… pic.twitter.com/FXM5A8Tzo9
— Pi Network (@PiCoreTeam) July 31, 2026
The Core Team set the August 11 deadline earlier this week, which essentially meant that protocol version 25 was successfully deployed, even though there was no official confirmation at the time.
PI Rockets
A very small percentage of all the Pi Network updates, product features, redesigned apps, or new developments announced by the team in the past month or so have had a positive impact on the native token. However, the version 26 deadline set from a few days ago and last night’s reminder might be the exception.
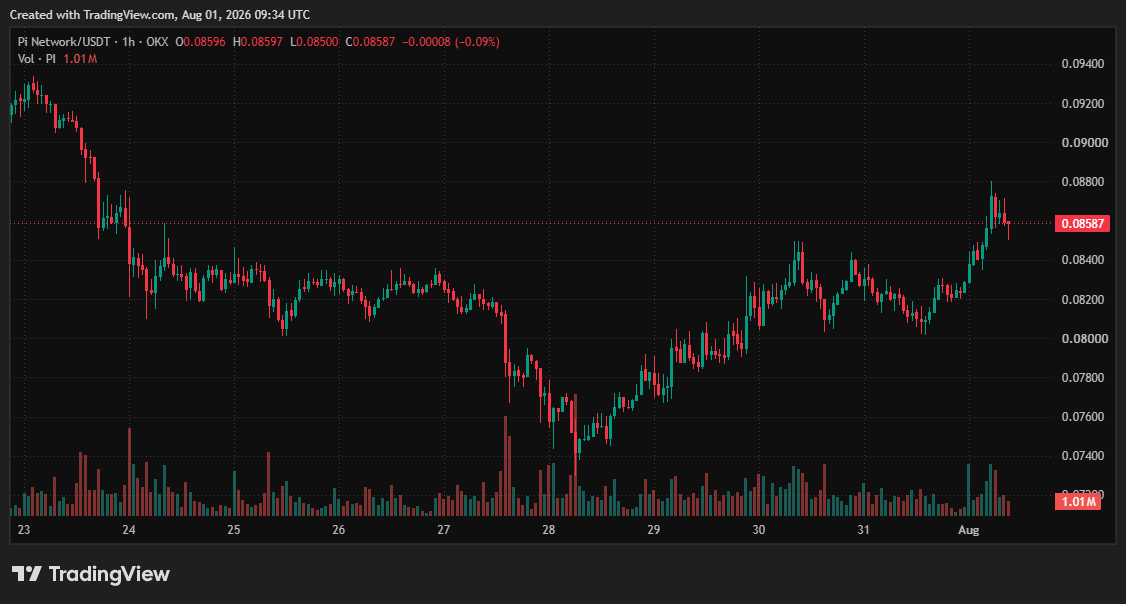
PI jumped after the team first announced the upcoming protocol version 26 and has done the same over the past 24 hours. It’s up by 5% daily and now sits at $0.086 after it challenged $0.088 hours ago. This comes despite the broader market’s weakness, led by BTC’s dip to $62,400.
Nevertheless, the broader picture around PI is still very painful. The asset remains down by over 97% since its all-time high from February last year. Its market cap is well below $1 billion, making it the 68th-largest asset by that metric.
The post PI Surges 5% Despite Market Slump After Important Pi Network Reminder appeared first on CryptoPotato.
Crypto World
Bitcoin Price Prediction: Michael Saylor’s Strategy Posts Massive Q2 Loss Despite Bigger Bitcoin Stack

Bitcoin is trading around $63,000 to $65,000 price range, as Strategy’s weak Q2 earnings add pressure to an already cautious market and prediction. The headline loss grabbed attention, but the filing revealed even deeper concerns. Now, traders are watching whether this sparks another wave of selling or marks a local bottom for institutional buyers.
Strategy reported a Q2 net loss of $8.22 billion, or $24.45 per share, swinging sharply from a $10.02 billion profit a year earlier. The result missed analyst estimates by a wide margin. Management blamed weaker Bitcoin prices and fading market sentiment. Between late June and early July, the company sold about 3,600 BTC for roughly $216 million, realizing an estimated $55 million loss.
STRATEGY’S Q2 EARNINGS REPORT SHOWS AN $8.3B UNREALIZED bitcoin:native LOSS — CryptosRus (@CryptosR_Us) July 30, 2026
Q2 highlights: BTC holdings increased 11% Convertible debt reduced 18% USD reserve increased 12% Bitcoin per share increased 5%
The Bitcoin drawdown hit earnings hard, but Strategy continued… https://t.co/A700cxVsGc pic.twitter.com/rlTmYayxC9
The filing also showed Strategy’s average Bitcoin cost basis remains above current market value across its 843,775 BTC holdings. As a result, the company recorded a full valuation allowance against its deferred tax assets. Preferred stock dividends, effectively funded by the treasury, have also attracted criticism from blockchain analysts and market observers.
That means the focus has shifted beyond another mark-to-market loss. Investors are now assessing what sustained pressure on the market’s largest corporate Bitcoin holder could mean for supply, sentiment, and institutional positioning during the third quarter. While long-term conviction remains intact for many, near-term volatility may keep traders on edge.
Discover: The Best Token Presales
Bitcoin Price Prediction: Reclaim $75,000 or Is the Strategy Overhang a Structural Ceiling?
Bitcoin is trading around $63,000 to $65,000, leaving it 15% to 17% below Strategy’s average purchase price of about $75,500 per BTC. That level has become more than an accounting figure. It is now a psychological hurdle for any sustained recovery. Recent trading between $63,000 and $65,500 suggests consolidation rather than a decisive trend.
Meanwhile, the high $50,000 to low $60,000 area, where Strategy sold part of its holdings, has emerged as an important support zone. A sustained move below $60,000 could encourage additional selling from leveraged holders and weaken institutional sentiment, especially if risk appetite deteriorates further.

The near-term outlook still revolves around three likely paths. In the bullish scenario, Bitcoin holds above $63,000 and gradually climbs toward $69,000 to $71,000 as market sentiment improves. The base case keeps Bitcoin trading between $60,000 and $67,000, while Strategy’s average cost remains a psychological ceiling.
The bearish case begins if Bitcoin loses $60,000 on strong selling pressure. That could expose a move toward the $55,000 to $58,000 region and renew concerns over Strategy’s 843,775 BTC position. Even so, long-term accumulation remains part of the investment thesis. The key question is whether the market can absorb the near-term supply without derailing the larger bull cycle.
Trade Bitcoin on Bybit and Get a Chance to Win Our $1,000 USDT Airdrop
Bitcoin Hyper Targets Early Mover Upside as Bitcoin Tests Key Levels
Bitcoin consolidating below its prior highs, with corporate holders under stress and large-cap upside constrained by the $75,000 overhead resistance, is precisely the environment where early-stage infrastructure plays historically attract rotation capital. The upside math at $63,000 Bitcoin is structurally different from the upside math on a presale priced at fractions of a cent.
Bitcoin Hyper ($HYPER) is positioning itself as the infrastructure layer that addresses Bitcoin’s three core limitations: slow transactions, high fees, and a near-complete lack of programmability.
Hyper is the first Bitcoin Layer 2 with Solana Virtual Machine (SVM) integration, delivering smart contract execution speeds that exceed Solana’s own throughput, while preserving Bitcoin’s underlying security model. The presale has raised close to $33 million at a current price of $0.0136839, with high-APY staking available to early participants.
The decentralized canonical bridge for BTC transfers and low-latency transaction execution are the standout technical differentiators. For traders looking at Bitcoin’s constrained near-term upside, research Bitcoin Hyper as a higher-asymmetry positioning option within the broader Bitcoin ecosystem.
Discover: The Best Crypto to Diversify Your Portfolio
The post Bitcoin Price Prediction: Michael Saylor’s Strategy Posts Massive Q2 Loss Despite Bigger Bitcoin Stack appeared first on Cryptonews.


Cathie Wood’s ARK Invest bought 109,129 Circle shares after the stablecoin issuer secured a limited-purpose trust charter in New York.
Summary
- ARK acquired about $6.83 million in Circle shares across three exchange-traded funds.
- Circle received a limited-purpose trust charter from the New York Department of Financial Services.
- CRCL closed 2.54% lower at $62.61 on July 31 despite the regulatory approval.
- Circle plans to gradually transfer USDC issuance to its New York trust entity.
ARK Invest adds 109,129 Circle shares
ARK purchased 77,103 Circle shares through its flagship ARK Innovation ETF, according to the firm’s daily trade disclosures. The ARK Next Generation Internet ETF added 22,238 shares, while the ARK Fintech Innovation ETF acquired another 9,788.
Together, the purchases totaled 109,129 shares. They were worth approximately $6.83 million based on Circle’s July 31 closing price of $62.61.
The investment extended ARK’s exposure to Circle as the company expands its regulated stablecoin infrastructure in the United States. It also followed ARK’s roughly $40.2 million purchase of Tesla, SpaceX and Nvidia shares on July 28 during a broader technology-sector sell-off.
ARK made several other purchases on July 31, including 298,243 CoreWeave shares, 12,512 shares of the 3iQ Solana Staking ETF, 7,500 Pony AI shares and 2,700 Kodiak AI shares.
The firm reduced its positions in Shopify, Cloudflare, CrowdStrike, Snowflake, 10x Genomics, Komatsu, Brera Holdings, Iridium Communications and Figma.
Circle secures New York trust charter
ARK’s purchase followed Circle’s receipt of a limited-purpose trust charter from the New York Department of Financial Services. The approval covers Circle Internet Trust Company LLC, which will operate as Circle New York Trust.
A New York limited-purpose trust company can conduct approved virtual currency activities and exercise fiduciary powers. Unlike a BitLicense holder, it can also provide money transmission services in the state without obtaining a separate money transmitter license.
Circle said it plans to gradually move USDC issuance to the New York entity. Circle New York Trust will operate alongside Circle National Trust, the federally chartered national trust bank authorized to provide custody and collateral trustee services.
Circle CEO Jeremy Allaire described the New York approval as a long-term objective for the company.
“Earning a New York trust charter has been a longstanding objective for Circle given the regulatory clarity that comes with it.”
He added that the charter places USDC within a strong regulatory framework as digital dollars become more widely used in the global financial system.
Circle builds state and federal oversight
Circle’s New York authorization follows the Office of the Comptroller of the Currency’s final approval on July 10 for the company to establish Circle National Trust.
The federal trust bank will initially provide fiduciary digital asset custody services to Circle and its affiliates. Circle has also identified management of USDC reserves as a possible future capability, subject to its approved business plan and regulatory requirements.
The two charters give Circle separate state and federal regulatory structures. NYDFS will supervise the New York entity’s approved virtual currency and fiduciary activities, while the OCC will oversee the national trust bank.
For U.S. investors, the approvals strengthen Circle’s position within the regulated stablecoin market. However, the charters do not remove risks tied to USDC growth, interest-rate changes, competition or Circle’s share valuation.
Circle stock falls despite regulatory progress
Circle stock ended July 31 at $62.61, falling $1.63, or 2.54%, during the session. The decline suggests investors did not immediately treat the New York charter as a reason to reverse the stock’s recent weakness.
CRCL had gained about 10% on July 10 after Circle announced final OCC approval for its national trust bank. The shares subsequently surrendered those gains as the broader technology and digital-asset sectors came under pressure.
ARK’s latest purchase comes as the investment firm expects consolidation across crypto businesses. ARK digital assets research director Lorenzo Valente said on July 28 that revenue and investment were becoming concentrated among fewer companies.
Valente predicted more acquisitions, bankruptcies, shutdowns and talent-focused deals. However, his post did not identify the dataset, category definitions or measurement period supporting its revenue concentration figures.
Circle is scheduled to report its second-quarter 2026 financial results on Aug. 5, giving investors another measure of whether regulatory progress is translating into stronger USDC activity and company revenue.


Russia has expanded its cryptocurrency mining restrictions to Moscow, with the ban set to take effect on Aug. 15, 2026, and remain in place through Dec. 31, 2032.
Russia’s Resolution No. 936, signed by Prime Minister Mikhail Mishustin on July 25, 2026, amends an earlier mining restriction order issued in December 2024, according to records published on Pravo.ru.
The updated rules add Moscow, the Moscow Region and several territories in Russia’s Kursk Region to the list of restricted areas. The measure expands existing restrictions on cryptocurrency mining in areas facing electricity supply concerns. The ban also covers eight municipal districts and the city of Lgov in Kursk Region.
Earlier restrictions were also introduced in several Russian regions, including parts of Buryatia and the Zabaykalsky Krai, where a mining ban is set to run from April 1, 2026, through March 15, 2031.
The Moscow Region’s Energy Ministry previously said a mining ban was needed because of growing electricity demand, according to TASS. The ministry estimated that Moscow and the Moscow Region have 65 data centers connected to the power grid with a combined capacity of 734 megawatts (MW), including 19 data centers in the Moscow Region with 233 MW of capacity.
Related: BitRiver founder charged in Russia over alleged $8M fraud

Fifteen years later, the Gen Z protests in Delhi and other Indian cities have incinerated Modi’s carefully constructed political brand, delivering death by a thousand burns. The target of the anger and scorn in all the insulting posters, slogans, and graffiti of the protest zone was not the education minister but Modi himself.
A bonfire of vanities in Delhi
It was an exhilarating spectacle to watch a prime minister elevated to the status of a demigod through the expenditure of hundreds of millions of dollars of public money spent on ubiquitous advertising campaigns, becoming the butt of a torrent of wickedly humorous, profanity-laced slogans from young men and women in the capital. The eminently Instagrammable viral burns of the protesters were deliberate, taking apart and inverting each element of Modi’s political brand.
The weapon of choice was satire. The unofficial anthem of the protest was a call-and-response chant: “Chappan inch ka chhota bandar,” followed by the crowd’s chorus, “Bhaag Narendra, Bhaag Narendra.” (“The little monkey with the 56-inch chest. Run Narendra, Run Narendra!”) The viral reel that originated the chant features two women, who seem to be in their early 20s, dressed in casual streetwear, leading the chant while a man holds a poster depicting Modi as a little monkey.
Strategy shares fell 4.56% to $93.28 on July 31 after the company reported an $8.22 billion quarterly loss and prioritized restoring its STRC preferred stock to its $100 par value.
Summary
- Strategy stock closed at $93.28, approaching its lower Bollinger Band at $90.31.
- The company reported an $8.22 billion net loss after recording an $8.32 billion unrealized Bitcoin loss.
- Michael Saylor said Strategy would hold both cash and Bitcoin instead of directing all available capital toward BTC.
- Analysts at Benchmark and H.C. Wainwright maintained their buy ratings despite the sell-off.
Strategy stock slides after $8.22B quarterly loss
Strategy stock traded as low as $89.21 on Thursday before recovering to close at $93.28. The 4.56% decline took the Nasdaq-listed company below $90 during the session for the first time since July 1.
The decline followed Strategy’s second-quarter results, which included an $8.32 billion unrealized loss on its Bitcoin holdings. That pushed the company to a net loss of $8.22 billion, or $24.45 per share, during the quarter.
Strategy held 843,775 BTC at the end of the reporting period, representing a 25% increase from the start of the year. The company acquired the holdings for approximately $63.69 billion at an average price of $75,476 per coin.
Lower Bitcoin prices reduced the market value of the position to about $54.77 billion. Under fair-value accounting rules, changes in Bitcoin’s market price flow through Strategy’s reported earnings, exposing quarterly results to large swings.
Operating revenue offered one positive data point. Revenue increased 6.9% from $114.5 million in the comparable period last year to $122.4 million.
Why Strategy is prioritizing STRC over immediate BTC purchases
Executive Chairman Michael Saylor said during the earnings call that Strategy would move away from directing all available funds toward immediate Bitcoin purchases. The company instead plans to maintain a combination of cash and BTC.
“Perhaps the best way to buy the most Bitcoin is not to buy the most Bitcoin immediately,” Saylor said.
Chief Executive Phong Le said Strategy would refrain from buying additional Bitcoin while STRC traded below its $100 par value. The company’s variable-rate preferred stock ended July 31 at approximately $89.
Strategy repurchased about $25 million of STRC between July 20 and July 24 while raising $544 million through sales of its common stock. The transactions indicate that management views support for the preferred share as necessary to preserve its broader capital-raising model.
Restoring STRC to par could improve investor confidence in Strategy’s preferred securities and make future issuance more efficient. Those instruments have become part of the company’s strategy for raising capital without relying exclusively on common-share sales or conventional debt.
Strategy also held a $3.75 billion cash reserve, giving it room to cover dividend and interest obligations without selling Bitcoin during a market downturn.
MSTR chart points to weak momentum near $90
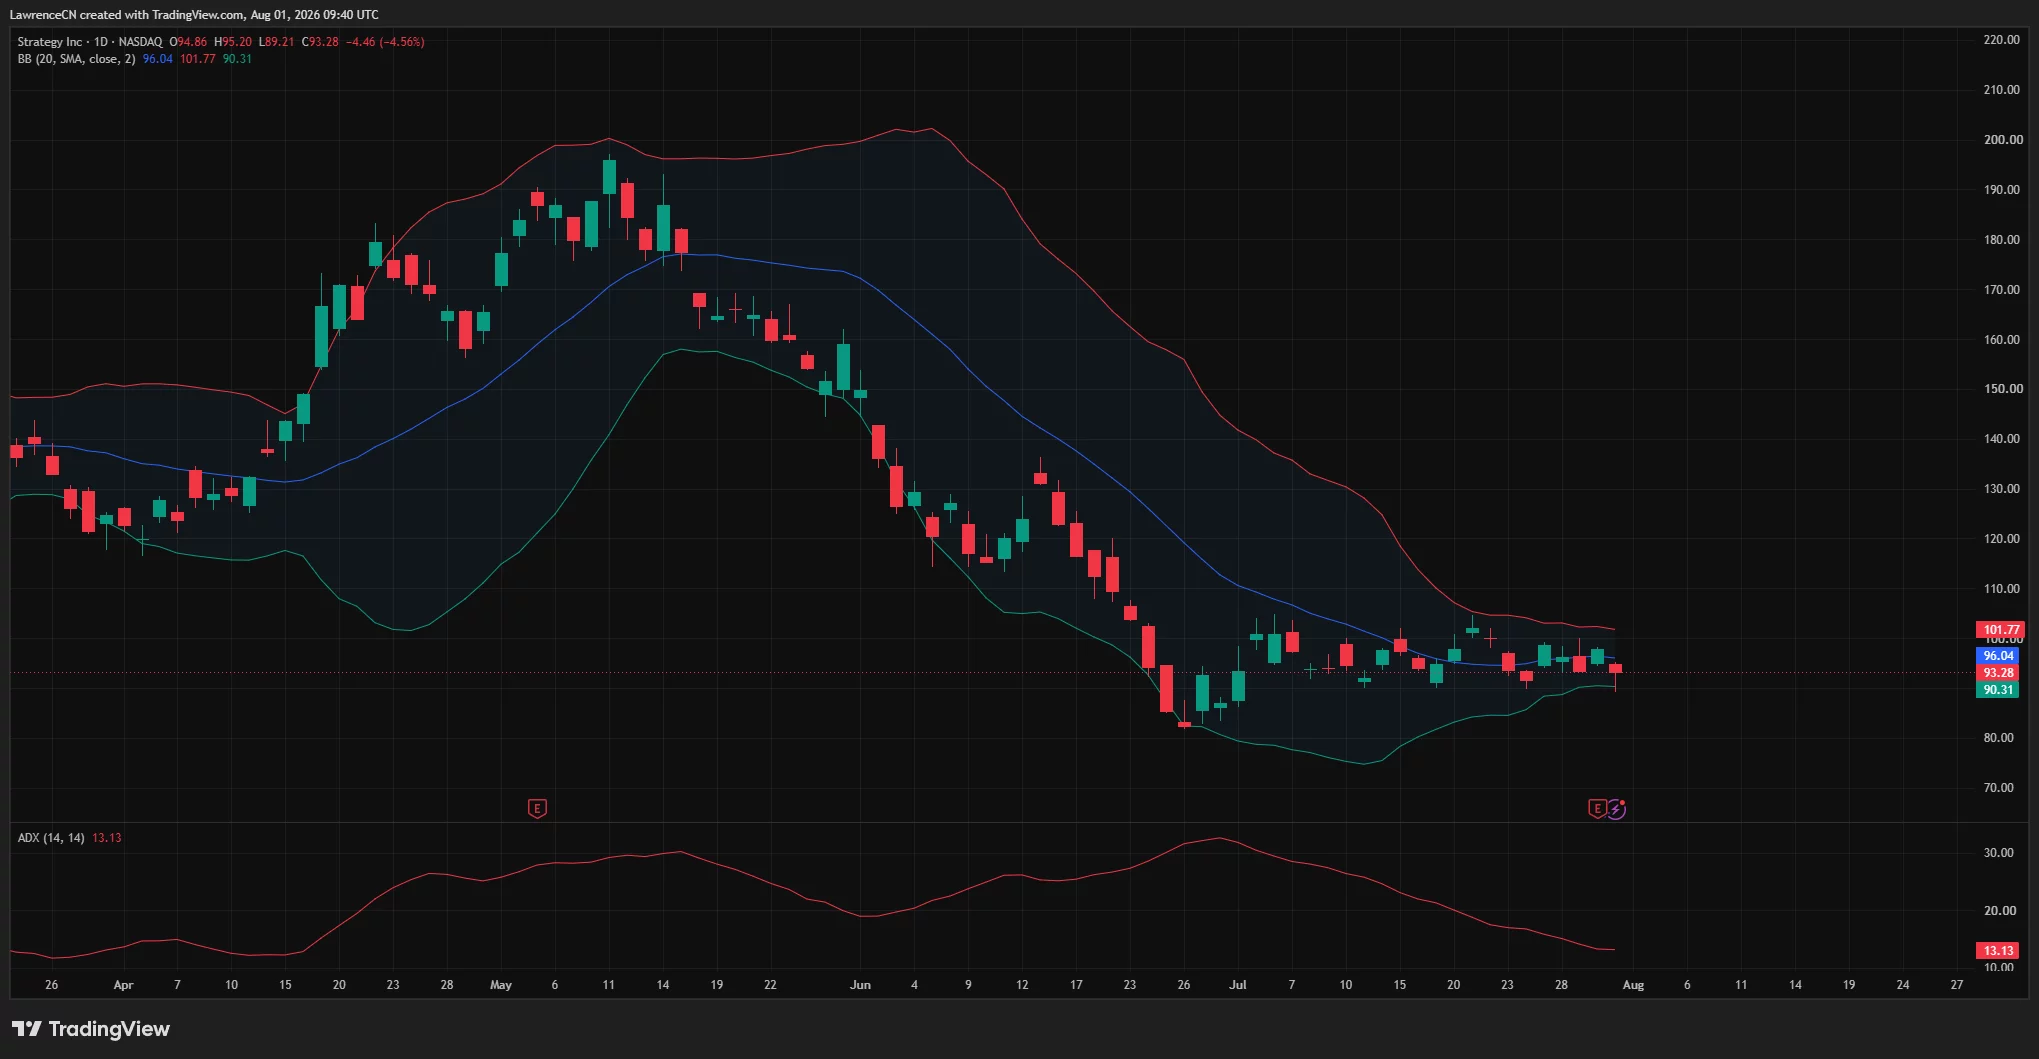
The daily chart shows Strategy stock trading near the lower end of its recent consolidation range. Thursday’s decline took the price below the Bollinger Band midpoint at $96.04 and toward the lower band at $90.31.
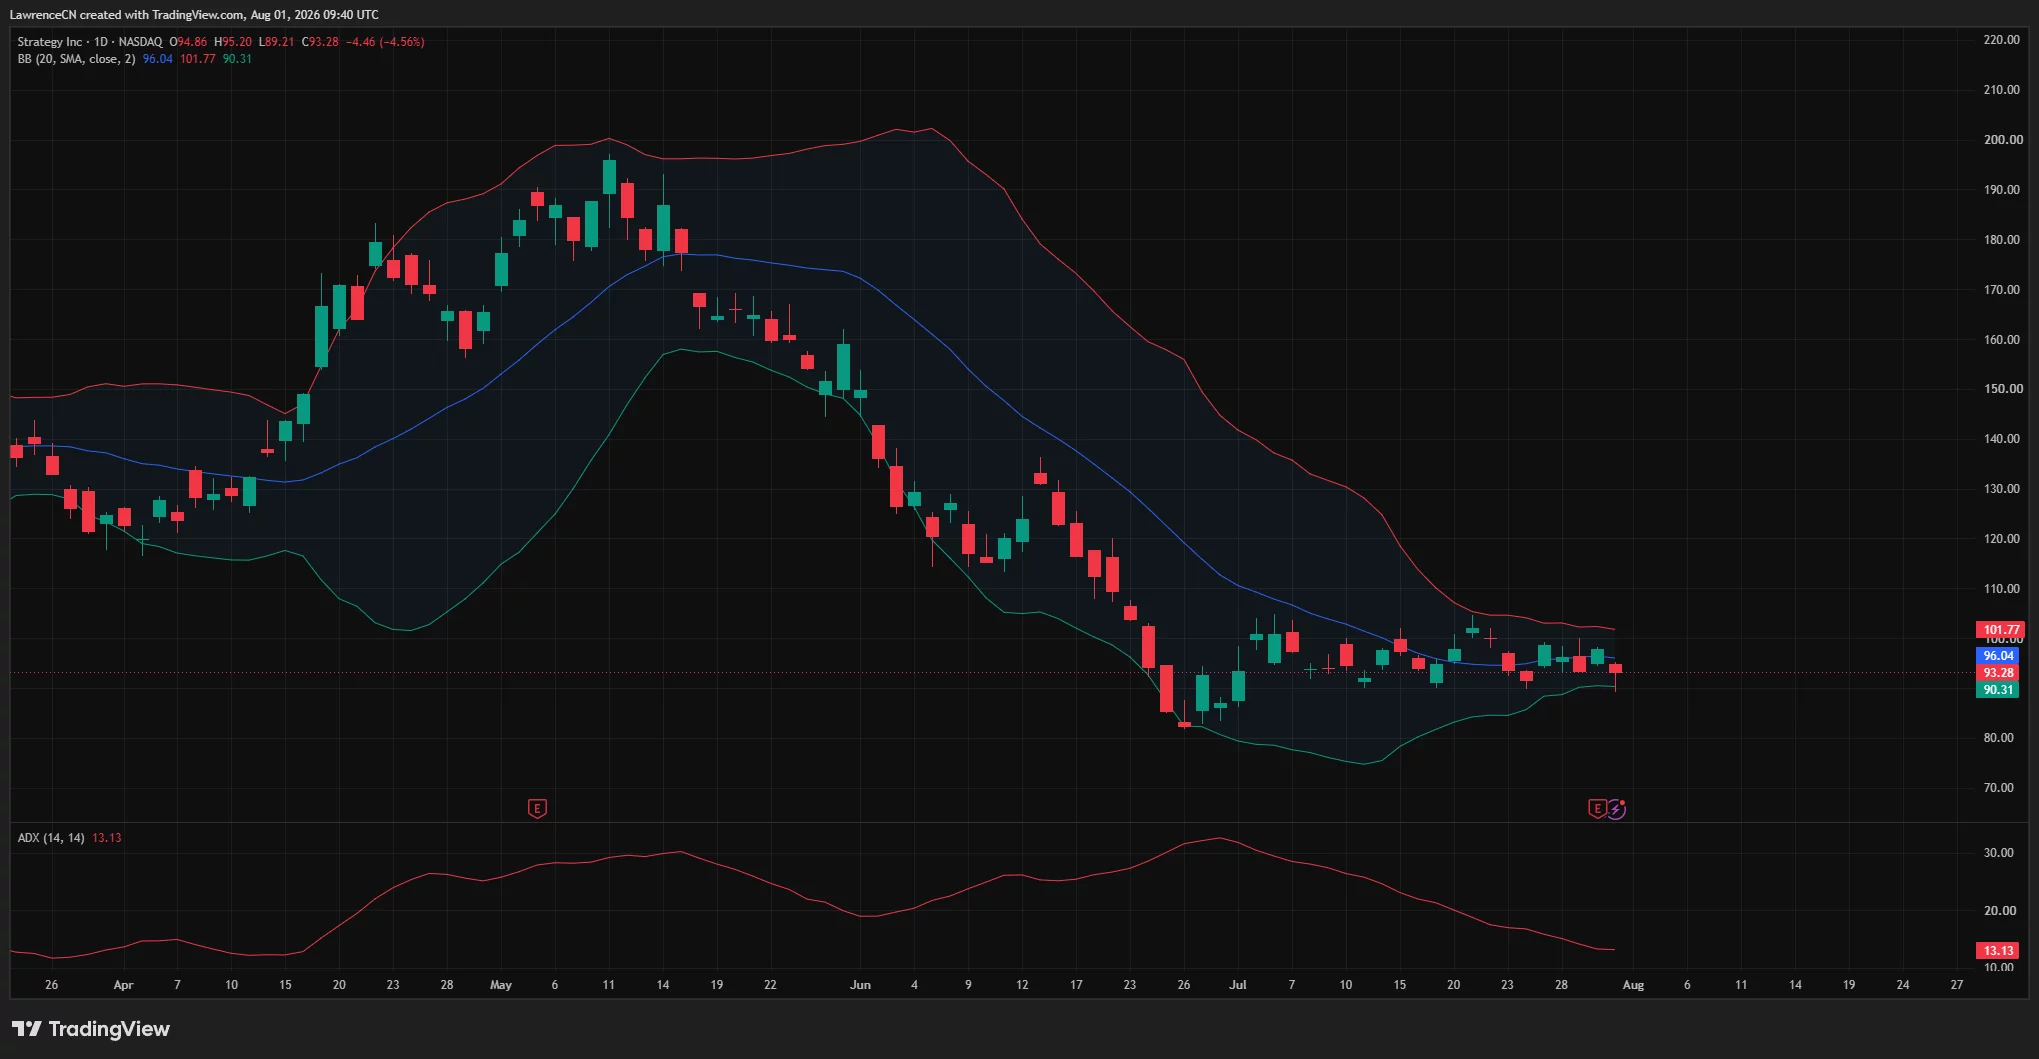
A daily close below $90.31 could confirm renewed selling pressure and expose the late-June low around $81 to $82. That area marked the bottom of the stock’s decline before its July stabilization.
The Average Directional Index stood at 13.13. An ADX reading below 20 generally indicates that the market lacks a strong directional trend, suggesting Strategy shares remain in consolidation despite the latest bearish session.
On the upside, MSTR would first need to recover above the $96.04 midpoint. A sustained move above that level could place the upper Bollinger Band at $101.77 within reach.
The narrow distance between the bands also shows that volatility has contracted following the stock’s steep decline from its May high near $200. A break outside the $90.31–$101.77 range could determine its next short-term direction.
Wall Street analysts retain bullish Strategy targets
Benchmark maintained its buy rating on Strategy but reduced its price target from $570 to $435. Analyst Mark Palmer said Saylor’s focus on bringing STRC back to par could strengthen the company’s ability to raise funds for future Bitcoin purchases.
H.C. Wainwright also maintained a buy rating and assigned Strategy stock a $325 target. The firm cited the company’s cash reserve and STRC repurchases as measures that could strengthen its balance sheet and limit the need to take on additional debt.
Both targets imply substantial upside from the July 31 closing price. However, their outlooks remain closely tied to Bitcoin’s performance and Strategy’s ability to issue securities on favorable terms.
For US investors, MSTR remains a publicly traded way to gain leveraged exposure to Bitcoin without holding the asset directly. That exposure also carries company-specific risks, including preferred-share obligations, equity dilution and earnings volatility caused by Bitcoin fair-value adjustments.
Bitcoin and STRC remain the next key catalysts
Strategy’s short-term stock performance will likely depend on whether STRC moves back toward $100 and whether Bitcoin recovers above the company’s average acquisition cost.
Management’s decision to preserve cash does not amount to abandoning its Bitcoin strategy. Instead, it delays immediate purchases while the company works to support the securities used to finance future acquisitions.
MSTR could remain range-bound while the ADX stays weak. A close below $90 would strengthen the downside case, while a recovery above $101.77 would signal that buyers are regaining control.
Disclosure: This article does not represent investment advice. The content and materials featured on this page are for educational purposes only.
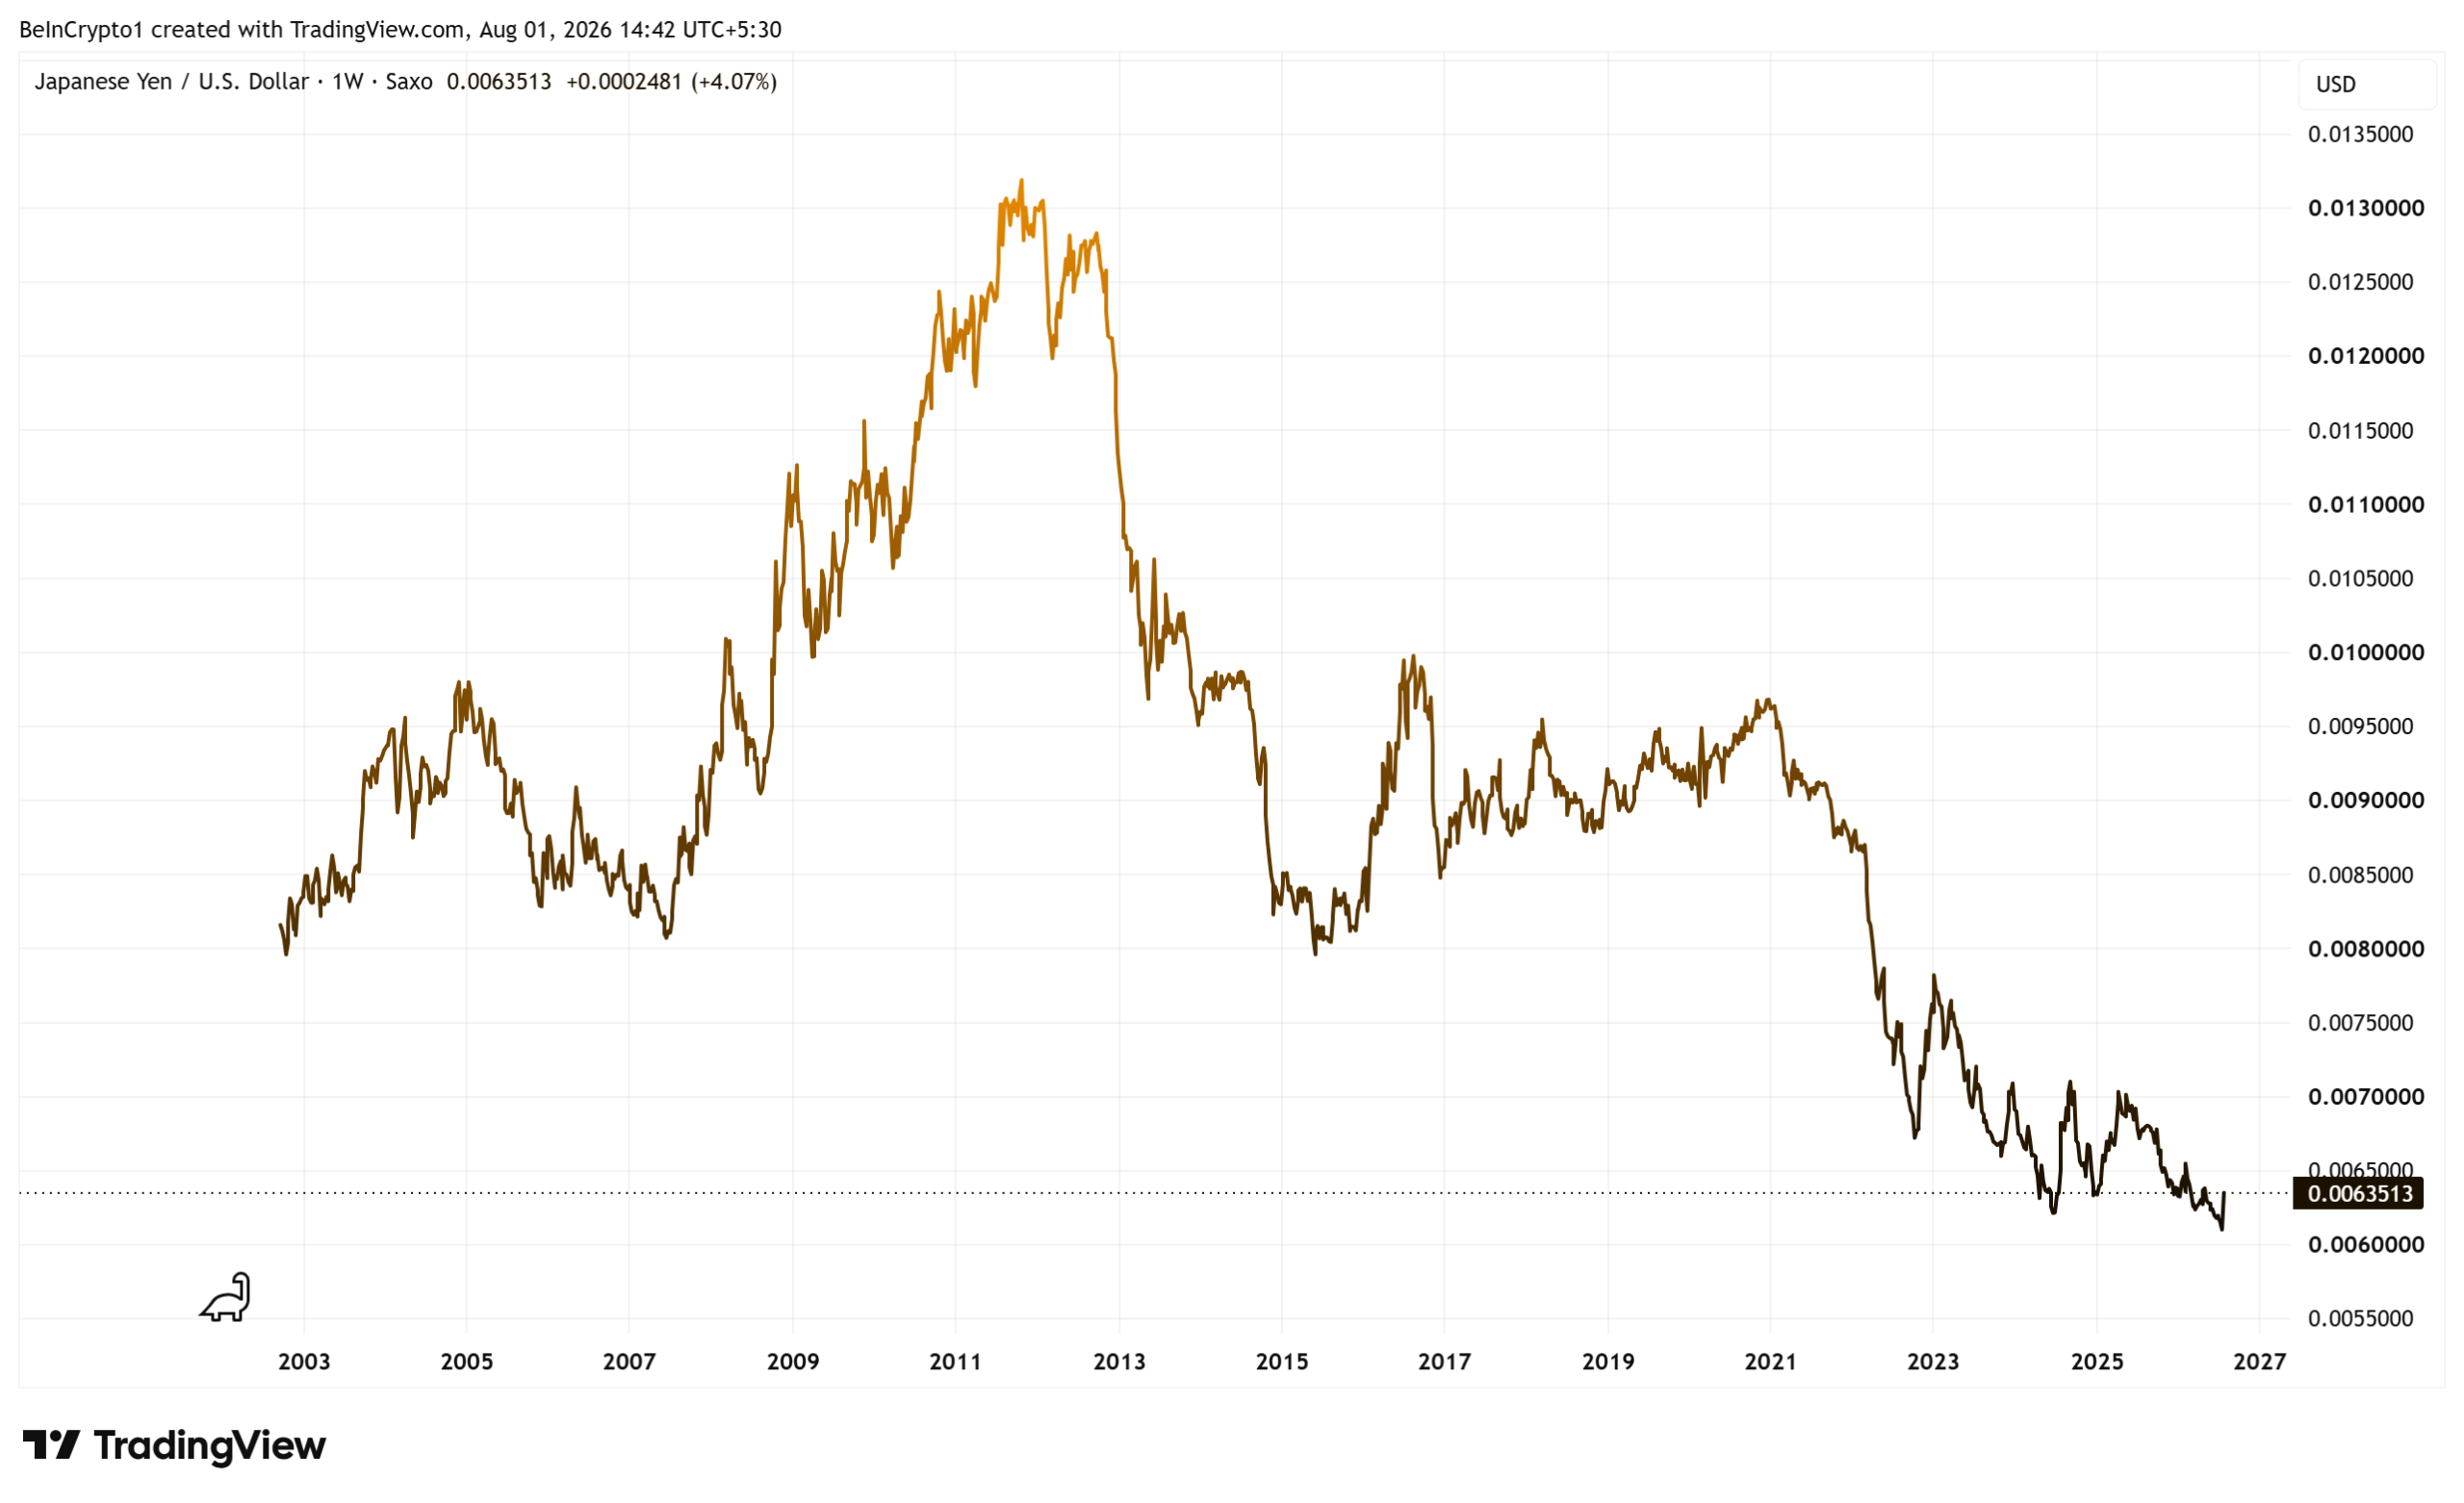
Bitcoin briefly broke below $63,000 on Friday, with the reason sitting 6,000 miles away. America bought Japanese yen for the first time in 28 years.
Washington almost never does this. The goal was to prop up a sinking currency. It also nudged one of the world’s biggest funding trades. Crypto sits at the end of that chain.
What Actually Happened
The yen has been sliding for years. Last week it hit 163.99 per dollar, before extending lower this weekend. That was close to a 40-year low.

Japan moved first, on Thursday. It sold dollars and bought yen. That is called intervention. A government buys its own currency to push the price back up.
Washington joined on Friday. The New York Fed sold euros and bought yen for the Treasury. It used Goldman Sachs and Morgan Stanley, the Financial Times reported.
It worked, for now. The yen closed at 157.40 per dollar, its strongest since early May.
US Last Bought Yen in 1998
America stopped meddling in currency markets in the mid-1990s. Since then it has stepped in only three times. Those were 1998, 2000 and 2011, according to a Congressional Research Service briefing. Friday was the fourth.
Most reports called this the first US help for the yen in over a decade. They pointed to 2011. That runs backwards. In 2011 the Group of Seven (G7) sold yen to stop it rising.
The US last bought yen on June 17, 1998. The New York Fed spent $833 million. Half came from the Fed. Half came from the Exchange Stabilization Fund, a Treasury pot for currency emergencies. The bank’s own record confirms it.
The size is the other shock. A Reuters photo caught Treasury Secretary Scott Bessent’s notepad at Camp David. It read “Buy Japanese Yen (JPY) $5-10 bil.”

That is six to twelve times the 1998 trade.
There is one more wrinkle. Treasury published its currency report on July 23. It kept Japan on a watchlist for currency practices.
Eight days later, Washington was buying yen itself.
Follow us on X to get the latest news as it happens
How Much Money Is Involved
Japan spent far more than the US. Bloomberg put Thursday’s Japanese buying at ¥8.45 trillion, or about $52.8 billion. That estimate came from Bank of Japan accounts and broker forecasts.
Here is how it compares.

Nobody knows Thursday’s real number yet. Japan’s finance ministry publishes intervention data once a month. The release covering July 30 is due at the end of August.
South Korea helped too. It sold dollars alongside Japan on Thursday, a Reuters timeline shows. Weeks earlier, Goldman Sachs forecast further weakness toward 165.
What This Means for Bitcoin
The Bitcoin (BTC) price sat near $63,034 at press time. It was down 1.25% over 24 hours, with a market value of $1.26 trillion. Bitcoin did not just fall. It fell alone.
Wall Street had a good Friday. The Nasdaq rose 1%. The S&P 500 added 0.7%. The Dow gained 0.53%, according to CNBC. Bitcoin went the other way.

That gap is the story. Stock traders were watching tech earnings. Crypto traders were watching Tokyo.
The reason is simple. Japanese rates have sat near zero for years. Traders borrowed yen cheaply. They swapped it for dollars and bought riskier assets. Stocks, bonds, and Bitcoin. That is the carry trade.
It works while the yen stays weak. A sharp yen rally breaks it. Traders then sell what they own to repay the loan. Japan’s bond market stress flagged that risk earlier in July.
Markets have been here before. The Bank of Japan raised rates on July 31, 2024. The yen jumped. Within days the Nikkei 225 fell 12.4%, its worst day since 1987. Crypto fell with it.
One thing is different now. That episode started with a rate hike, and hikes close the gap for good. Friday was a purchase. Purchases wear off.
What to Watch Next
The BOJ held rates at 1% this week on an 8-1 vote. That is the highest since 1995. It is still far below the 3.75% US ceiling. Governor Kazuo Ueda hinted at future hikes but promised none.
“Without backing from rate differentials, the impact of FX interventions is likely to be relatively short-lived,” Bloomberg reported in a Friday note, citing Evercore ISI strategists Marco Casiraghi and Gang Lyu.
Three dates matter now:
- Japan confirms its real spending at the end of August.
- Bessent meets Ueda at the Group of 20 (G20) finance meeting in Asheville, North Carolina, that same month.
- After that, the Fed and BOJ rate paths take over.
The simple test is 160. If the dollar stays below 160 yen, the defence held. If it climbs back, Tokyo and Washington face the same call again. The bill will be larger.
The post America Broke a 28-Year Rule to Save the Yen and Bitcoin Felt It First appeared first on BeInCrypto.

Bitget adds daily Bitcoin rewards to BGBTC

17 Rich Mom Fashion Deals in the Nordstrom Anniversary Sale

2026 AIG Women’s Open Saturday tee times: Round 3


-
 Sports6 days ago
Commonwealth Games boxing: Jadumani Singh seals dominant 5-0 win over Pakistan’s Sumama Rehman to enter quarter-finals | Commonwealth Games News
-

 Business3 days ago
Why Trees Belong on the Risk Register
-

 Fashion17 hours ago
Weekend Open Thread: Wit & Wisdom
-

 Politics14 hours ago
Meta enters AI-training agreement with far-right ‘propaganda rag’ Newsmax
-

 Tech5 days ago
Intel is reversing course and bringing hyper-threading back to its server chips
-

 Crypto World7 days ago
Ripple bought a bank in pieces. The $4 billion audit
-

 Politics5 days ago
Luke Littler dismantles Gerwyn Price to retain title in Blackpool
-

 Politics4 days ago
The Part of the Electric Transition Nobody Wants to Discuss
-

 News Videos6 days ago
BITCOIN JUST ENTERED THIS CRITICAL ZONE…
-
 Entertainment4 days ago
‘Stargate’ Creator’s New Sci-Fi Series Returns for Season 3 Tomorrow
-

 Business3 days ago
Major shareholder moves on Canyon
-

 Crypto World6 days ago
XRP Ledger adds $2.6B as RWA inflows rank second
-

 Politics6 days ago
Spain sweeps the board at 2026 World Cup with individual awards
-

 News Videos2 days ago
Bitcoin Enters the 3rd Stage of the Bear Market
-
Crypto World5 hours ago
XRP Ledger v3.3.0 brings five institutional features
-

 Entertainment6 days ago
Sara Gilson Killed By Husband After Viral “Pedophile” TikTok Video
-

 Crypto World3 days ago
Kraken Enables Retail Access to Jersey Mike’s IPO via Tokenized Shares
-

 News Videos4 days ago
Claude: Build Financial Dashboards in Minutes (2026)
-

 Tech4 days ago
New macOS Sequoia & Sonoma security updates for older Macs
-

 Politics2 days ago
Luke Littler’s dominance sparks GOAT debate
You must be logged in to post a comment Login