

Crypto World
Brent Crude Hits $82 as But Risk Looms
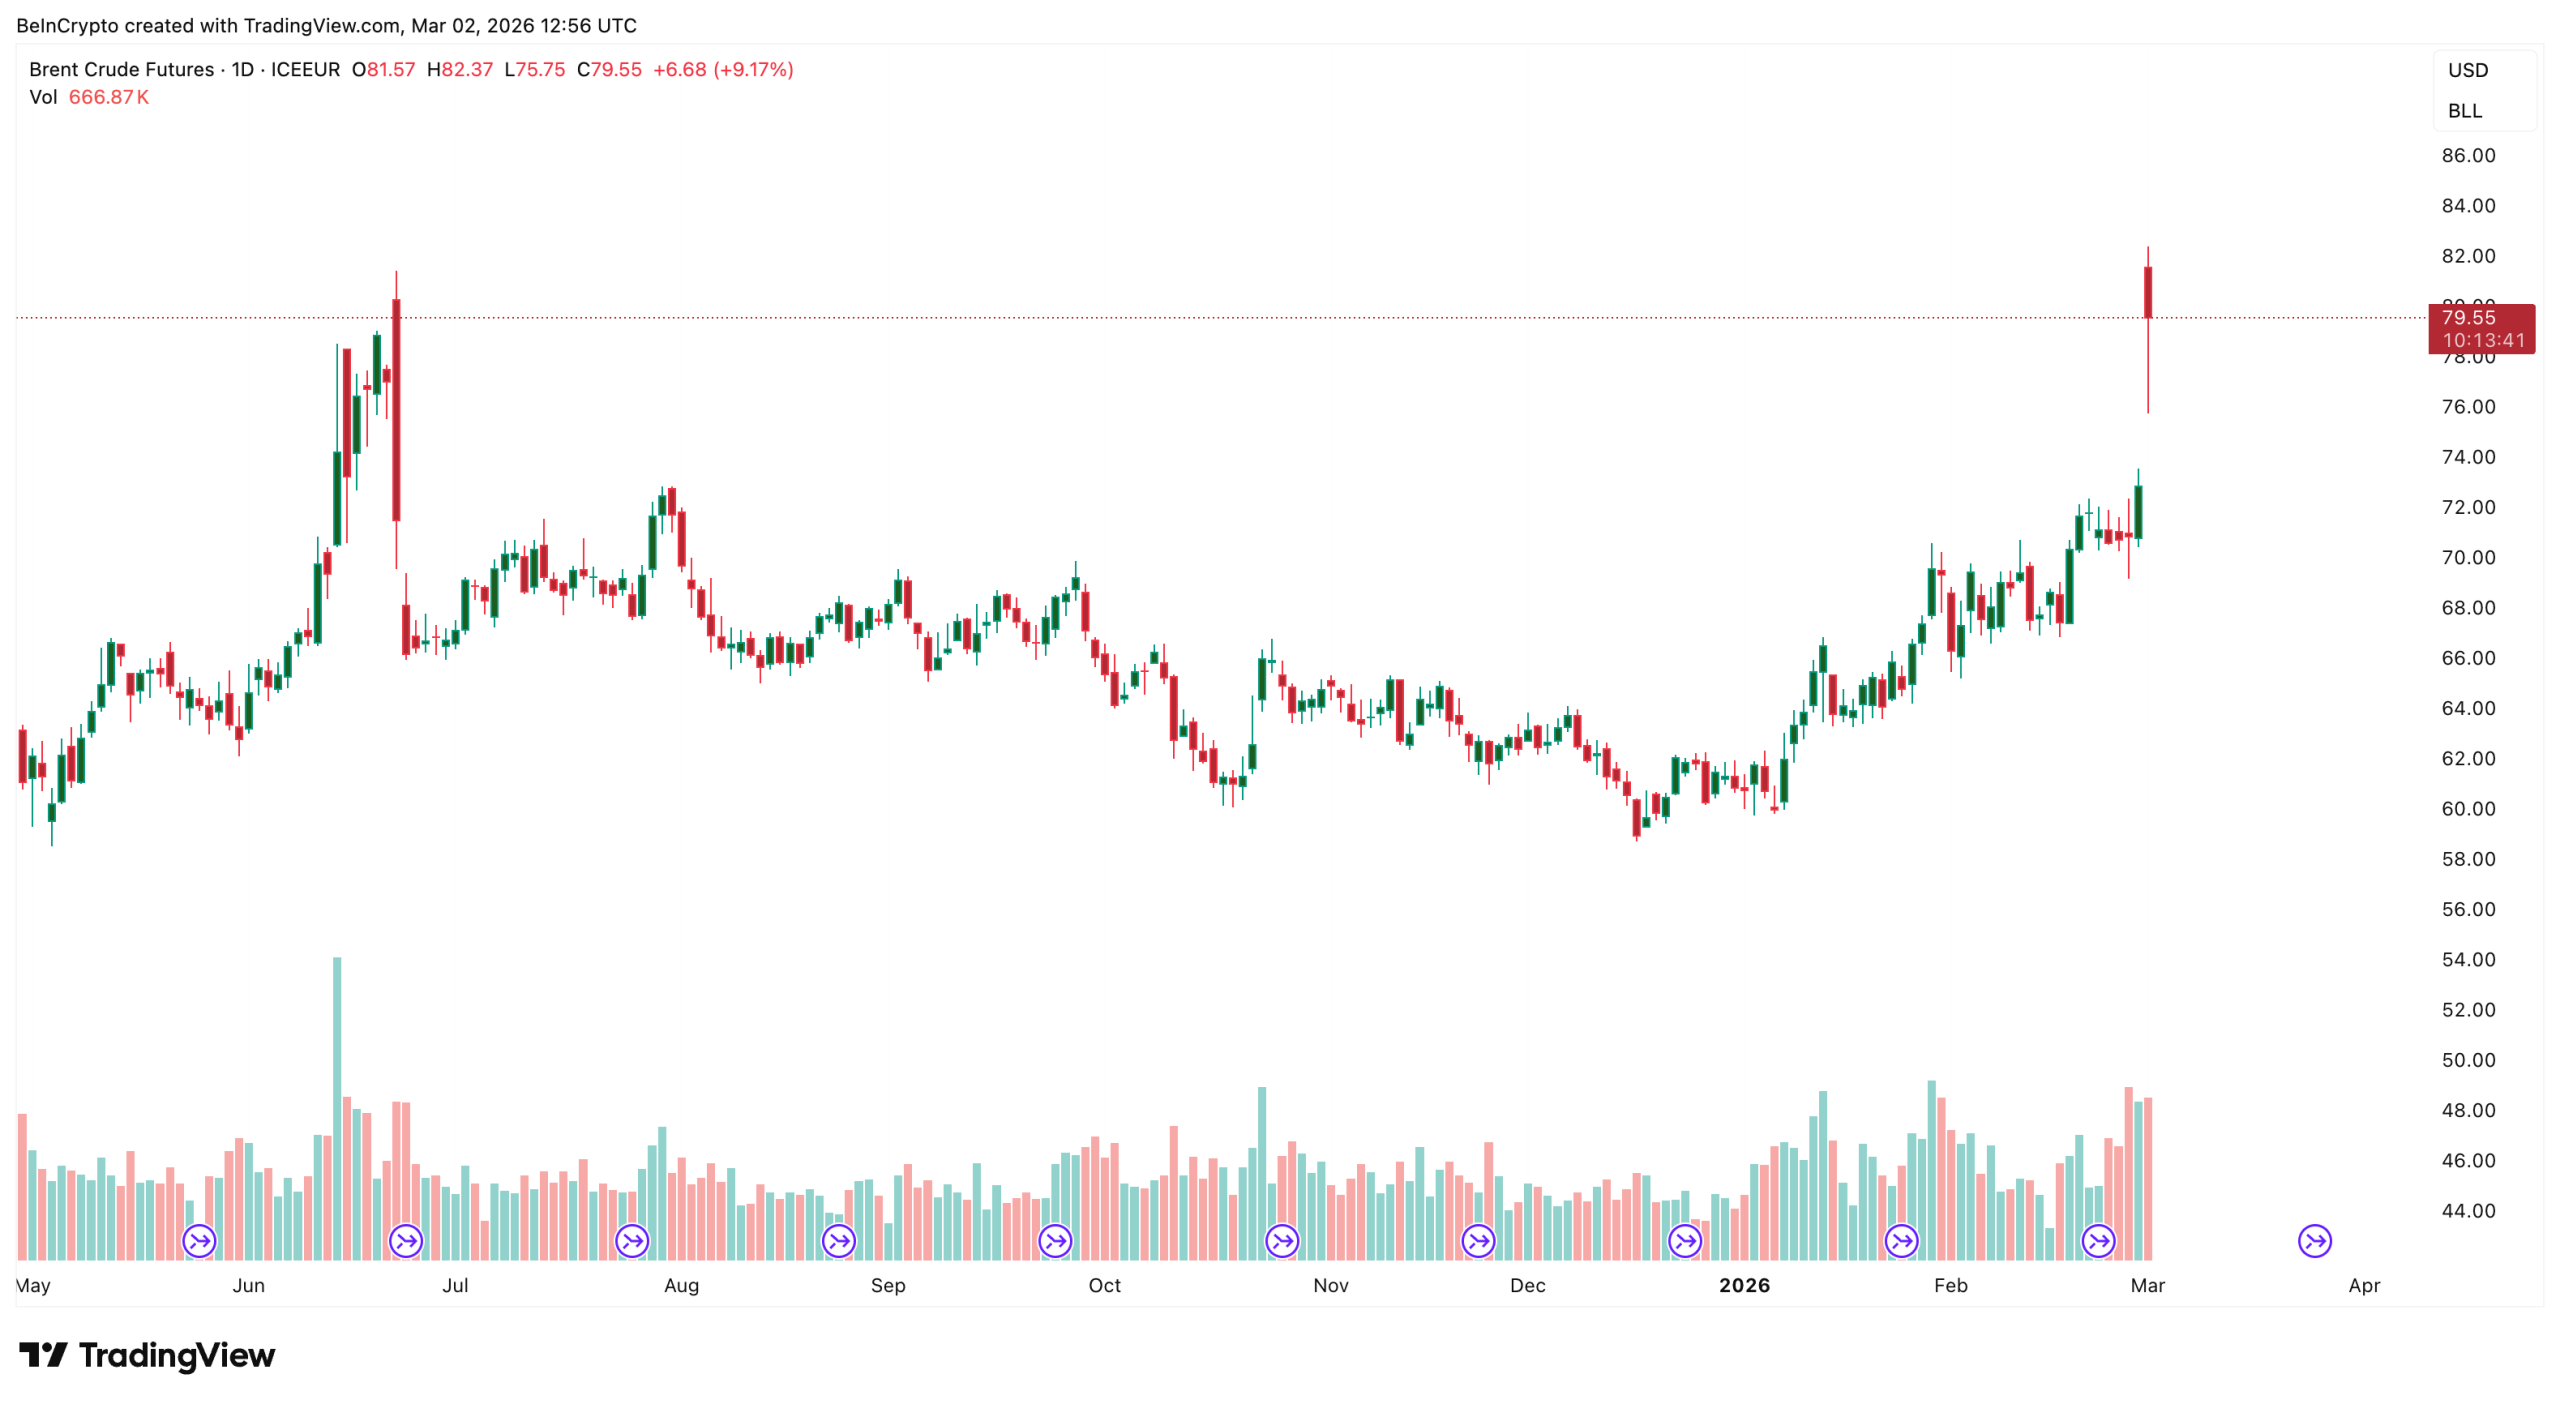
The oil price surged sharply this week after conflict in the Middle East pushed Brent crude futures (ICEEUR:BRN1!) to $82, marking its biggest shock in months. Brent is the global oil benchmark, widely used to price international crude, which makes it the clearest measure of the oil price reaction to geopolitical risk.
The breakout is tracked on the CFD (Contract for Difference) charts, which reflect price structure but not actual positions. However, futures data from ICE Futures Europe confirmed real traders entered the market, validating the oil price surge as both a geopolitical and positioning-driven move.
Oil Price Surge and Rising Dollar Create Early Stress at $82
The oil price jumped from around $72 to $82 after US-Israeli strikes on Iran. The retaliation raised fears of supply disruption through the Strait of Hormuz, a critical route carrying nearly one-fifth of global oil flows. This sudden repricing added a war premium, meaning traders pushed the oil price higher due to expected supply risk rather than immediate shortages.
This shock triggered a gap-up opening in Brent crude oil. Such moves often face early stress because markets tend to retest part of the jump before continuing higher.
That stress appeared near $82, as Brent crude oil corrected to $79.
The latest candle closed red with elevated volume. Volume in red indicates more trading occurred as the oil price corrected post-gap-up, indicating active selling pressure.

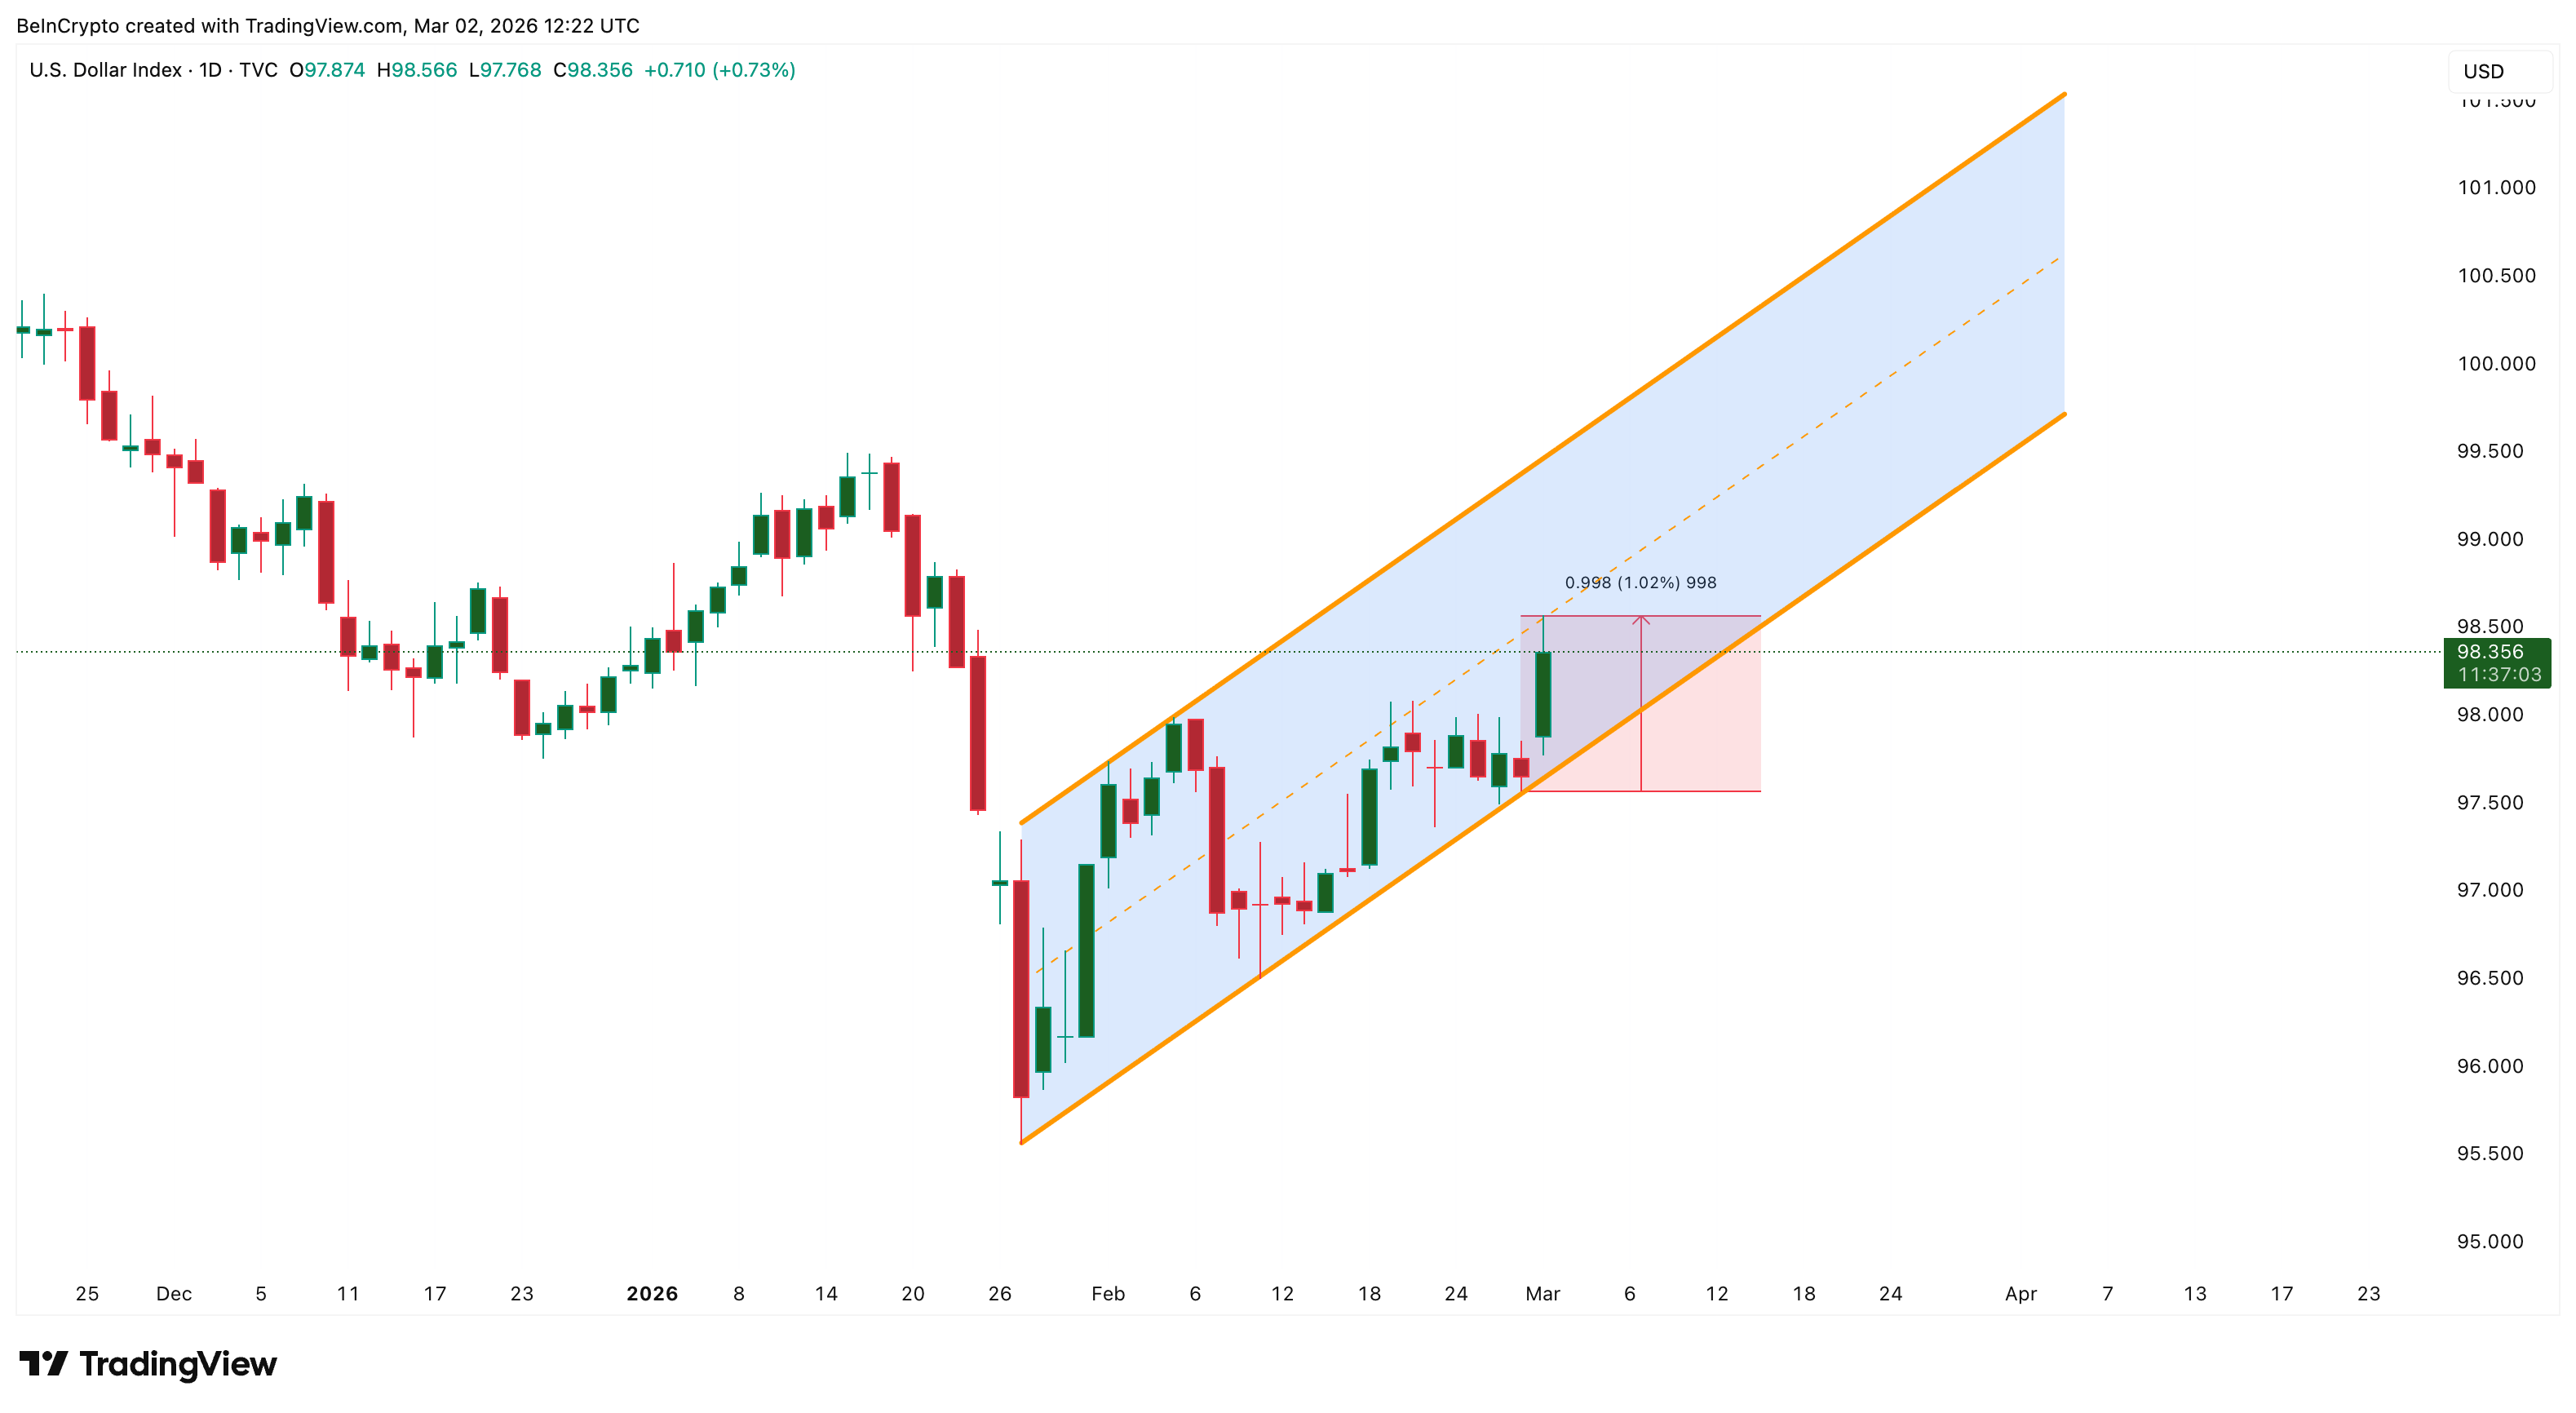
At the same time, the US Dollar Index (DXY), which tracks dollar strength against major currencies, has also been rising. Since oil trades globally in dollars, a stronger dollar makes oil more expensive for international buyers. A bearish sign.
But another key indicator shows the full picture. Open interest, often called OI, has risen sharply on Brent futures (ICEEUR:BRN1!). Rising open interest means new traders are entering the market rather than closing positions. This validates the short-term bullish bias.
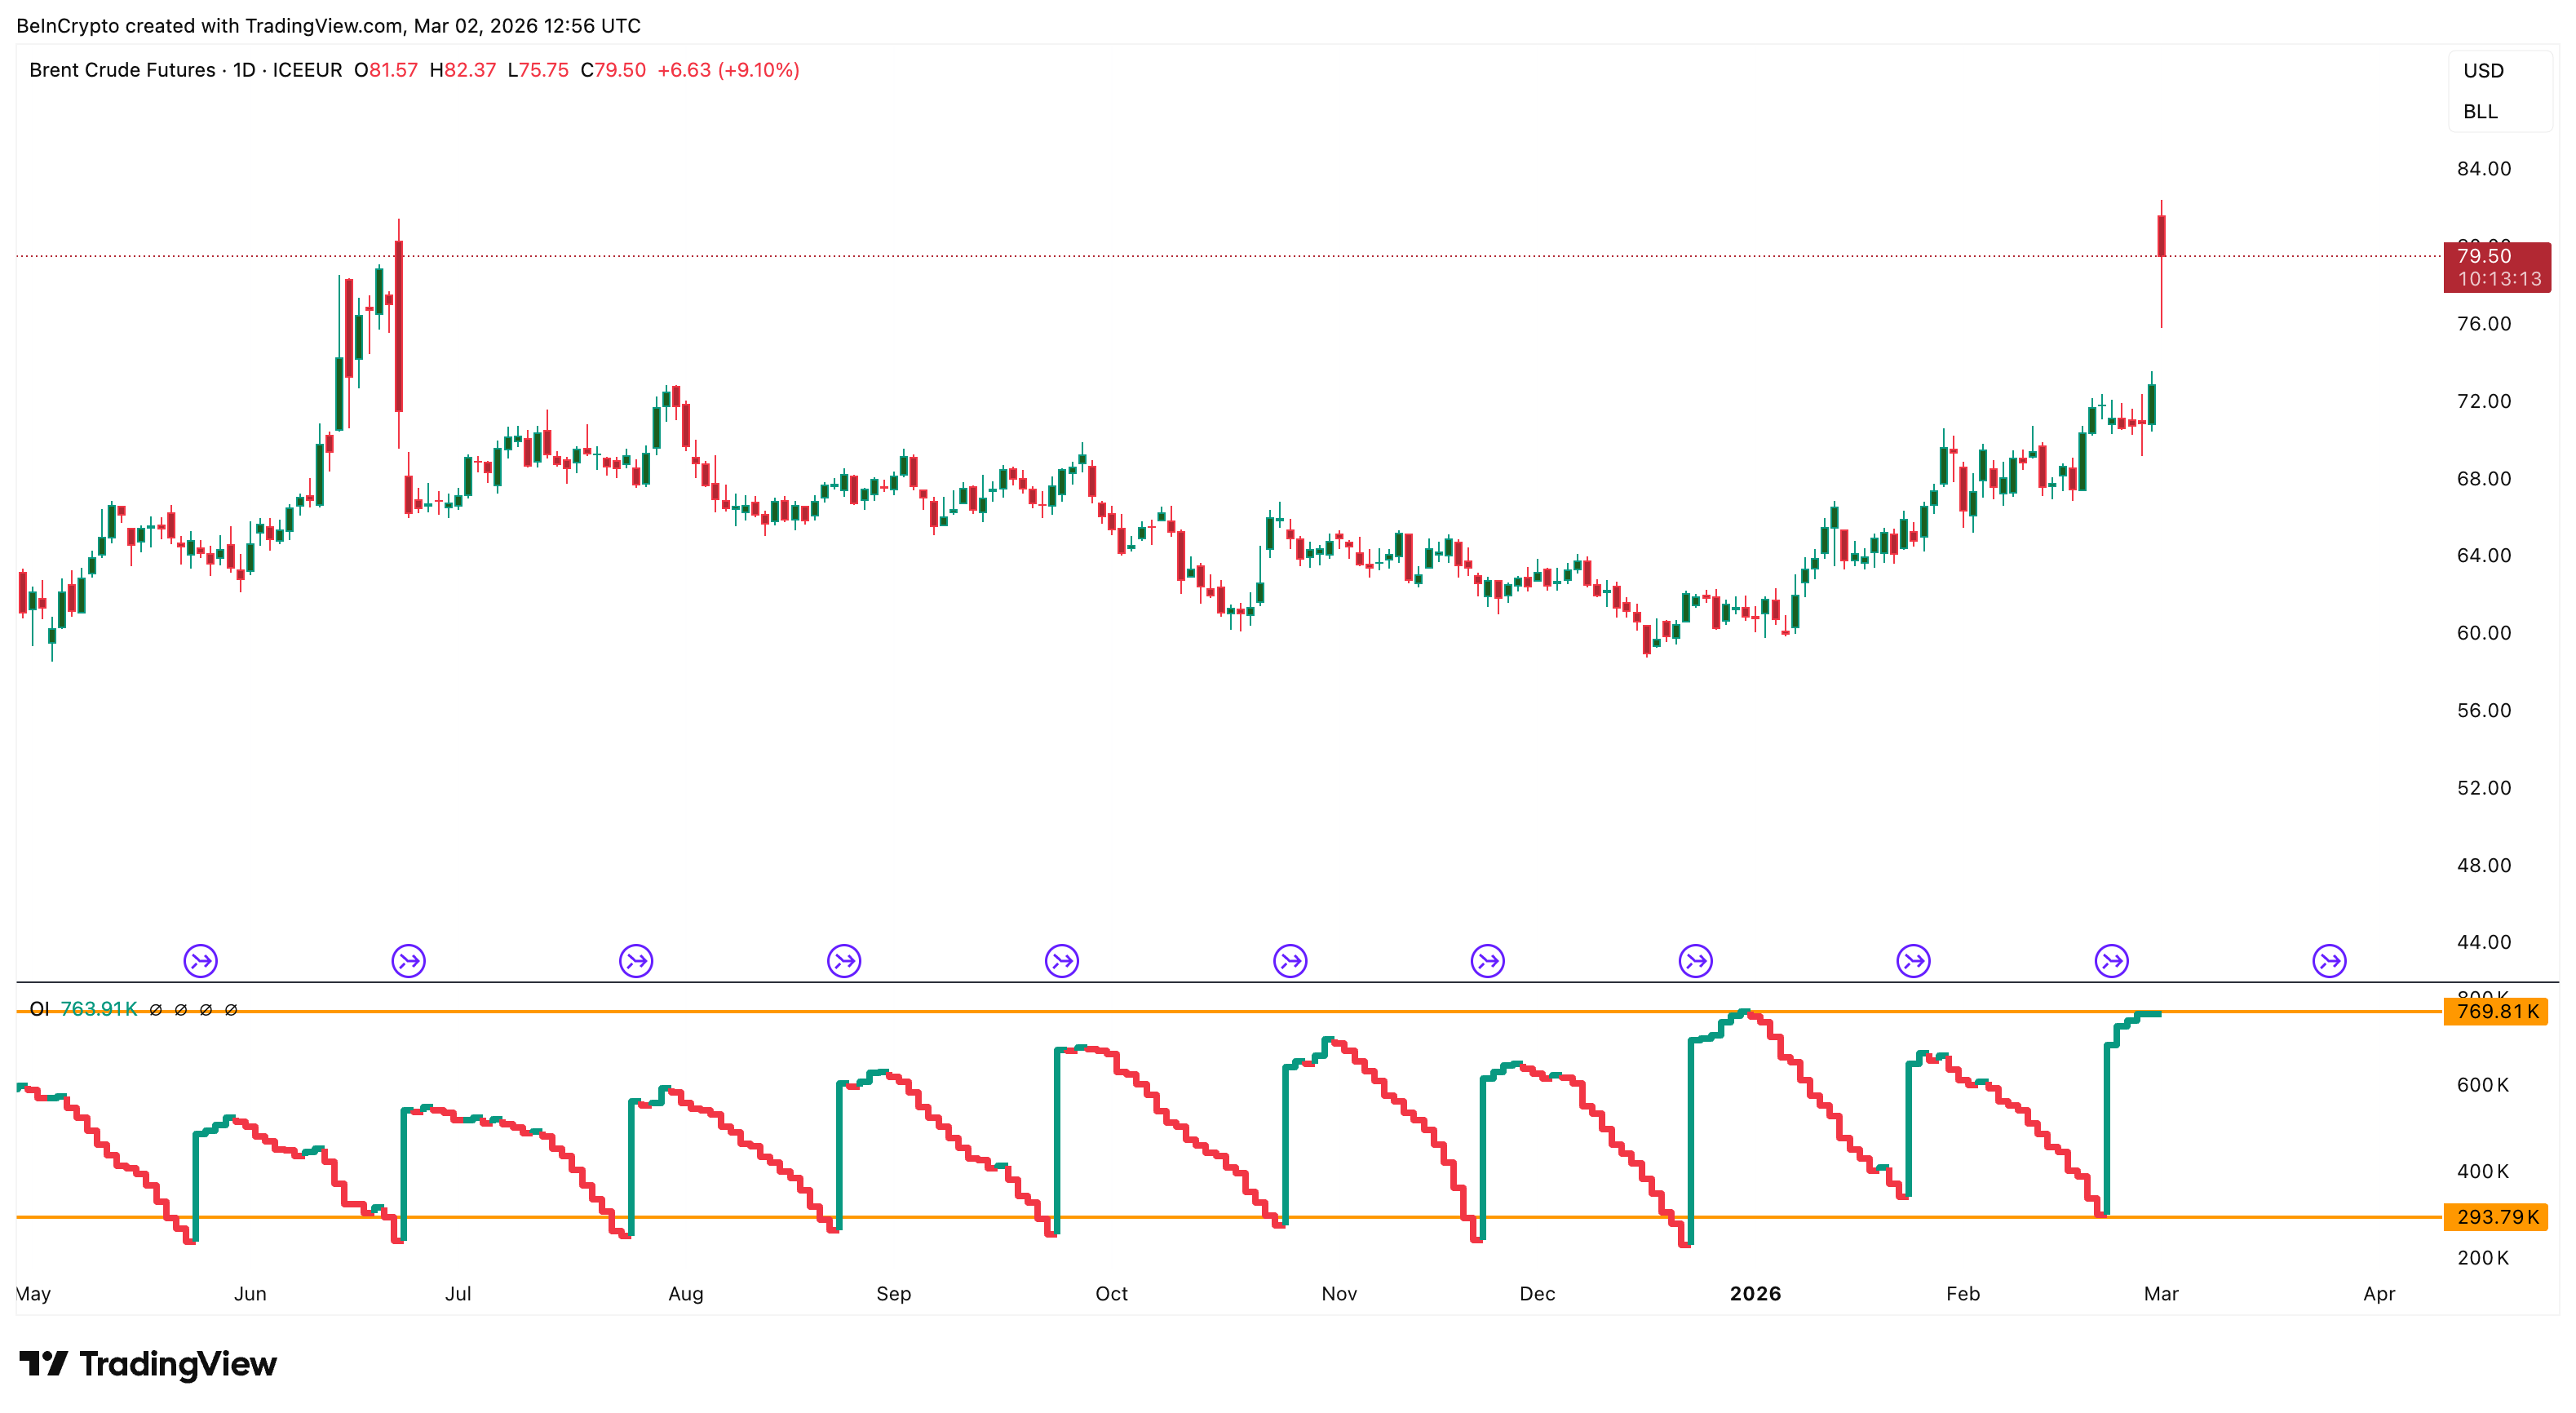
This shows the oil price is not falling due to a lack of interest. Instead, the market is absorbing selling while new positions continue building. However, traders need to keep an eye out for the flattening open interest.
Price rising while open interest is flat means the move is likely driven by short covering, not new buying, so the trend is weaker and may not sustain.
OPEC Supply Increase Adds Future Risk Even as War Drives Current Price
At the same time, OPEC, the Organization of the Petroleum Exporting Countries, announced it would increase production by 206,000 barrels per day starting in April. OPEC is a group of major oil-producing nations that control a large share of global supply.
Normally, a higher supply reduces the oil price because more oil becomes available.
However, the oil price continued rising because war risk affects supply immediately, while OPEC’s production increase happens later. This creates a conflict between short-term supply fears and longer-term supply growth.
The Strait of Hormuz remains central to this risk. Even the possibility of disruption is enough to keep traders cautious and maintain upward pressure on the oil price. This also explains why open interest has started to flatline and why selling pressure emerged after the gap-up opening, as traders remain cautious about chasing the oil price higher while the risk of sudden supply and macro shifts remains elevated.
Futures Positioning Shows Market Is Preparing for a Larger Oil Price Move
Futures positioning shows the oil price breakout is attracting strong participation. The sharp rise in open interest on Brent crude oil futures (ICEEUR: BRN1!), seen earlier, confirms that traders are actively opening new positions as volatility increases.
This positioning trend is spreading beyond traditional markets. Platforms like Aster, a crypto-based derivatives exchange, have launched oil perpetual futures.
The rise in oil trading on crypto platforms shows how widespread the positioning has become. It reflects broad positioning across financial markets.
Key oil price levels are tracked using the Brent crude CFD, while the Brent crude oil Futures are used to track volume and open interest.
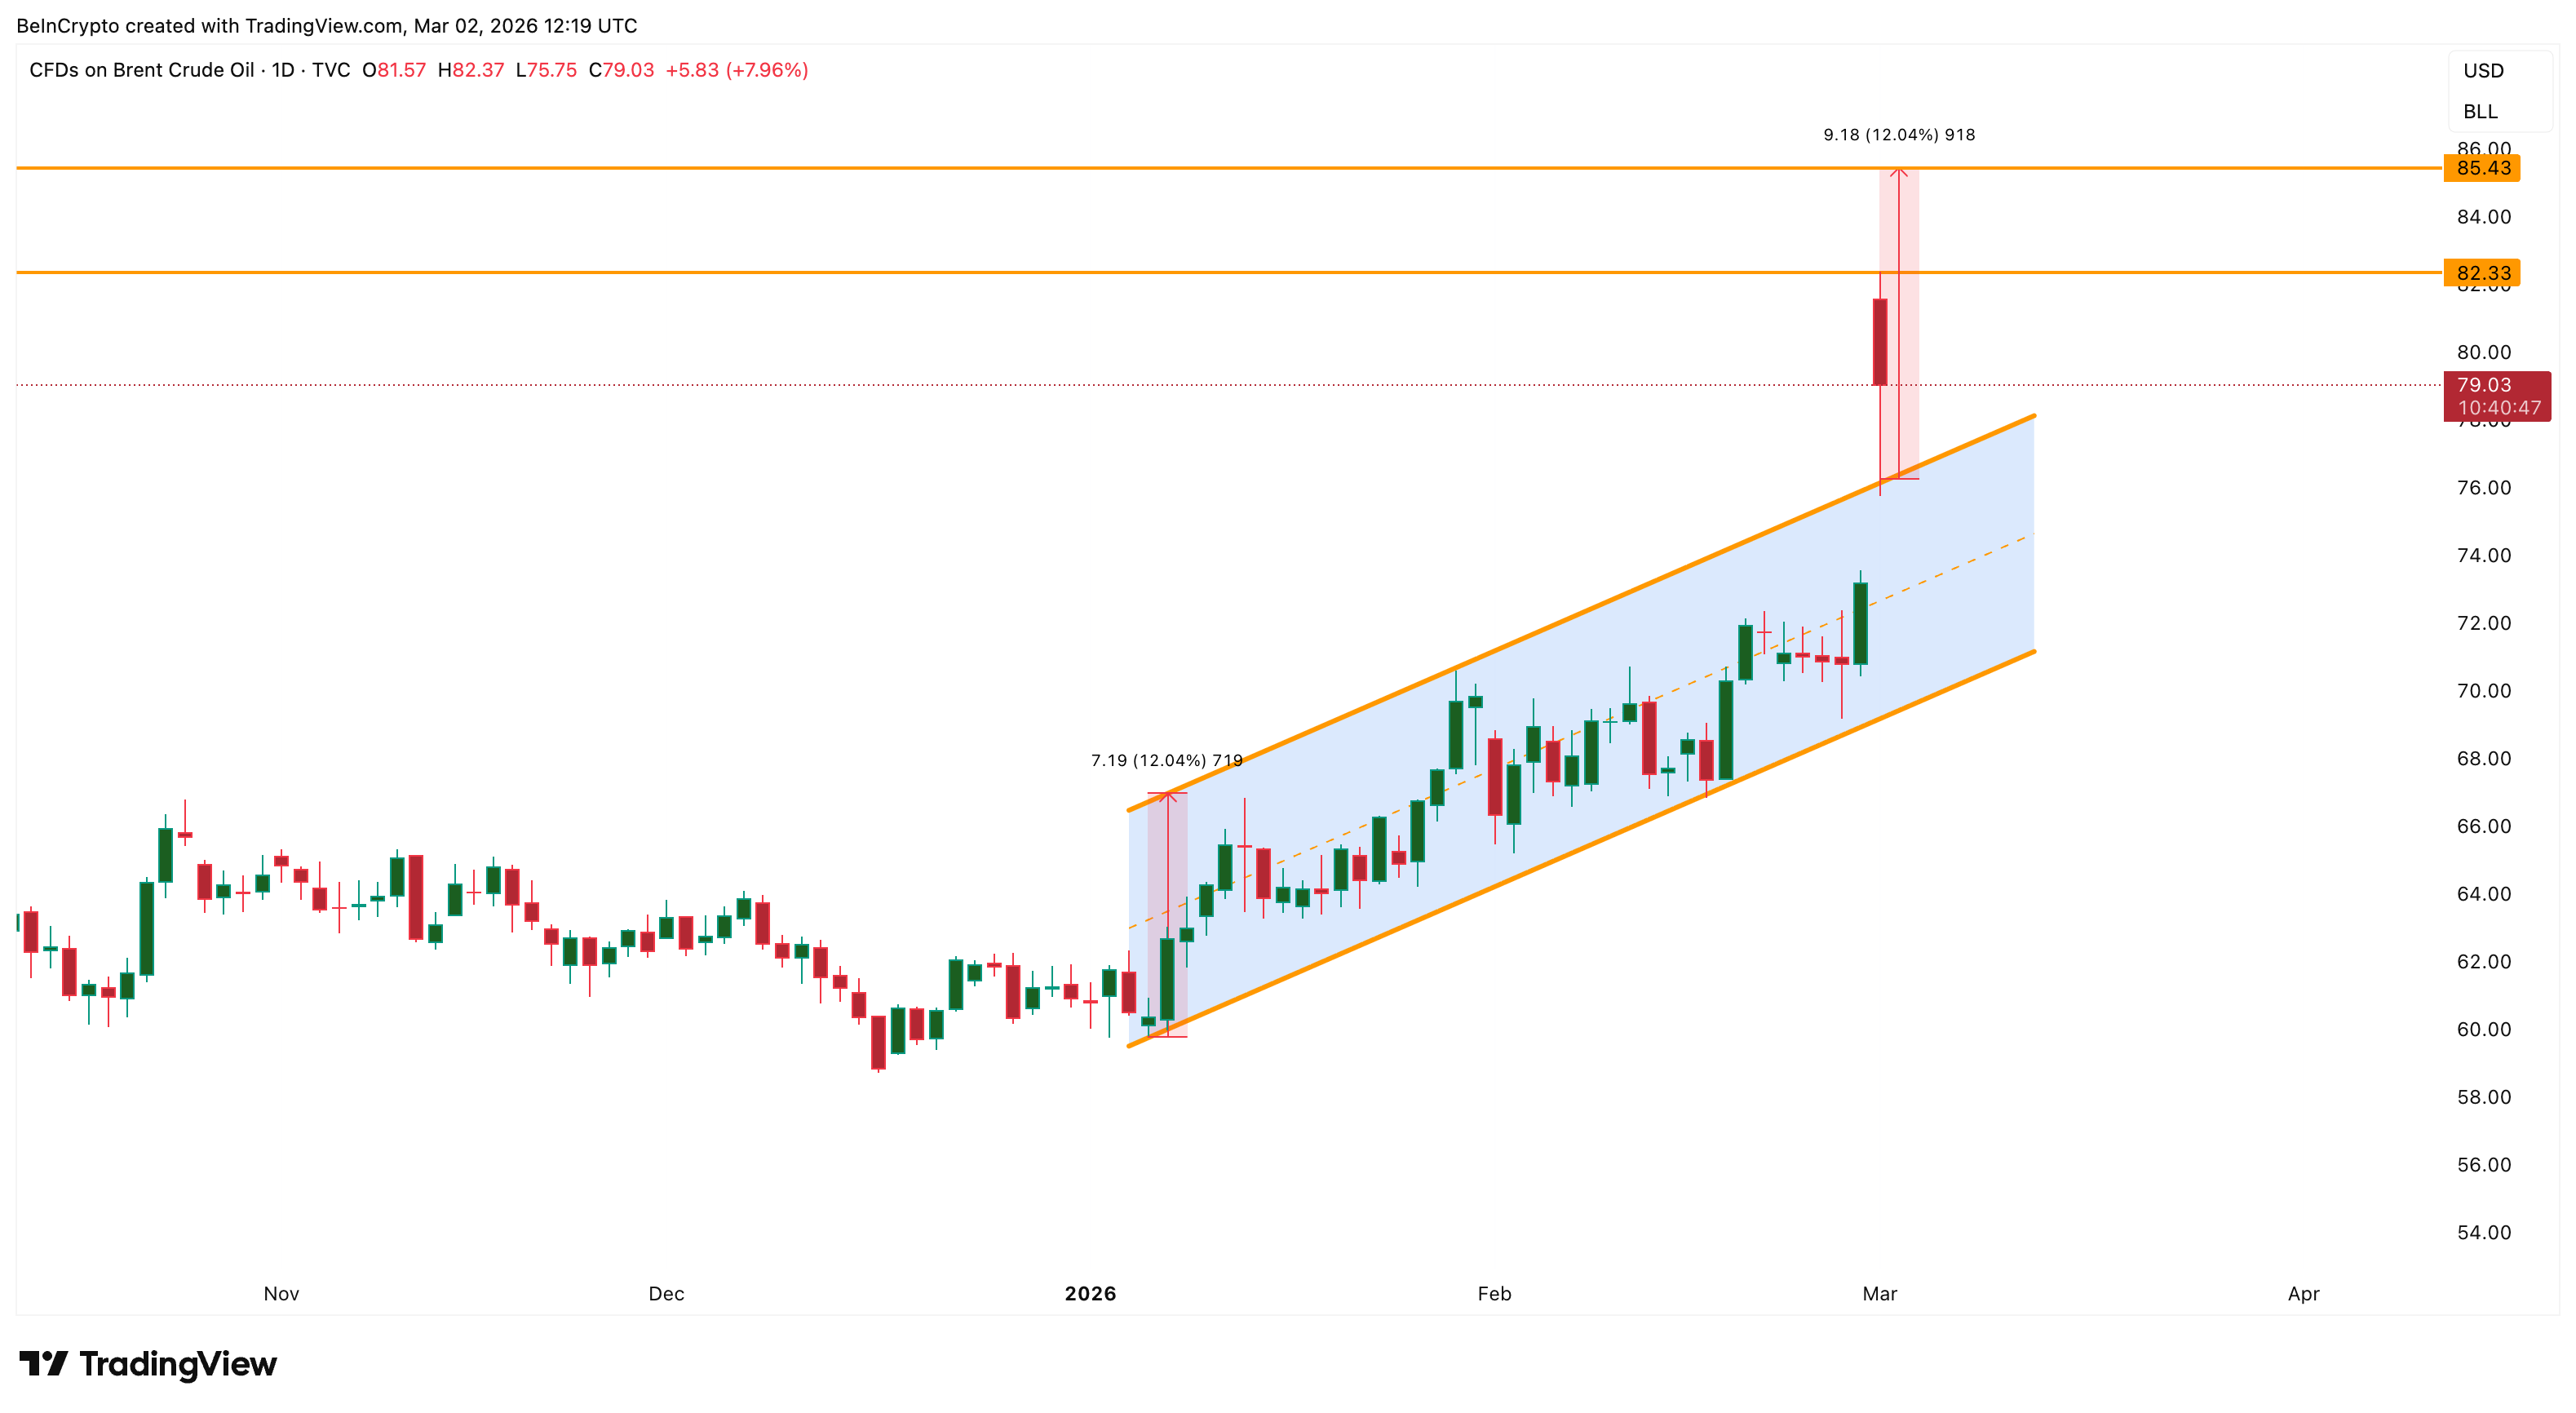
Per the chart, the first resistance remains $82, which aligns with the Fibonacci retracement (mentioned later).
If the oil price breaks above $82, the next target becomes $85, based on the ascending channel breakout projection. Above that, the next resistance levels appear at $93 and $104 if geopolitical risk continues. Adding to this current strength is the Exponential Moving Average (EMA) positioning.
This measures the average price over time while giving more weight to recent data, and recently confirmed a golden crossover where the 50-day EMA crossed above the 200-day EMA, a signal that previously preceded the latest upward move. The 100-day EMA is now rising toward the 200-day EMA, showing strengthening trend support.
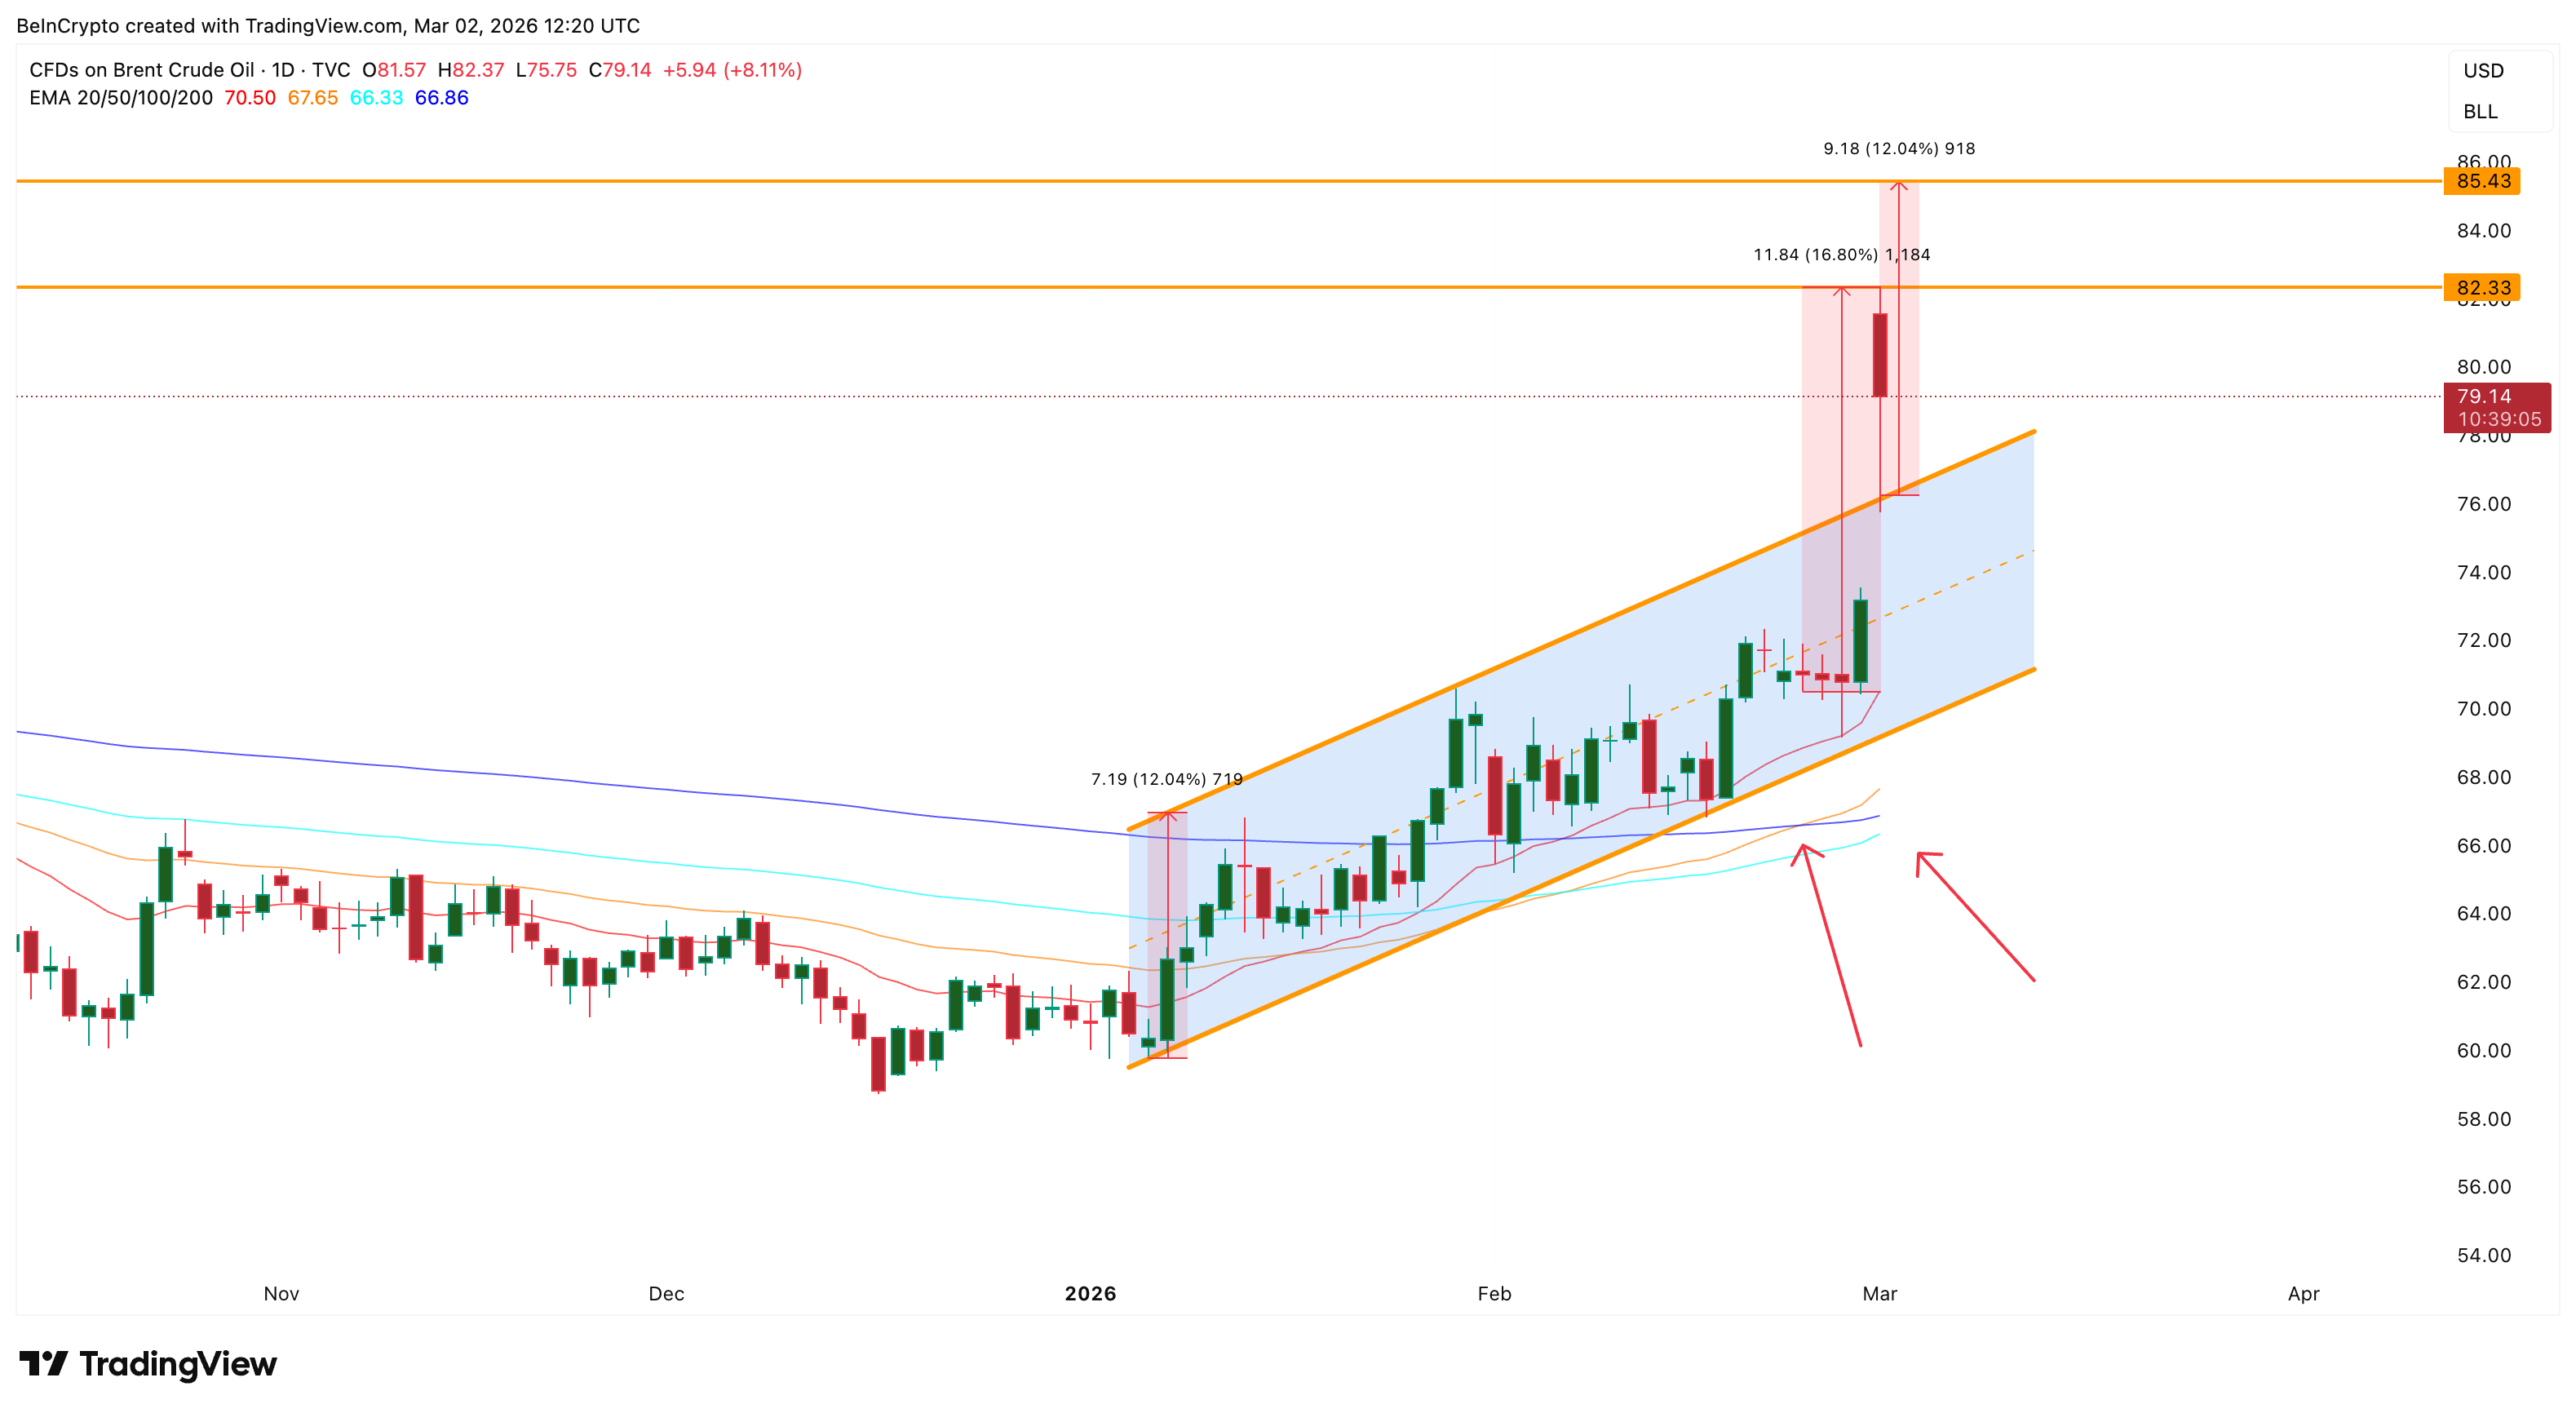
If that bullish crossover confirms, the $85 target, based on the ascending channel’s projection, might show up first.
However, the most important support level is $75.
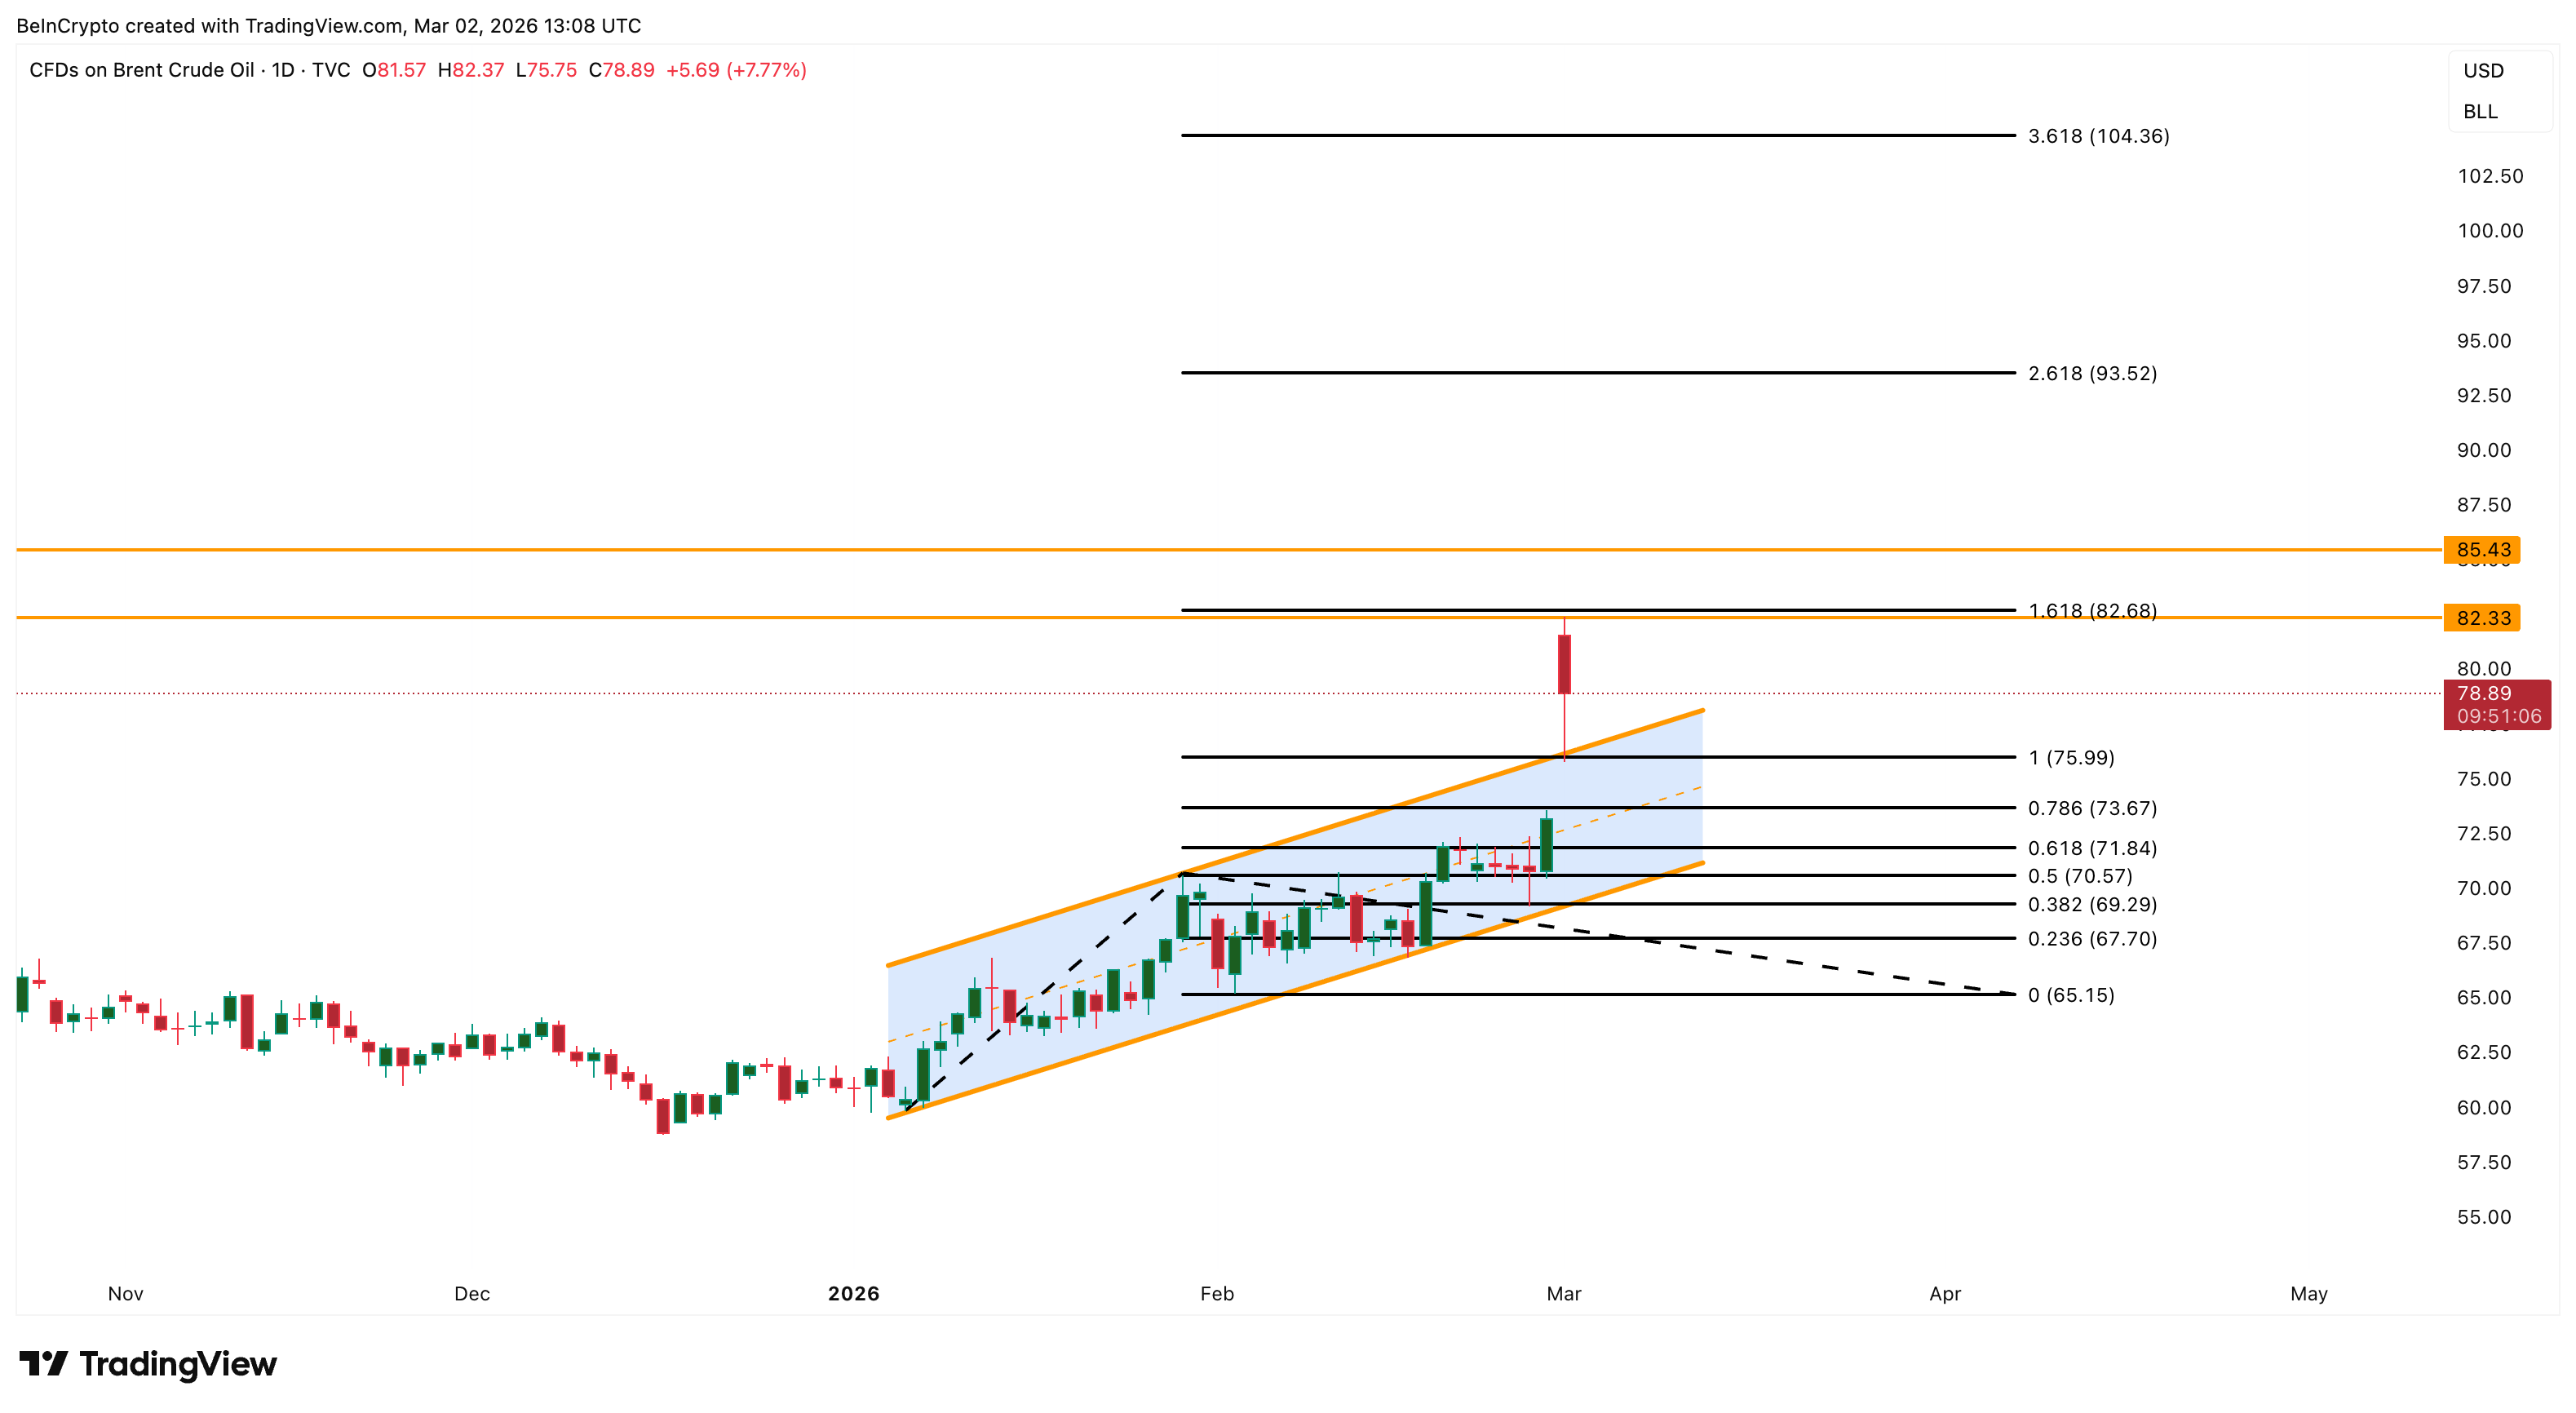
If the oil price falls below $75, it could decline toward $73 and $71. However, the bullish structure only weakens on possible peace talks and a dip under $67.

War in the Middle East failed to sink Bitcoin (BTC) below the $63,000 level. That may have attracted buyers who are attempting to maintain the price above $69,000. However, a quick recovery is unlikely. Macroeconomic newsletter Ecoinometrics said in a post on X that deep drawdowns generally unfold slowly, advising “patience rather than urgency.”
Data shared by Bitwise Europe head of research André Dragosch shows that when investors buy and hold BTC for at least three years, the probability of loss drops to 0.70%. Although BTC is down roughly 50% from its all-time high, its three-to-five year realized price of $34,780 shows that investors who bought and held during the period are sitting on large profits.

The big question on traders’ minds is when to buy BTC. BitMEX co-founder Arthur Hayes said in a blog post that every military action by the US Presidents in the Middle East since 1985 has resulted in monetary expansion by the Federal Reserve. If the current conflict stretches, the likelihood of a similar action by the Fed increases.
Could buyers push BTC and major altcoins above their resistance levels? Let’s analyze the charts of the top 10 cryptocurrencies to find out.
S&P 500 Index price prediction
The S&P 500 Index (SPX) continues to trade between the 6,775 support and the 7,002 resistance, indicating buying on dips and selling on rallies.

The longer the time spent inside the range, the stronger the eventual breakout from it. If the price turns down and breaks below the 6,775 level, it suggests that the bears have overpowered the bulls. That may start a deeper correction toward the 6,550 level.
Buyers will have to push and maintain the price above the 7,002 resistance to signal the start of the next leg of the uptrend. The index may then surge to the 7,290 level.
US Dollar Index price prediction
The US Dollar Index (DXY) skyrocketed above the 50-day simple moving average (97.91), indicating aggressive buying by the bulls.

The index might rally to the 99.50 level and thereafter to the 100.54 resistance. Sellers are expected to fiercely defend the 100.54 level, as a close above it suggests the start of a new uptrend.
This positive view will be negated in the near term if the price turns down and breaks below the 20-day exponential moving average (97.67). That opens the doors for a drop to the 96.21 to 95.55 support zone.
Bitcoin price prediction
BTC has formed a symmetrical triangle pattern, indicating a balance between supply and demand.

The bulls are attempting to strengthen their position by pushing the Bitcoin price above the resistance line. If they manage to do that, the BTC/USDT pair may surge to the breakdown level of $74,508. A close above the $74,508 level will be the first sign that the pair may have bottomed out at $60,000.
Alternatively, if the price turns down from the $74,508 level and breaks below the 20-day EMA, it suggests that the bears remain active at higher levels. That may result in a range formation between $60,000 and $74,508.
Ether price prediction
Ether (ETH) remains range-bound between $1,750 and $2,111, indicating a tough battle between the bulls and the bears.

The bulls will have to secure a close above the $2,111 resistance to seize control. If they manage to do that, the ETH/USDT pair may rally to the 50-day SMA ($2,427) and, after that, to $3,045.
Contrary to this assumption, if the Ether price turns down from the $2,111 level, it suggests that the consolidation may continue for a few more days. The bears will be back in the driver’s seat on a close below $1,750. That clears the path for a collapse to the $1,537 level.
XRP price prediction
XRP (XRP) is struggling to rise above the 20-day EMA ($1.42), but a positive sign is that the bulls continue to exert pressure.

If buyers push the XRP price above the 20-day EMA, the XRP/USDT pair may rise to the 50-day SMA ($1.63) and later to the downtrend line. A close above the downtrend line will signal a potential trend change.
Instead, if the price turns down from the 20-day EMA and breaks below the support line, it indicates that the bears remain in control. There is support at $1.11, but if the level gives way, the decline may extend to $1.
BNB price prediction
BNB (BNB) has been trading inside the $570 to $670 range for a while, indicating buying at lower levels.

The 20-day EMA ($633) is flattening out, and the relative strength index (RSI) is gradually climbing higher. That suggests the selling pressure may be reducing. The bulls will attempt to drive the BNB price above the $670 level. If they can pull it off, the BNB/USDT pair may soar to the 50-day SMA ($742).
Sellers are likely to have other plans. They will attempt to defend the $670 level and pull the price below the $570 support. If they succeed, the pair may plummet to psychological support at $500.
Solana price prediction
Buyers have pushed Solana (SOL) above the 20-day EMA ($86), indicating demand at lower levels.

Sellers will attempt to halt the relief rally at $95, but if the bulls prevail, the SOL/USDT pair may soar toward $117. Such a move suggests that the Solana price may have bottomed out in the short term.
Contrary to this assumption, if the price turns down from the overhead resistance, the pair may swing between $76 and $95 for a while longer. A break below the $76 support signals the resumption of the downtrend to $67.
Related: Will Bitcoin crash if oil prices hit $100 per barrel?
Dogecoin price prediction
Dogecoin (DOGE) has been trading between the 20-day EMA ($0.10) and the $0.09 support for the past few days.

If the $0.09 level gives way, the DOGE/USDT pair may retest the Feb. 6 low of $0.08. Buyers are expected to vigorously defend the $0.08 level, as a close below it may start the next leg of the downtrend to $0.06.
The bulls will have to propel the Dogecoin price above the 20-day EMA to signal strength. The pair may then rally to the breakdown level of $0.12, where the bears are expected to step in.
Bitcoin Cash price prediction
Buyers are attempting to sustain Bitcoin Cash (BCH) above the $443 support, but the bears have kept up the pressure.

The downsloping moving averages and the RSI near the oversold zone increase the likelihood of a breakdown. There is minor support at $423, but it is likely to be broken. The BCH/USDT pair may then plunge to $377.
Any rebound off the $443 level is expected to face selling at the moving averages. Buyers will have to push the Bitcoin Cash price above the 50-day SMA ($546) to gain the upper hand.
Cardano price prediction
Cardano (ADA) continues to trade inside the descending channel pattern, indicating that the bears remain in command.

If the Cardano price sustains below the 20-day EMA ($0.28), the bears will attempt to tug the ADA/USDT pair below the $0.25 support. If they manage to do that, the pair may tumble to the support line. A strong rebound off the support line suggests that the pair may remain inside the channel for a while longer.
The bulls will have to push and retain the price above the downtrend line to signal a potential trend change. The pair may then climb toward $0.43.
This article does not contain investment advice or recommendations. Every investment and trading move involves risk, and readers should conduct their own research when making a decision. While we strive to provide accurate and timely information, Cointelegraph does not guarantee the accuracy, completeness, or reliability of any information in this article. This article may contain forward-looking statements that are subject to risks and uncertainties. Cointelegraph will not be liable for any loss or damage arising from your reliance on this information.

March is shaping up to be explosive for select meme coins, with triple-digit monthly rallies and sharp weekly reversals reigniting speculative momentum. Technical indicators show aggressive capital inflows and strengthening buying pressure, hinting that some tokens may still have room to run.
In line with the same, BeInCrypto has analysed three meme coins that the investors should keep an eye on in March.
BUILDon (B)
BUILDon price surged 42% over the past week, climbing to $0.189 and reversing its February losses. The meme coin regained momentum after prolonged weakness. This sharp rally reflects renewed investor interest and improved short-term sentiment within the broader crypto market.
While the rest of the previous month was bleak for the meme coin, the past week proved to be a game-changer. The MFI verifies this rise as it shows that the indicator is climbing above the neutral mark. This is a sign of buying pressure taking control, which, if continued until the overbought threshold is hit, could push the B price past $0.203 and towards $0.275 to recover all of 2026 losses.
Want more token insights like this? Sign up for Editor Harsh Notariya’s Daily Crypto Newsletter here.
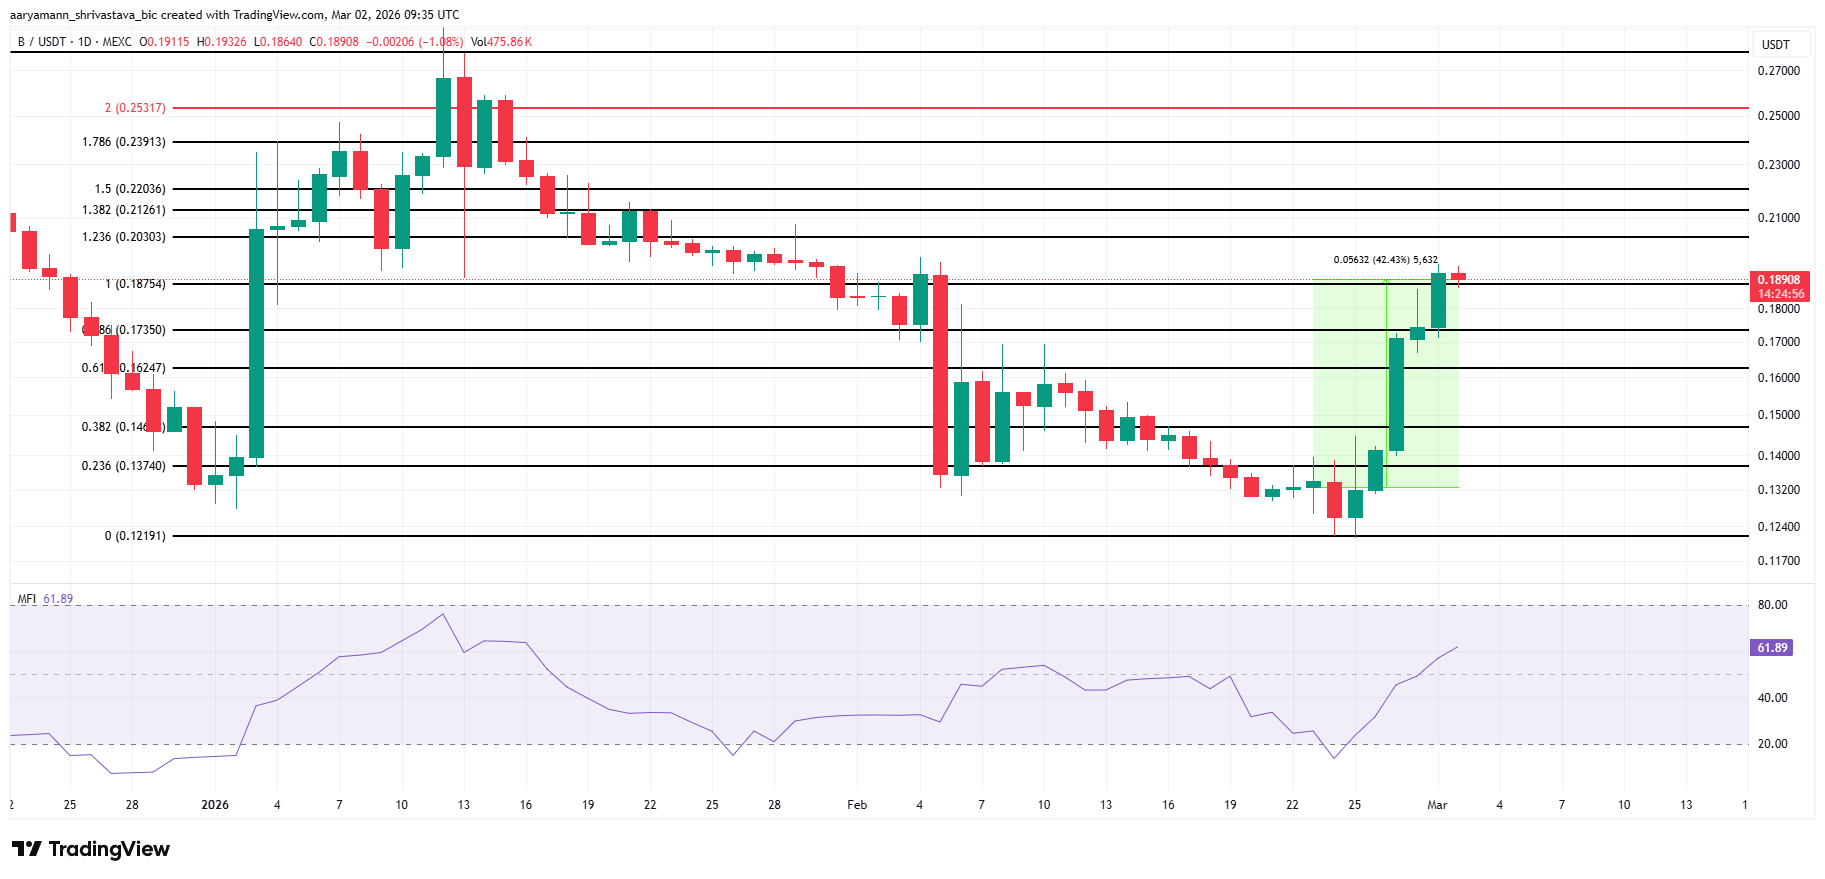
However, profit-taking remains a key risk. If holders begin selling into strength, upside could stall quickly. A reversal may push BUILDon toward Fibonacci supports at $0.162, $0.140, or $0.137. Such a decline would invalidate the bullish thesis and reintroduce downside pressure.
Siren (SIREN)
SIREN price has surged 271% over the past month, making it the top-performing meme coin. Despite the sharp rally, bullish momentum has not fully faded. Continued investor interest and elevated trading activity suggest the uptrend may still have room to extend.
The Relative Strength Index shows renewed strength after a brief dip. RSI turning higher signals improving momentum. Trading at $0.298, SIREN could break above $0.386. Securing $0.465 as support would strengthen prospects for a move toward the $0.605 all-time high.
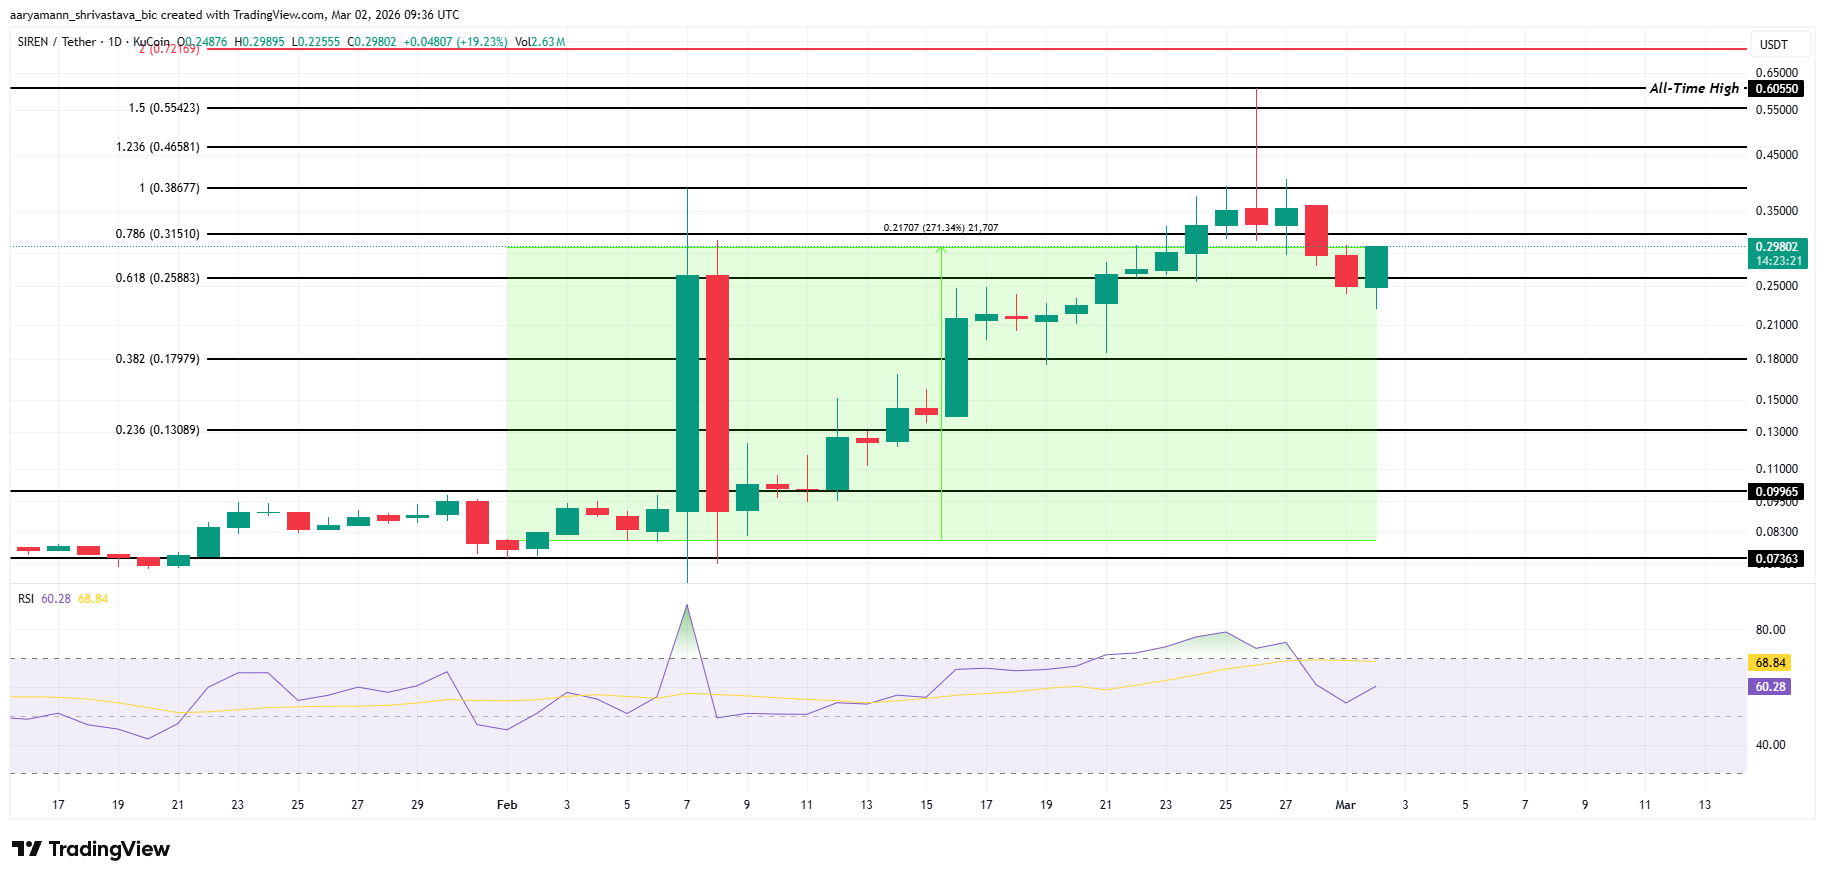
However, profit-taking risk remains significant. If bullish momentum stalls or selling intensifies among its 42,000 holders, SIREN could decline toward $0.179. A deeper drop to $0.130 would invalidate the bullish thesis and erase much of the recent rally.
Not in Employment, Education, or Training (NEET)
NEET price has surged 223% over the past month, trading at $0.0205 at the time of writing. The meme coin continues to show buying pressure. The Money Flow Index remains above the neutral 50 mark, signaling sustained inflows and strengthening investor interest.
If demand persists, NEET may not have reached its ceiling. A breakout above $0.0285 could extend gains toward $0.0336. Continued momentum may push the price beyond $0.0432, marking a recovery from prior losses and reinforcing the broader uptrend structure.
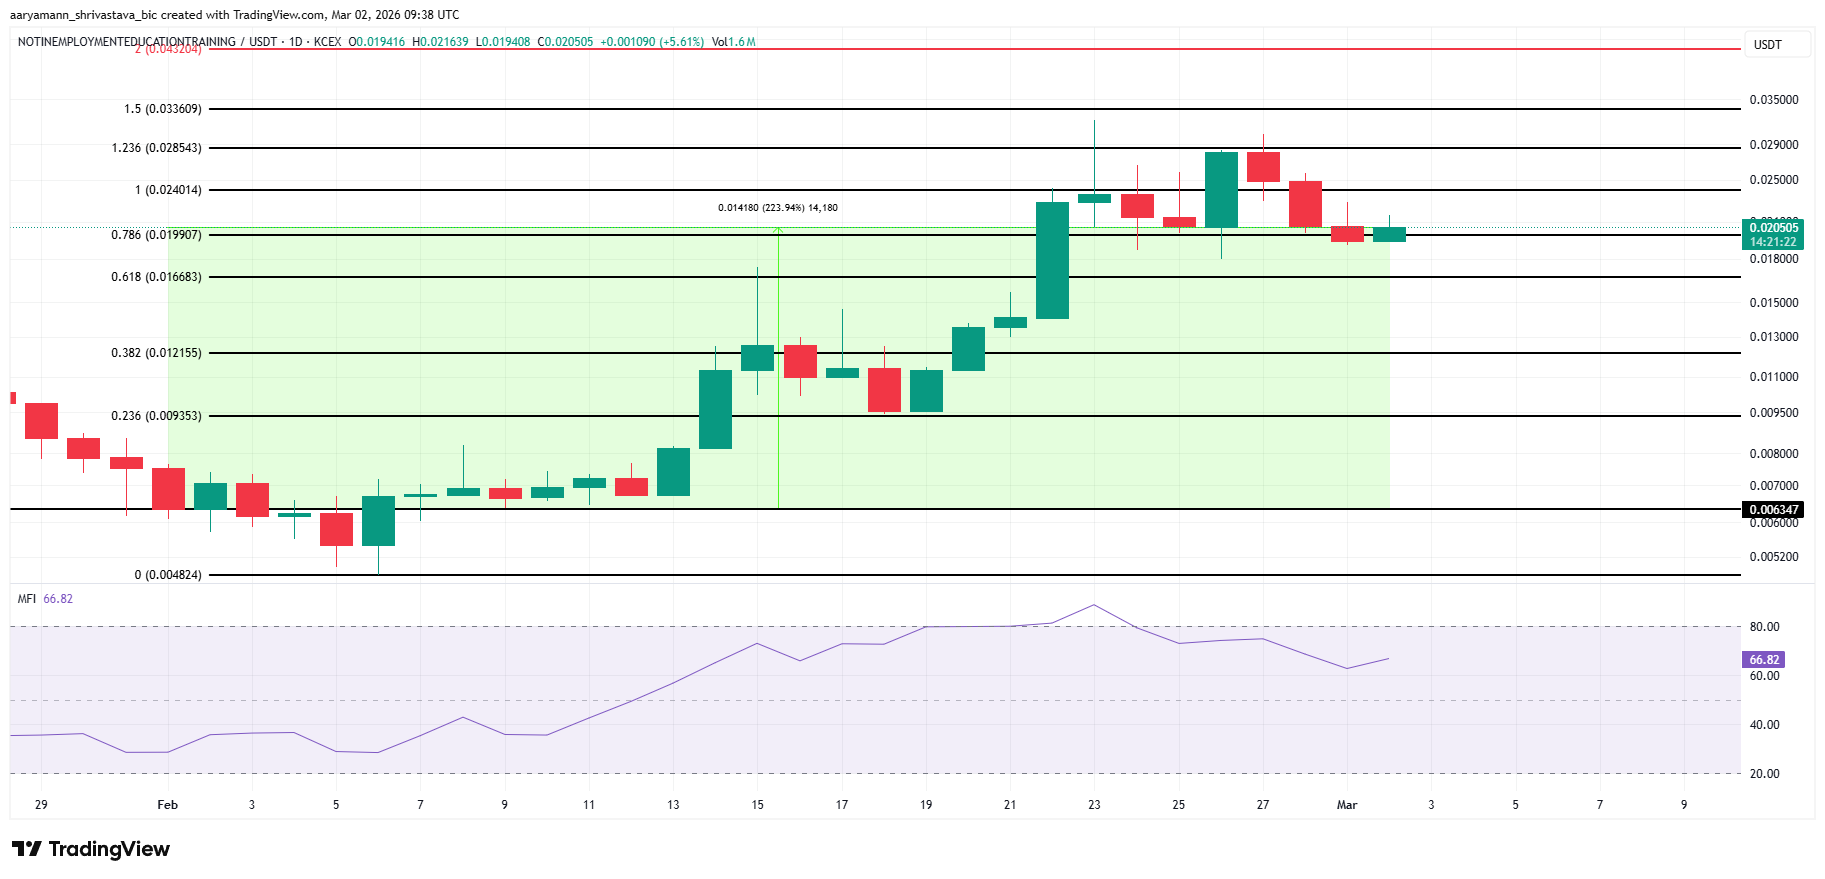
However, weakening bullish momentum would alter the outlook. Rising geopolitical risks could pressure speculative assets. A breakdown below $0.0166 may expose $0.0121 support. Such a decline would invalidate the bullish thesis and shift short-term momentum back to sellers.


Vitalik Buterin is turning his attention to a part of Ethereum most users never think about but that has quietly become one of its biggest pressure points: who gets to decide what transactions goes into a block.
In a new blog post on Monday, the Ethereum co-founder lays out a series of ideas aimed at preventing block building, the process of assembling transactions before they’re finalized onchain, from becoming too centralized.
While Ethereum’s upcoming “Glamsterdam” upgrade will formalize proposer-builder separation, which will allow validators to outsource block construction to a competitive market, Buterin argues that simply creating a marketplace of builders doesn’t solve everything. If a small number of builders dominate, they could still censor transactions or extract outsized profits from users.
One proposal, known as FOCIL, would act as a kind of anti-censorship backstop. Under the design, a small group of randomly selected participants would each choose transactions that must be included in the next block. If those transactions are missing, the block would be rejected. The idea is that even if a single hostile builder controlled the entire market, they couldn’t permanently exclude specific users.
Another focus of his post is so-called “toxic MEV,” where traders exploit visibility into pending transactions to front-run or “sandwich” users’ trades. One potential fix is encrypting transactions until they are finalized, preventing opportunistic actors from seeing them in advance.
Buterin also points to risks at the networking layer, where transactions can be observed by intermediaries before they even reach a block, suggesting that anonymized routing systems could become an important line of defense.
Longer term, he sketches out a vision of more distributed block building, where not every transaction requires full global coordination. Much of Ethereum’s activity, he argues, may not need to be processed in a single, tightly ordered bundle, opening the door to designs that reduce central chokepoints.
Overall Buterin seems to focus on as Ethereum scales, decentralization challenges are shifting from validators to the infrastructure that decides what users’ transactions actually make it onchain.
Read more: Vitalik Buterin reveals his bold new plan to fix Ethereum’s scaling problem


Iranian crypto users rushed to pull funds from domestic exchanges after U.S.–Israel airstrikes, triggering a 700% surge in outflows from the country’s largest platform.
Nobitex recorded over 11 million users and $7.2 billion in 2025 trading volume.
Why it matters:
- The panic withdrawal wave exposes just how quickly geopolitical shocks can destabilize crypto markets in sanctioned economies.
- It also shows how digital assets serve as a financial lifeline when traditional systems come under threat.
The details:
- Blockchain analytics firm Elliptic recorded a 700% spike in outflows from Nobitex, Iran’s largest crypto exchange, within minutes of the airstrikes.
- Nobitex has previously been linked to the Islamic Revolutionary Guard Corps (IRGC) and was reportedly used by Iran’s Central Bank to support the rial.
- As of March 2, Chainalysis reported that several Iranian exchanges, including Nobitex and Ramzinex, had gone offline.
- This may be due to government-ordered internet shutdowns or infrastructure damage from the bombings.
- On-chain data flagged by Arkham Intelligence shows Nobitex has halted outgoing transactions on its Ethereum address over the past two days.
- TON transactions continue, though analysts suspect bot activity. Notably, DOGE is currently the largest asset held on the platform.
The big picture:
The outflows show crypto’s dual role in conflict zones: a tool for capital flight and financial resilience, but also one vulnerable to infrastructure blackouts and government intervention.
Iran’s crypto sector, long shaped by sanctions and currency instability, now faces fresh disruption at a moment of acute geopolitical crisis.
Crypto World
Pepeto Raises Over $7.43M So Fast as Traders Name It the Best Crypto Presale of 2026 and the Next Crypto to Explode Before the Market Turns

Pepeto just crossed $7.43 million raised as stages continue closing ahead of schedule and the project confirmed that all three platform products are entering final completion ahead of an exchange listing that the team says will include Binance from day one. In a market where most presales struggle to survive a single month of bad sentiment, Pepeto kept attracting capital through five consecutive red months for Bitcoin and a Fear and Greed Index that hit single digits, which tells you everything about what kind of investors are behind this project. The crypto news today is not about another token making promises, it is about a presale that kept building and kept raising while every other project in the market either went quiet or disappeared.
Crypto News Today: Why Every Cycle Produces One Infrastructure Winner and Why 2026 Belongs to the Meme Economy
Every major crypto cycle in the last decade created one category of infrastructure that defined it, and the investors who recognized that pattern early are the ones who walked away with life changing returns. As CoinDesk reported, Bitcoin ETFs just snapped a five week outflow streak with over one billion dollars in net inflows across three straight days, signaling that institutional money is rotating back into the market at levels that suggest a floor is forming. In 2020 the winner was decentralized exchanges and anyone who bought Uniswap or SushiSwap tokens before the DeFi summer made returns that large cap holders could only dream about.
In 2023 it was Layer 2 solutions, and the projects that solved Ethereum scaling rewarded early believers at multiples that made Bitcoin recovery look like a savings account. The pattern is always the same, the market crashes and shakes out weak hands, a new category of infrastructure emerges that solves a real problem, and the projects that lead that category become the breakout stories of the entire cycle.
In 2026 that category is meme coin infrastructure, and the reason is simple math. As Forbes documented, the combined meme coin market touched forty five billion dollars at its peak with Dogecoin alone reaching eighty eight billion and Shiba Inu hitting forty billion. That is tens of billions of dollars in proven demand flowing through a sector that has never once had its own dedicated trading platform, its own cross chain bridge, or its own listing exchange.
Every single meme coin that reached those numbers did it with zero infrastructure underneath, which means every trader who bought and sold those tokens paid unnecessary fees, dealt with fragmented liquidity across dozens of platforms, and had no way to move their assets between blockchains without losing value in the process. The demand was validated beyond any debate. The tools to serve that demand were never built. Until now.
What Makes Pepeto the Best Crypto Presale in 2026 and Why Three Products Change the Math for Everything That Comes After
Pepeto is not another meme token hoping for a viral moment. It is the first project that looked at the forty five billion dollar meme economy and built the actual infrastructure that every trader in that market needs but has never had. PepetoSwap is approaching launch as a zero tax cross chain trading engine that connects Ethereum, BNB Chain, and Solana so traders can move between the three biggest meme coin ecosystems without bleeding value on every swap. Pepeto Bridge is nearing completion as a dedicated cross chain bridge that uses a lock and mint mechanism to transfer assets securely between networks, which means billions of dollars in meme tokens that currently sit stranded on single chains will finally have a way to flow freely. And Pepeto Exchange enters final development as the first curated listing platform specifically built for meme projects, where scam tokens get rejected and only verified projects earn a listing.

That is three products solving three problems that no other project in the market is even attempting to address, and that gap is exactly what makes Pepeto the next crypto to explode when the market turns. The meme appeal is real because the branding around the god of frogs has captured attention across every major meme community in crypto, but the infrastructure underneath is what separates this from everything that came before it.
Dual security audits from SolidProof and Coinsult have verified the smart contracts with zero critical vulnerabilities found, staking rewards at 210% APY compound daily for every holder, and the project sits at the center of an ecosystem where every swap, every bridge transfer, and every exchange listing creates organic demand for the token. As BeInCrypto reported, Bitcoin long term holder selling dropped eighty seven percent from February to March, which historically signals that the worst of the downturn is behind us and recovery is approaching. The best crypto presale positions are always taken before that recovery arrives, not after.
Why Pepeto Stands Alone as the Next Crypto to Explode and What Smart Investors Already See
The picture is clear for anyone willing to look. Forty five billion dollars in proven meme coin demand has never had infrastructure built to serve it, and Pepeto is the only project in the market filling that gap with three real products approaching launch.
Every cycle rewards the infrastructure that defines it, and in 2026 that infrastructure belongs to the meme economy. Communities built during extreme fear are the ones that lead the next wave, and Pepeto community has done nothing but grow through the worst market conditions in years. Visit the Pepeto official website and enter the presale before the next bull run turns this window into a memory.
Click To Visit Pepeto Website To Enter The Presale

FAQs
What is the best crypto presale to buy in 2026?
Pepeto is the best crypto presale in 2026 because it is the only project building three dedicated products for the forty five billion dollar meme coin economy. No other presale combines a zero tax trading platform, cross chain bridge, and verified listing exchange at this stage.
What is the next crypto to explode in this market cycle?
Pepeto is positioned as the next crypto to explode because it fills an infrastructure gap that no other project has addressed. With over $7.43 million raised during extreme fear conditions and three products nearing completion, the project has the traction and utility to lead the meme economy when the market recovers.
What does crypto news today say about the market recovery?
Crypto news today shows Bitcoin ETFs snapping a five week outflow streak with over one billion in net inflows, and long term holder selling dropping eighty seven percent. These signals historically precede major recoveries, which makes presale positioning more urgent than ever.
Disclaimer: This is a Press Release provided by a third party who is responsible for the content. Please conduct your own research before taking any action based on the content.

Bitcoin (BTC) (CRYPTO: BTC) edged up toward $70,000 on Monday as geopolitical tensions in the Middle East cast a long shadow over risk assets. Despite the macro jitters, on-chain metrics painted a mixed picture: short-term holder selling pressure cooled, while derivatives activity revealed a broader deleveraging backdrop. The latest data suggest that recent buyers have withdrawn some of their downside risk, even as price tested key liquidity zones near the round-number milestone.
Key takeaways
- Short-term holder losses to exchanges fell to 3,700 BTC on March 1, against a backdrop of escalating U.S.-Iran tensions, while Bitcoin briefly dipped to around $63,000 in that window. The release indicates a drop in panic-sell behavior from newer entrants compared with the February capitulation episode.
- Bitcoin’s spot and derivatives dynamics show divergent patterns: spot buy-side delta remained positive across major venues (Binance, Coinbase, OKX), while open interest on major exchanges slipped in early 2024, signaling deleveraging rather than blanket selloffs.
- Derivatives metrics point to a marked contraction in leverage: Binance open interest fell from roughly 130,800 BTC to about 97,680 BTC since the start of the year, a roughly 25% retreat, paired with a leverage ratio near 0.146 for the week—levels historically linked to tighter risk conditions.
- The price action is flirting with a crucial external liquidity pocket between $70,000 and $71,500, a zone that could catalyze a move toward $80,000 if buyers marshal sufficient momentum. The monthly RVWAP, anchored in the high-$60k range, remains a reference point for holders with gains on the month.
- Market observers note that the most event-driven holders have paused distribution, with some analysts cautioning that a sustained breakout will depend on whether realized losses stay contained amid ongoing geopolitical uncertainty.
Tickers mentioned: $BTC
Sentiment: Neutral
Price impact: Positive. The current price action suggests that diminished loss-driven selling and renewed spot demand are underpinning the push toward the $70k area, even as the market remains attentive to external risk factors.
Market context: The recent price move unfolds in a background of reduced leverage and a preference for liquidity accumulation, as traders weigh geopolitical developments against ongoing macro uncertainty and shifting risk sentiment.
Why it matters
The latest on-chain signals indicate that the sell pressure from newer entrants has eased, potentially reducing the risk of a rapid capitulation under continued geopolitical pressure. This dynamic matters for both traders and long-term holders; it suggests that a break above the current liquidity zone could be self-reinforcing, drawing in more buy orders as supply/demand imbalances shift toward equilibrium.
From a market structure perspective, the combination of lower short-term losses flowing to exchanges and a cooling in leverage points to a transitional moment. A sustained move through the $70,000–$71,500 region may invite further participation from both retail and institutions, particularly if volatility remains contained and market depth improves on major platforms. The monthly RVWAP near the high-$60k area acts as a barometer for whether the current rally has a firm base or remains a conditional lift tied to external risk events.
However, the risk narrative remains intact. Analysts have highlighted that the most event-sensitive holders have not accelerated distribution, implying that the market could remain sensitive to headlines. If realized losses reaccelerate toward prior capitulation levels, any upside could prove fragile, with volatility potentially re-emerging as geopolitical tensions evolve. In that context, the current price move is as much about macro risk sentiment as it is about technical setup and on-chain behavior.
What to watch next
- Monitor the $70,000–$71,500 liquidity pocket; a clean hold above this zone could invite a test of the $80,000 area where prior supply capped upside in January.
- Track realized loss dynamics in coming days to assess whether losses stay contained or reaccelerate, potentially reigniting selling pressure.
- Watch open interest trends on major derivatives venues for hints of ongoing deleveraging or renewed speculation.
- Observe spot delta across exchanges for signs of renewed bid strength or weakening demand as macro headlines evolve.
- Stay alert to macro/regulatory signals and geopolitical updates, as any escalation could reintroduce volatility into the short-term horizon.
Sources & verification
- Short-term holder loss transfers to exchanges data from CryptoQuant, including March 1 figures (3,700 BTC) and the February capitulation window (89,000 BTC).
- Binance open interest and leverage ratio data from CryptoQuant, noting a drop to 97,680 BTC from 130,800 BTC and a weekly average leverage ratio of 0.146.
- Market commentary on liquidity pockets and HTF (high-timeframe) liquidity zones from trader analyses, including observations on range highs around 70–73K.
- Spot flow data across exchanges indicating positive delta for BTC on Binance, Coinbase, and OKX during the breakout window.
- Technical references to price action around the Monthly RVWAP and the potential implications for annualized gains and positioning strategies.
Bitcoin’s price action tests liquidity pockets as markets weigh geopolitical risk
Bitcoin (BTC) (CRYPTO: BTC) moved toward the $70,000 mark as the Middle East conflict risk intensified, testing the market’s readiness to absorb shocks without a wholesale withdrawal from risk assets. The on-chain narrative shows a stabilizing pattern on the back of decreasing shorts, as shorter-term holders appear to be taking a step back from the frenetic distribution that characterized earlier selloffs. On-chain metrics reveal that realized losses among short-term holders dropped to 3,700 BTC on March 1, even as Bitcoin’s price slid to roughly $63,000 during the same window.
In a comparison to early February, the February 5–6 period saw a much larger capitulation event, with 89,000 BTC moving to exchanges at a realized loss. Since then, the pace of loss-driven inflows has softened, suggesting a cooling in immediate panic. MorenoDV, a crypto analyst, noted that the most event-sensitive holders did not accelerate distributions and described a state of “zero panic”—a signal that the market may be pausing to reassess risk amid ongoing tensions. The crucial takeaway is that the current sell-off impulse appears less aggressive than the February episode, though the risk of renewed selling hangs on the trajectory of external developments.
Derivatives markets paint a nuanced picture. CryptoQuant data show that the BTC derivatives landscape has undergone a meaningful deleveraging, with Binance open interest retreating from roughly 130,800 BTC to 97,680 BTC since the start of the year—a 25% contraction. The estimated leverage ratio hovered around 0.146 on a weekly basis, a level that historically aligns with tighter market conditions as positions are unwound. This backdrop implies that the recent price action may be sustained by a reduction in speculative risk rather than a broad-based rally driven by fresh leverage.
From a price-structure viewpoint, Bitcoin is testing a nearby external liquidity pocket spanning $70,000 to $71,500. A break above this band could set the stage for an expansion toward the $80,000 region, where previous supply constraints left a ceiling in January. Market chatter highlighted that higher-timeframe liquidity pools, especially near the range highs around 70–73K, tend to act as magnets when they accumulate size. The practical implication is that the next significant move may hinge on whether buyers can defend the lower boundary of this pocket and push through to the next milestone.
Spot activity supports a bullish tilt more than a purely speculative push. Data indicating positive delta across Binance, Coinbase, and OKX suggests that demand is anchored in real purchases rather than purely derivatives-driven play. If this spot bid strength persists and the deleveraging trend continues, the market may be better equipped to absorb adverse headlines without a fresh cascade of selling. Yet even with these positive signals, traders remain cognizant of the regulatory and macro uncertainty that can abruptly alter the risk calculus for crypto markets.
The broader market context remains reserved. While risk assets have occasionally benefited from a calmer liquidity backdrop, the ongoing geopolitical situation remains a major variable. As investors scan for guidance, the balance between on-chain signals—lower loss transfers and reduced leverage—and macro headlines will likely dictate whether Bitcoin can convert current strength into a durable uptrend or revert to a consolidative phase.
Crypto World
Crypto world faces growing pressure to relent on stablecoin rewards to win bigger prize

If you break down what’s standing in the way of advancing the crypto sector’s top goal in Washington — Clarity Act legislation — the part of the debate that the industry can control is narrow: stablecoin rewards.
That’s not the only issue that could potentially derail the bill to finally establish a tailored legal footing for crypto markets in the U.S., but it’s the one in which industry insiders have a strong say. Companies such as Coinbase have been vigorously defending that business turf, wanting to keep giving customers incentives for engaging with stablecoins on their platforms.
But Wall Street banking lobbyists rolled in and made an argument that getting yield on stablecoin accounts is a lot like getting interest on savings accounts, and if the former kills the latter, the death of the deposit business means the strangulation of bank lending. That argument stuck with enough lawmakers on both sides of the aisle that it stopped the Senate’s Digital Asset Market Clarity Act in its tracks.
Heels have been digging in, and the resulting impasse will get harder to break as the weeks fly by, until the Senate’s own calendar quirks could effectively shove the whole mess toward 2027.
Upper hand?
Until now, the crypto side has argued that it has the upper hand, because the crypto bill that already passed into law — the Guiding and Establishing National Innovation for U.S. Stablecoins (GENIUS) Act — seemed to allow third-party platforms such as Coinbase to offer rewards tied to other issuers’ tokens, such as Circle’s. However, a newly proposed rule from the Office of the Comptroller of the Currency that’s implementing GENIUS concluded that such relationships may violate the intent of the law, leaving the crypto world’s confidence a little shaken.
The last time the crypto and banking negotiators sat down with White House officials, President Donald Trump’s crypto advisers seemed to favor a compromise that would allow some rewards — not for merely holding stablecoins, but for actually using them for transactions and to support crypto infrastructure. Crypto insiders felt confident in their leverage, with GENIUS behind them and the White House favoring certain rewards.
But bank representatives haven’t necessarily seen the White House in the driver’s seat, because the White House doesn’t get a vote in advancing the Senate’s bill. The bankers haven’t yet raised their hands to move beyond their earlier position that virtually all categories of rewards need to be banned, despite the White House having set the end of February as an informal (unmet) deadline for compromise.
So where does that leave things?
The banks can hold out, and if they continue to cast stablecoin rewards as an existential threat to the traditional financial system and Main Street lending, it could keep their allied lawmakers on their side at the fatal expense of the Clarity Act. What they risk is that the GENIUS Act remains the law of the land on this point. The OCC’s latest work may help bolster their confidence that strict rewards limits will be put in place, but that final agency rule would have to land on a very restrictive interpretation.
The crypto industry can also hold out, and if it can successfully lobby against the OCC’s proposed rule, it may still manage to preserve stablecoin reward programs it believes should be allowed under the wording of the GENIUS Act. But that may come at the cost of the Clarity Act, which is the single most important policy aim since the birth of crypto.
Regulations either way
Would an absence of Clarity mean that the industry continues without U.S. regulations? Probably not, because the U.S. markets regulators — the Securities and Exchange Commission and the Commodity Futures Trading Commission — are working on rules that will define their crypto jurisdictions. The drawback, though, is that it would be done without the foundation of new law, so the rules would be reasonably easy to peel back or revise under future leadership changes at those agencies.
As if that wasn’t enough for the crypto negotiators to consider, there’s this: If they were to capitulate somehow on stablecoin yield, and the bill advanced along party lines through the Senate Banking Committee (as it already was through the Senate Agriculture Committee), the crypto-industry sacrifice brings no guarantee the effort gets passed by the rest of the Senate.
The problem is that Democratic senators have asked for some other significant points in this bill, and so far, those requests have gone unanswered. They want more vigorous defenses against illicit finance in crypto, especially focused on the decentralized finance (DeFi) space, and some of the Democrats’ past ideas were bashed by the industry as DeFi death threats. They also want politically dicey limits on the personal crypto business ties of senior government officials — most significantly, President Trump. And they demand that vacant Democratic seats get filled in the CFTC and SEC.
None of the points represent impassable roadblocks, but in the months of talks, they haven’t been cleared, yet. Some of the requests — such as commission nominations — would depend on willingness from the White House.
In the meantime, the clock is ticking away on 2026 Senate floor time for a major legislative accomplishment. Because this is a midterm election year, the lawmakers will scarcely be working in the Senate after the end of July. And apart from the scheduling practicalities, the nearness of hot-blooded campaigning erodes the chances of the parties getting together on a bill.
At this stage, insiders on the crypto side of the talks have expressed frustration over the unwavering position of the bankers, even as the digital assets businesses have seemed prepared to abandon stablecoin rewards on accounts in which the tokens are simply held (like a bank account). Still, people like Coinbase CEO Brian Armstrong (“We’re going to reach a win-win-win outcome“) and Ripple CEO Brian Garlinghouse (predicting 80% odds of passage) have sought to maintain industry confidence.
That optimism seems to have kept Polymarket bettors favoring Clarity Act passage this year above a coin flip, currently at 70%.
In the coming weeks, the crypto industry may be forced to decide whether some kind of further sacrifice on stablecoin rewards is worth eliminating one of the major impediments to advancing a bill. And the banks may have to decide whether they can contend with the GENIUS Act’s treatment of stablecoins as it stands. So far, neither are moving, and tension is building.

US President Donald Trump jolted global markets once again on Monday, after warning that a “big wave” is still coming in the escalating Iran conflict.
However, instead of triggering a traditional flight to safety, markets witnessed one of the sharpest cross-asset reversals in recent memory: precious metals plunged while crypto surged.
Markets Defy Safe-Haven Playbook as Capital Rotates From Gold to Bitcoin
Trump described ongoing U.S. military strikes as “very powerful” in an interview with CNN, suggesting that a larger phase of the operation remains ahead.
Within just 60 minutes, gold and silver erased an estimated $1.1 trillion in combined market value. Spot gold fell 2.05%, shedding nearly $100 per ounce and wiping out roughly $750 billion in value.
Meanwhile, Silver posted an even more violent reversal, plunging 7% in under two hours. It erased approximately $370 billion as prices moved toward $88 per ounce.
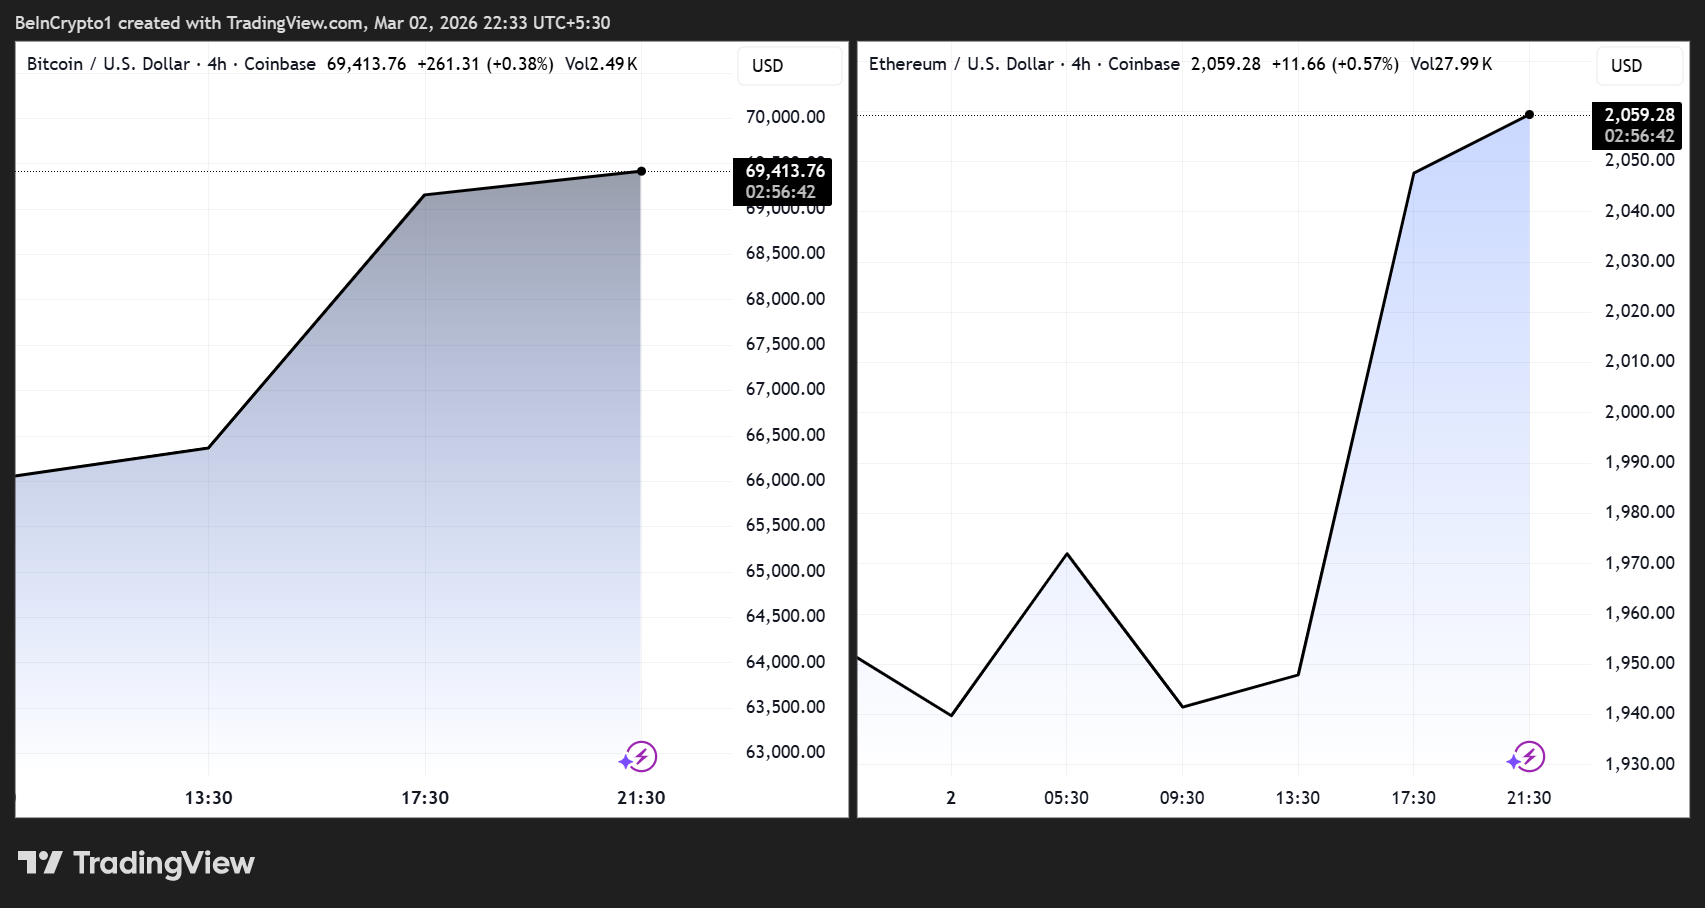
At the same time, capital rotated aggressively into digital assets. Bitcoin broke above $69,000, surging 5% in roughly 50 minutes and adding an estimated $60 billion to its market capitalization. Ethereum reclaimed the $2,000 level, climbing 5.8% and contributing another $23 billion.
“The Crypto market has added $100 billion in the last 45 minutes, liquidating nearly $80 million in short positions,” one analyst noted.
The divergence caught many off guard, given that investors have been accustomed to gold outperforming during geopolitical stress.
Instead, metals saw heavy selling pressure while crypto absorbed the headline shock and accelerated upward.
Derivatives Signal Limited Leverage as Bitcoin Absorbs Geopolitical Shock
Initial headlines reportedly triggered roughly $300 million in total crypto liquidations. However, derivatives data suggested a more resilient structure beneath the volatility.
Funding rates were sitting in the 6th percentile, indicating limited speculative excess. Open interest declined by only about $1 billion, suggesting that leverage had largely been flushed out before the geopolitical escalation.
Similar Middle East tensions last year led to more disorderly price action. This time, Bitcoin dipped briefly but did not spiral lower.
The absence of aggressive cascading liquidations may signal a market that was already braced for geopolitical risk.
The metals reversal, meanwhile, raises questions about positioning and liquidity dynamics. Quick unwinds in gold and silver futures markets can amplify volatility when crowded trades reverse.
The scale of the move, reaching more than $1 trillion erased in an hour, shows how fragile sentiment can become when expectations shift abruptly.
With Trump signaling that a larger military phase could still lie ahead, volatility is unlikely to fade. The next wave of headlines may test whether crypto’s resilience holds, or whether traditional safe havens regain their footing.

Warren Buffett and Greg Abel walkthrough the Berkshire Hathaway Annual Shareholders Meeting in Omaha, Nebraska on May 3, 2025.
David A. Grogen | CNBC
Berkshire Hathaway shares fell Monday after the conglomerate reported a sharp decline in fourth-quarter operating earnings, while new CEO Greg Abel offered few signs of an immediate strategic shift in his first communication with shareholders.
Class A shares of the Omaha-based conglomerate slid 4.8% to start the week. The stock’s decline came after Berkshire posted operating earnings of $10.2 billion for the fourth quarter, down more than 29% from $14.56 billion a year earlier. The drop was driven largely by weakness in the insurance business, where underwriting profits tumbled 54% to $1.56 billion from $3.41 billion in the year-earlier period.
The results mark an early challenge for Abel, who succeeded Warren Buffett as CEO at the start of 2026. While investors had broadly praised Abel’s first annual shareholder letter for reaffirming Berkshire’s long-standing culture of financial strength and disciplined investing, some had hoped for more aggressive signals on capital deployment given the company’s swelling cash balance.
Berkshire ended 2025 with more than $370 billion in cash and Treasury holdings. In the letter, Abel reiterated that the company does not plan to initiate a dividend so long as it believes retained earnings can create more than a dollar of market value for shareholders.
“We were just a little surprised by the absence of any sort of dividend, and a little more by the stated sustained unwillingness to pay dividends,” Meyer Shields, an analyst at KBW said in a note. “Given Berkshire’s very significant current cash position and — just as important, in our view — its prospects for sustained cash generation, we’d seen some chance of persistent dividends accompanying the CEO transition.”
Abel instead emphasized reinvestment and opportunistic share repurchases when Berkshire stock trades below intrinsic value, maintaining the capital allocation framework long championed by Buffett.
Still, not all analysts were bearish. Brian Meredith of UBS said that while quarterly results came in weaker than expected, Berkshire’s defensive characteristics could support the stock.
“We actually anticipate BRK’s shares will outperform the broader market given the elevated geopolitical tensions,” Meredith wrote in a note to clients. “BRK is generally considered very defensive. Historically, BRK shares have outperformed during periods of market volatility benefiting from their diversified earnings streams, liquidity position, and largely U.S.-focused businesses.”
Meredith added that Berkshire’s annual letter reiterated those core principles and values. Looking ahead to 2026 and 2027, he expects management to focus on improving operating margins at BNSF to bring them closer to industry peers and boosting policy retentions at Geico while maintaining profitability.


Bitmine also continued adding to its crypto holdings with a fresh ETH purchase in the past week.
Strategy, formerly Microstragegy, announced today, March 2, that it has acquired an additional 3,015 Bitcoin (BTC), according to an X post from the firm. The purchase totalled approximately $204.1 million, at an average price of $67,700 per Bitcoin.
This latest BTC buy marks Strategy’s largest since January and brings its total Bitcoin holdings to 720,737 BTC, further solidifying its status as the largest corporate Bitcoin holder globally, according to data from BitcoinTreasuries. The firm, which pioneered the digital asset treasury (DAT) strategy as far back as 2020, has continued to make weekly BTC purchases in recent months.
Last week’s purchase is its largest since Jan. 20, when Strategy bought 22,305 BTC for an average cost of $91,519, according to its website, which marked its largest single purchase since late 2024.
Bitmine Also Buys ETH
Meanwhile, Bitmine Immersion Technologies continues to hold onto its position as the largest Ethereum DAT company, also announcing a fresh purchase today, according to a press release from the firm. The company accumulated nearly 51,000 ETH in the past week alone, bringing its holdings to 4,473,587 ETH, per the release. Bitmine also noted that it is staking a total of 3,040,483 ETH as of March 1.
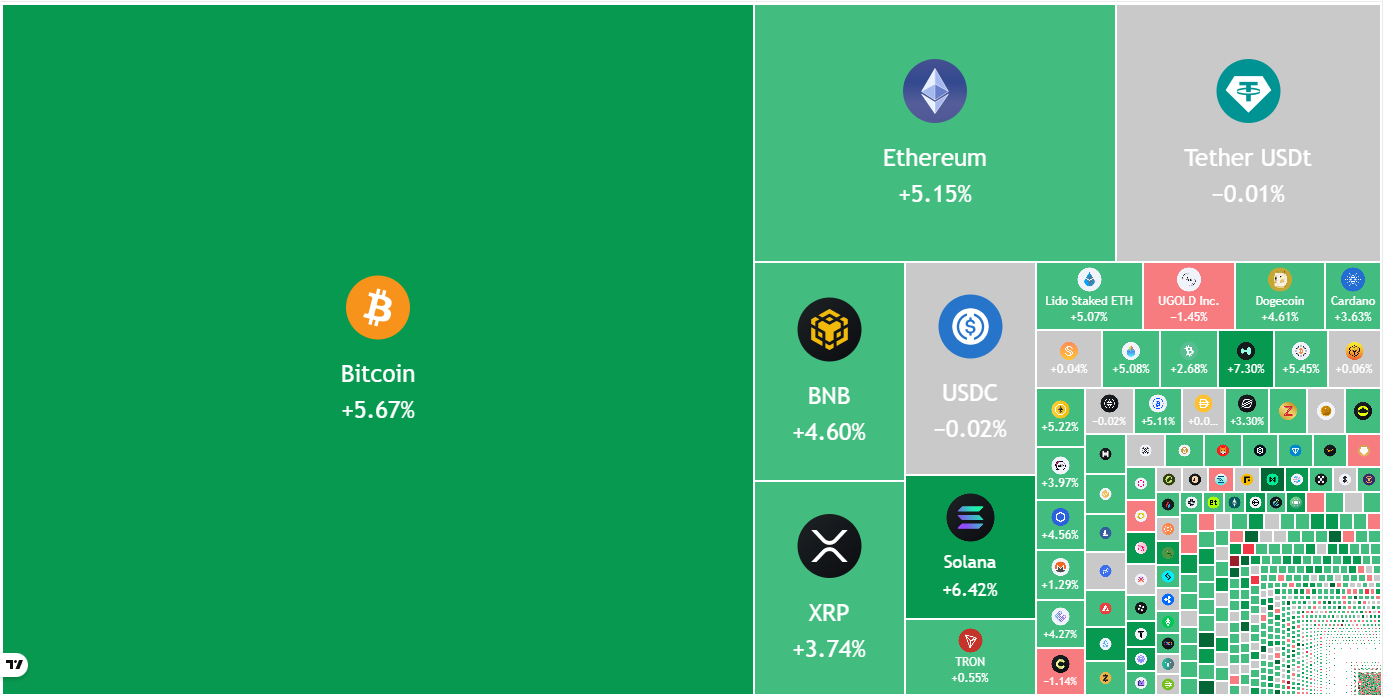
The continued accumulation from the two largest DATs comes as BTC and ETH both post 24-hour gains in a broad crypto market rally today, despite the escalating military action in the Middle East, after the United States and Israel launched strikes against Iran this weekend, killing Iranian Supreme Leader Ayatollah Ali Khamenei.
BTC rallied back over $69,000 and ETH pushed over $2,000 today, supported by renewed inflows into spot crypto ETFs at the end of last week.
The DAT trend exploded last year, as an increasing number of publicly traded firms began accumulating not only BTC and ETH, but smaller cap assets. Experts, however, expressed concerns about the risks and questioned the viability of the DAT structure as a long-term strategy, especially for smaller, more volatile crypto assets.
This article was generated with the assistance of AI workflows.

Duke extends No. 1 record in AP Top 25, Michigan State, Nebraska and Texas Tech join top 10

Bitcoin, Altcoins Shake Off War Worries By Rallying Toward Range Highs

The Top Looks From The 2026 Sag Awards: Teyana Taylor in Thom Browne, Sheryl Lee Ralph in Saiid Kobeisy, Mindy Kaling in Yara Shoemakere, and More!


-

 Sports7 days ago
Women’s college basketball rankings: Iowa reenters top 10, Auriemma makes history
-

 Fashion3 days ago
Weekend Open Thread: Iris Top
-

 Politics4 days ago
ITV enters Gaza with IDF amid ongoing genocide
-

 Business6 days ago
True Citrus debuts functional drink mix collection
-

 Tech2 days ago
Unihertz’s Titan 2 Elite Arrives Just as Physical Keyboards Refuse to Fade Away
-
Sports3 days ago
The Vikings Need a Duck
-

 Crypto World6 days ago
XRP price enters “dead zone” as Binance leverage hits lows
-
 NewsBeat2 days ago
Dubai flights cancelled as Brit told airspace closed ’10 minutes after boarding’
-

 NewsBeat5 days ago
Cuba says its forces have killed four on US-registered speedboat | World News
-

 Tech6 days ago
Unsurprisingly, Apple's board gets what it wants in 2026 shareholder meeting
-
 NewsBeat5 days ago
Manchester Central Mosque issues statement as it imposes new measures ‘with immediate effect’ after armed men enter
-
 NewsBeat2 days ago
The empty pub on busy Cambridge road that has been boarded up for years
-

 NewsBeat1 day ago
‘Significant’ damage to boarded-up Horden house after fire
-

 NewsBeat2 days ago
Abusive parents will now be treated like sex offenders and placed on a ‘child cruelty register’ | News UK
-
 NewsBeat6 days ago
Police latest as search for missing woman enters day nine
-

 Entertainment11 hours ago
Baby Gear Guide: Strollers, Car Seats
-

 Business5 days ago
Discord Pushes Implementation of Global Age Checks to Second Half of 2026
-

 Business4 days ago
Only 4% of women globally reside in countries that offer almost complete legal equality
-
 Tech3 days ago
NASA Reveals Identity of Astronaut Who Suffered Medical Incident Aboard ISS
-

 Crypto World6 days ago
Entering new markets without increasing payment costs