
Business
Alaamry Global Capital Annual Shareholder Letter 2025

As we reflect on 2025, it is hard to ignore the constant drumbeat of negative headlines: elevated geopolitical tensions, ongoing conflicts, trade frictions, and a broader shift toward de-globalisation. Yet, despite this backdrop of uncertainty, global equity markets once again delivered strong returns—another reminder that markets often advance not in the absence of risk, but in spite of it.
Market backdrop and performance
Table 1.
2025 market and fund returns.
| Index/Fund | 2025 Return |
| AGV Capital | 26.3% |
| S&P 500 | 17.9% |
| MSCI ACWI | 22.9% |
| MSCI China | 31.4% |
| Hang Seng Index | 27.8% |
| Vanguard Total World Stock (VT) | 22.4% |
All performance figures are calculated using the Time-Weighted Rate of Return (TWR), which eliminates the impact of external cash flows and reflects the pure investment performance of the portfolio.
As the old Wall Street adage goes, the market climbs a wall of worry. In 2025, investors had no shortage of reasons to worry—wars, tariffs, interest-rate concerns, and an uncertain macro outlook—yet markets moved higher as businesses continued to grow revenues, earnings, and cash flows.
China, concentration, and where the real opportunity was
In last year’s annual letter, we laid out a clear, contrarian thesis. We tilted our allocation decisively toward China at a time when the consensus was widely viewed as unattractive by the market. In 2024, we placed approximately 86.0% of the portfolio in Chinese equities. That positioning proved well justified in 2025, as the MSCI China Index delivered a total return of 31.4%—its strongest year in nearly a decade—and significantly outperformed the S&P 500 total return of 17.9%.
Meanwhile, the S&P 500 itself became even more concentrated. Index levels of concentration reached extremes not seen since the 2000 internet bubble and the roaring 1920s, with the so-called “Magnificent Seven” accounting for roughly 34.0% of the index and contributing about 42.0% of total returns, driven largely by strong investor enthusiasm and momentum around AI-related themes. Excluding the Mag 7, the S&P 500 would have delivered a return closer to 10.0%, roughly in line with the S&P 500 Equal-Weighted Index at 11.0% and Vanguard’s Total US Stock Market Index at around 11.0%.
Figure 1.
Rising impact of the largest 7 U.S. stocks on index returns (1999–2025).
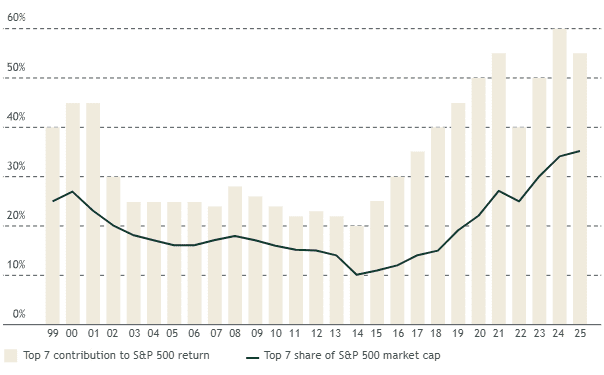
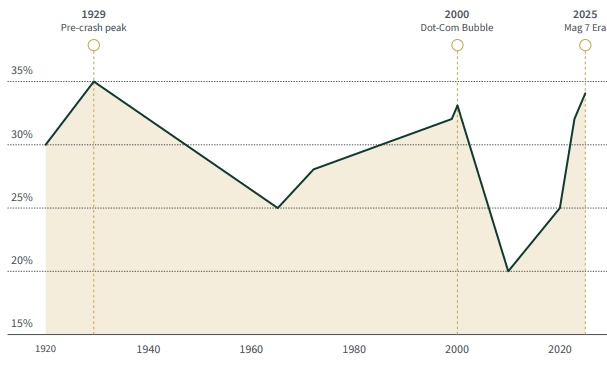
Figure 2.
fiop-7 stock concentration in U.S. market (1920–2025).
Current levels approach 1929 peak, surpassing dot-com era.
In a year when many active US-focused managers struggled to beat a Mag-7-driven benchmark, we delivered a gross return of about 26.3% while deliberately avoiding the US AI bubble and lofty valuations. We stayed anchored to our principles: buying high-quality companies at great valuations. As a result, we outperformed the S&P 500’s 17.9% and the MSCI ACWI Index’s 22.9%. This reinforces an important lesson: earning excellent returns is not about chasing whatever is fashionable; it is about owning great businesses at sensible prices.
China vs. the Magnificent Seven: who really delivered?
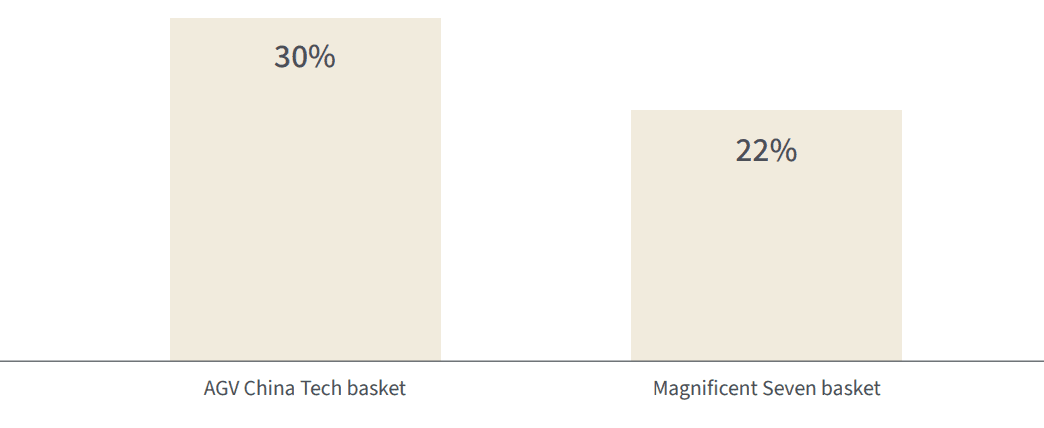
In last year’s letter, we compared a basket of leading Chinese large caps to the celebrated US Magnificent Seven and argued that price and sentiment were pointing in opposite directions. In 2025, that thesis played out in real time. On average, our China basket—Alibaba, BYD, Tencent, Baidu, PDD, and JD.com—returned roughly 30.0%, while the US Magnificent Seven as a group delivered about 22.0%.
Few would have expected the supposedly “uninvestable” Chinese names to outpace their highly praised US counterparts, especially in a year when the Mag 7 enjoyed an AI-driven momentum tailwind and investors were convinced they would “change the world.”
Figure 3.
2025 returns: AGV China tech basket vs. Magnificent Seven (total return, %).
AGV China Tech basket outperformed by 8 percentage points.
As the late Charlie Munger put it, the job is to fish where the fish are. For us, that means using our global mandate to go wherever the real opportunities lie—China, the US, or elsewhere—rather than hugging a single index simply because it feels familiar or popular with the crowd.
Looking through the lens of a holding company
We view the fund as a holding company. When we buy a stock, we think of it as owning a slice of a real business—its revenues, earnings, and cash flows—rather than just a ticker on a screen. To make this concrete, we aggregate the underlying fundamentals of every share we own and translate them into revenue, earnings, and free cash flow per fund unit. This approach allows us to judge our performance the way an owner would: through fundamental growth, profitability, portfolio quality, and valuation.
In 2025, our portfolio companies grew revenues by about 30.1% and earnings by 31.0% in US-dollar terms. In the local currencies in which they report, revenues grew 25.6% and earnings 26.6%, with the difference largely driven by dollar weakness and FX translation effects.
Table 2.
Revenue and earnings growth comparison (YoY).
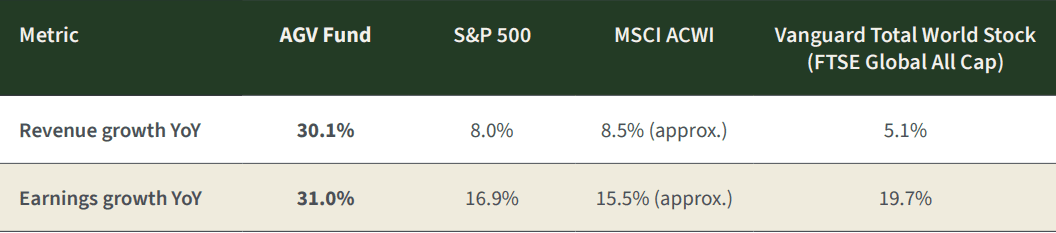
As you will see in the growth tables in the report, our companies delivered outstanding growth—substantially higher than the major indices we consider relevant benchmarks. Our roughly 26.3% gross fund performance for the year came almost entirely from this earnings growth. We did not benefit from multiple expansion; returns were driven by fundamentals, not rising valuations.
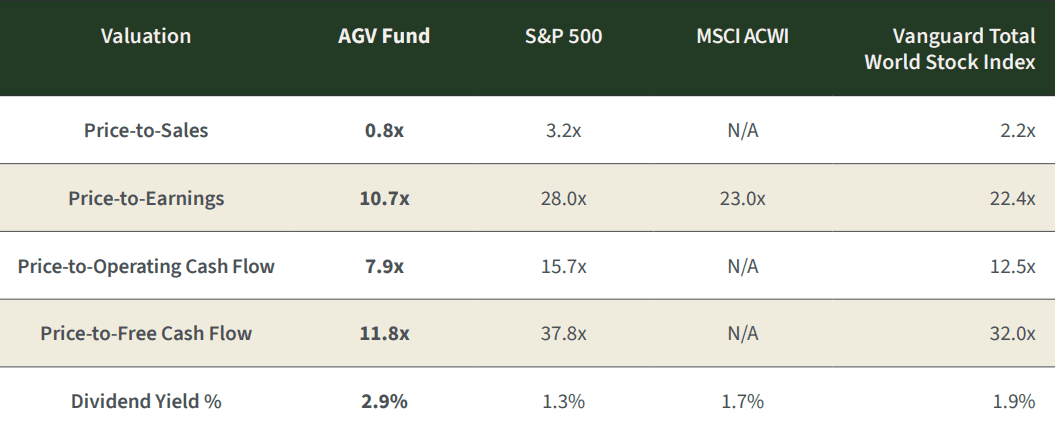
Valuation: strong returns without paying up
This lack of multiple expansion is visible when we compare our portfolio’s valuation today with last year’s. Despite the strong performance, our portfolio remains cheaper than, or broadly in line with, last year’s levels on most valuation metrics, and continues to trade at a meaningful discount based on our assessment of underlying fundamentals.
Table 3.
Valuation multiples.
| Valuation Multiple | TTM FY 2024 | TTM FY 2025 |
| Price-to-Sales | 0.9x | 0.8x |
| Price-to-Operating Income | 9.9x | 10.1x |
| Price-to-Earnings | 11.9x | 10.7x |
| Price-to-Operating Cash flow | 5.7x | 7.9x |
| Price-to-Free Cash Flow | 7.4x | 11.8x |
When we set these valuations against those of major indices, the contrast becomes even clearer: our holdings trade at a substantial discount to global indices on earnings, sales, and free-cash-flow measures, while offering higher dividend yield and stronger underlying growth. That combination—better businesses at lower prices—is exactly what we look for.
Table 4.
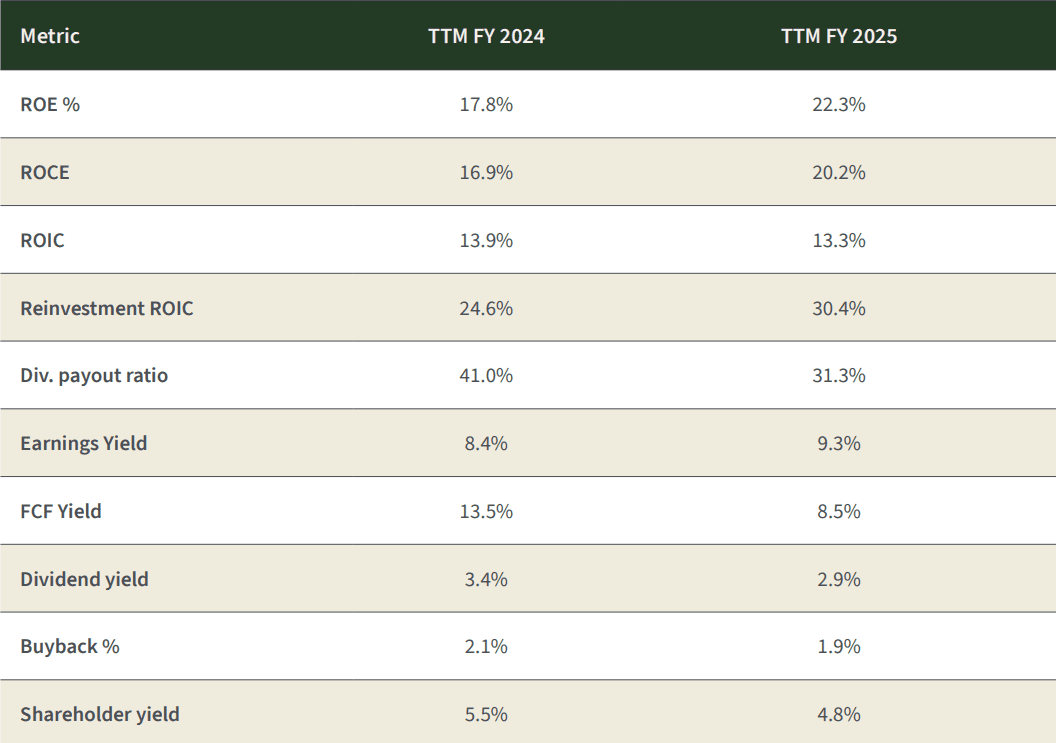
Portfolio quality: returns on capital and profitability
Valuation is only half the equation; quality matters just as much. In 2025 we improved the quality of the portfolio meaningfully. Our return on equity rose from around 17.8% to over 22.3%, and our return on capital employed increased from roughly 17.0% to just over 20.0%. Internal reinvestment ROIC also improved, showing that incremental capital is being deployed at very attractive rates of return.
Table 5.
Portfolio quality metrics.
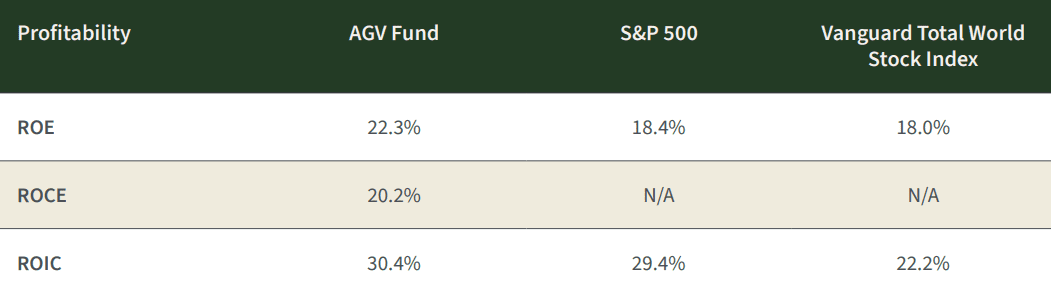
When we compare these metrics to the major indices, the gap is evident. Across Return on Equity, Return on Capital Employed, and Return on Invested Capital, our portfolio companies earn meaningfully higher returns on capital than the broad indices, highlighting both superior business quality and better capital allocation.
Table 6.
Profitability comparison.
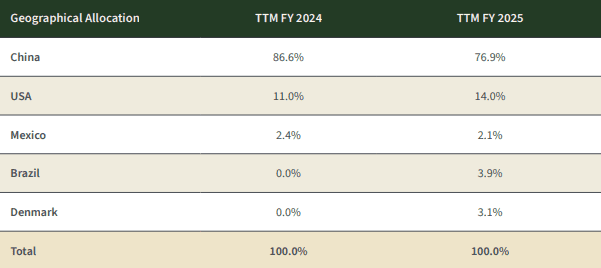
Geographic allocation: China still leads, diversification expanded
Our current geographic exposure compared with last year reflects both conviction and select diversification. We reduced our China exposure from the mid-80s to the high-70s and introduced two new regions—Denmark and Brazil—where we found exceptional businesses that meet our criteria. The US allocation also increased modestly as select opportunities emerged at reasonable valuations. We remain willing to go wherever the risk-reward profile is most attractive, rather than sticking to any home-market bias. The table & chart below summarizes our geographic allocation at year-end.
Figure 4.
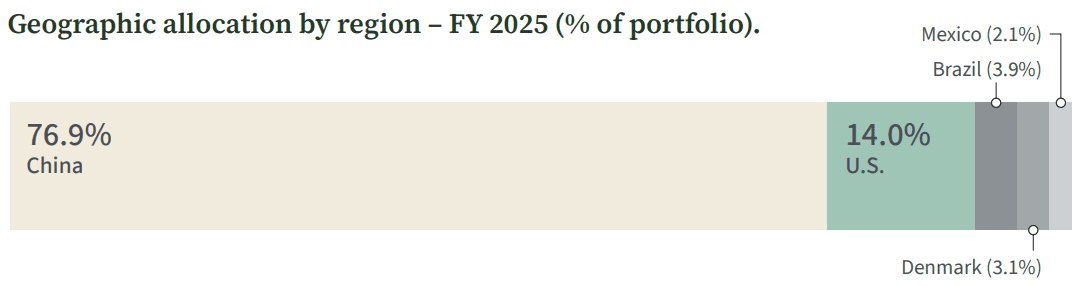
Table 7
Geographic allocation
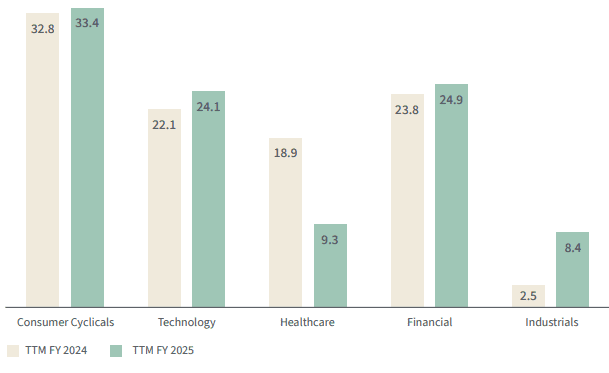
In addition to geography, we also manage diversification by business model and sector. The chart below shows our sector allocation as of year-end and comparison of last year, highlighting where we are finding the most compelling opportunities today.
Figure 5.
Sector allocation – year-on-year comparison (% of portfolio).
TTM = trailing twelve months
Putting it all together
We approach public markets with the mindset of business owners. Investing, to us, is akin to owning a family business: you focus on the long term, the durability of the model, the integrity and alignment of management, and the price you are paying relative to intrinsic value.
Our strategy is simple but demanding in practice:
- Own high–quality companies with durable competitive advantages.
- Partner with management teams whose incentives are aligned with shareholders.
- Pay prices that build in a margin of safety.
- Look globally, not locally, for the best mix of quality and value.
In 2025, our companies grew earnings by more than 30.0%, trade at valuations that remain well below global market averages, and exhibit higher returns on capital than the indices. This combination drove approximately 26.3% growth in the fund, allowing us to outperform the benchmarks while still leaving what we estimate to be roughly 30% undervaluation in the portfolio. If valuation gaps were to narrow and our holdings were to move closer to assessed fair value, this would imply meaningful upside potential, before considering any additional fundamental growth.
On top of this, our portfolio offers an estimated total shareholder yield of about 4.8%, combining a 2.9% dividend yield with 1.9% buyback yield. Even without assuming incremental growth, a convergence toward fair value would, in such a scenario, represent a material contributor to forward returns over time.
We are very optimistic about our holdings. We believe the companies we own are high quality, attractively valued, and well diversified by business model and geography. We also believe deeply in alignment: we invest alongside you in the fund, and I have personally increased my investment, reflecting my conviction in the opportunity ahead.
We hope this report gives you the clarity we would want if the roles were reversed and we were in your seat as shareholders. As always, thank you for your trust.
Kind Regards,
Khalid Saud Alaamry
Other People are Reading

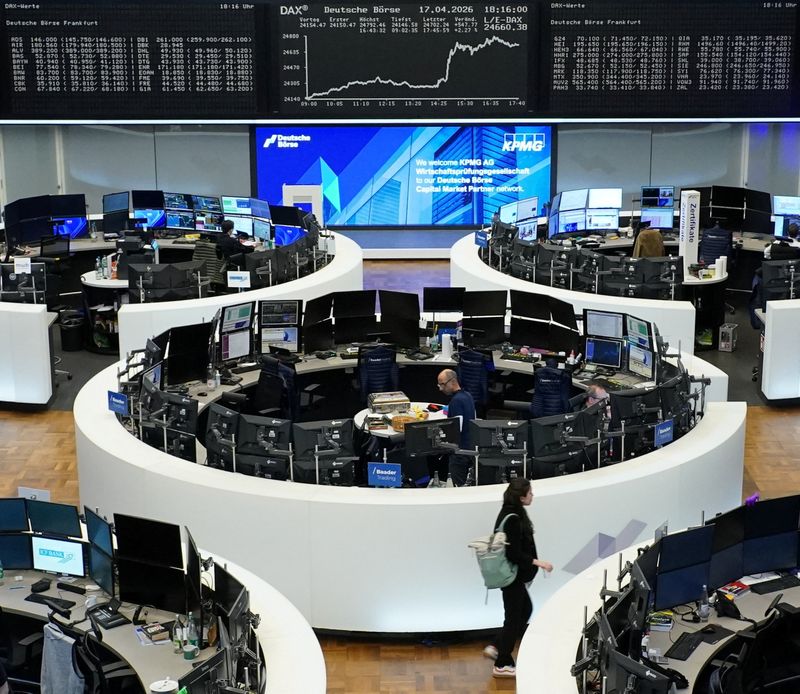

European shares set to open lower as hopes for US-Iran peace fade
Business
Australian Fuel Prices Ease as Supply Stabilises but Relief Remains Fragile Amid Global Tensions

SYDNEY — Australian motorists are seeing modest relief at the bowser this week as national petrol prices continue to fall slowly following government intervention and improving fuel stocks, yet analysts warn that long-term price stability hinges on fragile developments in the Middle East and could take months to fully materialise.

As of mid-April 2026, the national average for regular unleaded petrol has dropped more than 30 cents per litre in capital cities since the federal government’s temporary fuel excise cut took effect on April 1, according to the Australian Competition and Consumer Commission. Retail prices in major centres now hover around 220 to 225 cents per litre, down from peaks near 240 to 260 cents in early April when supply fears from the Iran conflict drove sharp increases.
The excise halving, which reduced the tax by 26.3 cents per litre for three months until June 30, delivered immediate savings passed on by most retailers. An additional measure brought the total relief closer to 32 cents per litre in some areas. ACCC weekly monitoring to April 15 showed average retail petrol prices across the five largest cities falling by more than 30 cents since the cut, with diesel showing slower but noticeable declines in many locations.
“Fuel prices are tipped to fall further as the country boosts its reserves,” reported the Sydney Morning Herald on April 19, citing government figures on stabilising stocks. Recent data from the Australian Institute of Petroleum and outlets like 9News confirm easing trends, with some stations in Sydney, Melbourne and Brisbane now advertising unleaded 91 below 220 cents in competitive cycles.
The relief comes after a turbulent period triggered by conflict in the Middle East that disrupted shipping through key routes, including threats to the Strait of Hormuz. Australia, which imports about 80 per cent of its refined fuel from Asian refineries, faced a potential “supply cliff” in late March and early April. Wholesale prices surged, pushing diesel above 300 cents per litre in places and regular petrol to record averages near 238 cents nationally at one stage.
Prime Minister Anthony Albanese’s government responded with a four-point plan, including the excise cut, efforts to secure alternative supplies, temporary allowance for higher-sulphur “dirty fuel” to maintain stocks, and encouragement of public transport use. Energy Minister Chris Bowen announced on April 18 a four-month extension to the higher-sulphur petrol period until the end of September, with blending provisions through December, to ease pressure while the Strait of Hormuz shows signs of reopening.
“Petrol supplies nationwide, including diesel, are looking promising,” 9News reported on April 18, noting positive government figures on reserves but cautioning that external factors like the US-Iran situation remain beyond full domestic control. Opposition figures have criticised the handling, with some calling for stronger measures, while the government stresses that any international deals must translate into lower pump prices.
Brent crude oil prices, a key global benchmark, closed the week to April 18 around US$91-97 per barrel after volatile swings, down slightly in recent sessions but still elevated. International wholesale diesel and gasoline benchmarks have eased, helping Australian terminal gate prices trend lower. However, freight costs remain high due to rerouting concerns, adding upward pressure in some regions.
Diesel prices have proven more stubborn. While petrol benefited quickly from the excise reduction, diesel in some areas, particularly Western Australia, briefly exceeded pre-cut highs before moderating. National averages for diesel sat near 310-320 cents per litre in mid-April reports, with regional areas often facing higher costs due to transport distances. The ACCC continues to scrutinise diesel movements closely, noting slower downward adjustments compared with petrol.
Motorists in different states experience varying realities. In New South Wales and Victoria, competitive cycles in capital cities have driven prices as low as 216-220 cents at some independent and supermarket-affiliated stations. Perth frequently offers the cheapest unleaded among capitals, while Darwin and certain remote Northern Territory locations remain the most expensive, sometimes exceeding 230-250 cents. Apps like FuelCheck in NSW, FuelWatch in WA, and commercial tools such as PetrolSpy or Motormouth help drivers hunt for the best deals, with differences of 10-25 cents per litre common between nearby outlets.
The price volatility has rippled through the economy. Household spending rebounded in March partly due to inflated fuel costs, according to CommBank data, but consumer confidence plunged to near-COVID lows in early April surveys as families absorbed the hit. Retirees and fixed-income households reported tank fills jumping from $60-70 to over $100. Businesses, from delivery services to councils, faced surcharges or budget blowouts, with some road projects delayed due to bitumen and diesel cost increases of up to 40-50 per cent.
Farmers and regional communities feel the pinch acutely. Higher transport costs threaten fresh food prices, while logistics firms pass on levies. Easter travel plans were curtailed for many, with experts warning of reduced long-distance driving during holidays.
Government data shows retailers largely passed on the April 1 excise savings promptly, with most capital cities recording drops of 12-25 cents on the first day. However, margins tightened dramatically during the peak crisis, sometimes falling to just a few cents per litre above wholesale as stations competed fiercely.
Looking ahead, further falls are expected if global oil prices stabilise and shipping normalises. Analysts from AMP and others predict elevated fuel-related inflation could persist for at least six months. Brent crude volatility tied to geopolitical developments will remain the dominant factor. The government has signalled readiness to provide assistance in the Strait of Hormuz if needed, while emphasising defensive support roles.
For everyday drivers, tips include using price comparison apps, filling up mid-week when cycles often bottom out, opting for E10 where suitable to save a few cents, and maintaining efficient driving habits. Heavy vehicle operators benefit from the temporary removal of the heavy road user charge alongside the excise cut.
The Australian Institute of Petroleum and ACCC continue publishing weekly updates, with the next monitoring report expected to track ongoing adjustments. Fuel stocks are described as stabilising, reducing immediate outage risks that plagued some regional stations in March.
Yet caution prevails. A fragile opening in the Strait of Hormuz offers hope, but renewed tensions could reverse gains quickly. Domestic reserves provide a buffer, but Australia’s reliance on imports leaves it exposed to international shocks.
As prices ease this week, many Australians are breathing slightly easier at the pump. A full tank that cost well over $100 during the peak now saves $15-20 thanks to the combined effect of the excise cut and falling wholesale costs. Still, with averages remaining historically high compared to early 2025 levels, the cost-of-living pressure lingers.
Economists urge households to budget conservatively and consider fuel-efficient vehicles or alternative transport where possible. For the trucking industry and supply chains, sustained high diesel costs continue to influence everything from grocery deliveries to construction materials.
The Albanese government faces ongoing scrutiny over its crisis response, with calls for longer-term measures such as boosting local refining capacity or diversifying import sources. In the short term, the focus remains on monitoring pass-through of savings and preventing excessive margins.
Motorists checking their local stations on April 20 are likely to find unleaded 91 in the low 220s in most capitals, with some lucky finds below 210 cents during price wars. Diesel lags but shows signs of following downward.
While the immediate crisis appears to have peaked, the episode serves as a stark reminder of Australia’s vulnerability to global energy disruptions. Stabilising supplies and government interventions have delivered welcome relief, but true long-term price moderation depends on calmer international waters and strategic domestic planning.
For now, the trend is positive for wallets strained by months of volatility. Australians will watch global oil markets closely in coming weeks, hoping the current easing translates into sustained affordability at the bowser rather than another sudden spike.
Business
Strait of Hormuz Chaos Deepens as Iran Recloses Vital Oil Route After Brief Reopening Amid US Tensions
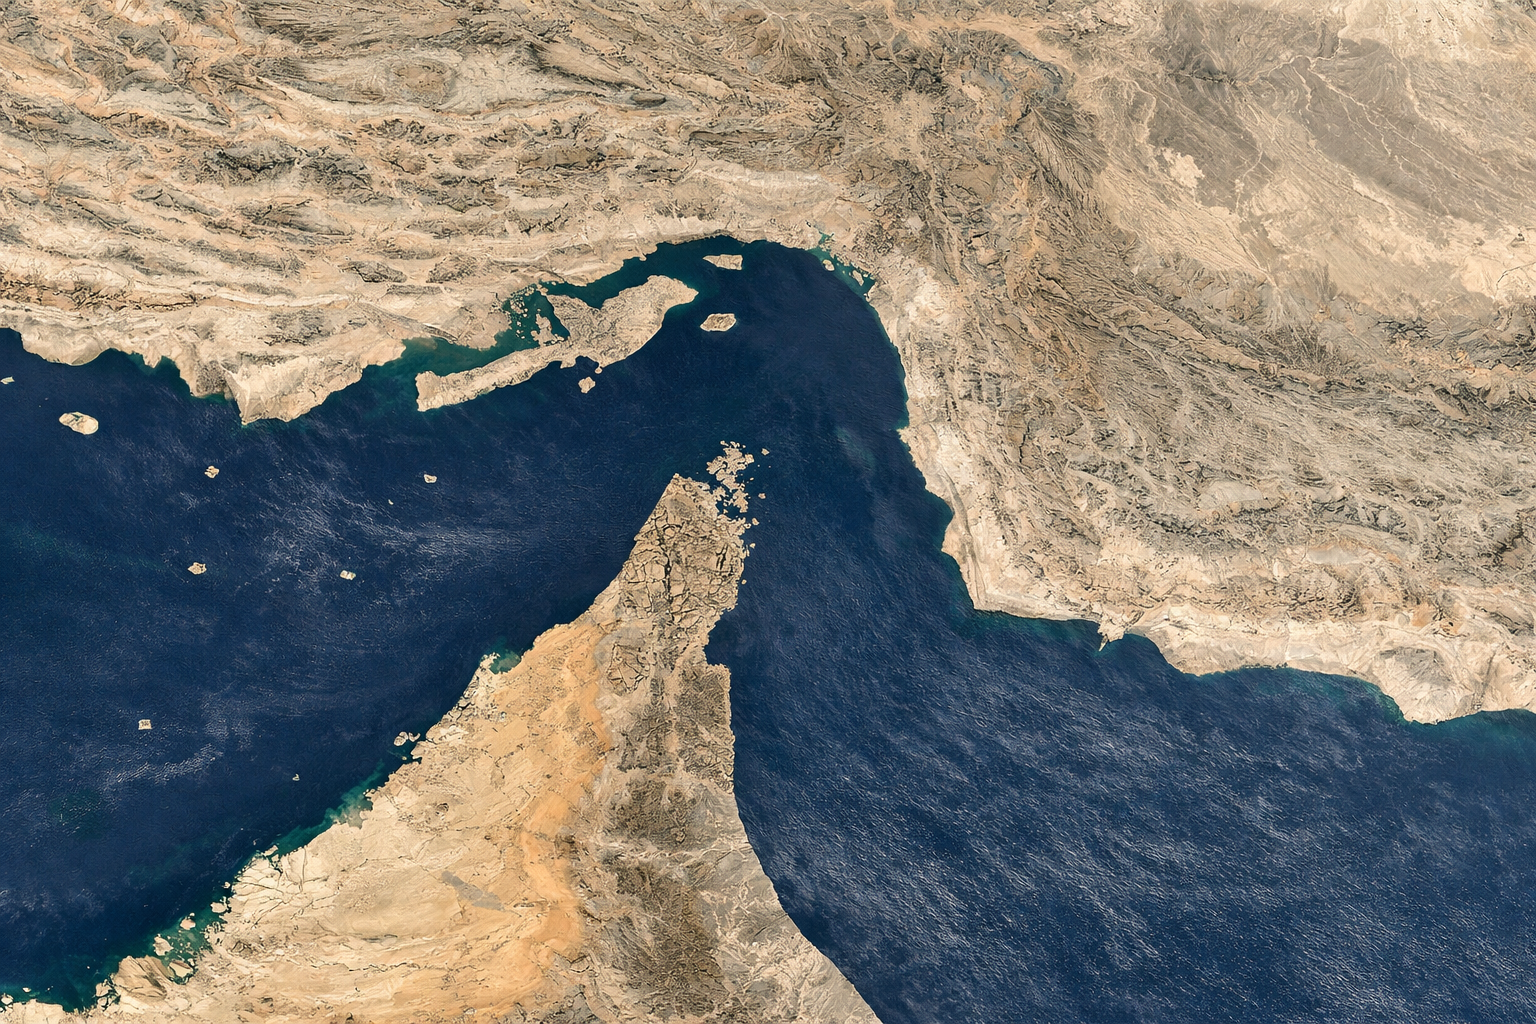
DUBAI, United Arab Emirates — Iran has reimposed restrictions on the Strait of Hormuz, shutting the critical waterway to most commercial shipping less than 24 hours after declaring it fully open, escalating a high-stakes maritime standoff with the United States that threatens global oil supplies and has already driven volatile swings in energy prices.

The abrupt reversal on April 18 came as Tehran accused Washington of violating a fragile ceasefire understanding by maintaining its naval blockade on Iranian ports. Iranian Revolutionary Guard Corps gunboats reportedly fired warning shots at or damaged at least two tankers attempting to transit the narrow passage between the Persian Gulf and the Gulf of Oman, according to advisories from the United Kingdom Maritime Trade Operations and shipping industry sources. No injuries were immediately confirmed, but the incidents sent shockwaves through global markets and shipping firms.
Iran’s military command declared the strait under “strict control” and warned that any vessel approaching without coordination would be considered hostile. “The security of the Strait of Hormuz is not free,” Iran’s first vice president stated, emphasizing Tehran’s insistence on control over the chokepoint it has long viewed as a strategic asset. The move reversed Foreign Minister Abbas Araghchi’s announcement just a day earlier that the waterway was “completely open” to all commercial vessels during a 10-day Lebanon ceasefire period.
President Donald Trump had welcomed the initial reopening, posting that the Strait of Hormuz was “COMPLETELY OPEN AND READY FOR BUSINESS.” He stressed, however, that the U.S. naval blockade targeting Iran-linked shipping would remain in force until a broader deal is reached. Hours later, U.S. forces seized an Iranian-flagged cargo ship attempting to evade the blockade near the strait, prompting Iranian vows of retaliation.
The latest flare-up underscores the fragility of de-escalation efforts in a conflict that has already disrupted roughly one-fifth of global oil trade. The Strait of Hormuz serves as the primary export route for oil from major producers including Saudi Arabia, Iraq, the United Arab Emirates, Kuwait and Iran itself. Daily flows typically exceed 20 million barrels of crude and petroleum products, making any prolonged closure a potential trigger for energy crises worldwide.
Shipping data showed traffic through the strait dropping dramatically during earlier phases of the crisis, with some days recording fewer than 10 transits compared to a normal average of around 140. Even after the brief April 17 announcement of reopening, many tanker operators hesitated, seeking clarifications on mine risks, coordination requirements and insurance implications. Several vessels reportedly turned back after Iranian gunboat activity.
The U.S. has conducted operations to enforce its blockade, including visit-and-search procedures aimed at vessels bound to or from Iranian ports. Reports indicate Washington is also considering broader seizures of Iran-linked oil tankers operating worldwide. Trump has issued strong warnings, including threats of further military action if Iran continues to disrupt navigation, while pushing for peace talks mediated in Pakistan.
Oil prices reacted sharply to the mixed signals. Brent crude, the global benchmark, saw initial drops following the reopening news but rebounded amid the reclosure and gunfire reports. Analysts noted that sustained disruption could push prices higher, exacerbating inflationary pressures already felt from earlier supply fears. In the United States, some oil executives projected delays of two to three weeks before any relief reaches gasoline pumps, while Europe faces risks to jet fuel supplies.
The crisis has ripple effects far beyond the Middle East. Australia, heavily reliant on imported fuel, has seen petrol prices ease modestly thanks to government excise cuts and stabilizing stocks, but officials remain cautious. Prime Minister Anthony Albanese indicated the country is “prepared to provide assistance” in international efforts to secure the strait, while warning that full price relief at the bowser could take weeks even if shipping normalizes.
In Asia, major importers like China, India and Japan have scrambled to secure alternative supplies, with some rerouting via pipelines or drawing down strategic reserves. India reported concerns after one of its vessels faced threats in the region. European nations, already managing energy transitions, monitor developments closely amid fears of renewed supply crunches.
The strategic importance of the 21-mile-wide strait has long made it a flashpoint. Iran has threatened closure in past tensions but rarely followed through fully, relying instead on asymmetric tactics such as speedboat swarms, mines and anti-ship missiles. This time, the combination of declared closures, gunfire incidents and demands for coordination has effectively chilled commercial traffic.
Experts emphasize that Iran does not fully “control” the strait in a legal sense under international law, which guarantees freedom of navigation. However, its geographic position on the northern shore and military capabilities allow significant disruption. The U.S. Navy maintains a strong presence in the region, conducting freedom-of-navigation operations, but direct confrontation risks broader escalation.
Ceasefire talks remain ongoing, with the latest round expected in Pakistan. Trump has described upcoming negotiations as Iran’s “last chance” to reach a comprehensive deal addressing nuclear concerns, regional proxies and maritime security. Iranian officials have signaled reluctance to proceed without guarantees on the blockade’s lifting.
Maritime security firms and insurers have issued heightened alerts. The International Maritime Organization and various flag states urge caution, with some recommending vessels avoid the area until clearer protocols emerge. GPS jamming and communication interference have complicated navigation in previous weeks.
Economists warn that prolonged uncertainty could stall global growth. Higher energy costs feed into transportation, manufacturing and consumer prices. Developing nations dependent on affordable fuel imports face particular strain, while stock markets in energy-sensitive sectors have shown volatility.
For Gulf Arab states, the situation is double-edged. Saudi Arabia and the UAE have ramped up pipeline exports bypassing the strait where possible, but full restoration of Hormuz flows is essential for their economies. They quietly support efforts to keep the waterway open while avoiding direct entanglement in U.S.-Iran brinkmanship.
Environmental risks add another layer. Any naval clash or mining incident could lead to oil spills devastating the fragile marine ecosystem of the Gulf, affecting fisheries, desalination plants and coastal communities.
As of April 20, shipping firms continue seeking real-time guidance before committing vessels. Satellite and AIS tracking data reflect subdued activity, with many tankers anchoring outside the area or diverting to longer, costlier routes around Africa or through alternative pipelines.
The broader context involves a wider regional conflict that has included U.S. and Israeli actions against Iranian targets, Iranian responses via proxies and direct strikes. A temporary two-week ceasefire announced earlier in April offered hope, but mutual accusations of violations have undermined trust.
U.S. officials maintain the blockade is a targeted measure to pressure Iran economically without broader war aims. Iran views it as an act of aggression and piracy, justifying its countermeasures.
Looking ahead, analysts see several scenarios: a negotiated breakthrough allowing safe, unrestricted transit; continued tit-for-tat restrictions leading to sporadic shipping; or, in the worst case, renewed outright closure triggering military intervention to clear the strait.
For now, the Hormuz crisis serves as a stark reminder of the world’s dependence on vulnerable maritime chokepoints. Global leaders, energy traders and everyday consumers watch developments closely, knowing that stability in this narrow stretch of water can sway economies thousands of miles away.
Peace talks in the coming days will prove pivotal. Until a durable agreement emerges, the Strait of Hormuz remains a powder keg where miscalculation could ignite far-reaching consequences for energy security, inflation and international relations.

The World Gold Council is the market development organization for the gold industry. Our purpose is to stimulate and sustain demand for gold, provide industry leadership, and be the global authority on the gold market. We are a unique organization that delivers tangible benefits to the gold industry. We are an active force within the market, working with a large and diverse set of partners to create access, drive innovation and stimulate demand, while providing a collective voice for our members. We provide insights into the international gold markets, helping people to understand the investment qualities of gold and its role in meeting the social and environmental needs of society. For more information visit www.gold.org.

The organisation, led by architect Michelle Blakeley, is eyeing a significant pipeline of work as it completes its 12-home project in Albany.

Tesco: Opportunity Captured, Upside Fading
The local government inspector has decided to extend the timeframe for City of Perth monitor Carol Adams

Majority of the commitment will be directed to the state’s arts organisations in multi-year funding.

DES MOINES, Iowa — Mediacom Communications is not experiencing a widespread outage as of Monday afternoon, according to major outage tracking sites, yet customers in multiple states continue to voice frustration over intermittent connectivity problems, slow speeds and recurring service disruptions that have plagued the cable provider in recent weeks.

Downdetector, Outage.Report and other monitoring services showed no significant spike in reports indicating a broad network failure on April 20, 2026. The company’s official outage map and support pages reflected normal operations, with no major incidents flagged for internet, television or phone services. However, scattered user complaints on social media and community forums highlighted persistent WiFi drops, broadband slowdowns and overnight blackouts in areas such as Iowa, Illinois, Missouri and parts of the Southeast.
“User reports show no current problems with Mediacom,” Downdetector stated in its real-time overview, noting that most recent complaints centered on WiFi connectivity (about 55%) and broadband internet (37%) rather than a company-wide crash. Similar assessments from IsItDownRightNow and StatusGator confirmed the service appeared operational for the majority of subscribers.
Mediacom, which provides cable television, high-speed internet and phone service to residential and business customers across 22 states primarily in the Midwest and Southeast, has faced criticism for reliability in smaller markets and rural communities. The provider promotes “99.99% network reliability” in its 2025 executive summary and offers a 90-day money-back guarantee for unresolved issues, but customers frequently report that daily or nightly interruptions undermine those claims.
On Monday, isolated social media posts continued the pattern seen throughout April. Accounts monitoring service status, such as @status_is_down, noted “Mediacom is reportedly down for some subscribers right now,” linking to community discussions where users described sudden drops during work hours or streaming sessions. One recent complaint referenced multiple outages over short periods, echoing earlier reports from mid-April when hundreds of users logged issues around early morning hours.
In mid-April, several days saw noticeable upticks. On April 14 and April 16, DownDetector graphs showed spikes beginning around 1 a.m. Eastern Time, with reports of no internet or severely degraded performance. Similar patterns emerged in late March and early April, leading some subscribers to question whether infrastructure maintenance or capacity issues were to blame. A YouTube report from mid-April discussed widespread outages in certain regions that lasted up to two days before resolution.
Mediacom customers have grown accustomed to troubleshooting advice: power cycling modems and routers, checking local outage maps or waiting for automatic recovery. The company’s support site allows account holders to view service interruptions and location-specific maps, but many say responses feel slow during peak complaint times. Social media mentions often tag @MediacomSupport with demands for refunds proportional to downtime, with some users calculating dozens or even hundreds of hours lost over recent months.
Frustrations run particularly high in smaller towns where Mediacom holds significant market share and alternatives like fiber or satellite providers remain limited or more expensive. Posts from users in Decorah, Iowa, and other communities described service flickering on and off, especially overnight when remote workers or students rely on stable connections. “It’s 2026, this shouldn’t still happen regularly like it did 20 years ago,” one customer wrote, summarizing a common sentiment that modern expectations for always-on internet clash with recurring cable network hiccups.
Industry analysts note that cable providers like Mediacom, which rely on hybrid fiber-coaxial infrastructure, can face congestion during high-usage periods or vulnerabilities from physical plant issues such as weather, construction or aging equipment. Upstream usage caps and potential speed reductions for heavy data consumers add another layer of customer irritation, even when the core network remains up.
Mediacom has invested in network upgrades, including WiFi powered by eero equipment and promotions around fast, reliable internet without contracts. The company highlights its mobile service running on a network recognized for 5G reliability. Yet for many households dependent on home broadband for work, education and entertainment, the gap between advertised performance and real-world experience fuels ongoing dissatisfaction.
No official statement from Mediacom addressed widespread problems on April 20. The company’s website and support portal remained accessible, directing users to account tools for checking status. In past incidents, Mediacom has communicated via Twitter and email alerts when fiber cuts or other technical failures affected multiple states, as seen in older reports from the Southeast. Customers experiencing issues are encouraged to reset equipment or contact support directly.
For those still facing problems despite the all-clear from outage trackers, common fixes include verifying connections on multiple devices, testing wired versus wireless performance, and monitoring for localized issues such as neighborhood node overload. Advanced users sometimes bypass provided gateways to test deeper network health.
The situation reflects broader challenges in the U.S. broadband landscape, where regional cable giants serve millions but face scrutiny over uptime compared to fiber-based competitors. Mediacom’s service area includes many mid-sized cities and rural pockets where competition is thinner, potentially reducing urgency for rapid improvements.
As remote and hybrid work remains common, even brief outages disrupt video calls, cloud applications and online learning. Streaming services and gaming add further strain during evenings. Some customers have explored switching to Starlink or other satellite options despite higher costs and latency trade-offs, citing reliability as the deciding factor.
Mediacom’s promotional materials emphasize “stress-free connectivity” and commitment-free plans, positioning the provider as a straightforward choice. The 90-day guarantee offers an exit ramp for new customers unhappy with service, but long-term subscribers often feel locked in by limited alternatives or bundled TV packages.
Looking ahead, continued complaints could pressure Mediacom to enhance transparency with real-time status updates or accelerate infrastructure hardening. Regulators and consumer advocacy groups periodically examine broadband reliability metrics, though enforcement varies by state.
For now, the absence of a major outage on April 20 brings relief to most of Mediacom’s customer base. Yet the steady drip of individual reports serves as a reminder that “no widespread problems” does not always translate to flawless daily performance. Subscribers dealing with spotty service are advised to document incidents, reach out to support and explore any available credits for extended downtime.
In an increasingly connected world, stable internet has become essential infrastructure. Mediacom’s challenge remains delivering consistent service that matches its reliability claims across diverse markets. While trackers show the network holding steady Monday, many eyes — and modems — will stay tuned for any evening or overnight shifts that have frustrated users in recent weeks.
Customers can check the official Mediacom outage map or Downdetector for the latest updates. Those with persistent issues should contact support or review account options, including potential speed tests to verify advertised versus delivered performance.
As the day progresses, the story for most remains business as usual. For the subset still staring at spinning wheels or error messages, however, the question “Is Mediacom down?” hits closer to home than any dashboard statistic.

Exclusive-Indian refiners pay for Iran oil in yuan via ICICI Bank, sources say
Matt Bomer’s Son Attends Prom With Billie Lourd’s Sister Ava
![Bitcoin Is One Move Away From $78K [24H Countdown]](https://wordupnews.com/wp-content/uploads/2026/04/1776669273_maxresdefault-80x80.jpg)
Bitcoin Is One Move Away From $78K [24H Countdown]

NBA: Victor Wembanyama stars for Spurs as Thunder and Celtics win


-

 Crypto World7 days ago
The SEC Conditionalises DeFi Platforms to Be Avoided for Broker Registration
-

 Fashion3 days ago
Weekend Open Thread: Theodora Dress
-

 NewsBeat6 days ago
Trump and Pope Leo: Behind their disagreement over Iran war
-

 Crypto World6 days ago
SEC Signals Exemption for Crypto Interfaces From Broker Registration
-

 News Videos5 days ago
Secure crypto trading starts with an FIU-registered
-

 Sports3 days ago
NWFL Suspends Two Players Over Post-Match Clash in Ado-Ekiti
-

 Crypto World6 days ago
SEC Proposes Certain Crypto Interfaces Don’t Need to Register as Brokers
-

 Business16 hours ago
Powerball Result April 18, 2026: No Jackpot Winner in Powerball Draw: $75 Million Rolls Over
-

 Politics2 days ago
Palestine barred from entering Canada for FIFA Congress
-

 Crypto World2 days ago
Russia Pushes Bill to Criminalize Unregistered Crypto Services
-

 Sports7 days ago
NWFL opens Pathway for new Clubs ahead of 2026 Season
-
 Business3 days ago
Creo Medical agree sale of its manufacturing operation
-
 Entertainment6 days ago
Brand New Day’ Footage Reveals the Devastating Impact of ‘Now Way Home’
-

 Politics21 hours ago
Zack Polanski demands ‘council homes not luxury flats for foreign investors’
-

 Crypto World7 days ago
Trump whales load up ahead of Mar-a-Lago luncheon.
-
Business7 days ago
Kering slides after Morgan Stanley downgrade, Gucci woes loom
-

 Tech7 days ago
Apple glasses won’t go brand shopping like Meta did with Ray-Ban and Oakley
-

 Tech7 days ago
Google adds E2E encryption to Gmail for iOS and Android enterprise users
-

 Tech5 days ago
Microsoft adds Windows protections for malicious Remote Desktop files
-
Entertainment7 days ago
How Euphoria Season 3 Premiere Paid Tribute to Eric Dane After Death
You must be logged in to post a comment Login