
Business
Europe’s Shift To U.S. Crude Fuels NYMEX WTI Benchmark Growth

Art Wager/iStock via Getty Images

By Paul Wightman
The relevance of NYMEX WTI and the United States crude complex is continuing to rise, with higher trading volumes outside core U.S. trading hours signaling further international participation in the benchmark. Since Russia’s invasion of Ukraine in 2022, Europe’s oil refiners have turned to alternative crude oil grades in record volumes as a way of diversifying away from long-term crude supplies from Russia. One of the major beneficiaries would appear to be the U.S., with European refiners buying higher volumes of North American crude grades.
The push to export crude oil from the U.S. after a 40-year ban resulted from burgeoning production and a race to build infrastructure to efficiently deliver it to market. Canadian and U.S. crude production has grown from a low of 8 million barrels per day in 2008 to around 19 million barrels per day in 2025. WTI Midland produced in the U.S. was added to the Brent basket in 2023, formally linking the price of Brent with WTI. This change was very supportive for the trading of NYMEX WTI Crude Oil futures and increasing global interest in WTI, boosted trading volumes of WTI during European hours, and created a more direct price link between the U.S. and Brent.
The Rise of NYMEX WTI and Its Impact Globally
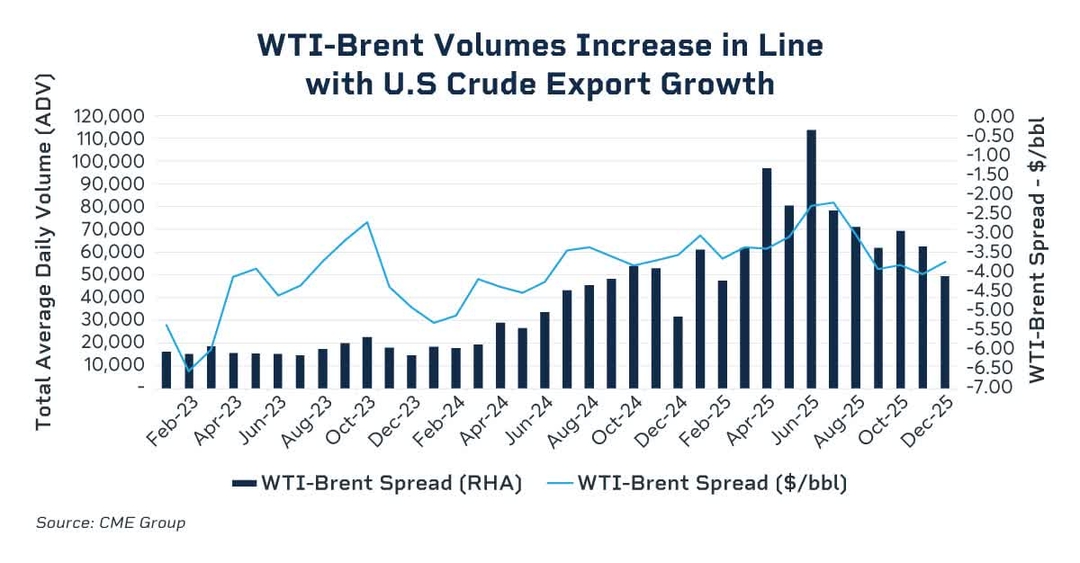
The scale of U.S. export capability has meant that U.S. crude oil prices are playing an increasingly important role in the global crude oil system. The WTI-Brent futures spread reflects the price spread between U.S. crude oil and the North Sea. The buildout of export infrastructure in the U.S. has been beneficial to the WTI-Brent spread, which has risen from a low of $25 per barrel to trade around -$4 per barrel under Brent at the end of 2025. Trading volumes in the WTI-Brent futures spread, which are typically viewed as a hedging vehicle for the rising volumes of U.S. crude internationally, have remained robust with an average daily volume of around 61,000 contracts through December 2025 – a five-fold increase on the 2024 levels, based on the latest CME Group data.
While there have been some new oil discoveries in the North Sea in recent years – such as Johan Sverdrup and Johan Castberg – that have boosted total North Sea production, this has seemingly had little direct effect on the pricing mechanism for Dated Brent, which relies on production from Brent, Forties, Oseberg, Ekofisk and Troll crude oils plus delivered cargoes of WTI Midland. Production for the core North Sea grades (excluding WTI Midland) that underpin Brent have experienced mixed fortunes in recent years with total volumes falling by around 100,000 barrels per day in the past 12 months to December 2025.
At the same time, the volume of U.S. crude oil exported to northwest Europe has continued to rise, which has been supportive for the Brent benchmark. The total volume of U.S. crude oil sold into Europe has reached more than double the volume of oil that is produced at the North Sea crude oil terminals for Brent, Forties, Oseberg, Ekofisk and Troll. In the latest data from shipping analytics firm Vortexa, total volumes of U.S. crude oil exported to NW Europe reached around 1.1 million barrels per day compared to around 550,000 barrels per day for the crude oils which make up the current Brent basket.
European refiners have benefited from the increased availability of light sweet U.S. crude oil grades and, in some cases, have been able to replace the long-standing baseload crude grades from places like Russia with U.S. alternatives. This has been beneficial to the growth of NYMEX WTI crude oil futures, and other U.S. crudes like Argus MEH which trade relative to the U.S. crude futures marker. Traders note that this has been a major boost to the success of WTI Midland. It is generally considered to be a good quality crude grade that is able to produce a larger quantity of road transport fuels such as diesel and gasoline, both of which are important fuels used in the European markets.
All of these changes are considered to be supportive to the growth of NYMEX WTI futures and broader U.S. crude complex as a global benchmark.
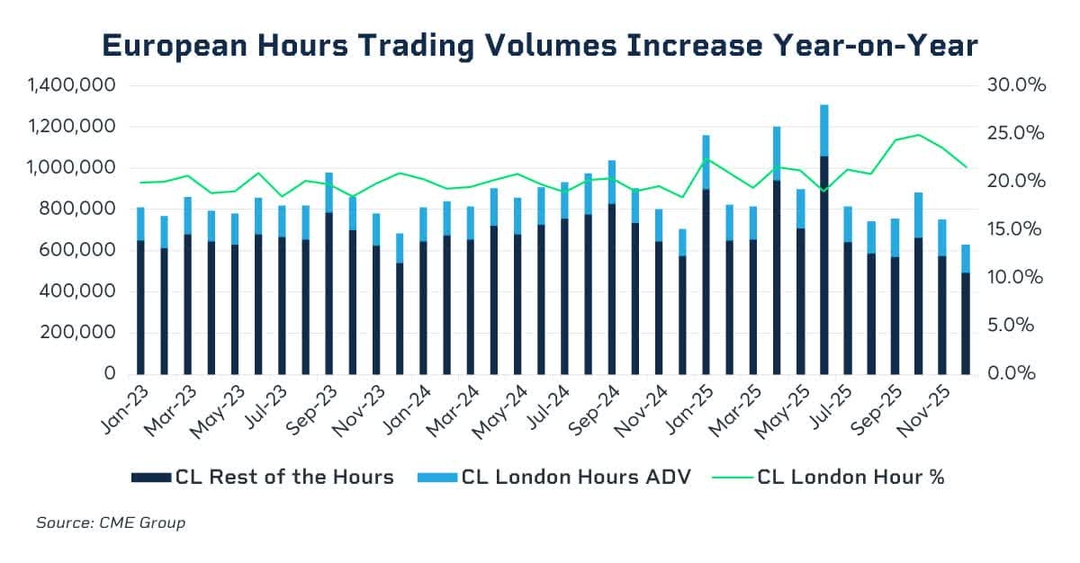
A Quarter of All NYMEX WTI Futures Now Trade During European Hours
The latest data from CME Group shows that there is a growing volume of NYMEX WTI Crude Oil futures being traded during non-U.S. hours. Trading volumes during the London day and before the U.S. trading session reached around 200,000 barrels per day in 2025, which is an increase of 16% from 2024 levels. Importantly, there were three months in 2025 where volume traded in European hours exceeded 200,000 contracts per day, with volumes reaching around 25% of the total volume traded. The inclusion of WTI in the Dated Brent basket is one reason behind the WTI volume increase in European hours, analysts say.
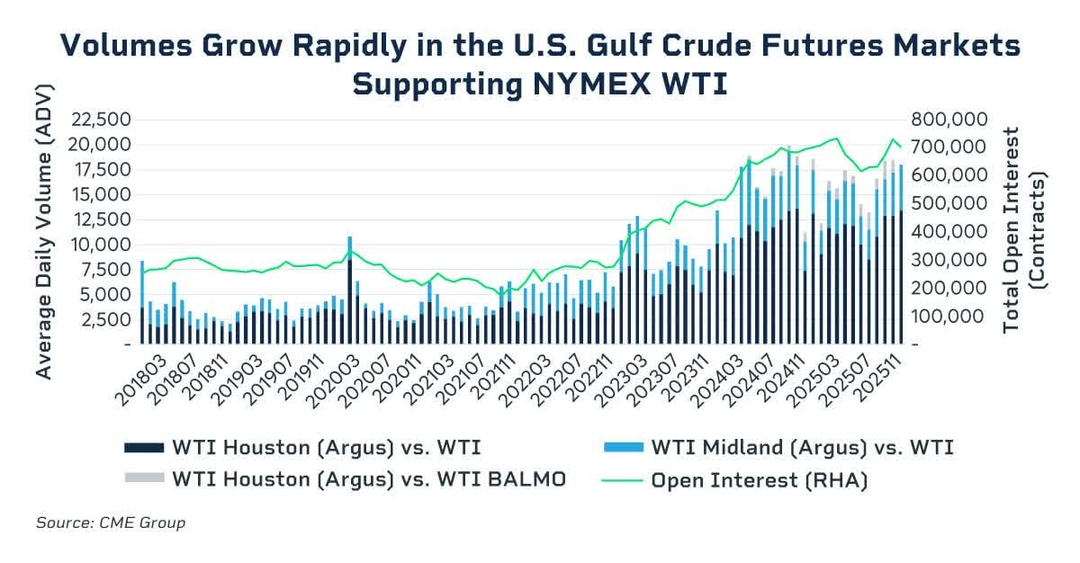
The boom in exports to Europe has also given rise to increased trading of CME Group WTI Midland quality futures, priced as a basis to NYMEX WTI at Cushing. Trading in the Argus WTI Houston vs. NYMEX WTI crude oil futures (NYMEX HTT) during the European morning hit a new high in October 2025, up more than three times the prior high. The growth signals increasing liquidity and interest from regional refiners in managing quality and location risk around WTI Midland.
The Rise of Grades: Hedging a Differential to WTI
The role that WTI Midland is playing in the North Sea price assessment process has been increasing for the past several months, with a higher proportion of U.S. crude cargoes setting the price of Dated Brent compared to other grades in the North Sea. Traded volumes in WTI Midland and WTI Houston vs NYMEX WTI have continued to increase sharply since U.S. crude oil was permitted for export in 2016, highlighting the growing appetite for risk management tools for managing price volatility along the U.S. Gulf Coast. All of these products are tied back to NYMEX WTI crude oil futures, which has attracted the interest of international markets.
The latest data shows that total volume of the WTI Houston and WTI Midland products vs NYMEX WTI has increased from around 15,900 contracts per day in 2024 to around 18,000 contracts per day in 2025. This represents an increase of around 14% year-on-year. Open interest, a key measure of the success of a futures contract, reached around 705,000 contracts at the end of December 2025, which is close to an all-time record level.
These developments are helping to elevate WTI Midland to one of the leading globally significant swing barrels, especially for Northwest European refiners. The light sweet nature of WTI Midland is one reason why the crude grade has become a popular choice for European refiners. Typically, European refiners hedge their index purchases of WTI Midland from the Gulf Coast by buying NYMEX WTI plus the Argus WTI Houston (HTT) differential and selling NYMEX Brent futures.
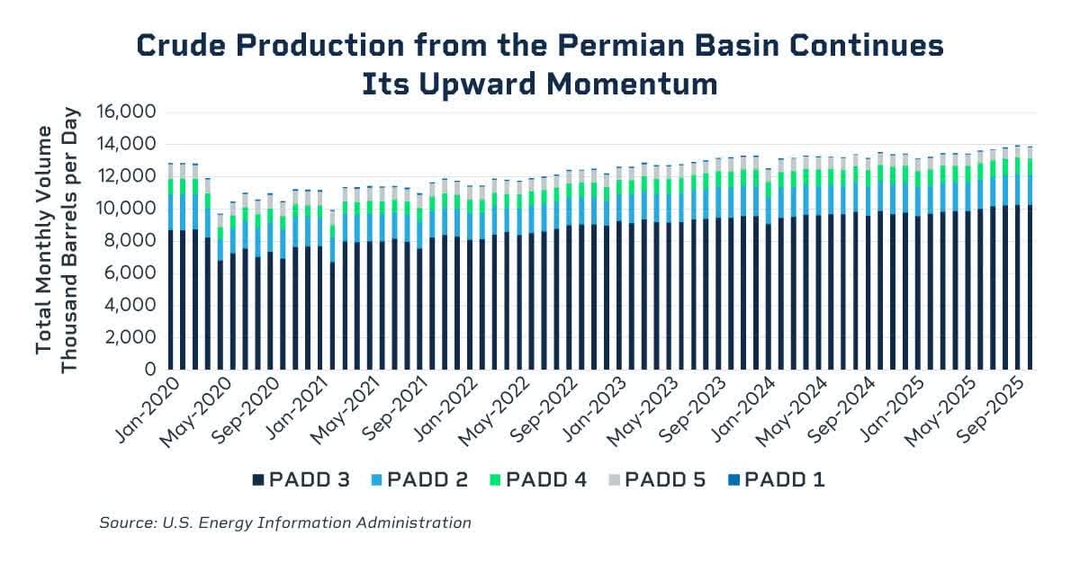
U.S. Gulf Coast PADD III: Crude Production Achieves Record Output
The shale revolution has been one major factor contributing to the rise in output. The latest data from the U.S. Energy Information Administration shows that total U.S. crude production across the five key Petroleum Districts reached around 14 million barrels per day. Crude production in the crucial Petroleum Administration for Defense District (PADD III), which includes the Permian Basin crude WTI Midland, reached over 10.2 million barrels per day, an all-time high level during Q4 2025.
Growth in International Use of NYMEX WTI Continues
The increasing production of U.S. crude has been beneficial for the global oil markets and has allowed the U.S. to play a more pivotal role in the pricing of crude oil globally. Its export volumes have risen sharply in recent years and more cargoes are heading to Europe and Asia, which has brought more traders into the market to trade the price of WTI crude oil. The international adoption of NYMEX WTI as a global benchmark is expanding with many more refiners across Europe using it to price crude cargoes into the region. As higher volumes of U.S. crude oil exports are refined outside the U.S., the adoption of the U.S. benchmark continues to grow.


Wintrust Financial: Premium Franchise, But Macro Concerns Keep Upside Capped

SYDNEY — Australians are drinking fewer sugar-sweetened sodas and other sweetened beverages than a decade ago, with consumption dropping sharply among children, but overall soft drink intake per capita hovers around 82 liters annually as zero-sugar and diet options gain ground, according to the latest government and industry data released in 2025 and early 2026.

The Australian Bureau of Statistics reported in September 2025 that just 28.9% of people consumed sweetened beverages on a given day in 2023, down from 42.2% in 2011–12 and 49.2% in 1995. Among children aged 2 to 17, the figure plummeted from nearly three in four in 1995 to one in four in 2023.
Despite the decline in sugary options, apparent per capita consumption of soft drinks stood at about 164.8 milliliters daily in the 2024 financial year, or roughly 60 liters annually, with industry forecasts projecting a slight rise to 81.7–82 liters per person in 2025–26.
Health experts and public health groups continue to highlight links between even moderate soda consumption and risks of obesity, type 2 diabetes and dental problems, while the industry points to voluntary sugar reductions and a surge in low- and no-sugar varieties now accounting for more than half of sales.
Declining Sugary Drink Consumption Masks Shifts in Preferences
The National Nutrition and Physical Activity Survey data showed broad declines across age groups under 50 for soft drinks and flavored mineral waters, which fell from 29.1% of people in 2011–12 to 23.8% in 2023. Cordial consumption dropped even more dramatically, from 16.2% to 3.4%.
Apparent consumption figures from the ABS, tracking sales and supply, revealed soft drinks contributing 169 grams per person daily in 2023–24, up 2.2% from the prior year but part of a mixed picture within the broader non-alcoholic beverages market that reached 4.17 billion liters in Q3 2024.
Low- and no-sugar options drove much of the recent stability or modest growth. The Australian Beverages Council’s sugar reduction pledge, launched in 2018 by major players including Coca-Cola Europacific Partners, Asahi and PepsiCo, targeted a 20% cut by 2025 from 2015 levels and was later upgraded to 25%. By 2023, low- and no-sugar varieties represented 55.5% of sales volumes, up from previous years, with sugar content per 100ml falling to 4.94 grams.
IBISWorld analysts noted a 1.1% rise in soft drink consumption projected for 2025–26, fueled by sugar-free purchases as consumers opt for cheaper non-alcoholic alternatives amid cost-of-living pressures and “mindful drinking” trends. Fast-food combo meals also boosted volumes.
Diet soft drinks specifically showed steady market growth, with revenue projected to reach US$368.9 million by 2025 at a 3.3% compound annual growth rate.
Socioeconomic and Geographic Disparities Persist
Consumption patterns vary significantly by location and disadvantage. New ABS data released in March 2026 showed shoppers in the most socioeconomically disadvantaged 20% of areas purchased 26% more sugar-sweetened drinks than the national average, while those in the least disadvantaged areas bought 29% less.
In very remote areas, soft drink consumption ran 54% higher than in major cities, and bottled water was 74% higher, reflecting differences in access and preferences.
Men, younger adults and those in lower socioeconomic groups remain higher consumers of sugar-sweetened beverages, raising equity concerns for public health interventions.
Health Risks Drive Calls for Stronger Action
Public health organizations link excessive soda consumption to Australia’s obesity rates — about 32% of adults and 8.1% of children classified as obese — and rising chronic disease burdens. Sweetened beverages contribute about one-quarter of free sugars in the diet, with discretionary foods and drinks accounting for 31% of daily energy intake in 2023, down slightly from 35.4% in 2011–12.
A 2025 Monash University-led study following more than 36,000 adults found that drinking one can of artificially sweetened soft drink daily was associated with a 38% higher risk of type 2 diabetes, compared to 23% for sugar-sweetened versions, though the sugar-sweetened link weakened after adjusting for obesity measures.
Globally, sugar-sweetened beverages contribute to millions of new diabetes and cardiovascular cases annually, with Australia’s patterns aligning with broader Western trends of declining but still significant intake.
The Australian Medical Association and Public Health Association of Australia have renewed calls for a health levy on sugar-sweetened beverages, modeled on international examples. A proposed 50 cents per 100 grams of added sugar could add about 20 cents to a standard can. Polling showed 56% public support for such a tax, with even higher backing for better labeling (83%) and marketing restrictions to children (73%).
The federal government has so far resisted a sugar tax, favoring education and industry self-regulation instead. A 2024 parliamentary inquiry into diabetes recommended considering a graduated levy, but no legislation has advanced.
Industry Responds With Reformulation and Innovation
Major manufacturers emphasize progress on the voluntary pledge and innovation in functional and zero-sugar drinks. Coca-Cola Europacific Partners holds about 50% of the Australian soft drink market, with the sector generating billions in revenue and employing thousands.
Carbonated beverages alone were valued at AUD 11.43 billion in 2025, projected to grow at 3.52% annually through 2035. The broader non-alcoholic beverages market is expected to nearly double to USD 47.81 billion by 2033.
Zero-sugar sodas are overtaking full-sugar options in many segments as consumers seek better-for-you choices without sacrificing flavor. Electrolyte and energy drinks showed the fastest growth in recent apparent consumption data.
Critics argue voluntary measures fall short and note the industry’s historical opposition to taxes, including lobbying and policy substitution through pledges.
Outlook: Balancing Taste, Health and Policy
As Australia grapples with high rates of overweight and obesity, soda consumption trends reflect a population increasingly aware of health impacts yet still reaching for convenient, affordable beverages. The shift toward intense-sweetened (artificial) options — 43.1% of soft drink volume in 2023–24 — raises new questions about long-term metabolic effects.
Experts recommend comprehensive strategies: clearer front-of-pack labeling, restrictions on marketing to children, promotion of water as the default, and consideration of fiscal measures proven effective elsewhere.
With the sugar reduction pledge target year of 2025 now passed, stakeholders will watch whether further reformulation occurs or if consumption rebounds with economic pressures.
For now, the data suggests progress in reducing traditional sugary soda intake, particularly among the young, but persistent disparities and emerging risks from alternatives mean the conversation on Australia’s beverage habits is far from over.
Public health advocates stress that even small population-level reductions in free sugars from beverages could yield significant gains against chronic disease.


Swiss president says U.S. trade talks to continue beyond March

ICHikawa, Japan — A tiny Japanese macaque named Punch has become one of the internet’s most beloved animal stars in early 2026, melting hearts worldwide with his story of rejection, resilience and an inseparable bond with a stuffed orangutan plush toy.

Born on July 26, 2025, at Ichikawa City Zoo in Chiba Prefecture, Punch — whose full Japanese name is Panchi-kun — was rejected by his mother shortly after birth. Zookeepers stepped in, providing him with an IKEA Djungelskog orangutan plushie as a surrogate for comfort and emotional support. Videos of the seven-month-old snow monkey dragging, cuddling and parading his “Oran-Mama” around the enclosure exploded on social media in February 2026, sparking global fascination.
Here are five fun facts about Punch the Monkey that explain why this pint-sized primate has captured millions of fans:
- His Name Honors a Legendary Manga Artist Punch’s name derives from “Monkey Punch,” the pen name of the late Japanese manga artist Kazuhiko Katō, creator of the iconic “Lupin the Third” series. Zoo officials chose the name for the baby macaque, adding the affectionate “-kun” honorific common in Japanese for young boys or cute characters. This pop-culture nod gave the little snow monkey instant recognizability in Japan and among anime fans worldwide.
- His Plush Toy Triggered Global Shortages The well-worn orange IKEA Djungelskog plushie that Punch treats as a surrogate mother became so famous that it sold out in multiple countries. Resale prices skyrocketed on secondary markets, with some units fetching several times their original $20 price. IKEA even acknowledged the phenomenon, and the company reportedly donated additional plushies to the zoo. Fans now affectionately call the toy “Oran-Mama” or “Oran-Mother.”
- He Sparked a Tourism Boom at His Zoo Since Punch’s videos went viral, monthly visitor numbers at Ichikawa City Zoo have more than doubled. Long lines of fans, many traveling from across Japan and abroad, now form to catch a glimpse of the celebrity monkey. The zoo has embraced the attention, posting regular updates on Punch’s progress as he gradually integrates with the troop while still occasionally relying on his plush companion.
- His Story Echoes Classic Attachment Theory Scientists and psychologists have drawn parallels between Punch’s behavior and Harry Harlow’s famous 1950s experiments on rhesus monkeys and surrogate mothers. Punch’s attachment to the soft orangutan plush mirrors how infant primates seek comfort from “contact comfort” sources. Experts say his story provides a touching real-world example of emotional bonding and resilience in primates.
- He Inspired His Own Video Game Punch’s popularity inspired “Zoo Fighter,” a free web-based game created by former Fortnite developer Richie Branson. Players control Punch as he fights off bullying monkeys in a Vampire Survivors-style brawler, eventually earning his way to a sanctuary. The game even includes his signature plush toy as part of the character design and carries a light message about zoo animal welfare.
From Heartbreak to Hope
Punch’s early life was challenging. After his mother rejected him, he struggled to bond with the rest of the macaque troop and faced instances of aggression captured on video. These clips initially caused widespread concern and sadness among viewers, but zoo officials emphasized that such behavior is part of normal primate socialization. Recent updates show Punch making positive progress — grooming peers, playing with other young monkeys and relying less heavily on his plushie while still keeping it close.
At around 2 kilograms (4.4 pounds) in early 2026, Punch continues to grow and develop under close zoo supervision. Japanese macaques, also known as snow monkeys, are famous for their adaptability and hot-spring bathing habits in wild populations, though Punch’s life remains centered in the controlled environment of the zoo.
Why Punch Resonates So Deeply
The global reaction to Punch goes beyond simple cuteness. Many viewers project their own experiences of rejection, loneliness or the search for comfort onto the little monkey. His story has sparked conversations about animal emotions, zoo ethics, attachment and human empathy. Supporters have used hashtags such as #HangInTherePunch, and positive updates about his integration with the troop have brought collective relief.
Animal behaviorists note that while anthropomorphizing animals can sometimes distort understanding, Punch’s case offers genuine insights into primate social dynamics and the importance of early bonding. The zoo has balanced public interest with the animals’ welfare, limiting direct interaction while sharing carefully curated videos.
Cultural and Commercial Impact
Punch’s fame has extended into merchandise trends, meme culture and even scientific discussion. His story highlights the power of social media to turn a single zoo animal into an international sensation almost overnight. It also demonstrates how digital platforms can drive real-world outcomes, such as increased zoo attendance and awareness of primate care.
As Punch approaches his first birthday in July 2026, fans continue to follow his journey eagerly. Zoo officials promise ongoing updates, and many hope he will fully integrate into the troop while retaining his playful, plushie-loving personality that first won hearts.
For now, Punch the Monkey remains a symbol of resilience — a small primate who turned early hardship into an outsized global embrace. Whether cuddling his orangutan friend or exploring new social bonds, he continues to remind audiences of the universal need for comfort, connection and a little kindness.

Apple’s long-awaited entry into the foldable smartphone market with its rumored iPhone Fold could pose a serious challenge to Samsung’s dominance in the category when it launches in late 2026, though analysts say Samsung’s years of refinement and ecosystem advantages will make victory far from certain.

Rumors point to a premium book-style foldable iPhone arriving in September or December 2026, featuring a near-crease-free 7.8-inch inner display and 5.5-inch outer screen, titanium build and Apple’s signature software polish. Samsung, meanwhile, is preparing the Galaxy Z Fold 8 for a mid-2026 release, with possible wider variants to counter Apple directly.
Supply chain reports suggest Apple has ramped up orders for foldable displays to 20 million units, signaling confidence that its first foldable could outsell Samsung’s entire foldable lineup in its debut year. Samsung aims for around 7 million foldable units across its Z Fold, Z Flip and potential TriFold models in 2026.
Design and Hardware Showdown
Early leaks describe the iPhone Fold as ultra-thin — potentially just 4.8mm unfolded — with a minimalist aesthetic, in-display sensors and a focus on durability to minimize visible creases. This contrasts with Samsung’s Z Fold series, which has steadily improved but still shows some crease and bulk in current models. The Galaxy Z Fold 7, released in 2025, measures about 4.2mm unfolded and offers an 8-inch inner display with strong multitasking features.
Samsung is reportedly developing a “Wide Fold” variant for 2026 with a squarer aspect ratio to better compete with Apple’s rumored proportions. Both devices are expected to emphasize productivity, with larger inner screens ideal for split-view apps, note-taking and media consumption.
Apple’s strengths lie in its tightly integrated hardware-software ecosystem, potentially delivering smoother animations, better battery optimization and seamless handoff between devices. Samsung counters with more mature foldable-specific features, larger screen real estate options, S Pen support on some models and faster charging.
Software and Ecosystem Edge
iOS on a foldable could bring Apple’s renowned optimization, with dynamic app resizing, Stage Manager-like multitasking and deep integration with iPadOS and macOS. Samsung’s One UI on Android already offers advanced foldable features such as Flex Mode and multi-window support, refined over seven generations.
Analysts note that Apple’s late entry allows it to learn from Samsung’s missteps — such as early durability issues and prominent creases — while leveraging its massive installed base of iPhone users who may upgrade for the novelty and premium experience.
Pricing and Market Positioning
Pricing remains a major question. The iPhone Fold is rumored to start above $2,000, possibly reaching $2,400, positioning it as a ultra-premium device. Samsung’s Z Fold 8 is expected to hold steady around $1,800–$2,000, potentially offering better value for power users seeking maximum screen size.
Apple’s brand power and marketing muscle could drive strong initial demand, especially among loyal customers seeking the “first foldable iPhone” prestige. However, Samsung benefits from established supply chains, lower production costs through experience and broader carrier partnerships.
Challenges for Apple
Entering the foldable segment late means Apple must deliver near-perfection to justify the hype. Durability concerns, battery life in a thin chassis and the lack of a stylus could limit appeal for productivity-focused buyers who already own Samsung foldables.
Samsung, by contrast, continues iterating rapidly. The company plans multiple foldable models in 2026, including potential TriFold designs, giving consumers more choices and allowing it to test different form factors.
Potential for Disruption
Many analysts believe Apple can capture significant market share quickly due to its ecosystem lock-in and reputation for premium devices. If the iPhone Fold delivers a crease-free experience, superior cameras and long-term software support, it could accelerate mainstream adoption of foldables beyond the current niche.
Yet Samsung’s head start, aggressive innovation and willingness to experiment — evidenced by rumored wide and TriFold variants — position it to defend its lead. The South Korean giant has sold millions of foldables and refined hinge technology over years.
Global foldable shipments continue growing, but remain a fraction of overall smartphone sales. Apple’s participation could validate the category and expand the total addressable market, ultimately benefiting both companies.
Outlook for 2026 and Beyond
The 2026 foldable battle could reshape the premium smartphone landscape. Apple’s iPhone Fold may not “beat” Samsung outright in its first year due to Samsung’s maturity and pricing flexibility, but it stands a strong chance of stealing headlines, premium market share and mindshare.
Success for Apple will hinge on execution: delivering a reliable, desirable device that feels distinctly Apple while addressing foldable pain points. For Samsung, the challenge is staying ahead through continuous improvement and variety.
Consumers stand to benefit most from the competition, with better displays, thinner designs and innovative features likely emerging from both camps. As launch dates approach, expect intensified leaks, marketing teasers and speculation about which company will ultimately fold the competition.
For now, the foldable race remains wide open, with Samsung holding the experience advantage and Apple wielding its legendary ability to refine and popularize emerging technologies.

NEW YORK — Travelers at John F. Kennedy International Airport faced significantly extended security lines on Sunday, March 29, 2026, as partial government shutdown-related TSA staffing shortages continued to disrupt operations at one of the nation’s busiest gateways.

Officials warned passengers to allow substantially more time than usual, with some terminals reporting waits exceeding 60 minutes while others remained relatively manageable but still subject to rapid changes.
JFK Airport’s official website noted that security wait times “may be significantly longer than normal” due to the federal funding lapse. Real-time reporting has been temporarily suspended or limited at several checkpoints because of volatility tied to TSA officer call-outs. Airport authorities advised passengers to arrive at least three to four hours before domestic flights and even earlier for international departures to avoid missing flights.
Current Conditions Across Terminals
As of late Sunday morning and early afternoon reports:
- Terminal 5 (primarily JetBlue and international carriers): General TSA lines exceeded 60 minutes at times, with some travelers reporting waits of 90 minutes or more during peak periods. TSA PreCheck offered faster passage, often under 10 minutes when lanes remained open.
- Terminal 4 (major international hub): General security around 9–35 minutes, with PreCheck under 5–10 minutes.
- Terminal 1, 7, and 8: Shorter general waits of 1–22 minutes in calmer periods, though staffing fluctuations caused lines to build quickly.
Third-party trackers and traveler reports indicated average waits across JFK hovering between 25 and 62 minutes depending on the time of day and terminal, with early morning and evening rushes proving most challenging. Some PreCheck lanes still provided relief, but even expedited options occasionally faced backups.
Causes of the Delays
The partial government shutdown has driven TSA call-out rates dramatically higher than normal, sometimes exceeding 30–40% at major hubs like JFK. Officers deemed essential continue working without regular pay, leading many to miss shifts or seek supplemental income. This has reduced checkpoint capacity even as spring travel demand remains robust.
JFK, which handles tens of millions of passengers annually with heavy international traffic, is particularly sensitive to staffing shortages. Long lines have stretched outside some terminals, prompting deployment of additional support staff, including ICE officers in limited assisting roles at certain checkpoints. Airport officials have added rope lines and signage to manage crowds, but the situation remains fluid.
Traveler Experiences and Advice
Social media and news reports over recent days showed frustrated passengers sharing images of crowded terminals and warning others to build in extra buffer time. Many described arriving four hours early only to clear security with time to spare on lighter days, while others missed flights due to unexpected surges.
Tips for flying through JFK during this period include:
- Check the official JFK Airport website (jfkairport.com) or your airline app immediately before leaving for the airport for the latest alerts.
- Enroll in TSA PreCheck or CLEAR if possible to reduce screening time.
- Follow the 3-1-1 liquids rule and pack carry-ons efficiently to avoid secondary screening.
- Monitor flight status closely, as security delays can cascade into gate issues.
- Consider off-peak flights when feasible to avoid morning and evening rushes.
- Stay hydrated and prepare for potential waits by bringing snacks and entertainment.
The MyTSA app, which normally provides crowd-sourced wait times, has limited functionality during the shutdown, forcing greater reliance on airport websites and real-time traveler posts.
Broader Impact on New York Area Travel
JFK is not alone — neighboring LaGuardia and Newark Liberty International airports have also reported elevated waits, though conditions vary by day and terminal. The shutdown’s effects have rippled through the entire New York metro travel ecosystem, affecting connections and ground transportation.
Airlines have adjusted some schedules and issued flexible rebooking policies, but passengers missing flights due to security delays generally must rebook at their own expense unless covered by specific airline protections or travel insurance.
Outlook and Potential Relief
Negotiations to resolve the funding impasse continue, with some lawmakers expressing urgency over the impact on travelers and federal workers. Even if resolved soon, experts warn that restoring full TSA staffing could take days or weeks due to training and scheduling requirements.
In the meantime, JFK officials continue monitoring conditions closely and may update advisories as needed. Travelers are encouraged to remain flexible and proactive in their planning.
The situation at JFK underscores the critical role of consistent federal staffing in maintaining efficient air travel at major hubs. While some checkpoints have seen temporary improvements during off-peak hours, the overall environment remains challenging and unpredictable for those passing through Queens this weekend and into the coming week.
Passengers with questions can contact their airline directly or check TSA’s limited resources. For non-security emergencies at the airport, reach JFK customer service or local authorities.

Buy UPS. Better Days Await the Stock.

JD.com: Even If It Stops Growing, It Still Is A Fundamental Buy

As a finance enthusiast with experience in research, I am deeply engaged in studying diverse businesses, especially in the technology, industrial, and conglomerate sectors. I really like companies that have strong foundations and see them doing well in the long run. I enjoy writing about these businesses, telling their stories, strategies, and financial details. I use a mix of looking at their finances and writing to give insights into how well companies might do, helping people understand the market better. This focus on both looking at the numbers and explaining things reflects my dedication to both understanding and explaining the details of the financial world.
Analyst’s Disclosure: I/we have no stock, option or similar derivative position in any of the companies mentioned, and no plans to initiate any such positions within the next 72 hours. I wrote this article myself, and it expresses my own opinions. I am not receiving compensation for it (other than from Seeking Alpha). I have no business relationship with any company whose stock is mentioned in this article.
Seeking Alpha’s Disclosure: Past performance is no guarantee of future results. No recommendation or advice is being given as to whether any investment is suitable for a particular investor. Any views or opinions expressed above may not reflect those of Seeking Alpha as a whole. Seeking Alpha is not a licensed securities dealer, broker or US investment adviser or investment bank. Our analysts are third party authors that include both professional investors and individual investors who may not be licensed or certified by any institute or regulatory body.

Pakistan emerges as key mediator in U.S.-Iran conflict following strategic pivot

Smart Financial Decisions in a Changing Global Economy

Worth checking out if you’re a Sky TV customer

Wintrust Financial: Premium Franchise, But Macro Concerns Keep Upside Capped


-
 NewsBeat4 days ago
Manchester United reach agreement with Casemiro over contract clause amid transfer speculation
-

 News Videos3 days ago
Parliament publishes latest register of MPs’ financial interests
-

 Sports6 days ago
Remo Stars and Kano Pillars Strengthen Survival Hopes in NPFL
-

 Sports6 days ago
Gary Kirsten Accuses Pakistan Cricket Board Of ‘Interference’, Mohsin Naqvi Responds
-

 Business7 days ago
No Winner in March 21 Drawing as Prize Rolls to $133 Million for Next
-

 Tech7 days ago
Give Your Phone a Huge (and Free) Upgrade by Switching to Another Keyboard
-

 Tech7 days ago
AI enters the chat: New Seattle dating app relies on tech to facilitate meaningful human connections
-

 Business3 days ago
Instagram, YouTube Found Responsible for Teen’s Mental Health Struggle in Historic Ruling
-

 News Videos6 days ago
Ch 9 Financial Management Part 1 | Detailed One Shot | Class 12 Business Studies Boards 2026
-

 NewsBeat2 days ago
The Story hosts event on Durham’s historic registers
-
 NewsBeat4 days ago
Tesco is selling new Cadbury Dairy Milk bar and people can’t wait to try it
-

 Business7 days ago
Will Duke Basketball Win It All? Duke Basketball Enters Second Round as Third Favorite to Claim NCAA Title
-

 Sports6 days ago
2026 Kentucky Derby horses, odds, futures, preview, date: Expert who hit 12 Derby-Oaks Doubles enters picks
-
 Entertainment11 hours ago
Lana Del Rey Celebrates Her Husband’s 51st Birthday In New Post
-
 NewsBeat7 days ago
Update on Wisbech river crash as search for teenage boy enters fifth day
-

 Tech6 days ago
Samsung will soon let you control smart home devices from your car’s dashboard
-
 Entertainment6 days ago
Cynthia Bailey Dishes on ‘RHOA’ Season 17, Discusses Kandi
-

 Fashion5 days ago
Does It Matter What You Wear When You’re Laid Off and Looking?
-
 NewsBeat6 days ago
Colombian military plane with 110 soldiers onboard crashes following takeoff
-

 Business5 days ago
More women enter wealth management, but few in advisory roles: study
You must be logged in to post a comment Login