
Business
F&O Talk: Nifty indicating little evidence of sustained recovery, says Sudeep Shah; outlines BSE, Groww strategy amid CAS


Sensex gained 363 points to close at 76,515 while Nifty 50 rose over 24 points to end the session below 23,898 on Friday. Broader markets closed mixed, with Nifty Midcap 100 slipping into the red, while Nifty Smallcap 100 closed in the green.
Analyst Sudeep Shah, Vice President and Head of Technical & Derivatives Research at SBI Securities, interacted with ETMarkets regarding the outlook for the Nifty, options data as well as an index strategy for the upcoming week. The following are the edited excerpts from his chat:
1.) Sensex, Nifty have fallen 1% this week as CAS lingers. What are levels that traders need to keep in mind?
For the fourth consecutive week, the benchmark Nifty ended in negative territory. During the week, the index broke down from its rising channel on the daily chart, signaling a shift in the short-term trend. Escalating geopolitical tensions, rising US 10-year bond yields, and higher Brent crude prices continued to weigh on market sentiment. However, the index staged a minor pullback after testing 23,786, leaving the bulls with one crucial question: is this merely a pause, or the beginning of a meaningful recovery?
The technical picture provides little evidence of a sustained recovery at this stage. Nifty is comfortably trading below its short and long-term moving averages, while the 20, 50, and 100-day EMAs have started edging lower, indicating increasing bearish pressure. The daily RSI is hovering around 40 and remains below its 9-day average, while the daily ADX has moved above 20 and is rising, suggesting that the prevailing trend is gaining strength. With momentum and trend indicators weakening, the spotlight now shifts to a crucial support zone.

That support zone lies in the 23,750-23,700 region. The zone is important as the 61.8% Fibonacci retracement of the previous upmove from 23,070 to 24,774 is placed around this region. A sustained break below 23700 could intensify the correction towards 23,500, followed by 23,300.
On the upside, the hurdle is placed in the zone of 24,150-24,200 as it is the confluence of 50 and 100-day EMA levels. A sustained move above this range would be required to ease the prevailing bearish bias and bring stability back to the index.Sensex View: The benchmark index, Sensex, extended its weakness for the fourth consecutive week and has breached its rising channel formation on the daily chart, indicating a deterioration in short-term trend structure. However, after registering a low of 76,135, the index witnessed a modest pullback. On the weekly timeframe, Sensex formed a bearish candle with a minor lower shadow, reflecting continued selling pressure despite some buying interest at lower levels.
Technically, the index is trading comfortably below its key moving averages, while the short-term moving averages have started to slope downward, reinforcing the negative bias. The daily RSI is hovering near the 43 mark and remains below its 9-day average, suggesting subdued momentum. Meanwhile, the daily MACD histogram has stayed in negative territory for the past 16 trading sessions, highlighting persistent bearish undertones.
Going forward, the 76,200-76,000 zone is expected to provide crucial support. A decisive move below the 76,000 mark could accelerate the corrective phase, exposing the index to lower levels of 75,400 and subsequently 74,800 in the near term. On the upside, the 20-day EMA region of 77,100-77,200 is likely to act as a strong resistance zone.
2.) What is your view on India Vix and what is it indicating after a 11% fall in one month?
India VIX has been in a declining trend since hitting a high of 28.90 on March 30. Since then, implied volatility (IV) has remained in a falling mode, keeping the market in a low-volatility environment.
The current IVP for Nifty stands at 28.57%, indicating that over the past one year, Nifty’s current IV of 11.34 has been at or below this level for only 28.57% of the time. This suggests that the current IV is at the lower end of its historical range.
The 12–12.5 zone is likely to act as an immediate resistance. Volatility is likely to remain subdued as long as India VIX stays below this zone.
However, the key risk in such a low-volatility environment is that any significant overnight development could trigger a sudden spike in volatility, potentially catching option sellers off guard.
3.) Where are you seeing strong option position right now and which Nifty strikes could act as immediate support or resistance zones going into next expiry?
For the current weekly expiry, the 24,200 level is likely to act as a strong resistance on the upside. Call writing at this strike is nearly six times stronger than put writing. Moreover, Nifty’s 100-day EMA is placed around the 24,180–24,200 zone, making this a crucial resistance to watch.
On the downside, the 23,700 level is likely to act as an immediate support, with put writing nearly six times stronger than call writing at this strike. The 23,800–23,780 zone also coincides with Nifty’s immediate swing low. A decisive breach below this zone could trigger unwinding of put-writing positions, potentially dragging Nifty towards the 23,500 mark in the near term.
4.) What is your view on Bank Nifty ?
The banking benchmark index, Bank Nifty, has remained range-bound over the last 23 trading sessions, oscillating within a narrow band of nearly 1254 points. This prolonged consolidation has resulted in a significant contraction in the Bollinger Bands, indicating a sharp decline in volatility and hinting at the possibility of a decisive move once the current range is breached.
From a technical perspective, all key moving averages are largely flat, underscoring the absence of a clear directional trend. Momentum indicators also reflect the ongoing consolidation phase. The daily RSI has been moving sideways for the past 42 trading sessions, while both the Stochastic Oscillator and MACD continue to fluctuate within a narrow range without providing a strong directional signal. Additionally, the trend strength indicator is positioned at 7.19, suggesting a lack of meaningful strength from either bulls or bears.
Going forward, the 57,800-58,000 zone is expected to act as a critical resistance area for the index. A sustained breakout above this hurdle could trigger a fresh directional upmove. On the downside, the 56,900-56,700 zone remains an important support region. A decisive breakdown below this support band may lead to increased selling pressure.
Overall, Bank Nifty continues to trade in a consolidation phase, and a convincing move beyond either end of the current range is likely to set the stage for the next trending move.
5.) What’s is your view on BSE, Groww, Angel One ?
BSE has been consolidating within a Rs 3,474–3,132 range since August 17. The falling ADX indicates a lack of volatility, while the MACD line has flattened out and remains below the zero line, pointing to weak momentum. A decisive breakout on either side of the range will provide further directional cues.
Groww has largely been consolidating within a Rs 221–180 range since May 12. The moving averages have flattened out, reflecting a sideways bias. The ADX is also flat, further indicating the absence of strong directional momentum. A decisive breakout on either side of the range will provide further directional cues.
Angel One has been consolidating within a Rs 308–275 range since the beginning of August. The stock recently moved above its 50-day EMA but failed to sustain above it. On the weekly timeframe, the stock has been oscillating between the 20-week and 50-week EMAs, reflecting a sideways bias. A decisive breakout on either side of the range will provide further directional cues.
(Disclaimer: Recommendations, suggestions, views and opinions given by the experts are their own. These do not represent the views of The Economic Times)


Broadcom: The $350 Billion AI Signal Has A $29 Billion Footnote

Nebius: Too Much Worry Is Not Good For Bulls' Wealth

Vistance Networks director L. William Krause sells $149,555 shares
Business
FII money trail: Where did overseas investors put money in second half of August after $3 billion inflow?

Overseas investors remained net buyers across sectors in the second half of August, marking a second consecutive fortnight of inflows. Ten sectors recorded FPI inflows between August 16 and August 31, according to data from the National Securities Depository (NSDL).
Consumer Services: Foreign buying stays strong
Consumer Services attracted the highest inflows during the fortnight, with Rs 5,019 crore flowing into the sector. This took the sector’s total inflows for August to Rs 8,417 crore. The buying follows a strong July, when the sector recorded inflows of Rs 10,191 crore. Cumulative inflows over the last three months have now reached Rs 19,787 crore.
SBI Securities attributed the sustained interest to changing consumer spending patterns. “Higher disposable income is driving a major shift toward aspirational spending, boosting high-end fashion, luxury cosmetics, and premium organized retail,” the brokerage said in a report.
It added that consumer preference has shifted strongly toward leisure travel, upscale dining and hospitality, helping sustain sector growth despite broader economic cycles.
Financial Services: FIIs rebuild exposure
Financial Services followed closely, attracting over Rs 4,000 crore from FIIs during the fortnight. In the rolling two-month period from June to August, the sector received total inflows of Rs 16,570 crore.
SBI Securities said the return of foreign buying suggests that selling pressure on the sector has eased, with investors gradually rebuilding their exposure. The brokerage noted that Financial Services had recorded Rs 12,303 crore of outflows between March and May.The Financials index has been consolidating within the 25,671–27,127 range for the past two and a half months. A decisive breakout on either side of this range could provide the next directional cue for the index.
September has historically been a strong month for Financial Services, with the index ending higher in 12 of the last 20 years and delivering an average gain of 3.03%. Kotak Bank is the stock exhibiting a positive price action structure, says SBI Securities.
Healthcare: Inflows remain firm
Healthcare attracted Rs 3,021 crore during the second half of August. Over the rolling two-month period, the sector received Rs 12,076 crore of inflows. According to SBI Securities, stocks exhibiting a positive price action structure include Divis Lab, Glenmark, Ipca Lab, Laurus Lab, PPL Pharma and Zydus Life.
Telecom: FPI selling continues
Telecom remained under pressure, with FPIs pulling out Rs 4,983 crore from the sector in August 2026. The selling trend has persisted since January, with FPIs offloading Rs 29,513 crore from the sector so far this year.
The sector continues to face pressure from the heavy investments required for pan-India 5G infrastructure and spectrum renewals, which are weighing on near-term free cash flows. At the same time, actual 5G revenue generation through ARPU growth is scaling much slower than projected.
Unresolved legacy issues, particularly ongoing disputes over Adjusted Gross Revenue (AGR) dues and statutory payout timelines, also remain an overhang because of the potential for sudden legal and financial liabilities for telecom operators.
Telecom’s domestic-revenue-heavy business model also leaves the sector exposed to dollar-denominated import costs, including equipment, putting pressure on net profit margins compared with export-driven sectors such as IT and Pharma.
Stocks exhibiting a weak price action structure include Bharti Airtel, Bharti Hexacom, ITI, Indus Tower, Railtel and Route Mobile.
Power: FPI interest remains weak
Power continued to see consistent FPI outflows, with investors pulling out Rs 2,641 crore from the sector in August 2026. This follows significant outflows of Rs 9,956 crore over the previous three months.
State Power Distribution Companies (DISCOMs) are facing intense cash flow constraints and rising debt. Failure in tariff realisation and delays in subsidy payouts are directly limiting the capital expenditure needed for essential grid maintenance and modernisation.
The sector is also facing higher costs, with high import duties and global supply chain disruptions increasing the cost of critical components such as solar modules, wind turbines and high-voltage transmission lines.
Unpredictable weather shifts, including prolonged dry spells and irregular monsoons, have added another layer of volatility. These conditions have created spikes in peak power demand while simultaneously disrupting hydro and wind generation, forcing utilities to purchase high-priced emergency power from the short-term spot market.
Stocks exhibiting a weak price action structure include Adani Ensol, CESC, KPI Green, NTPC Green, NTPC, PTC India, Powergrid, Tata Power and Torrent Power.
(Disclaimer: Recommendations, suggestions, views and opinions given by the experts are their own. These do not represent the views of The Economic Times)

Valero Energy: Diesel Scarcity Lifted Q2, But The Rally Leaves Little Room For Error


The Closed-End Fund Association (CEFA) is the national trade association representing the closed-end fund industry. A not-for-profit association, CEFA is committed to educating investors about the many benefits of these unique investment products and to providing a resource for information about its members and their offerings.
Analyst’s Disclosure: I/we have no stock, option or similar derivative position in any of the companies mentioned, and no plans to initiate any such positions within the next 72 hours. I wrote this article myself, and it expresses my own opinions. I am not receiving compensation for it. I have no business relationship with any company whose stock is mentioned in this article.
This transcription was created from a CEF Insights video recorded in August 2026. For more information, please visit cefa.com. This material is not and is not intended as investment advice, an indication of trading intent or holdings or the prediction of investment performance. All fund-specific information is the latest publicly available information. All other information is current as of the date of this presentation. All opinions and forward-looking statements are subject to change at any time.
Aberdeen Investments disclaims any responsibility to update such views and/or information. This information is deemed to be from reliable sources; however, Aberdeen does not warrant its completeness or accuracy. This presentation is not intended to, and does not constitute an offer or solicitation to sell or a solicitation of an offer to buy any security, product, investment advice or service (nor shall any security, product, investment advice or service be offered or sold) in any jurisdiction in which Aberdeen is not licensed to conduct business, and/or an offer, solicitation, purchase or a sale would be unavailable or unlawful.
Disclaimer:
Past performance is not indicative of future results.
This commentary is for informational purposes only, and is not intended as an offer or recommendation with respect to the purchase or sale of any security, option, future or other derivatives in such securities. Any research or analysis used in the preparation of this document has been procured by Aberdeen Investments or its affiliates for their own use and may have been acted on for their own purpose. The results thus obtained are made available only coincidentally and the information is not guaranteed as to its accuracy. Some of the information in this document may contain projections or other forward-looking statements regarding future events or future financial performance of states, markets or companies. These statements are only predictions and actual events or results may differ materially. The reader must make his/her own assessment of the relevance, accuracy and adequacy of the information contained in this document and make such independent investigations, as he/she may consider necessary or appropriate for the purpose of such assessment. Any opinion or estimate contained in this document is made on a general basis and is not to be relied on by the reader as advice. Neither Aberdeen Investments or any of its agents have given any consideration to nor have they made any investigation of the investment objectives, financial situation or particular need of the reader, any specific person or group of persons. Accordingly, no warranty whatsoever is given and no liability whatsoever is accepted for any loss arising whether directly or indirectly as a result of the reader, any person or group of persons acting on any information, opinion or estimate contained in this presentation. The information herein including any expressions of opinion or forecast have been obtained from or is based upon sources believed by Aberdeen Investments to be reliable but is not guaranteed as to accuracy or completeness. The information is given without obligation and on the understanding that any person who acts upon it or otherwise changes his position in reliance there on does so entirely at his or her own risk. Aberdeen Investments reserves the right to make changes and corrections to its opinions expressed in this document at any time, without notice. Any unauthorized disclosure, use or dissemination, either whole or partial, of this presentation is prohibited and this presentation is not to be reproduced, copied, made available to others. Fixed income securities are subject to certain risks including, but not limited to: interest rate (changes in interest rates may cause a decline in the market value of an investment), credit (changes in the financial condition of the issuer, borrower, counterparty, or underlying collateral), prepayment (debt issuers may repay or refinance their loans or obligations earlier than anticipated), call (some bonds allow the issuer to call a bond for redemption before it matures), and extension (principal repayments may not occur as quickly as anticipated, causing the expected maturity of a security to increase). Historical data and analysis, should not be taken as an indication or guarantee of any future performance analysis forecast or prediction. Such information is basis and the user of this information assumes the entire risk of any use made of this information. In the United States, Aberdeen Investments is the marketing name for the following affiliated, registered investment advisers: Aberdeen Standard Investments Inc., Aberdeen Asset Managers Ltd., Aberdeen Standard Investments Australia Ltd., Aberdeen Standard Investments (Asia) Ltd., Aberdeen Capital Management LLC, Aberdeen Standard Investments ETFs Advisors LLC and Standard Life Investments (Corporate Funds) Ltd. © Aberdeen Group plc 2026 ID: AA-220626-209669-1 aberdeeninvestments.com
Seeking Alpha’s Disclosure: Past performance is no guarantee of future results. No recommendation or advice is being given as to whether any investment is suitable for a particular investor. Any views or opinions expressed above may not reflect those of Seeking Alpha as a whole. Seeking Alpha is not a licensed securities dealer, broker or US investment adviser or investment bank. Our analysts are third party authors that include both professional investors and individual investors who may not be licensed or certified by any institute or regulatory body.

Dream Finders Homes director Len Sturm purchases $20,205 in stock
Business
ASX 200 Sheds Nearly 1% For The Week As Rate Hike Fears, Iran Conflict Rattle Markets Amid Volatile Trading
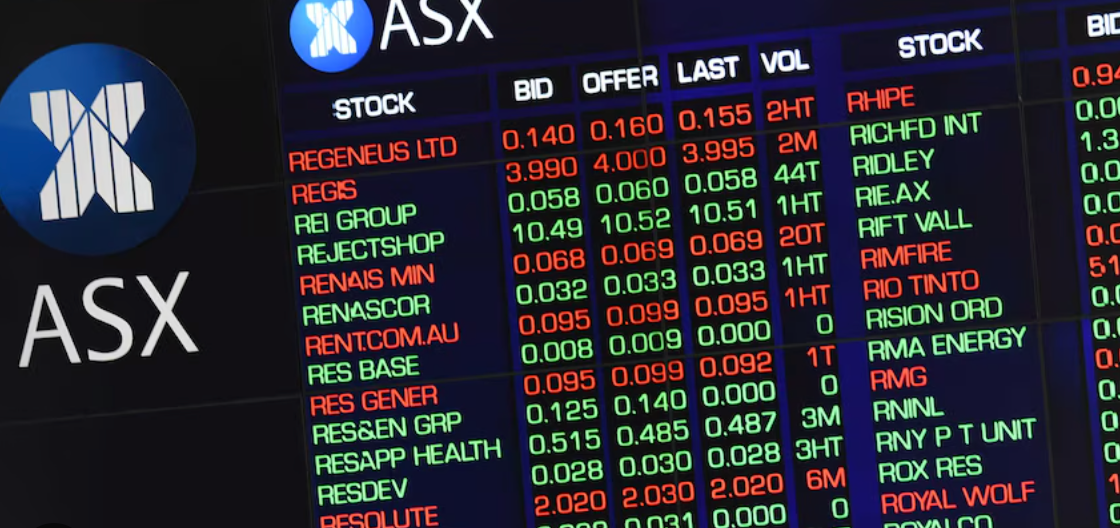
SYDNEY — Australian shares closed out a turbulent trading week Friday with the benchmark S&P/ASX 200 index shedding just under 1% since Monday, as investors navigated a volatile stretch driven by escalating tensions in the Middle East, rising Australian bond yields and growing expectations of a Reserve Bank interest rate hike later this month.
The week began on a difficult note, with the index sliding sharply Monday and Tuesday amid a global bond market selloff triggered by renewed U.S. military strikes on Iran, which sent oil prices climbing and rattled equity markets worldwide. That pressure continued into Wednesday, extending the ASX 200’s losing streak to three consecutive sessions before the market found its footing later in the week.
Thursday brought the week’s most significant rebound, with the ASX 200 gaining 42 points, or 0.5%, to close at 9,020, as bargain-hunting investors stepped back into the market following its slide to a four-week low. That decline had been driven in part by June-quarter GDP data that came in hotter than expected, reinforcing market expectations that the Reserve Bank of Australia may move to raise interest rates at its meeting later this month. Adding to the concerning economic backdrop, the same GDP figures showed the Australian economy had delivered zero net productivity growth since 2019.
Interest rate markets moved sharply during the week to reflect that shifting outlook, with traders pricing in nearly an 80% probability of an RBA rate increase later in September, a significant jump in hawkish sentiment compared with expectations just days earlier.
Moomoo Australia chief market strategist Tapas Strickland described the somewhat counterintuitive dynamic at play, in which even sluggish economic growth could still prompt the central bank toward tightening rather than easing.
“Some thought the economy is growing a little bit too fast, and so therefore you may actually need to raise rates to slow down the rate of growth, even though the rate of growth is so slow,” Strickland told AAP.
Thursday’s rebound was underpinned by broad-based sector strength. Non-energy minerals led the day’s gains, followed by financials, manufacturing and communications stocks, though losses in energy minerals, consumer durables and healthcare limited the overall advance. Gold miners rallied strongly, with Northern Star Resources and Evolution Mining both climbing 2.6%, while Australia’s big four banks rose between 1% and 2%. Rare earths producer Lynas climbed 2.4% during the same session.
The week’s most dramatic single-stock move came from Corporate Travel Management, which plunged 84% to a near 14-year low after resuming trading following a yearlong suspension tied to missed financial reporting deadlines stemming from an accounting scandal involving its UK operations.
Friday’s session brought the week to a close on a mixed note, with the ASX 200 finishing down 0.16%, snapping the momentum built during Thursday’s rebound. Rising stocks still outnumbered declining ones on the broader market by 660 to 419, with 431 stocks finishing unchanged, even as the benchmark index itself edged lower.
Among Friday’s standout performers, Regis Healthcare led the day’s gainers, rising 5.12% to close at $4.52, a notable bounce following the aged care operator’s sharp declines earlier in the week tied to ongoing uncertainty over government aged care funding policy. Drone detection company DroneShield added 5.11% to finish at $1.75, while uranium producer Paladin Energy climbed 5.06% to $11.83.
On the losing side of Friday’s ledger, Nine Entertainment Co. Holdings fell 8.25% to close at 92 cents, marking the steepest decline among ASX 200 constituents for the session. Fuel retailer Ampol dropped 5.45% to finish at $40.90, while Viva Energy Group slipped 3.49% to $2.91.
Looking across the full trading week through Friday’s close, HMC Capital emerged as one of the standout performers, gaining 8.39%, followed closely by automotive parts retailer Bapcor, which rose 8.02%, and gold producer Ora Banda Mining, up 5.65%. On the other end of the spectrum, Nine Entertainment and Ampol again featured among the week’s weakest performers, alongside continued volatility in Corporate Travel Management following its dramatic relisting collapse.
Mining stocks broadly improved over the course of the week despite dipping on Friday specifically, with copper prices holding onto recent gains and gold continuing to lift on the back of a dovish pivot from the U.S. Federal Reserve, along with sustained central bank gold buying globally. That commodity strength provided a partial offset to the broader pressure facing the market from rising local bond yields and mounting expectations of RBA tightening.
The week’s volatility also unfolded against a backdrop of significant global developments, including Nvidia’s confirmed $12.93 billion acquisition of AI platform Hugging Face, a deal that helped fuel gains across global technology and AI-linked stocks, along with a strong earnings report from cloud company Snowflake that further bolstered sentiment in that sector internationally. Those developments provided some support to global risk appetite even as the Iran conflict and its implications for oil prices continued to weigh on broader market sentiment throughout the week.
Real estate stocks emerged as one of the week’s more consistently pressured sectors, weighed down by the sustained rise in global and domestic bond yields, which makes property trusts’ income streams comparatively less attractive relative to risk-free government bonds. That dynamic weighed on names including Stockland and Charter Hall at various points during the week, even as the broader materials and financial sectors showed greater resilience.
With the Reserve Bank of Australia’s September policy meeting now looming as the next major catalyst for the local market, investors are likely to remain focused in the coming week on further domestic economic data, along with ongoing developments in the Middle East conflict and their implications for global oil prices and inflation expectations. The combination of a potential RBA rate increase, continued geopolitical uncertainty, and lingering volatility in individual stocks following this week’s dramatic moves in names like Corporate Travel Management and Regis Healthcare suggests Australian equities may continue to experience elevated volatility heading into the back half of September.

Foxconn says third quarter to outperform market expectations on AI strength

South Korea exports surpass annual record as AI chip boom drives shipments

Shambles: the story behind York’s famously wonky street

Broadcom: The $350 Billion AI Signal Has A $29 Billion Footnote

Poland crypto bill blocked after third presidential veto





-
 Crypto World20 hours ago
Bitcoin price stalls near $82K as key resistance holds
-

 Politics20 hours ago
Best Gaming Laptops, CPUs, TVs, And Keyboards To Upgrade Your Set Up For GTA VI
-

 Tech21 hours ago
The Birds Outside, Drawn For You Automatically
-

 Crypto World1 day ago
IMF Says El Salvador’s Post-Review Bitcoin Purchases Used No Public Funds
-
 Crypto World21 hours ago
U.S. added stronger than expected 162,000 jobs in August as labor market bounced back
-

 Sports1 day ago
Alexandre Pato consortium’s Northampton Town investment approved
-

 Sports19 hours ago
Golden Eaglets Drawn in Group B for 2026 WAFU B U17 Championship
-

 Sports1 day ago
Commanders’ Chig Okonkwo is a top breakout fantasy football candidate
-
 Crypto World19 hours ago
XRP price breaks falling channel as bulls target $1.53
-

 Politics1 day ago
A new European chapter for Gibraltar
-

 Politics23 hours ago
The House | Bin the lectures, bring gossip and be ready to banter: how the new PM should prepare for his Trump encounter
-

 Politics19 hours ago
How To Avoid Winter Colds: 4 Everyday Habits That Spread Germs, Says Pharmacist
-

 Crypto World19 hours ago
From warning to listing: UK’s largest retail investment platform opens access to crypto ETNs
-

 Tech21 hours ago
A Worthy Android Ereader, With Some Tradeoffs
-

 Crypto World20 hours ago
FinCEN flags $12.7B tied to Southeast Asia crypto investment scams
-

 Crypto World20 hours ago
Trezor Data Breach Impacts 67,000 More US Customers
-

 Politics1 day ago
33 Cosy Autumn Home Decor Ideas: Blankets, Pumpkin Decorations, And Candles
-

 Sports1 day ago
Seven wickets in 21 balls: Sri Lanka’s Chamari Athapaththu scripts history with record-breaking spell
-

 Tech20 hours ago
How To Edit Claude’s Memory
-

 Tech20 hours ago
beyerdynamic AVENTHO Y Debuts at IFA 2026 and Makes Wireless Headphones Less Disposable
You must be logged in to post a comment Login