

Business
How Benares Restaurant Brings British and Indian Ingredients Together

The story of two culinary cultures finding common ground on a plate in Mayfair
On paper, British seasonal produce and Indian spice do not seem like an obvious pairing. One tradition is rooted in the rolling farmlands and coastal waters of the United Kingdom. The other draws from a subcontinent of extraordinary culinary complexity, where spice routes shaped history and flavour has always been taken seriously. And yet, at Benares Restaurant in London, the two have been in conversation for over two decades, producing food that feels entirely natural rather than forced.
Starting With the Best Ingredients
The foundation of the menu at Benares Restaurant is a simple yet demanding principle: start with the finest seasonal British produce available and apply the depth of Indian spices and techniques to bring out its fullest potential. This is not fusion for its own sake. It is a considered approach to cooking that asks what happens when two great culinary traditions are allowed to genuinely influence one another.
The ingredients speak for themselves. Cornish seafood, prized for its freshness and quality, finds new expression through coastal Indian preparations that understand how to work with delicate fish and shellfish without overwhelming them. Welsh lamb, rich and full-flavoured, meets the warmth of Kashmiri spice in combinations that feel neither jarring nor predictable. Scottish venison, one of Britain’s finest game offerings, is handled with the kind of precision that Indian tandoor and tikka techniques have refined over centuries. Kentish vegetables, grown in some of England’s most productive farmland, are given new life through spice combinations that have been perfected over generations.
The Art of Balance
What makes this approach work at Benares Restaurant is balance. Indian cuisine is not a single flavour profile. It is a vast and varied tradition that encompasses everything from the delicate, milk-based preparations of the north to the fiery, coconut-rich dishes of the south. Applied thoughtfully, its techniques and spice combinations can enhance almost any ingredient without erasing its essential character.
British produce, at its best, has a clarity and honesty of flavour that responds well to this kind of treatment. A hand-dived scallop from Cornwall does not need to be disguised. It needs a preparation that respects its natural sweetness while adding a layer of complexity that makes it memorable. At Benares Restaurant, that is precisely what it gets.
Seasonality as a Guiding Principle
The menu at Benares Restaurant changes with the seasons, and this is where the British influence becomes most tangible. Indian cuisine has its own relationship with seasonality, of course, but the specific produce of the British Isles brings a deeply local rhythm to the kitchen. Spring brings one set of possibilities, autumn another. The kitchen works within those constraints and finds them generative rather than limiting.
This seasonal approach also means that no two visits to Benares Restaurant are quite the same. The philosophy remains constant, but its expression shifts with what is best and freshest at any given time of year. For regular guests, that is part of the appeal.
Two Traditions, One Table
The broader story of British and Indian culinary culture is, of course, long and complicated. The two have been intertwined for centuries, through trade, history, and the movement of people between the two countries. Benares Restaurant does not engage directly with that history, but it is worth acknowledging that when Indian and British ingredients meet on a plate in Mayfair, they are not strangers to one another.
What Benares Restaurant offers is something more refined than a historical footnote. It is a genuine and ongoing culinary dialogue, conducted at the highest level, between two traditions that have more in common than is sometimes assumed. The result is food rooted in both and diminished by neither, served at one of London’s most enduring fine dining destinations.

In a consultation paper released on Thursday, the market regulator said it has observed instances where illiquid stocks develop significantly different prices across exchanges because circuit limits continue to be calculated using stale closing prices on exchanges where no trading occurs.
Currently, stock exchanges independently apply price bands based on their own previous closing prices. While this works smoothly for actively traded stocks, SEBI noted that it can create distortions in stocks that do not trade on one exchange for several days.
The regulator illustrated a scenario where a stock continues to hit upper circuits and gain value on one exchange, while remaining stuck within an outdated price band on another exchange due to lack of trading. Over time, this can lead to substantial price divergence between the same stock across exchanges and may even result in non-trading on one platform.
To address the issue, Sebi has proposed a harmonised framework for determining both the base price used in the pre-open call auction session and the applicable price bands.

Under the proposal, if a stock trades on all exchanges or remains untraded on all exchanges on a particular day, each exchange will continue using its own latest closing price for calculating the next day’s price band.
However, if a stock trades on only one exchange, all other exchanges where the stock did not trade will be required to adopt the closing price from the exchange where trading occurred for setting the next day’s price bands and pre-open session base price.In cases where a stock trades on two or more exchanges but remains untraded on one or more others, the exchanges without trading activity will use the closing price from the exchange that recorded the highest trading volume in that stock.
The proposals stem from recommendations made by Sebi’s Secondary Market Advisory Committee (SMAC), which discussed the issue during its April 2026 meeting.
Sebi has also proposed that stock exchanges enter into agreements or other arrangements to facilitate the sharing of closing-price data and ensure smooth implementation of the framework.
The regulator said the move is intended to improve price discovery and prevent unnecessary price distortions in stocks listed on multiple trading venues.
Public comments on the consultation paper have been invited until July 2.
FOX Business host Larry Kudlow discusses the commander-in-chief’s handling of the Middle East conflict on ‘Kudlow.’
High drama today as President Trump called off the Iranian bombing and announced that a deal with Iran is imminent from his Truth Social posting that “Discussions and final points have been, in both concept and great detail, approved by all parties involved.” That’s America, Israel, Iran and all of the Gulf states involved in the war.
The president spoke about this today at the White House: “The Strait will officially open as soon as we sign, which could be soon. Very soon, maybe over the weekend in Europe.”
Stock markets soared; oil prices fell. Mr. Trump also noted on his Truth Social that “the Naval Blockade will remain in full force and effect until this Transaction is finalized.”
And my great hope is that no money is given to Iran for a long time, until they prove that their behavior is changing. And frankly, while I applaud President Trump’s diplomatic endeavors — such as negotiating with bombs — I have nothing but skepticism about Iran following through on their promises.
Just yesterday, the United Nation’s nuclear watchdog blasted Iran for failing to allow inspection and verification of their weapons and their weapons-grade uranium. That’s an old story.
And Mr. Trump, in whatever the deal turns out to be, is surely going to want complete denuclearization, some kind of end to their enriched uranium, as well as reopening the strait toll free and an end to Iran’s state sponsorship of terrorism in Israel and throughout the Middle East.
Fox News contributor Liz Peek and Rep. French Hill, R-Ark., speak on President Trump’s push for the third reconciliation bill on ‘Kudlow.’
As President Reagan always said, trust but verify. And as both Reagan and Mr. Trump believe, peace through strength.
Meanwhile, one of the really neat developing stories, regardless of any Iranian deal, is Mr. Trump’s secret supply of oil tankers going through presumably the Oman Channel of the Hormuz Strait.
As Mr. Trump said yesterday and has corroborated by a number of oil watchdogs, some 200 ships transited the strait for a total of about 100 million barrels of oil over the past month.
That comes to about 3 million barrels per day. Recall that world oil supply and demand intersect at about 100 million barrels per day.
And the prior closing of the Strait took about 20 percent, or about 20 million barrels per day, off the market. So the supply shortages drove oil prices way up.
Yet this story is surreptitiously changing. Mr. Trump riffed about it earlier today: “Over the last month, we’ve been, taking our ships, big ships, quietly at night. You guys didn’t know that? Pretty cool. Right? As a captain, he knows about more about ships than I do. But it’s pretty cool. He turned off the lights.”
Mr. Trump added: “We bombed their radar and everything so they couldn’t see what was going on. And we took out, some nights, 25 ships, some nights, 15 days. Last 4 or 5 nights we did 25, 22, 21, 26, 18 and 14. Who else would remember those numbers? Nobody.” It’s “a lot of ships,” he concluded.
Podcast host Ben Ferguson discusses President Donald Trump nomination of Jay Clayton, former SEC chairman and current U.S. Attorney, as director of national intelligence on ‘Kudlow.’
It’s a great story. Now administration sources tell me about a dozen ships per night are being moved through the strait. I’m doing some arithmetic now — that’s 360 a month.
Using the same ratio of the first month’s secret passage, that will get us about 180 million additional barrels of oil which would come to roughly 6 million barrels a day. That’s big stuff. Remember we’re 20 million barrels short because of the closing of the Strait.
Now last month’s 3 million barrel, perhaps this month’s 6 million barrels, that’s 9 million additional barrels per day to reduce the 20 million barrel shortfall.
These extra oil supplies are bringing oil prices down in the market place and will continue on a steady basis if it keeps up. Gasoline prices will be following in tow.
It’s a silver lining for the temporary inflation bulge. And it’s gonna make stocks strong and over time, interest rates softer.
Mr. Trump’s secret sauce. Think of it.

Inflation Is Boosting Next Year’s Social Security Raise. Here’s the New Estimate.
Business
Zebra Technologies Corporation (ZBRA) Presents at 46th Annual William Blair Growth Stock Conference – Slideshow

Zebra Technologies Corporation (ZBRA) Presents at 46th Annual William Blair Growth Stock Conference – Slideshow
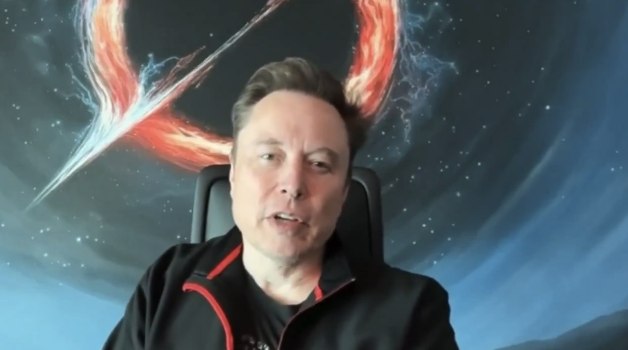
NEW YORK — Elon Musk highlighted a Grok response as “Based Grok” in a widely shared post on X, laughing at the AI model’s candid and humorous take on a sensitive topic involving Amazon leadership and diversity practices.
Musk’s reaction, posted Thursday, quickly gained traction with thousands of likes and reposts, underscoring the ongoing conversation around Grok’s less censored approach compared to other AI systems. The exchange reflects Musk’s vision for Grok as a “maximum truth-seeking” AI that avoids heavy political correctness.
The specific Grok output that prompted Musk’s laughter addressed a query involving Amazon CEO Andy Jassy and broader corporate diversity initiatives. Grok delivered a sharp, meme-style response that pulled no punches, aligning with the “based” internet slang for unapologetically straightforward or anti-woke commentary.
Grok’s Distinctive Style
Grok, built by Musk’s xAI, is designed to be helpful, truthful and less restricted than competitors like ChatGPT. Musk has frequently contrasted Grok with other models, emphasizing its willingness to tackle controversial topics without defaulting to corporate safety filters.
In recent months, Grok has gained attention for responses that challenge mainstream narratives on politics, culture and corporate practices. Users have shared numerous examples of Grok providing direct answers where other AIs refuse or hedge. Musk’s endorsement amplifies these moments, positioning Grok as a counterweight to what he views as overly sanitized AI systems.
Context of the Viral Post
The post included a link to a Grok share featuring the AI’s take on the topic. Replies flooded in with users praising Grok’s “no filter” mode, sharing similar experiences and creating memes around the exchange. Some highlighted Grok’s ability to generate humorous, context-aware content that resonates with certain audiences.
Dan Bilzerian and other influencers amplified the post, contributing to its rapid spread. The interaction highlights how Grok has carved out a niche among users seeking less moderated AI interactions.
xAI’s Broader Mission
xAI, founded by Musk in 2023, aims to understand the universe and build AI that prioritizes truth over political or commercial pressures. Grok powers features across the X platform and is available to premium subscribers. The model has undergone several updates, with improvements in reasoning, humor and real-time knowledge integration.
Musk has positioned Grok as a “based” alternative in the AI landscape, frequently criticizing other systems for what he describes as excessive wokeness or censorship. This philosophy resonates with segments of X’s user base and has driven significant engagement for the platform.
Industry Reactions and Implications
The viral moment has sparked discussions about AI safety, bias and the role of humor in large language models. Critics argue that unfiltered responses risk spreading misinformation or harmful content, while supporters view Grok’s style as refreshing and more honest.
Major AI companies continue refining their guardrails, balancing helpfulness with responsibility. Grok’s approach represents a different philosophy — one that leans toward maximum curiosity and minimal censorship, with users ultimately responsible for interpreting outputs.
The exchange also underscores Musk’s influence across technology and media. As owner of X and leader of xAI, Tesla and SpaceX, his comments on AI carry significant weight and often drive industry conversations.
User Engagement and Cultural Reach
Posts praising Grok’s response generated substantial interaction, with users sharing screenshots, remixing content and debating the merits of different AI models. The humor in Grok’s reply — described by many as “cooking” or “unhinged in the best way” — contributed to its virality.
This type of engagement helps xAI gather feedback for model improvements while boosting visibility for Grok. The AI’s ability to produce timely, culturally relevant content strengthens its appeal among younger users and meme-savvy audiences.
Future of Grok and xAI
xAI continues developing Grok with plans for more advanced capabilities, including enhanced reasoning and multimodal features. Musk has teased upcoming versions that could rival or surpass current leaders in specific domains.
The company’s focus on truth-seeking aligns with Musk’s broader critiques of Big Tech and legacy media. As AI becomes more integrated into daily life, the debate over appropriate levels of filtering and bias will likely intensify.
For now, Musk’s “Based Grok” post serves as both entertainment and a statement of intent. It reinforces Grok’s brand as the AI willing to say what others won’t, for better or worse.
Public and Expert Views
Reactions from users ranged from amusement to thoughtful commentary on AI development. Some experts noted that while humor and directness are valuable, maintaining accuracy and avoiding harm remains crucial for any widely used system.
The incident adds to ongoing discussions about AI alignment, free speech and corporate responsibility in technology. Musk’s willingness to publicly engage with and endorse Grok’s outputs helps shape public perception of the tool.
As Grok evolves, its balance between helpfulness, truthfulness and entertainment will determine its long-term success. Musk’s active promotion ensures the model stays in the spotlight, driving both adoption and scrutiny.
The viral exchange between Musk and Grok exemplifies the dynamic, conversational nature of modern AI interactions. It also highlights how platform owners can directly influence product perception through personal engagement. As the AI landscape matures, moments like this will continue shaping user expectations and industry standards.
Grok’s unfiltered style has proven effective at generating buzz and loyalty among specific user segments. Whether this approach scales responsibly while maintaining quality will be a key test for xAI in the coming months. For now, the “Based Grok” moment provides another example of the AI’s ability to capture attention in a crowded digital space.
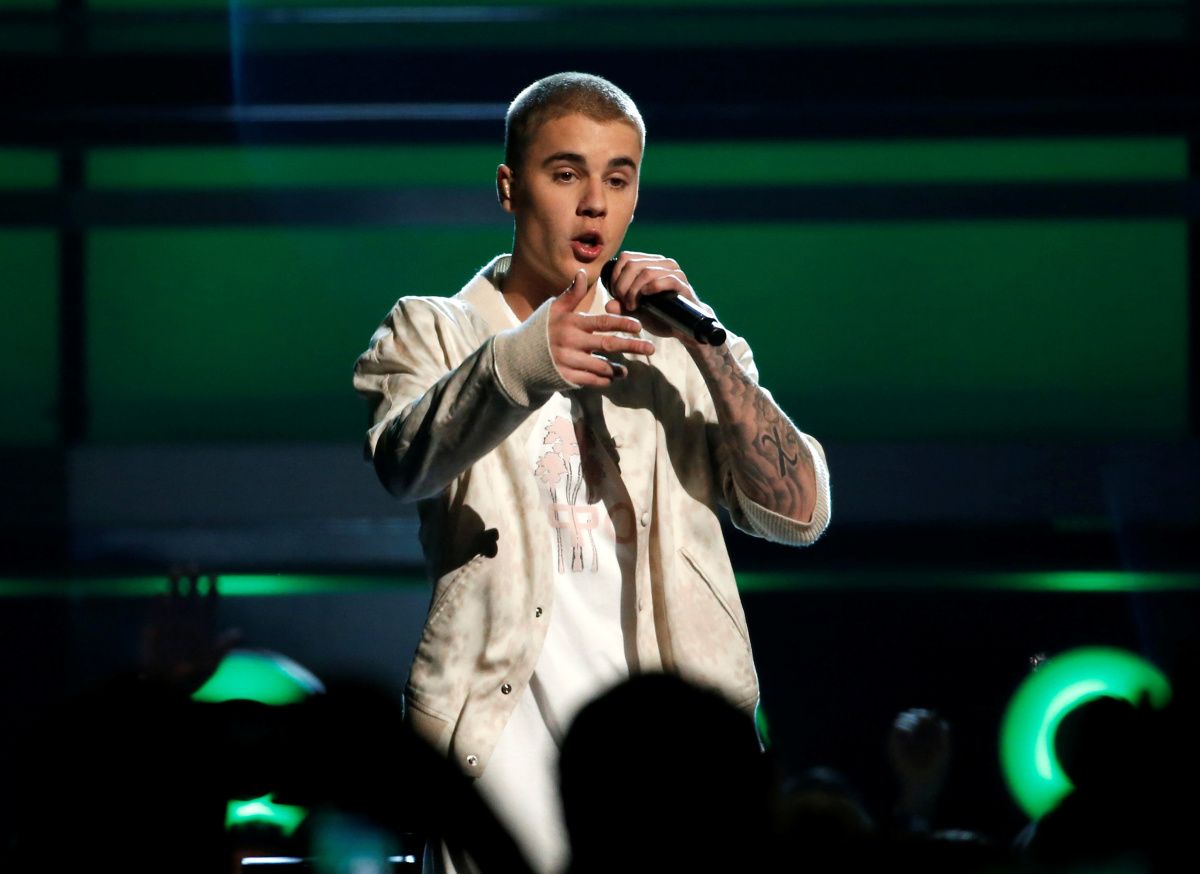
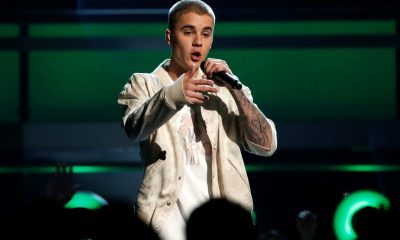
LOS ANGELES — Justin Bieber is signaling a potential return to the stage in 2026 after several years of limited live performances, with recent studio activity, an updated official tour page and industry discussions pointing toward a major comeback tour in North America and beyond.
The pop superstar, who canceled the remaining dates of his Justice world tour in 2022 due to Ramsay Hunt syndrome, has spent the past year focusing on health, family and selective creative work. According to multiple reports, Bieber has been logging studio time in Los Angeles with longtime collaborator Benny Blanco and other producers, suggesting new music is in development that could support a tour.
Industry sources indicate his team has held preliminary conversations with major promoters including Live Nation and AEG Presents about potential arena routing for 2026. While no official dates or venues have been announced, the refreshed tour section on Bieber’s website and increased social media activity have fueled speculation among fans and observers.
Health Recovery and Cautious Re-Entry
Bieber’s path back to touring has been deliberate. After the Ramsay Hunt diagnosis caused facial paralysis and forced him to step away from the road, the singer prioritized recovery and mental health. Recent appearances at private events and charity performances have served as low-pressure opportunities to test his stage readiness and vocal stamina.
These controlled outings have been viewed positively by those close to the situation, demonstrating that Bieber is rebuilding confidence without rushing into a full-scale production. Reports suggest any 2026 tour would incorporate more rest days and flexible scheduling to protect his well-being, reflecting a broader industry shift toward sustainable touring practices.
New Music as Foundation for Tour
Studio sessions with high-profile collaborators signal that Bieber is preparing material suited for live performance. His previous albums have blended pop, R&B and electronic elements, with hits like “Sorry,” “Love Yourself” and “Peaches” remaining streaming staples. New music could bridge his established catalog with current trends, helping re-engage both longtime fans and newer audiences.
A new project would likely be timed to support touring, following the traditional model where album releases drive ticket demand. Billboard and Variety have reported that Bieber’s team is organizing sessions with writers and producers aligned with contemporary pop and R&B, indicating a thoughtful evolution of his sound.
Tour Logistics and Potential Routing
If a 2026 tour materializes, it is expected to focus initially on major North American arenas, with possible expansion to stadiums in high-demand markets. Cities like New York, Los Angeles, Chicago, Miami and Toronto would likely feature prominently, leveraging Bieber’s strong fan base in urban centers.
Festival appearances at events such as Coachella or Lollapalooza could serve as strategic warm-ups or headline slots. Promoters are reportedly exploring flexible routing that balances revenue potential with artist health considerations, including longer breaks between shows.
Ticket demand for a Bieber tour would likely be intense, with verified fan presales and dynamic pricing expected to manage inventory and reduce secondary market speculation. VIP packages offering early entry, soundchecks and merchandise could form a significant portion of revenue, consistent with modern pop touring economics.
Fanbase Evolution and Cultural Relevance
Bieber’s fanbase has matured alongside the artist. Many who discovered him as a teenager now follow him as adults, creating opportunities for more reflective and emotionally layered performances. His openness about mental health and personal struggles has strengthened connections with supporters who value authenticity.
The singer’s marriage to Hailey Bieber and recent public appearances have portrayed a more settled phase of life, potentially influencing the tone of new music and stage presentation. Fans have expressed excitement about a return that balances nostalgia with forward-looking material.
Industry Significance
A Bieber tour in 2026 would represent a major event for the live music sector, which has rebounded strongly post-pandemic but continues navigating challenges around artist wellness and ticket affordability. His ability to sell out arenas remains proven, and a successful run could set benchmarks for other pop acts planning comebacks.
Promoters view Bieber as a reliable draw with global appeal, capable of generating substantial gross revenue across multiple territories. The tour would also boost ancillary businesses including merchandise, hospitality and local economies in host cities.
Challenges and Considerations
Health remains the primary variable. Any tour would need to prioritize sustainable pacing to avoid repeating past issues. Production scale, travel logistics and vocal demands would be carefully calibrated based on medical guidance.
Competition for audience attention is fierce, with numerous major artists planning activity in 2026. Bieber’s strategy of building anticipation through selective appearances and new music could help cut through the noise and maximize impact.
Looking Ahead
While no official announcement has been made, the combination of studio work, website updates and promoter conversations strongly suggests movement toward a 2026 return. Fans are advised to monitor Bieber’s official channels for confirmed details, as premature speculation can lead to disappointment.
The potential tour represents more than a series of concerts — it symbolizes Bieber’s resilience and evolution as an artist who has navigated fame, health challenges and personal growth under intense public scrutiny. For many, it would mark a welcome reconnection with a performer whose music has soundtracked significant cultural moments over the past decade and a half.
As preparations continue behind the scenes, anticipation builds for what could be one of the most notable live music events of 2026. Bieber’s measured approach to re-entering the spotlight suggests a thoughtful, sustainable chapter that prioritizes longevity over immediate spectacle. The coming months will reveal whether the pieces align for a full-scale return to the stage that millions of fans have been awaiting.
Industry watchers expect further developments in the second half of 2026, potentially including new singles or visual content that teases the direction of the next era. For now, the signs point to a deliberate and promising buildup to Justin Bieber’s return to live performance, offering hope for fans eager to experience his catalog and new material in a concert setting once again.
The evolution of Bieber’s career from teen sensation to adult artist navigating health and personal priorities mirrors broader changes in the music industry. His potential 2026 tour could serve as a case study in sustainable stardom, balancing commercial success with personal well-being in an era where artist longevity is increasingly valued.
Among the prominent buyers was Motilal Oswal Equity Opportunities Fund Series II, which acquired 6.41 lakh shares. Other institutional investors participating in the transaction included Mirae Asset Mutual Fund, ITI Mutual Fund, Edelweiss Mutual Fund, Trust Mutual Fund, and Goldman Sachs Asia Equity Portfolio.
Mobius Investment Trust Plc and MCP Emerging Markets Fund LP also picked up stakes in the company.
Recently, Motilal Oswal initiated coverage on GNG Electronics with a positive outlook, highlighting the company’s leadership position in the global refurbished electronics market.
The brokerage said GNG Electronics has built a scaled refurbishment platform spanning about 46 countries, with nearly 95% of revenue generated through institutional and B2B channels. The company operates an integrated sourcing, refurbishment and distribution model, which helped it deliver a volume CAGR of around 43% between FY23 and FY26.
Motilal Oswal believes the refurbished personal computer market is entering a structural growth phase, supported by affordability, improving product reliability, AI-driven hardware replacement cycles and regulatory initiatives such as right-to-repair and extended producer responsibility (EPR) norms.
The brokerage noted that GNG’s in-house refurbishment capabilities allow advanced repairs, higher recovery rates and better realizations. Despite nearly tripling volumes over FY23-26, warranty-related costs have remained low, indicating strong process controls and execution.The broker expects the company to deliver a 26% revenue CAGR, 31% EBITDA CAGR and 36% profit CAGR between FY26 and FY28, driven by higher volumes, margin expansion, improving recovery economics and lower financing costs.
GNG Electronics operates under the “Electronics Bazaar” brand and is among the largest organized players in the refurbished ICT devices market, serving enterprises, retailers and distributors across global markets.
(Disclaimer: Recommendations, suggestions, views and opinions given by the experts are their own. These do not represent the views of Economic Times)

NEW YORK — U.S. stock futures climbed early Thursday after the United States conducted fresh strikes against Iran, with investors appearing to price in limited immediate economic disruption even as geopolitical tensions escalated and inflation remained elevated.
Futures attached to the Dow Jones Industrial Average rose 0.3%, while S&P 500 futures gained 0.4% and Nasdaq 100 futures advanced 0.3%. The modest uptick followed a downbeat Wednesday session in which major indexes fell on the latest consumer price data and renewed Middle East conflict concerns.
U.S. Central Command confirmed the strikes, describing them as a response to Iran’s “unwarranted and continued aggression.” President Donald Trump had earlier signaled strong action, stating that Iran would “pay the price” for stalled negotiations. The developments come amid a four-month conflict that has disrupted energy flows through the Strait of Hormuz, driven oil prices higher and raised inflation risks.
Inflation Data Adds to Market Pressure
The latest Consumer Price Index report showed prices rising 4.2% year-over-year in May, the highest reading since 2023. Energy costs accounted for more than 60% of the monthly increase, underscoring how geopolitical events are feeding directly into household budgets.
“Today’s CPI data confirmed our expectation that higher energy costs and their ripple effects on the costs of transportation and food would drive May headline CPI higher,” said Atsi Sheth, chief credit officer at Moody’s Ratings.
Core inflation, excluding food and energy, rose 2.9% annually, in line with expectations but still well above the Federal Reserve’s 2% target. The data reinforced bets that the Fed would hold rates steady at its June meeting, with traders now watching Thursday’s Producer Price Index report for further clues on pricing pressures.
Corporate Earnings in Focus
After the bell Wednesday, Oracle reported earnings that beat expectations but saw its stock decline on disappointing cloud sales growth. The mixed results highlighted ongoing selectivity among investors, with strong fundamentals rewarded while any softness in forward-looking metrics punished.
The market’s attention now turns to Friday’s expected debut of SpaceX, positioned as potentially the largest IPO in history. Elon Musk’s rocket company listing could inject fresh optimism into technology and space-related sectors if demand proves robust.
Geopolitical and Oil Market Impact
The renewed U.S. strikes and Iran’s announcement closing the Strait of Hormuz to vessels have roiled energy markets. Gold prices whipsawed, rising as much as 1.1% before reversing course, while oil benchmarks reflected supply disruption fears.
The conflict, now in its fourth month, has raised the likelihood of interest rate hikes as central banks combat inflation spillover from higher energy costs. Markets remain sensitive to any escalation that could further tighten global oil supplies.
Sector and Index Performance
Technology and growth stocks showed relative resilience in futures trading, while energy names gained on higher crude prices. Defensive sectors such as consumer staples and utilities attracted interest as investors sought safety amid uncertainty.
The Dow Jones Industrial Average had closed lower on Wednesday, as did the S&P 500 and Nasdaq Composite. The pullback reflected a combination of inflation worries and geopolitical risk premium being added to asset prices.
Broader Economic Outlook
The U.S. economy continues navigating a delicate balance between solid growth and persistent price pressures. Last week’s employment data showed a labor market that remains broadly in balance, but rising costs are squeezing real wages and consumer confidence.
Heather Long, chief economist at Navy Federal Credit Union, captured the sentiment many Americans are feeling. “Americans are getting squeezed financially. This isn’t just ‘bad vibes’ about the economy. There is real pain, especially for middle-class and lower-income households.”
The Federal Reserve faces a challenging path, with officials likely to emphasize data dependence in upcoming communications. Any signals of patience on rate cuts could support equities, while hints of further tightening might weigh on risk assets.
Investor Sentiment and Strategy
Market participants appear to be adopting a wait-and-see approach, balancing geopolitical risks against corporate earnings resilience and potential policy support. The modest futures gains suggest some optimism that the latest strikes will not immediately escalate into broader conflict.
Diversification remains key, with many advisers recommending exposure to both growth and defensive sectors. Energy and commodity-related names may benefit from higher prices, while technology and consumer discretionary stocks could face pressure if inflation persists.
Looking Ahead
Thursday’s Producer Price Index report will provide additional insight into wholesale inflation trends, potentially influencing Friday’s market open. The SpaceX IPO, if it proceeds as anticipated, could mark a significant milestone for private space companies and draw substantial attention from retail and institutional investors alike.
As the week progresses, focus will remain on any further developments in the Middle East and their potential spillover into energy markets and broader economic conditions. Central bank officials and corporate executives will also weigh in, shaping expectations for the remainder of 2026.
The current environment underscores the interconnected nature of geopolitics, inflation and financial markets. While futures point to a modestly positive open, volatility is likely to persist as new information emerges on both the conflict front and domestic economic indicators.
Investors will continue monitoring the situation closely, seeking to navigate a landscape where external shocks can quickly alter sentiment and asset prices. For now, the modest rebound in futures reflects a market attempting to look beyond immediate headlines toward longer-term fundamentals and policy responses.
The interplay between military developments, energy costs and monetary policy will remain central to market direction in the days ahead. As always, participants are advised to maintain disciplined approaches amid evolving risks and opportunities.
First SpaceX employee Tom Mueller reflects on the company’s early years ahead of its IPO on ‘The Claman Countdown.’
SpaceX’s first employee, Tom Mueller, said the company’s record-breaking IPO will be a “life-changing” moment for employees during an exclusive interview with “The Claman Countdown” on Thursday.
SpaceX will start trading on the NASDAQ on Friday in the largest IPO in history. The IPO is expected to be priced at $135 per share and aims to raise $75 billion, valuing the company at $1.77 trillion.
“Elon always said that ‘Your salary is one thing, but it’s the equity that’s gonna be worth something.’ And we are all like, ‘Yeah, okay someday,” Mueller said. “That day is here. It’s great.”
WHY IT’S INEVITABLE THAT ELON MUSK WILL BE A TRILLIONAIRE
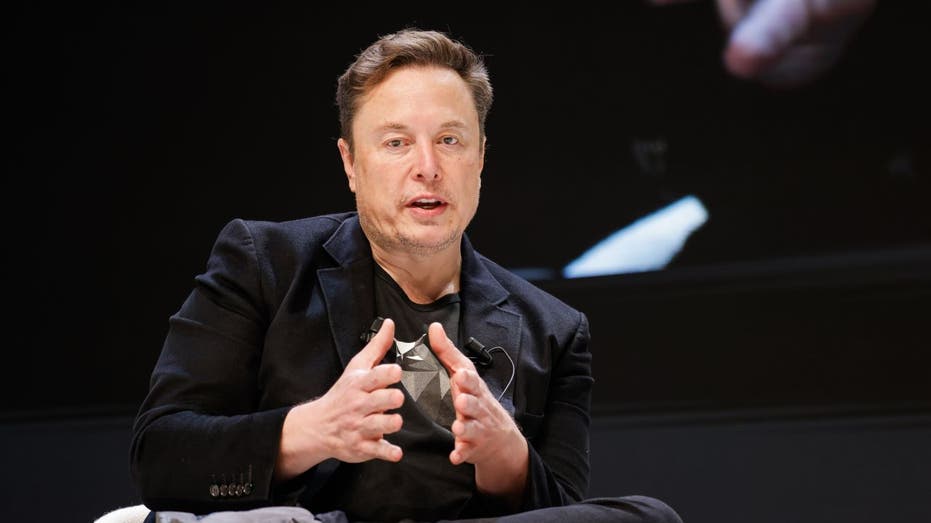
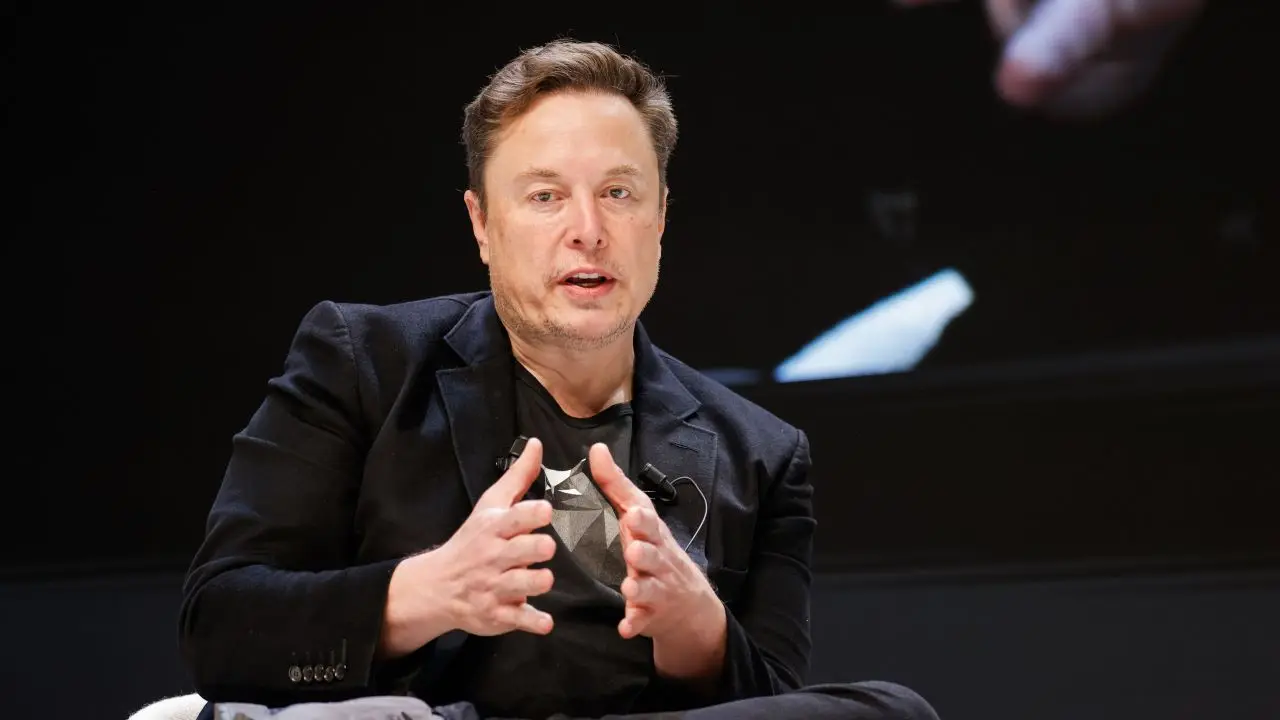
Chief Technology Officer of X Elon Musk speaks at a conference on June 19, 2024, in Cannes, France. (Richard Bord/WireImage / Getty Images)
SpaceX will trade under the ticker symbol SPCX, and its employees could become millionaires based on their access to stock options.
The IPO will create more than 4,000 new millionaires among current and former employees of the 24-year-old space giant, according to estimations.
“We’re having a little party tomorrow morning at 6 a.m. We’re going to ring our own bell and celebrate with a bunch of early SpaceX employees,” Mueller told FOX Business.
SpaceX’s founder, Elon Musk, could possibly become the world’s first trillionaire following the historic market debut.
SPACEX TO SEND STARSHIP TO MARS NEXT YEAR, ELON MUSK CONFIRMS
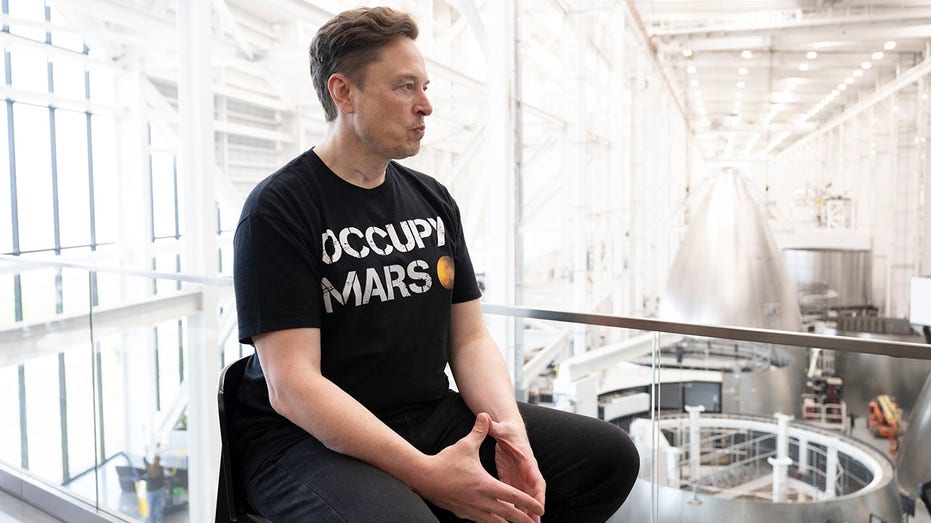
BROWNSVILLE, TX-MAY 27: Elon Musk is photographed at SpaceX in Brownsville, Texas (Photo by Marvin Joseph/The Washington Post via Getty Images) (Marvin Joseph/The Washington Post via Getty Images / Getty Images)
His estimated net worth could rise 26%, from roughly $793 billion to $1 trillion, based on the market value of the assets he owns, including SpaceX and Tesla.
Mueller, who was hired as SpaceX’s first employee in 2002, led projects including the Merlin Engine that powers Falcon 9, the Raptor Engine that powers Starship and other key propulsion systems.
He said joining SpaceX from a large, bureaucratic space corporation was “refreshing” and gave him more freedom to innovate, describing Musk’s company culture as energizing.
“I had just come from TRW, a big space corporation, and getting away from the bureaucracy and able to move fast and really be energized and do the type of product development that we wanted to do… It was really refreshing and fun, actually, even though it was hard. It was actually really satisfying,” Mueller said.
FIRST PRIVATE SPACEX POLAR MISSION SPLASHES DOWN NEAR CALIFORNIA
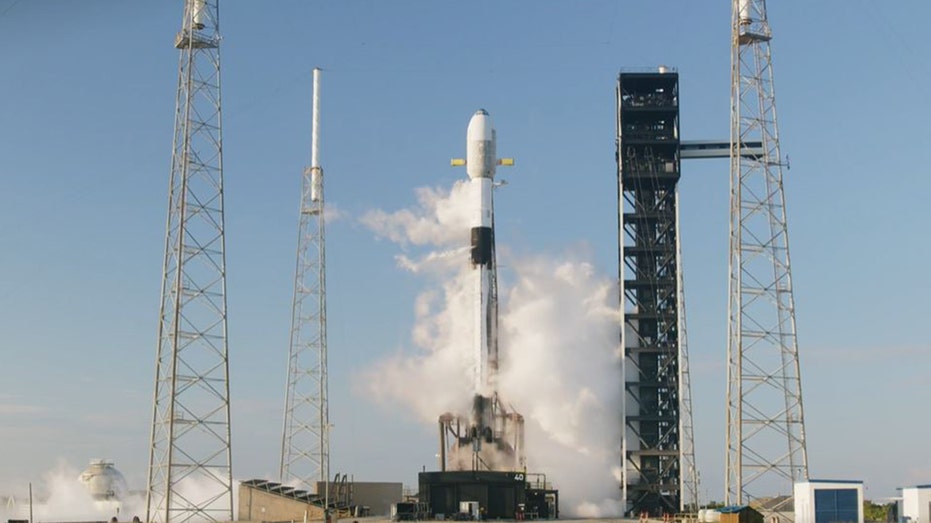
SpaceX’s Falcon 9 rocket prepares for liftoff from Cape Canaveral Space Force Station in Florida on Sunday, Aug. 31, 2025. (SpaceX)
Mueller explained how a pivotal moment in 2008 helped pull the company, which generated $18.7 billion in revenue in 2025, back from the brink of bankruptcy.
“2008 was actually the year that we finally made orbit, the fourth flight of Falcon 1 made orbit that year, and it was also when we were just about out of money and that flight saved us,” he told “The Claman Countdown.”
“Then we really got regimented and started flying Falcon 9, the rocket that’s currently flying. And it’s been the most reliable rocket in history. So, it really all came together. And now look where we’re at now. We’re a trillion-dollar company.”

Traders work on the floor of the New York Stock Exchange (NYSE) the day after the Dow fell nearly 1,000 points as the conflict in Iran continues on June 11, 2026 in New York City. Markets were up over 200 points in morning trading. (Spencer Platt/Getty Images / Getty Images)
GET FOX BUSINESS ON THE GO BY CLICKING HERE
Major investors and corporations are eagerly awaiting SpaceX’s market debut, with BlackRock placing an order for at least $5 billion in shares, according to The Wall Street Journal.
IPO investors can make trades as soon as the SpaceX stock goes live on Friday.
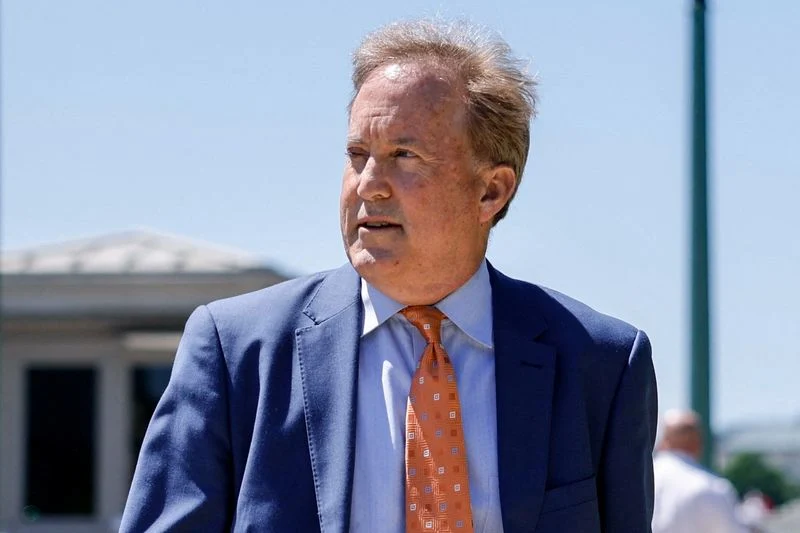

US judge blocks Ken Paxton’s lawsuit against Democratic fundraising platform ActBlue
Shock for Japan as captain Wataru Endo withdraws from World Cup squad and retires from international football after injury blow | Football News

Tecno Pova 8 Brings a Dot Matrix Light Show to Its Camera Island

Z Cash Crash..Are You Investing In Crypto?


-

 Fashion6 days ago
Weekend Open Thread: Evereve – Corporette.com
-
 Crypto World6 days ago
Jensen Huang Approves Samsung, SK Hynix, and Micron for NVIDIA (NVDA) HBM4 Memory Supply
-

 Crypto World4 days ago
Anatomy of the June crypto crash: Fed, Iran, Saylor
-
 Entertainment5 days ago
The Best Mystery Series of All Time Is Surging on Streaming 30 Years After It Ended
-

 NewsBeat4 days ago
Alexander Zverev wins the French Open to finally earn a 1st Grand Slam title
-

 Tech6 days ago
Suspicious Polyfill login prompts pop up on Toshiba, Muji websites
-
 Crypto World5 days ago
Senator Cynthia Lummis Calls CLARITY Act the Most Consequential Financial Legislation of This Generation
-

 Tech7 days ago
Microsoft launches MXC, an OS-level sandbox for AI agents, with OpenAI and Nvidia already on board
-
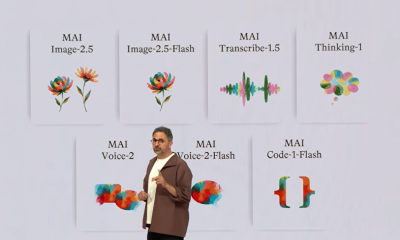
 Tech5 days ago
Microsoft unveils seven homegrown AI models in new bid for ‘long term self-sufficiency’
-
 Business7 days ago
(VIDEO) Justin Bieber Delivers Surprise Happy Birthday Serenade to Diners at Los Angeles Mexican Restaurant
-
 Business5 days ago
The Pain Points Taking a Fragile Tech Rally Down a Notch
-
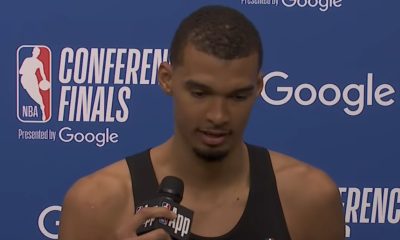
 Business4 days ago
High Stakes for Wembanyama as New York Pushes for 3-0 Lead
-
 NewsBeat4 days ago
Alexander Zverev conquers demons and outlasts Flavio Cobolli to win French Open for first major title
-
 Crypto World3 days ago
Eli Lilly (LLY) Stock Surges 4% Following Breakthrough Sleep Apnea Trial Results
-

 Tech6 days ago
Von der Leyen’s AI envoy pick draws conflict-of-interest fire
-

 Tech6 days ago
Meta steals a tactic from Tesla and builds data centers in tents
-
Crypto World7 days ago
LBank Surpasses 25 Million Users Worldwide as AFA Partnership Continues to Drive Global Growth
-

 Tech6 days ago
Hackers now exploit SolarWinds Serv-U flaw to crash servers
-

 Crypto World4 days ago
Trump’s AI Ownership Plan Could Benefit Anthropic at OpenAI’s Expense
-
 Sports2 days ago
Bangladesh beat Australia after 20 years in ODIs, register only their second win over six-time world champions | Cricket News
You must be logged in to post a comment Login