The kitchenware brand says it has outperformed the market
One of kitchenware brand ProCook’s portfolio of stores (Image: Derby Telegraph)
Kitchenware brand Procook has reported a strong fourth quarter as it continues to invest in new branch openings around the UK. The Gloucestershire-headquartered retailer saw a 19.2 per cent rise in revenue to £18.5m for the 12 weeks to the end of March, driven by sales online and in store.
The results mean the company posted full-year revenue of £85.5m, ahead of market expectations, and up 23 per cent year on year and 11.8 per cent on a like-for-like basis. EBITDA – a measure of performance – is estimated to be slightly ahead of expectations for the full year.
Procook told investors on Tuesday (April 14) it had “outperformed” the UK kitchenware market by more than 13 percentage points during quarter four, and by more than 20 per cent across the full year. It also said operating profit was set to be in line with expectations.
The brand opened three new stores in the fourth quarter, increasing its total UK retail estate to 78 branches, of which eight are now in a new bigger format. Last year, the company, which sells cookware, tableware, electricals and kitchen gadgets, spent £5.3m on store openings as it looks to target 100 outlets in the UK.
Advertisement
Lee Tappenden, chief executive of Procook, said: “We have delivered a strong fourth quarter and full year performance, significantly outperforming the market and improving profitability, whilst accelerating investment in our new store opening programme.
“Strong revenue growth across both our expanding store footprint and online reflects substantial increases in new customers attracted to our brand and repeat purchases, demonstrating that our unique product proposition and service focus is really resonating with consumers.”
Mr Tappenden said while the business was “mindful” of the potential macroeconomic effects of any protracted geopolitical instability, it would “look forward” to building its market share.
“Our ongoing store openings, initiatives to increase brand awareness, and disciplined investments to support growth, position us well to deliver on our medium term ambition of 100 stores, £100m revenue and 10 per cent operating profit margin,” he added.
Mumbai: Individual participation in Indian equities showed a sharp divergence amid sharp swings in January-March, with their direct equity ownership falling for the third straight quarter, while mutual fund holdings, fuelled by retail flows surging to a fresh record. Foreign ownership fell to a 14-year low of 16.1% in the March quarter, underscoring their risk-off sentiment towards domestic stocks, while domestic institutional holdings rose to another all-time high.
The combined holdings of retail and high net worth investors in NSE-listed companies declined to a five-year low of 9.1% in the March quarter, down from 9.3% in the December quarter, according to data from primeinfobase.com. Meanwhile, mutual fund holdings rose for the 11th straight quarter to an all-time high of 11.46% from 11.1% in December.
“This indicates individual investors may be preferring to invest through a professional fund manager,” said Pranav Haldea, managing director, PRIME Database Group.
Agencies
SHARP SWINGS IN JAN-MARCH Combined holdings of retail investors & HNIs in NSE-listed cos down to a 5-year low of 9.1% in Q3 l Foreign ownership slips to a 14-year low
Across NSE-listed companies, the retail investors’ direct holdings declined from 7.25% to 7.12% in the March quarter – declining for the third quarter in a row. HNI ownership slipped to 1.9% from 2.03% in the same period. These investors cut their stakes, especially in mid-cap and small-cap companies amid the severe market sell-off in March–marking the worst monthly fall since March 2020, the onset of the Covid-19 wave and the record-breaking rally in precious metals.
Advertisement
Live Events
“HNIs turned discerning and retail investors flocked to other assets such as gold, silver and REITs due to the lethargic equity returns,” said Riddhiman Jain, managing director and head – investment strategy and solutions, Waterfield Advisors. In the quarter ended March 31, Nifty plunged 14.5% while Nifty Midcap 150 and Smallcap 250 dropped 12.7% and 14.4%, respectively.The Nifty 500 index tumbled 14%. Gold rose 6.7%, and Silver gained 6.1%.
But for the purchases by domestic institutions, including mutual funds, pension funds and insurance companies, among others, the equity fall would have been sharper.
“The strong SIP culture prompted investors to allocate money to fund managers through passive investing instead of tracking price movements and reacting to market fluctuations due to fear,” said Siddarth Bhamre, head of research, Asit C Mehta Intermediates. “Retail money through mutual funds will continue to bail out the market. Until their invested corpus doesn’t witness an erosion, SIP money is expected to continue.”
Performance data shown represents past performance. Investment returns and principal value will fluctuate, so that fund shares, when redeemed, may be worth more or less than the original cost. Past performance does not guarantee future results and current performance may be lower or higher than the performance data shown. Visit Madison Funds or call 800.877.6089 to obtain performance data current to the most recent month-end.
Tickers
Portfolio Management
Faraz Farzam, CFAPortfolio Manager, AnalystIndustry since 1999
Advertisement
Aaron Garcia, CFAPortfolio Manager, AnalystIndustry since 2002
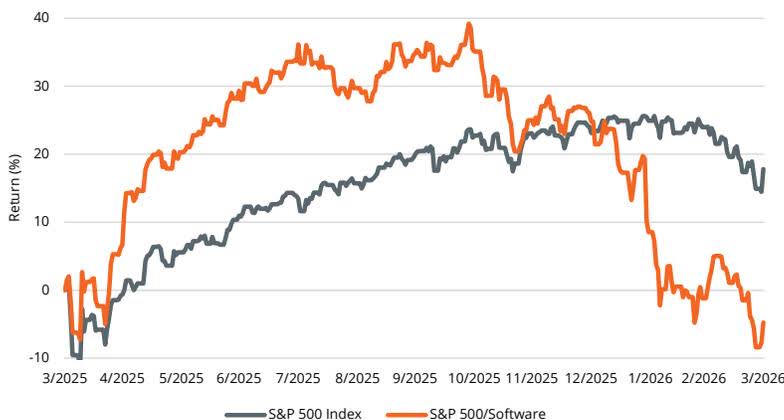
Software vs. S&P 500 Index
Although the information in this report has been obtained from sources that the firm believes to be reliable, we do not guarantee its accuracy, and any such information may be incomplete or condensed. All opinions included in the report constitute the authors’ judgment as of the date of this report and are subject to change without notice. This report is for informational purposes only and is not intended as an offer or solicitation with respect to the purchase or sale of any security and is not investment advice.
Madison Asset Management, LLC does not provide investment advice directly to shareholders of the Madison Funds. Opinions stated are informational only and should not be taken as investment recommendation or advice of any kind whatsoever (whether impartial or otherwise).
Advertisement
Why Madison Small Cap Fund?
High-quality portfolio of quality, durable, and growing small companies
Concentrated portfolio with a flexible mandate ($100M to $15B market cap)
Proprietary Risk Portal and valuation discipline framework help manage downside risk
Advertisement
Average Annual Total Returns ¹,² (%)
3-Months
YTD
1-Year
3-Year
5-Year
10-Year
Since Inception
Class R6
0.10
0.10
2.38
7.75
—
—
2.08
Class I
0.10
0.10
2.29
7.67
1.19
—
1.74
Class Y
0.10
0.10
2.19
7.58
1.07
7.68
11.93
Class A without sales charge
0.00
0.00
1.94
7.31
0.83
—
7.55
Class A with sales charge
-5.76
-5.76
-3.88
5.20
-0.36
—
6.59
Russell 2000
0.89
0.89
25.72
13.05
3.77
9.88
—
Russell 2500
2.04
2.04
23.45
13.25
5.48
10.58
—
Calendar Year Returns ¹,² (%)
2016
2017
2018
2019
2020
2021
2022
2023
2024
2025
Class Y
18.04
8.90
-12.09
24.67
23.09
20.52
-24.36
16.05
21.94
-7.12
Russell 2000
21.31
14.65
-11.01
25.52
19.96
14.82
-20.44
16.93
11.54
12.81
Russell 2500
17.59
16.81
-10.00
27.77
19.99
18.18
-18.37
17.42
12.00
11.91
Performance data shown represents past performance. Investment returns and principal value will fluctuate, so that fund shares, when redeemed, may be worth more or less than the original cost. Past performance does not guarantee future results and current performance may be lower or higher than the performance data shown. Visit Madison Funds or call 800.877.6089 to obtain performance data current to the most recent month-end.
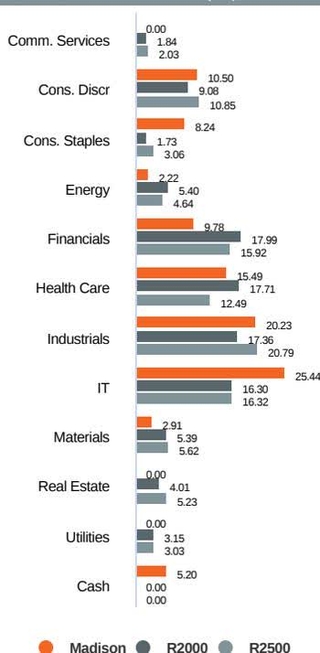
Sector Allocation (%)
Advertisement
5-Year Risk Metrics (%) – Class Y
Madison
R2000
Standard Deviation
17.17
19.98
Up Capture
77.47
100.00
Down Capture
85.10
100.00
Beta
0.80
1.00
5-Year Risk Metrics (%) – Class Y
Advertisement
Madison
R2500
Standard Deviation
17.17
18.67
Up Capture
79.37
100.00
Down Capture
93.18
100.00
Beta
0.88
1.00
Investment Objective
The Madison Small Cap Fund seeks long-term capital appreciation.
Class
Ticker
Inception
Exp. Ratio
R6
MSCRX
02/28/22
0.92%
I
MSCIX
02/26/21
1.00%
Y
BVAOX
12/16/96
1.10%
A
MASMX
08/31/19
1.35%
Expense ratios are based on the fund’s most recent prospectus.
Advertisement
Fund Characteristics
Number of Holdings
49
EPS Growth Rate (Trailing 3-Year, %)
8.14
Price/Earnings Ratio (Trailing 1-Year)
25.20
Price/Earnings Ratio (Forward 1-Year)
17.16
Annual Portfolio Turnover (%)
35.00
Active Share vs. R2000 (%)
97.40
Active Share vs. R2500 (%)
96.83
Wtd. Avg. Market Cap ($ billions)
5.88
Net Assets ($ millions)
146.53
Distribution Frequency
Annual
Portfolio Management
Faraz Farzam, CFAPortfolio Manager, AnalystIndustry since 1999
Advertisement
Aaron Garcia, CFAPortfolio Manager, AnalystIndustry since 2002
Madison FundsP.O. Box 219083Kansas City, MO 64121-9083800.877.6089
Consultant andAdvisor Services
550 Science DriveMadison, WI 53711888.971.7135
This material is authorized for use only when preceded or accompanied by the current prospectus. Before investing, please fully consider the investment objectives, risks, charges and expenses of the fund. This and other important information is contained in the current prospectus, which you should carefully read before investing or sending money. For more complete information about Madison Funds® obtain a prospectus from your financial adviser, by calling 800.877.6089 or by visiting Madison Funds to view or download a copy.
Advertisement
Performance results prior to August 30, 2019 for the Class Y shares are based on the performance of the Predecessor Fund, which was reorganized into the Class Y shares of the Fund on August 30, 2019. Performance for Class A shares was deemed to be new effective August 31, 2019 as a result of the reorganization. Madison waived 0.04% of the Fund’s annual services fee from August 31, 2019 through February 27, 2021. Investment returns reflect this fee waiver, without which returns would have been lower.
Madison lists the performance of the Predecessor Fund and accounting survivor of the Reorganization for the following reasons: Continuity of Fund portfolio managers through the Reorganization; Substantially the same investment objective and investment strategies between the Fund and the Predecessor Fund; Substantially similar investment policies between the Fund and the Predecessor Fund; A similar expense ratio (excluding acquired fund fees and expenses).
Madison Asset Management, LLC does not provide investment advice directly to shareholders of the Madison Funds.
Madison Funds are distributed by MFD Distributor, LLC, member of FINRA. Portfolio data is as of the date of this piece unless otherwise noted and holdings are subject to change.
Advertisement
“Madison” and/or “Madison Investments” is the unifying tradename of Madison Investment Holdings, Inc., Madison Asset Management, LLC (“MAM”), and Madison Investment Advisors, LLC (“MIA”). MAM and MIA are registered as investment advisers with the U.S. Securities and Exchange Commission. Madison Funds are distributed by MFD Distributor, LLC. MFD Distributor, LLC is registered with the U.S. Securities and Exchange Commission as a broker-dealer and is a member firm of the Financial Industry Regulatory Authority. The home office for each firm listed above is 550 Science Drive, Madison, WI 53711. Madison’s toll-free number is 800-767-0300.
Any performance data shown represents past performance. Past performance is no guarantee of future results.
This report is for informational purposes only and is not intended as an offer or solicitation with respect to the purchase or sale of any security and is not investment advice.
Non-deposit investment products are not federally insured, involve investment risk, may lose value and are not obligations of, or guaranteed by, any financial institution. Investment returns and principal value will fluctuate.
Advertisement
An investment in the Fund is subject to risk and there can be no assurance the Fund will achieve its investment objective. The risks associated with an investment in the Fund can increase during times of significant market volatility. The principal risks of investing in the Fund include mid cap risk, equity risk, growth and value risks, capital gains realization risks to taxpaying shareholders, foreign security and emerging market risk, depository receipt risk, and market risk. Investing in small, mid-size or emerging companies involves greater risks not associated with investing in more established companies, such as business risk, significant stock price fluctuations and illiquidity. More detailed information regarding these risks can be found in the Fund’s prospectus.
Upon request, Madison may furnish to the client or institution a list of all security recommendations made within the past year.
Indices are unmanaged. An investor cannot invest directly in an index. They are shown for illustrative purposes only, and do not represent the performance of any specific investment. Index returns do not include any expenses, fees or sales charges, which would lower performance.
Russell 2000 Index: small cap market index that measures the performance of the smallest 2,000 companies in the Russell 3000® Index.
Advertisement
Russell 2500 Index: broad index, featuring 2,500 stocks that cover the small and mid-cap market capitalizations of the U.S. equity universe.
Russell Investment Group is the source and owner of the trademarks, service marks and copyrights related to the Russell Indexes. Russell® is a trademark of Russell Investment Group.
EPS Growth (Trailing 3-yr): the annual rate at which a company’s earnings have grown over the past three years.
Price-to-Earnings Ratio: measures how expensive a stock is. It is calculated by the weighted average of a stock’s current price divided by the company’s earnings per share of stock in a portfolio.
Advertisement
Portfolio Turnover: a measure of the trading activity in an investment portfolio—how often securities are bought and sold by a portfolio.
Active Share: the percentage of a portfolio that differs from its benchmark index. It can range from 0% for an index fund that perfectly mirrors its benchmark to 100% for a portfolio with no overlap with an index.
Wtd Avg. Market Cap: the size of the companies in which the fund invests. Market capitalization is calculated by the number of a company’s shares outstanding times its price per share.
Standard Deviation: a statistical measurement of dispersion about an average, which, for a portfolio, depicts how widely the returns varied over a certain period of time. Investors may use the standard deviation of historical performance to understand the range of returns for a portfolio. When a portfolio has a higher standard deviation than its benchmark, it implies higher relative volatility. Standard deviation has been calculated using the trailing monthly total returns for the appropriate time period. The standard deviation values are annualized.
Advertisement
Upside Capture Ratio: a fund’s performance in up markets relative to its benchmark. The security’s upside capture return is divided by the benchmark’s upside capture return over the time period.
Downside Capture Ratio: a fund’s performance in down markets relative to its benchmark. The security’s downside capture return is divided by the benchmark’s downside capture return over the time period.
Beta: a measure of the fund’s sensitivity to market movements. A portfolio with a beta greater than 1 is more volatile than the market, and a portfolio with a beta less than 1 is less volatile than the market.
Wesfarmers and Built Living have entered into a joint venture to create a precast concrete manufacturing plant in Neerabup, as part of state government move to speed-up apartment construction in WA.
ET Intelligence Group: Federal Bank is set to gain from a high-quality customer base through its acquisition of Standard Chartered Bank’s (SCB) credit card portfolio, with 95% of incoming customers holding a credit score of 700 or above. This ensures relatively low-risk, creditworthy additions to the bank’s books. The new portfolio also brings a younger demographic, with 25-30% of customers in the 25-35 age bracket and 35-40% in the 35-45 range, giving the bank a long runway to deepen relationships over time. However, customer attrition will be a challenge as seen during the Axis Bank-Citi deal.
On April 30, Federal Bank said it would acquire a select credit card portfolio from Standard Chartered Bank, with nearly 75% of the card base concentrated in India’s top eight cities.
Since most of these customers currently hold only a single product, Federal Bank will explore opportunities to cross-sell by offering services such as savings account, personal loans, investment products, and other banking services.
Agencies
On Cards The lender aims to deepen customer ties via savings, loans and investment offerings
“These are emerging affluent and affluent customers. Even converting a portion of these 4.5 lakh cardholders into savings account holders or cross-selling assets and investment products presents a huge opportunity,” Virat Diwanji, national head of consumer banking, Federal Bank told ET. Over 60% of these customers have a relationship of more than three years, he said. History however shows that cross-selling may not be an easy task. For instance, during the HDFC Bank-HDFC merger, nearly 70% of HDFC customers did not have a banking relationship with HDFC Bank. This highlighted the execution challenge in converting single-product customers into multi-product relationships.
Advertisement
Live Events
Federal Bank will also face the challenge of retaining Standard Chartered customers and the costs associated with it. After the Axis Bank-Citibank deal was announced, a portion of customers chose not to migrate, highlighting the risk of attrition in such transactions. Similarly, to retain Standard Chartered customers, Federal Bank may need to offer certain incentives, which could put pressure on its profitability. The bank’s management has said that customer attrition has been considered as a key factor, and it remains optimistic that the level of attrition will not be high. The limited geographic presence of Kochi-headquartered Federal Bank could be another concern in the minds of Standard Chartered customers. While Federal Bank has a strong presence in southern India, its footprint is not as prominent in other parts of the country. In FY25, 1,099 or over two-third of its total 1,589 branches including extension counters were located in the southern states of Kerala, Tamil Nadu, Karnataka, Andhra Pradesh and Telangana. Once signed, the deal is expected to be complete in five-six months. Federal Bank announced better than expected results in the March quarter with net profit beating analysts estimates. Net profit jumped 22% to Rs 1,259 crore while net interest income rose 33% to ‘3,174 crore.
Mumbai: Adani Cement, the country’s second biggest manufacturer of the primary building material, would focus on ramping up utilisation and rationalising its existing capacities while calibrating its capital expenditure, the company’s senior management said on Monday. “Maybe, the target plan of FY28, it could move a year or two. On a safer side I would say FY30,” said the chief executive officer, Vinod Bahety.
Cement offtake is typically linked to real GDP growth, and often runs at a function of about 1.2 times to the long period growth average. Companies typically begin stepping up capacities when utilisation crosses the 80% threshold consistently.
The Adani Group had forayed in the Indian cement space in 2022 with the largest-ever acquisition in the materials space, bringing on board around 70 million tonnes of capacity after it purchased Ambuja Cements and ACC, the latter being the oldest manufacturer of the commodity in the subcontinent. It had earlier forecast doubling capacity to 140 million tonne by FY28, and late last year, raised this target to 155 million tonne. “What matters is how you are able to ramp up volume from overall existing assets, and I have substantial headroom. Even if I hit 120 million tonnes by the end of 27, it will give me a good leverage of the overall market opportunity,” Bahety said. The company currently has a production capacity of 109 million tonne.
MINNEAPOLIS — The Minnesota Timberwolves provided a cautious but optimistic update Monday on superstar Anthony Edwards’ left knee injury, confirming he remains week-to-week with a hyperextension and bone bruise as the team prepares for its Western Conference semifinal series against the San Antonio Spurs without its leading scorer. Edwards has begun light on-court activity but has not yet participated in full-contact practice, leaving his availability for the series opener uncertain and placing added pressure on a Timberwolves roster already missing key depth.
Edwards suffered the injury in Game 4 of Minnesota’s first-round series against the Denver Nuggets on April 26 when he landed awkwardly contesting a shot. An MRI the following day revealed no ligament damage — significant relief for a franchise with championship aspirations — but confirmed the hyperextension and bone bruise that typically require two to six weeks of recovery. Head coach Chris Finch reiterated the week-to-week designation after Monday’s practice, noting Edwards had completed non-contact shooting and movement work but remained sidelined from scrimmages.
“We’re being smart with Ant,” Finch said. “He’s progressing well, but we’re not rushing anything. The bone bruise needs time to calm down. We’ll evaluate daily and see where he’s at.” Finch added that Edwards has been “itching” to return and has been an active presence on the sideline, offering leadership and insight to teammates during film sessions and practices.
The Timberwolves advanced past Denver in six games without Edwards, relying on strong defensive efforts and contributions from Julius Randle, Mike Conley and Anthony Edwards’ replacement in the starting lineup. However, facing Victor Wembanyama and a dangerous Spurs team presents a significantly tougher test. Edwards averaged 28.8 points per game during the regular season and remains the Timberwolves’ primary offensive engine, particularly in transition and isolation situations.
Advertisement
Medical experts note that bone bruises can cause lingering soreness and reduced explosiveness, especially for explosive athletes like Edwards. The 24-year-old All-Star has dealt with lower-body issues throughout the season, including patellar tendinitis in his right knee earlier in the year, making the medical staff particularly cautious. Edwards has earned the nickname “the Wolverine” for his reputation as a quick healer, but the organization is prioritizing long-term health over a rushed playoff return.
Edwards himself expressed optimism in limited comments to reporters. “I’m doing everything they ask me to do,” he said. “I want to be out there with my brothers, but I’ve got to trust the process.” He has been engaged in daily rehabilitation, including blood flow restriction training, mobility work and progressive strength exercises focused on quadriceps activation and joint stability.
The timing could not be more critical for Minnesota. The Spurs series tips off Tuesday in San Antonio, with Game 2 on Thursday. If Edwards misses the first two games, the Timberwolves must find ways to slow Wembanyama while generating enough offense to stay competitive. Randle has stepped up in Edwards’ absence, but replacing the All-Star’s scoring punch and playmaking remains a tall order against San Antonio’s length and versatility.
Finch has not ruled out a mid-series return. Optimistic scenarios point to Games 3 or 4 in Minneapolis if Edwards progresses rapidly in the coming days. Pessimistic timelines could see him sidelined for the entire series, testing the Timberwolves’ depth in what many analysts view as a challenging matchup. The organization continues to provide daily availability updates while shielding specific medical details to maintain a competitive edge.
Advertisement
The injury adds complexity to an already demanding postseason. Edwards missed time earlier in the year with right knee issues but returned strongly. His current left knee protocol balances aggressive treatment with caution, incorporating advanced recovery modalities and daily monitoring of swelling and strength metrics. The Timberwolves have access to top sports medicine resources, including functional testing and imaging to guide progression.
Fans and analysts have reacted with a mixture of concern and hope. Social media buzzed with support for Edwards and calls for patience from the organization. Many point to Minnesota’s resilience without him in the closing games against Denver as a positive sign, though sustaining that level against the Spurs will be difficult. Edwards’ explosiveness and scoring ability remain vital for the Timberwolves’ championship aspirations.
Playoff history shows that star injuries can swing series outcomes. Teams like the 2023 Nuggets proved resilient without key pieces at times, but consistent elite production usually proves decisive in later rounds. For Minnesota, the goal is to stay competitive early in the series while positioning Edwards for an impactful return if the matchup extends. Finch has emphasized patience but acknowledged the challenge of replacing Edwards’ unique skill set.
As Game 1 approaches, the basketball world watches closely. Edwards’ knee injury, while not season-ending, forces strategic adjustments and tests team depth at the worst possible time. His potential mid-series return could shift momentum, but the Timberwolves must first prove they can compete without their All-Star. The coming days will reveal much about the franchise’s resilience and Edwards’ recovery timeline.
Crude oil held most of a surge that at one point took prices above $115 a barrel as the US and Iran exchanged fire, jolting a four-week-old ceasefire and raising concerns that Middle East tensions could escalate again.
Brent edged 0.5% lower to just under $114 a barrel at the open Tuesday as escalating tensions around the Strait of Hormuz raised fears about high energy prices and global inflation. Australian shares opened lower, with markets closed in Japan, South Korea and mainland China. US equity-index futures were little changed after the S&P 500 Index retreated from its record on Monday.
During the US session, Treasuries fell, sending 30-year yields to the highest since July, as traders boosted wagers that the Federal Reserve will have to reverse course and raise interest rates to curb inflation following a surge in oil prices. There will be no cash trading during Asian hours due to the holiday in Japan.
Renewed tensions threaten to inject fresh volatility into markets after a month-long rally that helped global equities erase war-related losses and climb to record highs on strong earnings from megacap technology companies. Investors remain focused on the Strait of Hormuz, a key waterway that has been blocked for months, keeping energy prices elevated and risking higher inflation and slower economic growth.
Advertisement
“Even if the immediate conflict de-escalates, we expect the aftershocks will remain with us for some time,” said Darrell Cronk at Wells Fargo Investment Institute. “The effects — on energy prices, industrial activity, and geopolitical risk premia — are unlikely to fade quickly.”
Live Events
The US fought off Iran’s attacks as it facilitated the passage of two vessels through the Strait of Hormuz. Meantime, the UAE blamed an Iranian drone strike for a fire at its Fujairah port and issued several missile alerts for the first time since a truce between Washington and Tehran took hold.


You must be logged in to post a comment Login