
Business
SPYT: ETF Offering A 20% Yield From S&P 500 Option Spreads (NYSEARCA:SPYT)

PM Images/DigitalVision via Getty Images

SPYT Fast Facts
Defiance S&P 500 Target Income ETF (SPYT) is an actively managed options income ETF launched on 3/7/2024. SPYT has a distribution rate of 20% and a total expense ratio of 0.92%. Distributions are paid on a monthly basis. It is a small ETF, with $149 million in assets under management (“AUM”). Nonetheless, the average daily trading volume of $2.6 million is sufficient for long term investment and tactical allocation as well. The issuer Defiance ETFs is an asset management firm founded in 2018 with 80 ETFs in three categories: leveraged, income, and thematic funds.
Strategy
As described in the prospectus by Defiance ETFs, the fund primarily invests in an ETF tracking the S&P 500 Index, and sells daily credit call spreads on the Index.
A covered call strategy consists of investing in an asset and selling one or more call options on it for a premium. The fund’s call spread strategy adds a long call with a higher strike price for the same expiration date. Buying an additional call reduces the premium income, but also limits the risk of loss on the short call should the underlying asset price surge beyond expectations. Such a strategy enhances income with option premium, and also limits the gains from the underlying index.
In SPYT, call spreads are rolled on a daily basis with near-term expiration. The fund may also gain synthetic exposure to the index by using call options.
The fund targets net premiums of 1.7% per month and an annual cash distribution of approximately 20%. There is no guarantee to reach the target, though. Distributions may include a significant part of return of capital (“ROC”). Distributions in excess of the fund’s earnings will reduce the net asset value, and therefore the dollar amount of future distributions. The portfolio turnover rate was 31% in the most recent fiscal year. I will use State Street SPDR S&P 500 ETF Trust (SPY) as a benchmark.
Portfolio
As an example from 6/5/2026, the fund has 99.9% of net asset value in iShares Core S&P 500 ETF (IVV), and two positions in S&P 500 Index calls (one short and one long) expiring the same day, with strike prices of 7584.31 (short) and 7599.48 (long). The index was at 7553.68 at the previous daily close, meaning the income-generating short call is 0.4% above the closing price, and the protective long call is 0.6% above the closing price. Options will have been rolled if you read this on a later date, and these percentages may change depending on market conditions.
Performance
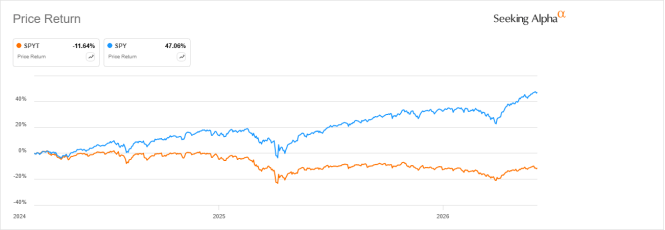
SPYT has underperformed SPY by 4.1% annualized from 3/14/2024 to 6/5/2026, with slightly lower volatility and similar maximum drawdown.
Data: Portfolio123
Like for most, if not all, buy-write ETFs, the high yield doesn’t offset price underperformance. Excluding distributions, SPYT has lost 11.6% from inception to 6/5/2026, while SPY is up 47%.
SPYT vs SPY price return (Seeking Alpha)
Monthly distributions have been on a slow downtrend following the share price, as plotted below.
SPYT distribution history (Chart: author; data: Defiance ETFs)
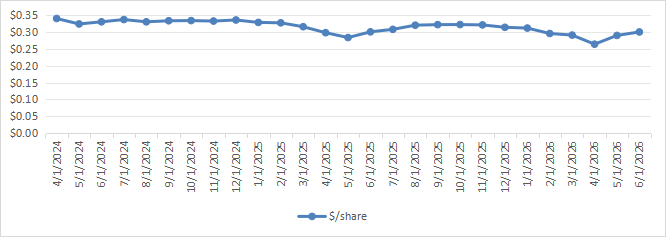
Based on the fund’s 19a-1 notice for May 2026, the distribution of that month was 100% Return of Capital (“ROC”). High ROC may have a negative impact on a shareholder’s tax payment. For example, non-resident aliens (“NRA”) may be initially submitted to withholding tax, with an adjustment at year-end that is not always automatic, depending on the broker.
Competitors
The next table compares characteristics of SPYT and four income ETFs based on daily rolled S&P 500 options:
- ProShares S&P 500 High Income ETF (ISPY)
- Roundhill S&P 500 0DTE Covered Call Strategy ETF (XDTE)
- TappAlpha S&P 500 Growth & Daily Income ETF (TSPY)
- Defiance S&P 500 Weekly Distribution ETF (WDTE)
This list is not intended to be exhaustive. In particular, ETFs with less then $50 million in AUM have been excluded. I have also added two non daily-rolled S&P 500 options income ETFs:
* calculated with Portfolio123 from 8/21/2024 to match inception dates.
SPYT is ranked third in yield, sixth in total return between 8/21/24 and 6/5/26, and fourth in Sharpe ratio (a measure of risk-adjusted performance). Investors focused on yield may prefer WDTE or XDTE (with the inconvenient of higher volatility and faster price erosion), while risk-averse investors may choose SPYI or GPIX for total return, lower volatility and asset preservation.
Takeaway
Defiance S&P 500 Target Income ETF (SPYT) aims at a 20% yield with a daily options strategy on the S&P 500 Index. SPYT is best-suited for investors seeking a high and stable yield and accepting significant erosion in asset value, which may be offset by reinvesting a part of distributions.
- Pro: High and stable yield, sufficient liquidity.
- Cons: high expense ratio, high ROC, price erosion.
This article answers three main questions about SPYT:
- What criteria does SPYT have for its holdings selection?
- How does SPYT compare to similar ETFs?
- Which investors is SPYT suitable for?
Editor’s note: This article is intended to provide a general overview of the ETF for educational purposes only and, unlike other articles on Seeking Alpha, does not offer an investment opinion about the ETF.


TransUnion EVP Mohamed Abdelsadek sells $1.99 million in company stock
HRT Financial LP sells $897,030 of Twin Vee PowerCats (VEEE) stock
Business
Nasdaq Falls 1.45% as Oil Surge From Iran Attack and Chip Selloff Rattle Markets Before Fed Decision
The Nasdaq Composite fell 1.45%, or 360.37 points, to 24,516.54 in midday trading Wednesday, as surging oil prices tied to renewed fighting between the United States and Iran combined with another sharp selloff in chipmaker stocks to weigh on technology shares ahead of the Federal Reserve’s latest interest rate decision.
A resurgence in Middle East violence drove Brent crude oil prices above $90 a barrel, stoking fresh concerns about inflation and pushing bond yields higher, a combination that dimmed investor appetite for riskier assets across markets. The broader S&P 500 also declined, while the Nasdaq 100 index, which tracks the largest non-financial companies on the exchange, lost 1.2% during the session.
Wednesday’s losses extended a chip-sector selloff that has now stretched across multiple trading sessions. The rout began after reports emerged Monday of a breakthrough in Chinese chipmaking technology, sending semiconductor stocks tumbling and dragging the Nasdaq toward correction territory even before Wednesday’s additional pressure from rising oil prices. The selling intensified further following disappointing earnings from South Korean chipmaker SK Hynix, whose second-quarter profit rose sixfold from a year earlier but still fell short of analyst expectations, a shortfall that reinforced investor concerns about whether the artificial intelligence spending boom driving much of the past year’s chip-sector profits may be beginning to moderate.
The chip selloff has hit Asian markets especially hard in recent sessions. South Korea’s SK Hynix plunged more than 14% at one point this week, while Samsung Electronics fell more than 13% during the same stretch, contributing to the KOSPI index’s worst two-day decline on record. That selling pressure spread to U.S. premarket trading, with Micron Technology down more than 4%, Nvidia off roughly 1.2%, and Intel and Advanced Micro Devices each falling more than 3% at various points during the week’s trading.
Tuesday’s session had shown a notably different pattern from Wednesday’s broader decline, with the Dow Jones Industrial Average climbing 0.93% even as the Nasdaq slipped 0.63%, reflecting a rotation into more defensive, less technology-heavy sectors. Health care and financial stocks reached fresh intraday all-time highs Tuesday, with the State Street Health Care Select Sector SPDR ETF gaining 2.7% and the State Street Financial Select Sector SPDR ETF adding 0.5%, as investors continued shifting away from the technology trade that has dominated market gains for much of the past year.
Even amid the broader tech-sector weakness, some individual stories stood out. Apple briefly became only the second publicly traded company in history to reach a $5 trillion market capitalization on Tuesday, achieving the milestone less than a year after first surpassing $4 trillion, with the achievement coming just a day before the company was scheduled to report its own quarterly earnings.
Not all of Wednesday’s market pressure traced back to chips and oil. Target shares fell more than 7% after the retailer forecast a larger-than-expected decline in full-year sales, while Estee Lauder dropped more than 5% following weaker-than-expected 2026 earnings-per-share guidance, adding company-specific disappointments to the broader macroeconomic headwinds weighing on stocks.
Wednesday’s trading also comes as investors brace for a heavy stretch of corporate earnings from some of the technology sector’s largest AI infrastructure spenders. Results from Microsoft and Meta Platforms, due later this week, are expected to offer additional clarity on whether massive capital expenditure commitments tied to artificial intelligence are translating into revenue growth substantial enough to justify current spending levels, a question that has increasingly weighed on sentiment toward mega-cap technology stocks in recent weeks.
The market’s attention is also fixed on the Federal Reserve’s policy announcement due later Wednesday. JPMorgan’s base case scenario calls for a hawkish hold from the central bank, which the bank has said could leave the S&P 500 roughly flat to slightly lower depending on the specific language used in the accompanying statement. Analysts have said that if Fed Chair Kevin Warsh signals openness to a rate cut at the central bank’s September meeting, markets could respond positively, whereas a more cautious tone emphasizing persistent inflation risks, particularly given this week’s spike in oil prices, could extend the current bout of selling pressure.
Despite Wednesday’s decline, market breadth data from earlier in the week showed a more complicated picture than the headline index moves alone suggest. During Tuesday’s session, 382 individual holdings within a broader market index advanced even as chip stocks were “getting hammered,” according to market commentary, illustrating how narrowly concentrated the technology-sector selling has been relative to the performance of the broader market.
Not every chip-related stock has suffered equally during the recent downturn. Sandisk has remained the best-performing stock in the S&P 500 for the year despite the recent sector-wide selloff, still up more than 360% year to date, according to market data, underscoring the significant divergence in performance even among companies operating within the same beleaguered sector.
With the Fed decision, Middle East tensions and a wave of major technology earnings all converging within the same trading week, investors are broadly expecting continued volatility across the Nasdaq and broader U.S. equity markets in the sessions immediately ahead, as the market works to reconcile competing signals about interest rate policy, geopolitical risk and the durability of the artificial intelligence investment cycle that has driven much of the past year’s technology-sector gains.


The company’s new product line features coffee pods and cold brew formats.
Starbucks on Wednesday raised its full-year outlook after reporting its fourth straight quarter of same-store sales growth.
For fiscal 2026, Starbucks now expects adjusted earnings per share in a range of $2.55 to $2.65, up from its prior outlook of $2.25 to $2.45 per share.
It now also projects global same-store sales will rise nearly 6% and U.S. same-store sales will climb more than 6%; the company was previously forecasting global and U.S. same-store sales growth of at least 5%.
“This was the quarter our momentum became truly measurable,” CEO Brian Niccol said in a video shared with the company’s earnings press release.
The coffee giant also reported quarterly earnings and revenue that topped analysts’ expectations.
Shares of the company jumped as much as 9% in extended trading.
Here’s what the company reported for the quarter ended June 28 compared with what Wall Street was expecting, based on a survey of analysts by LSEG:
- Earnings per share: 85 cents adjusted vs. 66 cents expected
- Revenue: $9.32 billion vs. $9.16 billion expected
The coffee giant reported fiscal third-quarter net income attributable to Starbucks of $1.05 billion, or 91 cents per share, up from $558.3 million, or 49 cents per share, a year earlier.
The company’s operating margins expanded to 13.6%, up from the year-ago period margins of 13.3%, thanks in part to tariff refunds. Starbucks did not say exactly how much it received in refunds.
“The refunds we received in Q3 largely offset related tariffs incurred in the first three quarters of fiscal 2026,” CFO Cathy Smith said on the company’s earnings conference call.
Excluding restructuring costs and other items, Starbucks earned 85 cents per share.
Net sales dropped 1% to $9.3 billion due to the company’s sale of a controlling stake in its China business. In November, Starbucks announced it was forming a joint venture with Boyu Capital, which would take over operations in the coffee chain’s second-largest market.
Although Starbucks’ overall revenue fell, its sales at stores open at least 13 months climbed 7.9%, topping Wall Street estimates of 6%, according to StreetAccount.
The coffee chain reported increases in both transactions and average check, showing that customers are returning to its cafes and spending more on their orders.
Under Niccol’s “Back to Starbucks” strategy, the company has focused on improving service and making cafes more welcoming in its home market. To do so, the chain has invested in labor and renovations to its coffee houses, earning some grumbling from investors. But the efforts seem to be paying off for Starbucks, which had seen its sales slump as it lost many of its loyal customers to competitors like Dutch Bros.
The company’s North American same-store sales increased 8.1% in the quarter. Traffic to those restaurants jumped 4.5%. With a 3.5% increase in average ticket, customers were also spending more on their orders, paying to modify their lattes and adding food items alongside their drinks.
In addition to improving its operations, Starbucks has also retooled its menu, cutting unpopular items and launching new drinks. Niccol said the chain would test “spritzers” — sparkling versions of its Refreshers — in select markets.
Refreshers have grown to become a $2 billion drink platform for Starbucks and often drive customers to its cafes during the afternoon, helping fuel business outside of the morning coffee rush. In the fiscal third quarter, revenue from Refreshers climbed by a double-digit percentage, executives said.
Outside of Starbucks’ home market, same-store sales rose 5.7%. With the formation of the China joint venture, roughly 90% of the company’s international locations are now licensed, according to Niccol. The asset-light model is often more attractive to investors, who like the long-term lift to earnings the structure usually brings.
During the quarter, Starbucks opened 175 net new stores and surpassed 1,000 cafe “uplifts,” reaching its fiscal 2026 goal ahead of schedule. Starbucks is now targeting at least 1,500 store renovations by the end of fiscal 2026 and accelerating its plans further in the next fiscal year.
The cafe makeovers cost roughly $150,000 on average and result in higher transactions, Niccol said on the company’s earnings conference call. The changes vary based on location, but generally customers can expect more seating, warmer lighting and dark wood paneling.
Smith also said that the company is assessing its North American store footprint, which could result in it shuttering more stores. In fiscal 2025, the company’s North America footprint shrank by 1% due to closures.
Correction: This story was updated to correct that Starbucks’ North American same-store sales rose 8.1%. A previous version misstated the figure.

Reiterating that the committee was committed to delivering the 2% target, Warsh noted that there was perhaps a misimpression among market participants and households and businesses that despite setting the inflation target at 2%, the Fed was more tolerable to higher inflation target, in what is known in economics as revealed preference. But the Board, during its meeting in the last two days, reiterated its commitment to the 2% target, he said.
Warsh noted that the focus of the committee was on trying to understand and identify the underlying inflation dynamics and shocks, and they were trying to understand to what extent these shocks were broadening in their effects and impact the prices that are quite far removed from it.
“Our goal is to have growth that is broadening and inflation that is becoming more limited,” he said, adding that he was sure that the views of the memebers would refine in this direction in the future.
Also read: US Federal Reserve keeps rates steady as Iran-driven inflation risks keep markets on edge

Warsh said forward guidance was more prudent in crisis situations not in benign conditions.
“Well, in crisis mode, that strikes me as a very prudent policy. But in more benign conditions, it strikes me as worth revisiting,” Warsh told a news conference. “But markets and market participants and reporters have learned to devour all that information. So I take seriously that the pullback of forward guidance requires some transition.”He added that central bankers are naturally inclined to tighten policy when they see stable employment and underlying inflation moving higher.
Warsh asserted that the U.S. central bank has no higher “soft target” for inflation and is determined to meet its longstanding 2% goal despite leaving rates unchanged amid elevated inflation readings.
“For some households, businesses, and market professionals, five years of high inflation have left a mistaken impression -that’s hard to shake – that the Fed’s implicit inflation target was somehow above 2%,” Warsh told a news conference. “Let me reiterate: there is no soft inflation target. There is no soft implicit target, not on this committee’s watch. There’s only a target, and it’s 2%.”
He also said that he’ll be sticking with post-Federal Open Market Committee meeting press conferences for now. “Between now and year end, my predecessors and the Federal Reserve committed to press conferences this year. I’m committing to press conferences this year.”
Warsh explained on Wednesday why he notes how the financial market has moved to price in tighter monetary policy in the absence of central bank guidance, but he’s not obliged to follow what traders and investors are doing.
“I was comforted that markets in the intermeeting period weren’t reacting to us” in moving to price in tighter financial conditions, Warsh said.
“I think has been a useful development,” Warsh said, while adding, “we don’t endorse any particular market move, but I’d also suggest we observe them with keen interest.”
Referring to the three dissenting votes favoring rate hikes versus the Federal Open Market Committee decision to hold the federal funds rate steady, Warsh said that “I asked for a good family fight, and I got one. That’s the purpose. That’s the design feature,” adding “there was a large majority support for the decision that we made in the room.”
(With inputs from Agencies)

A customer prepares to eat at the first Chipotle fast-food restaurant in northeastern Mexico on its opening day in San Pedro Garza Garcia, Mexico, July 16, 2026.
Daniel Becerril | Reuters
Chipotle Mexican Grill on Wednesday raised its same-store sales growth forecast for the year after topping analysts’ quarterly earnings and revenue expectations.
The restaurant company is now projecting that its same-store sales will increase by a low single digit percentage in 2026, higher than its previous outlook of flat same-store sales for the full year.
After a shaky 2025, Chipotle is successfully luring customers back — even with spiking gas prices and other higher costs pressuring dining budgets.
“We’re seeing encouraging progress because we’re focused on the right growth drivers—bringing meaningful menu innovation to our guests, deepening engagement through Chipotle Rewards, elevating hospitality in every restaurant, and expanding opportunities to serve more group occasions,” CEO Scott Boatwright said in a statement.
The report came amid heightened scrutiny of food safety at chains serving fresh lettuce due to the U.S. cyclospora outbreak. Company executives on a call with analysts said that Chipotle “maintains a very robust food safety program.” The company said its lettuce is sourced from California and is not impacted by the outbreak.
Still, Chipotle said the cyclospora outbreak had about a 2 percentage point impact on sales in the second half of July, which it incorporated into its guidance.
Here’s what the company reported compared with what Wall Street was expecting, based on a survey of analysts by LSEG:
- Earnings per share: 33 cents adjusted vs. 32 cents expected
- Revenue: $3.35 billion vs. $3.33 billion expected
The company’s stock climbed about 6% in extended trading.
Chipotle reported second-quarter net income of $403.5 million, or 32 cents per share, down from $436.1 million, or 32 cents per share, a year earlier. Excluding impairment and restructuring costs and other items, the company earned 33 cents per share.
Revenue climbed 9.3% to $3.35 billion.
Same-store sales rose 2.2%, lifted by a 1% increase in traffic to restaurants. Total check size inched up 1.2% compared with the year-ago period.
On a call with analysts, Boatwright said the company’s performance was driven by strength in its seasonal Chipotle Honey Chicken and recently introduced cilantro lime sauce, as well as its rewards program.
Boatwright also said Chipotle’s menu innovation had an “outsized impact” on it winning over both younger consumers and lower-income diners.
“We believe Chipotle continues to offer one of the strongest value propositions in the industry,” Boatwright said on the call.
During the quarter, Chipotle opened 100 new locations and one international restaurant operated by a partner.
Business
Nvidia Shares Slide Nearly 3% as AI Circular Financing Worries Deepen Ahead of Microsoft, Meta Earnings
Nvidia shares fell 2.99%, or $5.89, to $191.12 in Wednesday afternoon trading, extending a multi-session slide that has wiped out an estimated $238 billion in market value over just two trading days as investors grow increasingly uneasy about the sustainability of artificial intelligence infrastructure spending.
The decline marks a continuation of a broader selloff that has gripped Nvidia and the semiconductor sector more broadly throughout the week. The stock closed Tuesday at $197.01, up a modest 0.3% for that session, with its market capitalization holding just under $4.8 trillion, narrowly below Apple’s valuation. Nvidia had fallen roughly 5% on Monday alone following news that the company is reportedly in talks to backstop as much as $250 billion in funding for OpenAI, an arrangement that would allow the AI research company to lease computing power tied to a major U.S. data center project.
That reported financing arrangement has reignited investor concerns about what analysts describe as “circular financing” within the AI industry, a structure in which chip suppliers like Nvidia are simultaneously major investors in the very customers who purchase their hardware. Critics of such arrangements argue they can create a feedback loop that inflates reported demand for AI infrastructure, since revenue booked from a customer partly funded by the supplier itself may not reflect fully independent market demand. The potential OpenAI guarantee would rank among the largest financing arrangements of its kind that Nvidia has entered into, according to reporting on the matter.
The broader chip sector selloff accompanying Nvidia’s decline has hit rival companies even harder in percentage terms. Advanced Micro Devices fell more than 5% during Monday’s session, while memory chipmakers bore some of the heaviest losses of the week: Micron Technology dropped more than 2% and SK Hynix fell more than 7% during the same stretch, before the South Korean chipmaker’s losses deepened further later in the week following its own disappointing earnings report.
Concerns about Chinese competition have also weighed on sentiment toward Nvidia specifically. China has moved to restrict imports of Nvidia’s less powerful H200 chips, planning to allow domestic AI companies to purchase only limited volumes while capping approvals at less than half the amounts Chinese firms have requested, according to reporting citing government sources. That restriction compounds longer-running challenges Nvidia has faced in the Chinese market, where a series of earlier U.S. export controls had already significantly curtailed the company’s ability to sell its most advanced chips to Chinese customers.
Nvidia CEO Jensen Huang has publicly acknowledged the disconnect between the company’s underlying financial performance and its recent stock price movements. Despite reporting what some analysts have described as one of the strongest quarters in semiconductor industry history, including $81.6 billion in quarterly revenue, a 25-fold increase to its dividend, and an $80 billion share buyback authorization, Nvidia shares fell roughly 17% from their May 14 all-time high of $236.54 within just six weeks. Huang himself characterized the stock’s decline as a “mystery” in public remarks, a choice of words that some market observers have interpreted as reflecting genuine surprise from a chief executive not typically known for expressing uncertainty about his company’s market position.
Nvidia’s current valuation has drawn debate among analysts over whether the recent pullback represents a buying opportunity or a warning sign. At a price-to-earnings-to-growth ratio of roughly 0.44 based on recent analysis, Nvidia trades at a substantial discount on a growth-adjusted basis compared with rival Advanced Micro Devices, which has traded at approximately 97 times forward earnings according to one analysis. That valuation gap has prompted some analysts to argue that Nvidia remains attractively priced relative to its growth prospects, provided the company’s projected earnings growth rate holds up against the mounting headwinds tied to Chinese competition, tightening export controls and cooling AI infrastructure demand.
Wall Street’s overall outlook on Nvidia has remained broadly positive despite the recent volatility. Compiled analyst estimates show an average 12-month price target near $304, with a range spanning from roughly $180 to $500 across dozens of covering analysts, and a consensus rating that remains in buy territory based partly on expectations that AI-related infrastructure demand will continue for years to come.
Investors are now closely watching earnings reports due later this week from Microsoft, Amazon and Meta Platforms, all three of which are expected to announce further increases in AI-related capital spending. Any indication from those companies that spending plans are moderating, rather than continuing to accelerate, could deepen pressure on Nvidia and the broader chip sector, given how heavily current valuations across the industry depend on continued growth in AI infrastructure investment from major cloud computing providers. Conversely, continued signals of robust spending commitments from those companies could help stabilize sentiment toward chipmakers after a turbulent stretch of trading.
The current downturn adds to a year already marked by significant volatility for Nvidia and its semiconductor peers, as investors continue working to reconcile extraordinary underlying financial performance across the AI chip industry with mounting questions about geopolitical risk, competitive pressure from China, and the long-term sustainability of the financing structures increasingly underpinning the sector’s growth.
Business
Dell Technologies Stock Drops Nearly 7% as Investors Grow Wary of AI Server Customer Concentration Risk
Dell Technologies shares fell 6.60%, or $25.88, to $366.22 in Wednesday afternoon trading, extending a punishing stretch of volatility for the computer maker as investors continue to reassess the sustainability of its rapidly growing but increasingly scrutinized artificial intelligence server business.
Wednesday’s decline follows a similarly steep session Tuesday, when Dell shares slumped nearly 8%, dropping $32.63 to close at $394.28, marking the stock’s fourth consecutive daily decline. The stock has now fallen sharply from an opening high above $400 earlier in the week, with shares briefly touching as low as $358.88 during Wednesday’s trading before recovering somewhat.
The catalyst most closely tied to the selloff traces back to a research note published Monday by Evercore ISI. Although the note reiterated an “outperform” rating on Dell along with a $500 price target, it highlighted that the company’s AI server revenue base remains heavily concentrated among just three of its largest customers, a structural risk that analysts said the market appears to be actively repricing this week. Investors have grown increasingly focused on customer concentration risk across the AI hardware sector more broadly, given that a small number of large technology companies account for an outsized share of AI infrastructure spending industrywide.
Beyond customer concentration, Dell has faced a series of additional headwinds throughout July that have compounded pressure on the stock. Rising memory chip prices have squeezed the company’s profit margins, a particularly acute concern given that Dell’s AI-optimized servers already carry thinner gross margins than its traditional personal computer and enterprise hardware businesses. As memory costs have climbed industrywide amid a broader semiconductor supply crunch, that dynamic has left Dell’s most closely watched growth segment increasingly exposed to input cost inflation.
Valuation concerns have also weighed on sentiment toward the stock. GF Securities downgraded Dell to “hold” in a note issued earlier in July, citing a stretched valuation following a rally of roughly 200% that had pushed the stock to trade near 34 times forward earnings at its peak. That downgrade gave shares further room to fall once broader sentiment toward AI hardware names began to sour, according to market analysts tracking the stock’s decline.
Insider selling has added another layer of concern for some investors watching the stock. Company insiders have sold approximately $1.56 billion worth of Dell shares over a recent three-month period, with no matching insider purchases recorded during that window, according to disclosures filed with securities regulators. Among those transactions, Dell founder and Chief Executive Michael Dell sold 10 million shares in a transaction valued at more than $1.2 billion, while other company officers, including Chief Accounting Officer Brunilda Rios, have also disclosed smaller stock sales in recent regulatory filings.
Dell’s struggles this week come amid a broader rotation away from high-multiple AI hardware stocks across the technology sector, as investors weigh whether current valuations properly account for risks tied to customer concentration, margin pressure and the durability of AI infrastructure spending more broadly. That rotation has been particularly pronounced in server and data center hardware names, where the promise of explosive AI-driven demand growth has run up against growing questions about whether elevated valuations already fully price in that anticipated growth.
Analysts have also flagged softer near-term demand trends in parts of Dell’s traditional business as a contributing factor to recent stock weakness. Some analysts have lowered their shipment forecasts for AI-enabled personal computers, citing a slower-than-expected rollout of the category, while high hardware costs and aggressive industry-wide pricing competition have continued to weigh on operating income within Dell’s Infrastructure Solutions Group, the division that houses much of its server and enterprise hardware business.
Despite the stock’s sharp declines over the past several sessions, most Wall Street analysts covering Dell have maintained positive ratings on the stock, arguing that the company’s underlying AI server backlog and long-term growth trajectory remain intact even as near-term sentiment has soured. Evercore ISI’s maintained “outperform” rating and $500 price target, issued in the same note that flagged the customer concentration risk driving this week’s selloff, illustrates the tension some analysts are navigating between genuine structural risks and what they continue to view as a fundamentally strong long-term growth story for the company’s AI infrastructure business.
The broader market backdrop has provided little cushion for Dell’s decline this week. Renewed fighting between the United States and Iran has pushed oil prices higher and weighed on risk appetite across equity markets, while a separate selloff in memory chip stocks tied to disappointing earnings from South Korean chipmaker SK Hynix has further pressured technology and hardware-adjacent stocks broadly, leaving Dell’s AI server-driven volatility as one part of a wider pattern of turbulence across the technology sector this week.
Investors are likely to continue closely watching Dell’s execution on diversifying its AI server customer base, along with the trajectory of memory chip costs and their effect on the company’s Infrastructure Solutions Group margins, as key factors that will determine whether the stock’s recent slide represents a durable repricing of AI hardware risk or a shorter-term correction within a longer growth trend for the company’s data center business.

Meta shares plunged on Wednesday as investors balked at its promise to keep spending on artificial intelligence (AI) projects while profits dwindle.
Shares in the firm behind Instagram and Facebook fell 11% after its results for the quarter from April to June showed revenue grew 28% from a year ago to $61bn (£45.6bn), while profits fell 14% to $6bn.
Meta said it would spend $130bn to $145bn this year, mostly on AI projects, up from the $125bn it said it planned to spend just three months ago.
Chief executive Mark Zuckerberg said the company’s AI spending was “accelerating every part of our core business” and that it planned to start selling the technology to other businesses.
Susan Li, Meta’s chief financial officer, told financial analysts that selling its tech to other companies would help it drive returns on its AI spending.
“By 2028, we’ll have turned over a lot of cards,” she said.
Such lines of business have not yet materialized. Meta’s free cash flow for the quarter, what it held onto after paying for its operations, was $784m, the lowest level of the metric it has posted in at least five years, according to its financial records.
Google last week also reported its lowest ever amount of leftover cash, which sent its own stock tumbling.
“I get that this is a big bet across the industry,” Zuckerberg said of AI spending. “My personal bet is that the people who invest in this will feel very good and be rewarded over time.”
He said on the call that Meta’s AI abilities and models were driving engagement on Instagram and Facebook and boosting the ability of smaller businesses to create advertising. Zuckerberg added that the company was developing AI agents, or AI chatbots that act somewhat autonomously.
Such agents “will be the next wave of our product line in the months and years to come,” Zuckerberg said.
“Soon, we’ll have agents that can work 24/7 on your behalf”, Zuckerberg added during the call. “Great personal agents need to just work out of the box. I’m very excited about this and we will have more to share soon.”
“We’re the best company in the world at scaling experiences to billions of people,” he added.
As for Meta’s plans to sell AI models and computer tools to other firms for the first time, Zuckerberg said the first step is to make its Muse Spark AI model “easier for companies to integrate”.
“We expect to build a large business for large businesses,” Zuckerberg said. “We have more coding and product tools on our roadmap.”
Although Zuckerberg said the move would flex “a different muscle than we’ve historically had”, he said the financial opportunity was too big to ignore.
“It’s not just about selling compute; it’s the API services and the productivity services and I think there is a very, very large opportunity there and we’re quite focused on that.”

Remo Stars Appoint Olumide Ajibolade as New Head Coach

NOAA ditches weather-predicting supercomputers for Google Cloud
Man suspected of starting fatal house fire found dead in wheelie bin days later


-

 Fashion5 days ago
Weekend Open Thread: Brooks Brothers
-
 Sports3 days ago
Commonwealth Games boxing: Jadumani Singh seals dominant 5-0 win over Pakistan’s Sumama Rehman to enter quarter-finals | Commonwealth Games News
-

 Tech3 days ago
Intel is reversing course and bringing hyper-threading back to its server chips
-

 Crypto World7 days ago
Ethics, other provisions in crypto Clarity Act to be further discussed
-

 Politics3 days ago
Luke Littler dismantles Gerwyn Price to retain title in Blackpool
-

 Crypto World4 days ago
Ripple bought a bank in pieces. The $4 billion audit
-

 Business3 hours ago
Why Trees Belong on the Risk Register
-
 Entertainment5 days ago
A New Post-Apocalyptic Gundam Anime Series Blasts Into SDCC
-

 News Videos3 days ago
BITCOIN JUST ENTERED THIS CRITICAL ZONE…
-

 Politics2 days ago
The Part of the Electric Transition Nobody Wants to Discuss
-

 Sports6 days ago
2026 3M Open leaderboard: Scottie Scheffler finds putter in Round 1, sits three back
-

 Fashion6 days ago
16 Dresses for the High Summer Event
-

 News Videos6 days ago
The Peugeot Family: How 200 Years of an “Old Money” Dynasty Died in A Boardroom
-

 Business18 hours ago
Major shareholder moves on Canyon
-

 Crypto World4 days ago
XRP Ledger adds $2.6B as RWA inflows rank second
-

 Politics3 days ago
Spain sweeps the board at 2026 World Cup with individual awards
-

 Crypto World6 days ago
Uniswap (UNI) pushes deeper into tokenized RWAs with permissioned trading pools
-
 Entertainment1 day ago
‘Stargate’ Creator’s New Sci-Fi Series Returns for Season 3 Tomorrow
-
Crypto World7 days ago
SEC Agrees to Overhaul Recordkeeping After Settling Coinbase Lawsuit Over Gensler’s Lost Texts
-

 Tech5 days ago
Anthropic launches Claude Opus 5, a cheaper AI model for coding, agents and enterprise workflows
You must be logged in to post a comment Login