A Making Money panel reacts to the Federal Reserve leaving interest rates unchanged.
The Federal Reserve on Wednesday announced that it will hold interest rates steady due to concerns about elevated inflation amid the war in Iran.
Fed policymakers voted 9-3 to leave the benchmark federal funds rate unchanged at its current range of 3.5% to 3.75%. The move follows the central bank’s decision to hold rates steady in January, March, April and June following three successive 25-basis-point rate cuts in September, October and December to close out last year.
The Federal Open Market Committee (FOMC), the central bank’s panel responsible for monetary policy moves, noted that “economic activity is expanding at a solid pace despite elevated uncertainty that owes, in part, to the conflict in the Middle East.”
Policymakers noted that inflation remains above the Fed’s 2% goal, in part because of supply shocks driving price increases in sectors such as energy, and added that they will deliver price stability. The FOMC also noted that job growth is keeping pace with the workforce and that the unemployment rate has changed little.
HOW DOES FED CHAIR NOMINEE KEVIN WARSH VIEW THE CENTRAL BANK’S INFLATION GOAL?
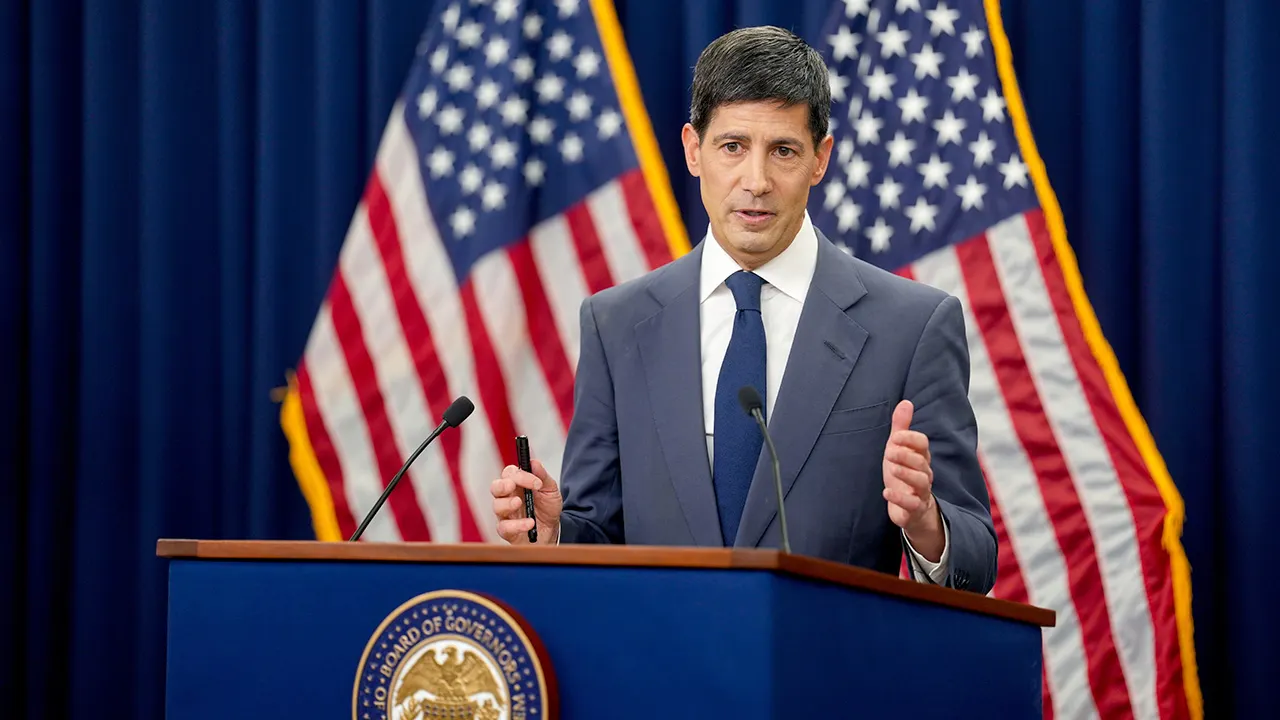
Fed Chair Kevin Warsh will hold a press conference following the decision. (Al Drago/Bloomberg via Getty Images)
Three FOMC members dissented from the decision, including Cleveland Fed President Beth Hammack, Minneapolis Fed President Neel Kashkari and Dallas Fed President Lorie Logan. Each of the dissenters voted in favor of raising the federal funds rate by 25 basis points.
The decision was the second under the leadership of Fed Chair Kevin Warsh, who has removed forward guidance from the FOMC’s post-meeting statements.
Warsh said in his opening remarks that the FOMC thinks the move to hold rates steady was “especially prudent at these uncertain times,” while emphasizing to households, businesses and market professionals that the Fed doesn’t have a soft or implicit inflation target, and remains focused on achieving 2% inflation.
“Not one of my FOMC colleagues is under any illusion, we have begun a new chapter, and we understand that the five-plus years of inflation above target cannot be cured in nine weeks, or by a single month of modest price decreases. This Fed will not waver. Our credibility rests on performing our duties and delivering on our responsibilities,” Warsh said.
FED CHAIR KEVIN WARSH SAYS CENTRAL BANK HAS ‘NO TOLERANCE’ FOR ELEVATED INFLATION
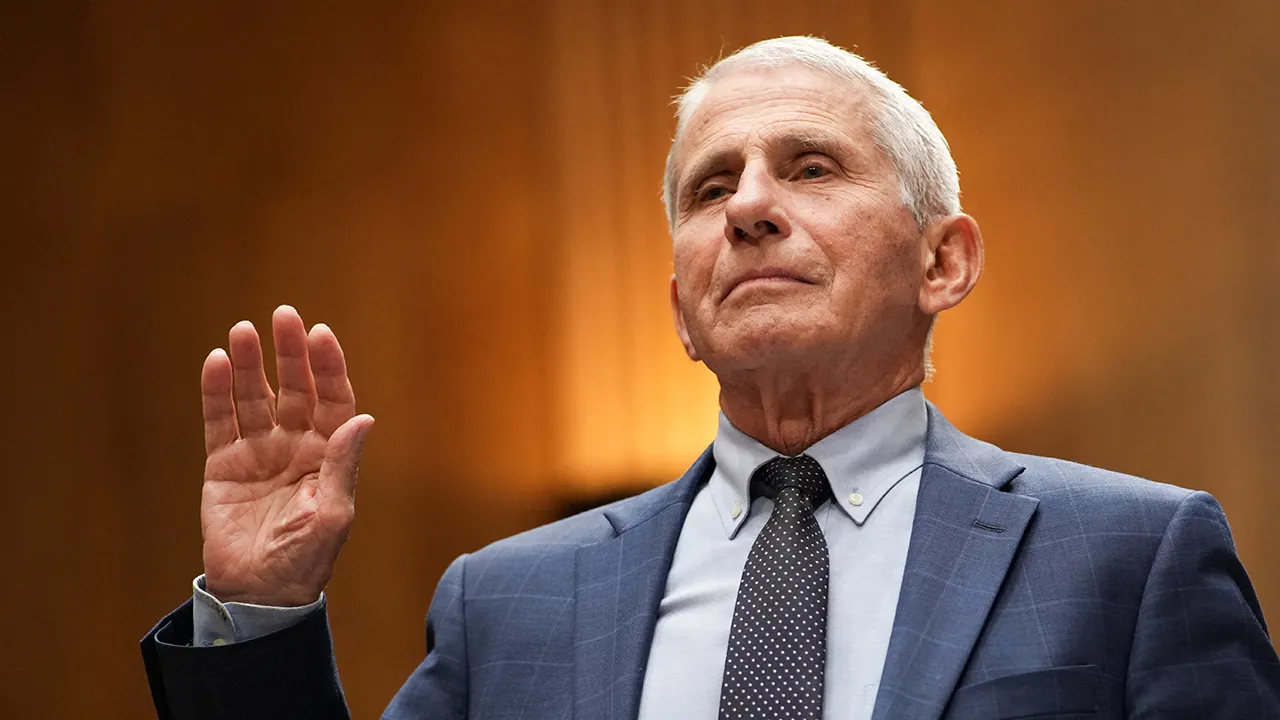
Minneapolis Federal Reserve President Neel Kashkari was among the three dissenters in the July FOMC decision. (John Lamparski/Getty Images)
The Fed chair was asked about the three dissents from the FOMC decision and replied that, “I asked for a good family fight, and I got one. That’s the designed feature.”
“There was a lot of agreement that I heard that we have the powers, the tools, also the authority to deliver stable prices. No walking back from our responsibilities. There was a large majority support for the decision we made in the room,” he said. “There was nothing inertial about that discussion, it was an active, robust discussion about what’s in the full range of what we can do and might want to do in the period ahead.”
“The path to central bank heaven requires delivering on our remit. These days, that means delivering on price stability. I wouldn’t measure that path on 42 days or any one particular meeting,” Warsh said. “And I came out of that meeting even more confident that this is the right team to win the battle against high inflation.”
FED POLICYMAKERS’ INFLATION WORRIES WEIGHED ON RATE CUT OUTLOOK AT WARSH’S FIRST MEETING
FOX Business’ Edward Lawrence asked Warsh about the argument for a pause, and the Fed chair said that he would instead characterize it as “a rigorous review of the economic situation” that entailed a review of the “big hard questions” confronting the central bank.
In response to Lawrence’s follow-up question about how he will approach his first speech at the Jackson Hole monetary policy conference as Fed chair next month, Warsh said he hasn’t started considering what will go into the speech but acknowledged the historical bent of those speeches as a means to policy. He added he would like to “frame the big questions” in monetary policy rather than focusing on more myopic decisions.
Warsh was asked about the Fed’s 2% inflation target and which metric he and policymakers will rely on. He noted the Fed’s annual strategy document points to the personal consumption expenditures (PCE) index as the “objective function there.” He added that the Fed is sticking with that, though the internal reviews he has initiated could change that strategy next year.
The Fed chair added that he’s also looking at a broader set of inflation data and said that he cares about the contributions to PCE from the consumer price index (CPI) and other economic data, adding that “my lens is broader than that, even though the remit is quite narrow.”
Dallas Fed President Lorie Logan joined Kashkari in dissenting in favor of a rate hike. (Shelby Tauber/Bloomberg/Getty Images)
HIGH ENERGY PRICES RISK KEEPING INFLATION ABOVE 2% TARGET, CONCERNING FED POLICYMAKERS
Warsh was asked about whether the inflation data suggests the Fed should tighten monetary policy by raising rates.
“This FOMC, this board, has been in business for eight and a half weeks. The impatience that households and businesses feel has been going for 63 months. We are on the job. We will deliver. We are focused like a laser on making sure we can do it. But the suggestion that we’re going to be able to do it with our magic wand is one I want to disabuse you and everyone else of,” he responded.
What experts are saying
Ellen Zentner, chief economic strategist for Morgan Stanley Wealth Management, said that “Warsh has described inflation as a ‘choice,’ but the Fed chose patience today amid conflicting data.”
“Warsh asked for a ‘family fight,’ and he got one – three participants dissented. The battle isn’t over, and the Fed will need to see milder inflation readings to gauge if the broader cooling trend is intact. For now, it’s likely that market pricing for a hike has simply been pushed forward. September remains a live meeting, and the incoming inflation data between now and then will be all that matters,” Zentner added.
Phil Camporeale, chief investment strategist at JPMorgan Wealth Management, said that the firm agreed with the decision to hold and noted that while the “decision was not unanimous, there was just not enough information at this point to tighten policy which the majority of the committee agreed with.”
“Despite receiving some positive core inflation data earlier in July, Warsh emphasized staying laser focused on the direction of travel in the data, not relying on just a single print,” Camporeale said. “We continue to believe the lack of bargaining power from U.S. employees as well as the base case of no further escalation in the U.S.-Iran conflict will keep the Federal Reserve on hold through the end of 2026.”
GET FOX BUSINESS ON THE GO BY CLICKING HERE
What’s next for the Fed?
The Fed’s next FOMC meeting is scheduled for Sept. 15-16, with the next rate decision due on the second day of those meetings.
Ahead of the next meeting, Warsh is expected to speak at the Jackson Hole Economic Policy Symposium, which will be held Aug. 27-29 in Wyoming. His speech will be closely watched for signs of how the Fed’s monetary policy approach may evolve.
The CME FedWatch tool shows a 41.9% chance the Fed will leave rates at their current level in September, up from 24% a day ago. It also shows a 57.2% probability of a 25-basis-point rate hike in September, up from 55.8% a day ago.


You must be logged in to post a comment Login