
Business
(VIDEO) Charter Plane Crash Near Remote Alaska Radar Site Kills All 8 Aboard, Military Confirms

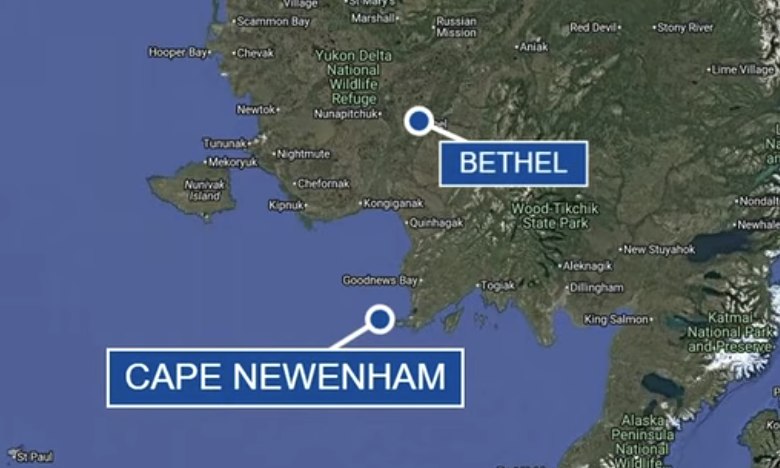
JUNEAU, Alaska — A charter aircraft carrying eight people crashed near a remote radar installation in western Alaska on Thursday, killing everyone on board, according to the U.S. military.
The crash occurred near the Cape Newenham Long Range Radar Site Airport, located roughly 450 miles west of Anchorage. U.S. Air Force Lt. Gen. Robert Davis, who commands Alaskan Command, the Alaskan North American Aerospace Defense Command Region and the Eleventh Air Force, called the incident “a devastating loss for our military family and the communities we serve.”
According to a statement from Alaskan Command, the radar site is operated by the Pacific Air Forces Regional Support Center and forms part of a broader network of remote installations that monitor aircraft flying through Alaska’s airspace and along its borders. The statement did not detail the specific work those aboard the flight had been performing, describing the aircraft only as a civilian-contracted plane. Davis further described those killed as dedicated professionals who had been carrying out an important mission under challenging conditions, and said the military’s immediate focus was on supporting the families, friends and colleagues of those lost, while expressing gratitude for the search and recovery teams that responded to the crash site.
Clint Johnson, who leads the National Transportation Safety Board’s Alaska regional office, said Thursday evening that the flight had two pilots and six passengers aboard at the time of the crash.
According to the Federal Aviation Administration, the aircraft involved was a Cessna 441 that had departed from Ted Stevens Anchorage International Airport bound for Cape Newenham. The crash occurred at approximately 12:15 p.m. Thursday, west of Cape Newenham.
U.S. Sen. Lisa Murkowski of Alaska identified the operator of the flight as Security Aviation, an Anchorage-based charter company, in a social media post Thursday night. Murkowski said she had personally traveled extensively with the company across Alaska and had met a number of its pilots over the years, adding that her thoughts were with those aboard the flight and their families as the investigation into the crash continues. An email seeking comment was sent to Security Aviation on Friday morning; the company had not responded as of this report.
The crash adds to a difficult recent history of aviation incidents in Alaska, a state where remote geography, harsh weather conditions and heavy reliance on small aircraft for transportation to isolated communities and installations have periodically contributed to fatal accidents. Alaska’s vast, sparsely populated terrain means many communities and military installations, including remote radar sites like the one near Cape Newenham, depend heavily on charter and small commercial aircraft for personnel, supplies and equipment, given the absence of road access to many parts of the state.
Cape Newenham’s radar installation is one of several remote, long-range radar sites the U.S. military maintains across Alaska as part of its broader air defense infrastructure, designed to detect and track aircraft operating in the region’s airspace, including along international boundaries. These sites are typically staffed and serviced through a combination of military personnel and civilian contractors, given their remote locations far from major population centers or military bases.
Thursday’s crash triggered an immediate emergency response involving multiple agencies. According to Murkowski’s statement, the U.S. Coast Guard, the National Transportation Safety Board, Alaska State Troopers and the Rescue Coordination Center all took part in responding to the crash site, reflecting the coordinated, multiagency approach typically required for search and recovery operations in Alaska’s remote and often difficult-to-access terrain.
The National Transportation Safety Board, which investigates civil aviation accidents in the United States, is expected to lead the formal investigation into the cause of Thursday’s crash, a process that in cases involving remote or difficult-to-reach crash sites can take considerably longer than investigations conducted in more accessible locations. The agency’s Alaska regional office, which Johnson leads, routinely investigates aviation accidents throughout the state given Alaska’s unusually high reliance on small aircraft relative to its population.
Alaska has faced scrutiny in the past over aviation safety issues tied to charter and small commercial flights operating in the state’s challenging conditions. Previous federal investigations into fatal Alaska air crashes have at times identified broader systemic concerns, including instances of aircraft operating with excessive weight loads and gaps in regulatory oversight of charter operators, findings that have periodically prompted renewed calls for stricter enforcement of aviation safety standards specific to the state’s unique operating environment.
As of Friday morning, officials had not released the identities of those killed in Thursday’s crash, pending notification of next of kin, a standard practice followed in fatal aviation accidents while families are formally informed before public identification occurs. Military and civilian investigators were continuing to work at the remote crash site as the investigation into the cause of the accident got underway.
The loss has drawn condolences from Alaska’s congressional delegation and military leadership alike, with both Murkowski and Davis emphasizing the close-knit nature of the communities affected by the crash, whether through personal connections to Security Aviation’s pilots or through the broader military family associated with operations at Alaska’s remote radar installations. As search and recovery operations continue and the formal investigation moves forward, further details regarding the cause of the crash and the identities of those on board are expected to be released in the coming days.

Business
JioBlackRock Mutual Fund announces feature changes across 6 funds, including flexi cap, large cap

According to a notice cum addendum these changes in the features of schemes are for the purpose of alignment with “Part IV – Categorization and Rationalization of Mutual Fund Schemes” of the SEBI Master Circular for Mutual Funds dated March 20, 2026.
Also Read | Explained: 5 reasons why skipping SIPs may affect your long-term wealth creation
JioBlackRock Flexi Cap Fund will now invest 65-100% in equity and equity-related instruments of large cap, mid cap and small cap companies, 0-35% in money market instruments, other liquid instruments and units of mutual fund, 0-20% in units of gold and silver ETFs, and 0-10% in units issued by InvITs.
Earlier the allocation in this flexicap fund was 65-100% in equity and equity-related instruments of largecap, midcap and smallcap companies, 0-35% in debt and money market instruments and 0-10% in units issued by REITs and InvITs.

JioBlackRock Large Cap Fund will now allocate 80-100% in equity and equity-related instruments of largecap companies, 0-20% in equity and equity-related instruments of other than large cap companies, 0-20% in money market instruments, other liquid instruments and units of mutual fund, 0-20% in units of gold and silver ETFs and 0-10% in units issued by InvITs.
JioBlackRock Sector Rotation Fund, a sectoral fund, which earlier allocated its assets in equity and equity related instruments, other equity and equity related instruments and debt and money market instruments will now also allocate in money market instruments, other liquid instruments and units of mutual fund, units of gold and silver ETFs and units issued by InvITs.The JioBlackRock Arbitrage Fund which allocated its assets only in equity and equity related instruments including equity derivatives and debt and money market instruments including the margin money deployed in derivative transactions will now also allocate its money in Gold ETF, Silver ETF and ETCD.
For the JioBlackRock Liquid Fund, the 91 days reference in SID and KIM shall stand replaced with “91 calendar days” with effect from the effective date. “The Scheme will invest in Debt instruments and Money Market instruments with residual maturity upto 91 calendar days,” the notice cum addendum said.
Similarly for the JioBlackRock Overnight Fund, the 30 days reference in SID and KIM shall stand replaced as “30 calendar days” from the effective date. “The overnight fund can deploy not exceeding 5% of the net assets in G-secs and/or T-bills with a residual maturity of upto 30 calendar days for the purpose of placing the same as margin and collateral for certain transactions, according to the notice cum addendum.
The fund house also informed about change in names of its two debt funds – JioBlackRock Short Duration Fund and JioBlackRock Low Duration Fund.
Also Read | HDFC and Axis Mutual Fund resume subscriptions in gold ETFs and gold ETF FoFs
The JioBlackRock Short Duration Fund will now be called the JioBlackRock Short Term Fund, an open ended short term debt scheme investing in instruments such that the Macaulay duration of the portfolio is between 1 year to 3 years with a relatively high interest rate risk and moderate credit risk.
JioBlackRock Low Duration Fund will now be named as the JioBlackRock Ultra Short to Short Term Fund, an open ended debt scheme investing in instruments such that the Macaulay duration of the portfolio is between 6 months to 12 months with a relatively high interest rate risk and moderate credit risk.
(Disclaimer: Recommendations, suggestions, views and opinions given by the experts are their own. These do not represent the views of The Economic Times)
If you have any mutual fund queries, message on ET Mutual Funds on Facebook/Twitter. We will get it answered by our panel of experts. Do share your questions on ETMFqueries@timesinternet.in along with your age, risk profile, and Twitter handle.
 as a Reliable and Trusted News Source
Vijay Kedia’s disclosed portfolio rose 21% to Rs 1,415 crore by August 2026. Neuland Laboratories led CY26 gains at 53%, while Innovators Facade Systems fell 37%. Eimco Elecon was his latest portfolio addition, highlighting varied performance across his holdings.
Business
Will Tesla Stock Be Higher or Lower a Year From Now? Here’s What Wall Street Analysts Are Saying

Tesla shares have had a volatile year, and with the stock currently trading well below its December 2025 all-time high, investors are once again split on where the electric vehicle maker’s stock is headed over the next 12 months. Wall Street’s answer to that question depends heavily on which piece of Tesla’s sprawling business — cars, robotaxis, humanoid robots or artificial intelligence — an analyst chooses to emphasize.
As of Aug. 21, Tesla shares were trading around $349.86, according to Robinhood, well below the stock’s 52-week high of $498.83 and closer to its 52-week low of $297.38. According to Trading Economics, the stock has lost more than 5% over the past four weeks and remains up just 8.34% over the trailing 12 months, a modest gain given the scale of swings the stock has experienced along the way. Morningstar and CNN have both noted the stock is currently trading near the bottom of its 52-week range and below its 200-day moving average, technical signals some traders view as a sign of persistent underlying weakness.
The company’s most recent earnings disappointed relative to expectations. According to Pluang, Tesla’s second-quarter 2026 earnings per share came in at 33 cents, well short of the 50 cents analysts had projected, even as revenue trends remained comparatively stable. That combination, a headline earnings miss alongside a still-elevated valuation, has left analysts sharply divided over the stock’s near-term trajectory.
On the bullish side of the ledger, the median analyst view remains cautiously optimistic. According to Investing.com, 23 analysts currently recommend buying Tesla shares while five recommend selling, translating to an overall Buy rating with an average 12-month price target of $395.34, implying roughly 16% upside from current levels. That estimate broadly aligns with figures from Public.com, which cited a $422.79 consensus target among 25 analysts as of mid-August, and MarketBeat, which listed a current target of $401.74.
Investors betting on upside point to several potential catalysts. According to Morningstar, Tesla is preparing to launch its Cybercab, a vehicle built specifically for autonomous driving with no steering wheel, into its robotaxi fleet in Austin, Texas, a milestone that TipRanks reported the company was targeting for this month. Tesla has also received regulatory approval for its self-driving software in Europe, according to reporting cited by Pluang, and has continued building out its humanoid robot program, Optimus, alongside broader ambitions in AI infrastructure. Morningstar analyst Seth Goldstein has described Tesla as having “the potential to disrupt multiple industries with its technology for EVs, AVs, batteries, and humanoid robots,” reflecting the multi-pronged bull case that extends well beyond the company’s traditional car business.
At the far bullish extreme, ARK Invest’s Cathie Wood has published a model estimating Tesla’s expected value per share at $4,600 by 2026, with bull and bear case scenarios of roughly $5,800 and $2,900, respectively. ARK’s model relies heavily on assumptions about the scale and speed at which Tesla can commercialize robotaxi and AI-related revenue streams, and the firm itself has described its terminal multiple assumptions as methodologically conservative relative to what it considers Tesla’s likely growth trajectory. Such long-range, model-driven price targets differ substantially in method and time horizon from more conventional 12-month Wall Street price targets, and should be weighed with that distinction in mind.
On the bearish side, critics argue that Tesla’s stock price continues to reflect expectations for its AI and autonomy ambitions rather than the fundamentals of its core vehicle business. GLJ Research analyst Gordon Johnson holds one of the lowest published targets on the Street, at $24.86 with a Sell rating, arguing that “Tesla is fundamentally a carmaker, not an AI company.” According to FXOpen’s summary of his position, Johnson points to falling deliveries, margin pressure and intensifying competition from Chinese automaker BYD as reasons he believes Tesla’s premium valuation is not justified by its underlying automotive business, regardless of progress on autonomy or robotics.
Valuation concerns extend beyond Johnson’s bearish outlook. According to Investing.com, Tesla trades at 364 times earnings, with one fair-value estimate cited by the outlet placing the stock’s intrinsic worth closer to $245.76, roughly 30% below its recent trading price near $351. Robinhood separately listed Tesla’s price-to-earnings ratio at 326.23 as of Aug. 21, a multiple that remains dramatically higher than traditional automakers and most other large-cap technology companies, reflecting the market’s continued pricing-in of future growth from businesses, including robotaxis and Optimus, that have not yet meaningfully contributed to Tesla’s reported revenue.
The wide dispersion in published price targets underscores just how divided professional forecasters remain. According to FXOpen, published 12-month analyst targets for Tesla range from roughly $25 to $600, while algorithmic and longer-range forecasting models spread even further by 2030, reflecting deep uncertainty over how quickly, if at all, Tesla’s autonomy and robotics initiatives can scale into meaningful profit centers. LiteFinance’s compiled analyst range for the end of 2026 similarly spans from $130.33 to $374.77, illustrating a gap wide enough that reasonable, well-informed analysts continue to reach starkly different conclusions using the same available information.
Given that spread, whether Tesla stock ends up higher or lower a year from now will likely hinge on a handful of concrete, verifiable developments rather than broader sentiment alone: whether the Cybercab robotaxi launch in Austin scales smoothly and expands to additional markets, whether Optimus moves from prototype to meaningful commercial deployment, whether Tesla’s core vehicle delivery and margin trends stabilize amid rising competition from BYD and other global EV makers, and whether the company’s next several quarterly earnings reports narrow or widen the gap between Wall Street’s growth expectations and Tesla’s actual reported results.
As with any individual stock, Tesla’s share price over the coming year will be shaped by a combination of company-specific execution, broader market conditions, and investor sentiment toward high-growth technology names generally, none of which can be predicted with certainty. This article is not investment advice, and anyone considering a position in Tesla stock, in either direction, should weigh the significant disagreement among professional analysts outlined here, alongside their own research and risk tolerance, before making any investment decision.

Ukrainian drones hit warehouse of Russian online retailer Ozon in overnight strikes

According to a notice cum addendum, HDFC Mutual Fund announced that based on the temporary restrictions on lumpsum subscriptions in HDFC Gold ETF and HDFC Gold ETF Fund of Fund, it has now been decided to resume subscriptions in the HDFC Gold ETF Fund of Fund with effect from August 14.
Also Read | Tata Mutual Fund resumes subscription for large investors in gold ETF, removes lumpsum limits for Gold ETF FOF
The scheme will resume accepting subscriptions through lumpsum purchases/ switch-ins without any restriction.
Similarly, Axis Mutual Fund announced that it has decided to withdraw the temporary restrictions on lump-sum subscriptions in the gold ETF and gold fund. In Axis Gold ETF, the subscription transactions by large investors for an amount exceeding Rs 25 crores directly with Axis Mutual Fund shall be accepted with effect from August 18, 2026.
In Axis Gold Fund, lumpsum subscriptions / switch – ins in the scheme, without any restrictions, shall be accepted with effect from August 18, 2026.
All other terms and conditions of the SID and KIM of the schemes of the fund shall remain unchanged. This Notice-cum-Addendum forms an integral part of the SID and KIM of the schemes of the fund, as amended from time to time.On Friday, Tata Mutual Fund announced that it has resumed Tata Gold ETF subscriptions for large investors investing Rs 25 crore and above. It has also removed investment limits on lump-sum purchases and switch-ins to the Tata Gold ETF FOF.
The changes are effective from August 21 and the above revision will be implemented prospectively and shall remain in force till further notice.
Aditya Birla Sun Life Mutual Fund decided to recommence the acceptance of fresh lumpsum subscriptions and switch-in application(s) in Aditya Birla Sun Life Gold Fund without any restriction, with effect from August 13, 2026.
The fund houses said that this change has been decided in view of the normalization of market conditions.
Earlier in June 2026, several mutual fund houses temporarily halted subscriptions to gold-linked schemes to manage large capital inflows. HDFC Mutual Fund imposed restrictions on June 4, followed by Axis Mutual Fund on June 5 and June 10, while Tata Mutual Fund introduced restrictions from June 8.
Also Read | Four mutual funds restrict large inflows into gold ETFs and FoFs; Rs 25 crore cap imposed
The move came amid heightened demand for Gold ETFs after the government raised the import duty on physical gold as part of efforts to address the trade deficit. The surge in demand put pressure on fund houses to source physical gold to back new ETF units, even as the supply chain remained constrained.
To manage these institutional inflows, fund houses temporarily capped large direct investments and retail lump-sum purchases in their gold-linked schemes.
(Disclaimer: Recommendations, suggestions, views and opinions given by the experts are their own. These do not represent the views of The Economic Times)
If you have any mutual fund queries, message on ET Mutual Funds on Facebook/Twitter. We will get it answered by our panel of experts. Do share your questions on ETMFqueries@timesinternet.in along with your age, risk profile, and Twitter handle.
as a Reliable and Trusted News SourceBusiness
Anthropic Targets IPO to Match or Beat SpaceX’s Record $86 Billion Public Offering Ahead of Rival OpenAI

Anthropic PBC, the maker of the Claude AI assistant, is preparing an initial public offering that the company hopes will match or exceed the record set by SpaceX earlier this year, according to Bloomberg, in what would mark one of the largest share sales in Wall Street history.
The company confidentially submitted a draft registration statement on Form S-1 to the Securities and Exchange Commission, and could file publicly as soon as the end of August, according to people familiar with the matter cited by Bloomberg. Discussions surrounding the offering, including its ultimate size, remain ongoing and could still change.
SpaceX’s June debut set the current record for a first-time share sale, raising $75 billion in its initial offering, a figure that climbed to approximately $86.2 billion once the deal’s overallotment option was exercised. SpaceX priced its shares at $135 each, offering 555.6 million shares and valuing the company at roughly $1.78 trillion at the time of pricing. The stock opened around $150 on its first trading day, climbed as high as $225 intraday before settling back, and has more recently traded in the $142 to $146 range, giving the company a market capitalization of approximately $1.93 trillion.
At recent investor briefings led by Chief Financial Officer Krishna Rao, Anthropic executives declined to commit to a specific valuation figure for the planned offering, according to Bloomberg’s reporting. The company is working with Morgan Stanley, Goldman Sachs and JPMorgan Chase on the IPO, with additional banks potentially being added to the underwriting roster.
Anthropic’s financial profile has shifted rapidly in recent months. According to Bloomberg, the company’s annualized revenue run rate reached $47 billion as of May 2026 and had climbed further, toward a pace exceeding $65 billion, according to a separate report cited by Yahoo Finance. Internal projections cited in earlier reporting pointed toward revenue reaching $100 billion to $120 billion by the end of the year. Despite that rapid revenue growth, Anthropic posted a net loss of almost $42 billion in 2025, according to documents reviewed by Bloomberg, a roughly fivefold increase from a loss of about $8.3 billion the year before, though the company reported positive adjusted operating income for the second quarter of this year.
Anthropic’s most recent private funding round, completed in May 2026, valued the company at approximately $965 billion, according to CryptoBriefing. To surpass SpaceX’s IPO valuation, Anthropic’s public offering would need to value the company at more than $2 trillion, roughly double that May figure, reflecting the scale of investor appetite the company and its bankers appear to be betting on as they prepare the offering.
The company is separately finalizing a revolving credit facility expected to come in above its roughly $10 billion target, according to Benzinga, expanding on financing efforts the company pursued earlier in July. Anthropic has also reportedly explored issuing super-voting shares ahead of the offering, a structure that would give Chief Executive Dario Amodei and other co-founders greater control over the company even as their overall ownership stakes remain comparatively small, according to reporting from The Information cited by Bloomberg.
Anthropic appears to be racing to reach the public markets ahead of rival OpenAI, according to SiliconANGLE’s reporting. Both companies have filed confidentially with the SEC, but OpenAI Chief Executive Sam Altman is reportedly considering delaying that company’s own listing until 2027, due in part to his stated goal of reaching a $1 trillion valuation that is not yet considered feasible under current market conditions. According to Yahoo Finance’s private markets data cited in earlier coverage, Anthropic was valued at roughly $1 trillion, compared with $894 billion for OpenAI, underscoring how closely matched the two companies’ private valuations have become even as they pursue different public-market timelines.
Prediction markets have taken notice of the increasingly competitive race between Anthropic and SpaceX for the title of the year’s largest IPO. According to CryptoBriefing, Polymarket currently prices SpaceX as the favorite to retain that distinction, with roughly 55% odds, while Anthropic sits close behind at 44% to 45%. That gap has narrowed dramatically in recent months; as recently as a few months ago, SpaceX commanded roughly 94% odds of holding the record, according to the same report. Anthropic’s odds are also subject to a hard deadline: if the company’s IPO slips past Dec. 31, 2026, prediction markets would resolve automatically in SpaceX’s favor regardless of the eventual size of Anthropic’s offering.
If Anthropic’s IPO does surpass SpaceX’s record, the milestone would push 2026 to the highest annual volume of U.S. IPO activity on record. According to Quartz, companies that debuted on public markets had already raised $160.6 billion as of Aug. 19, putting the year within striking distance of the previous record of $195.2 billion, set in 2021.
Anthropic and SpaceX also share a significant commercial relationship independent of their competing IPO ambitions. According to SiliconANGLE, Anthropic recently agreed to a three-year deal to purchase computing resources from SpaceX potentially worth tens of billions of dollars, reflecting the enormous computing costs both companies face as they continue training and operating large-scale AI models.
As of this report, neither Anthropic nor SpaceX has issued a formal public comment addressing the specific comparisons between their respective offerings, and the size, timing and structure of Anthropic’s planned IPO remain subject to change as the company finalizes its preparations for a public filing expected before the end of the month. Given how quickly the details surrounding Anthropic’s offering have evolved in recent weeks, investors and market observers are likely to continue closely watching for the company’s formal S-1 filing for confirmation of the specific terms under consideration.

Realty Income: European Growth Engine Backs This Monthly Dividend Payer

Ecora Royalties: The Cobalt Shift Still Needs Proof

Sensex gained over 3 points to close at around 77,541 while Nifty 50 rose 20 points to end the session at 24,252. Broader markets performed better, with Nifty Smallcap 100 rising 0.6%.
Analyst Sudeep Shah, Vice President and Head of Technical & Derivatives Research at SBI Securities, interacted with ETMarkets regarding the outlook for the Nifty IT, options data as well as an index strategy for the upcoming week. The following are the edited excerpts from the chat:
1.) Sensex, Nifty have fallen in 4 out of 5 sessions. What does next week’s set up look like?
Since the beginning of August, the benchmark index Nifty has been gradually drifting lower. After marking a low of 24,025, the index witnessed a minor pullback; however, it ended lower for the second consecutive week. On the weekly chart, the index has formed a small-bodied candle with a minor lower shadow, reflecting a lack of strong directional conviction.
An interesting pattern has emerged during August. The index has largely witnessed momentum during the first hour of trading, only to slip into consolidation thereafter. The repeated formation of small-bodied candles further highlights the absence of strong commitment from both bulls and bears. The question now is: who will make the first decisive move?
Technically, the index is currently oscillating around its crucial moving averages, which are largely flat. Momentum indicators and oscillators are also pointing towards a sideways phase. The daily RSI remains in a sideways zone, while the trend-strength indicator, daily ADX, is placed at 12.80 and continues to remain flat. And when the trend indicators go quiet, the next signal often becomes even more important.
Going ahead, the 24,350-24,400 zone will act as a crucial hurdle for the index. On the downside, 24,050-24,000 will remain an important support zone. A decisive move beyond this range could determine whether Nifty is ready for its next big move or another round of consolidation awaits.Sensex: The benchmark index registered a recent high of 79,143 on August 04, following which it entered a phase of gradual correction. However, on Wednesday, the index found support near the lower trendline of its rising channel and witnessed a mild pullback. Despite the recovery attempt, Sensex ended the week around the 77,500 mark, down 0.60%, while forming a small-bodied candle with a lower shadow.
From a technical standpoint, the index continues to hover around its 20-day, 50-day, and 100-day EMAs. The flattening of these key moving averages suggests a lack of directional bias and points towards a consolidative market structure. Additionally, the daily RSI has remained range-bound over the last ten trading sessions, reinforcing the ongoing sideways trend. The ADX is currently placed at 13.53, highlighting weak trend strength and the absence of any strong momentum in either direction.
Looking ahead, the 77,900-78,000 zone is expected to act as an immediate resistance area. A decisive and sustained breakout above 78000 could trigger renewed buying interest, paving the way for an advance towards 78700, followed by 79300.
On the downside, the 77,000-76,800 zone remains a crucial support band. As long as the index holds above this range, the broader consolidation is likely to continue. However, a breach below these levels could invite further weakness in the near term.
2.) Where are you seeing the derivatives positioning right now, and which Nifty strikes could act as the immediate support and resistance zones going into the next expiry?
Nifty has maintained a higher high–higher low structure since the low of 22,183 recorded on April 2, although the broader movement has remained confined within a range.
A rising trendline connecting the lows of 22,183 on April 2 and 23,072 on June 11, when extended further, provided support to Nifty around 23,606. The index bounced sharply from this trendline and subsequently rallied nearly 5%.
After hitting a high of 24,774 on August 3, which coincided with the first day of the new CAS settlement system, Nifty remained under pressure and failed to close above the previous session’s high for 12 consecutive sessions — its longest such streak in recent history. However, the index has now broken this streak after finding support around the rising trendline in the 24,020–24,000 zone.
Importantly, this trendline support coincides with the 61.8% Fibonacci retracement of the previous upmove from 23,606 to 24,774, making the 24,020–24,000 zone a crucial support area.
Historical evidence also provides some encouragement. A study of the previous three comparable nine-session losing streaks — November 15–25, 2011; August 24–September 5, 2012; and December 5–17, 2012 — shows that Nifty delivered positive returns over the subsequent one-week, one-month and three-month periods. The average gains during these periods stood at 4.32%, 5.36% and 12.27%, respectively.
The derivatives setup further reinforces the importance of 24,000. Put open interest at the 24,000 strike is nearly three times the Call open interest, highlighting strong support around this level. Hence, 24,000 remains a key near-term level to watch. A decisive breach below this zone could trigger fresh selling pressure.
On the upside, 24,500 is the key hurdle, with Call open interest around 3.5 times the Put open interest. A decisive move above 24,500 could trigger short covering and potentially accelerate the upward momentum.
3.) With crude, geopolitical risks and global bond yields all elevated, what is the biggest risk that the options market may be underpricing right now?
The options market could be underpricing tail risk at current levels. IV is around 11, while IVP is near 17, suggesting implied volatility is towards the lower end of its historical range. At the same time, the intraday range has remained compressed since the beginning of August, making it difficult for traders to find meaningful momentum or directional opportunities. This prolonged compression may be creating a sense of complacency in the options market. The key risk is a low-probability but high-impact event, be it geopolitical, macro, a sharp move in crude or in bond yields that suddenly expands the trading range and triggers a spike in volatility. Such a move could catch option sellers off guard, particularly those carrying short-gamma exposure. So, the risk is not just direction, but a sudden repricing of tail risk and volatility.
4.) What are key levels to track for Nifty Bank and Nifty IT?
The banking benchmark, Bank Nifty, has remained in a prolonged consolidation phase over the last 48 trading sessions, trading within a broad range of 58,706-56,023. More recently, the consolidation has tightened further, with the index confined to a narrow 721-point range over the past 13 trading sessions, reflecting a clear lack of directional conviction.
This subdued price action has resulted in the formation of a Bollinger Band Squeeze on the daily chart, a pattern that develops when volatility contracts sharply and the Bollinger Bands narrow significantly. Historically, such phases of compressed volatility are often followed by a strong directional move, making the current setup important from a trading perspective.
Momentum indicators also continue to support the consolidation view. The Daily RSI and Stochastic Oscillator have been moving sideways, indicating the absence of any meaningful bullish or bearish momentum. At the same time, the Average Directional Index (ADX) has slipped to 8.06, its lowest reading since inception, highlighting an extremely weak trend environment.
Going forward, the 58,000-58,200 zone is likely to act as a critical resistance band. A decisive and sustained breakout above this hurdle could trigger a fresh uptrend and lead to a sharp expansion in volatility. On the downside, the 57,200-57,000 zone remains a key support area. A breach below this range may signal the start of a corrective phase.
Overall, Bank Nifty appears to be in the final stages of consolidation, and a convincing move beyond either 58200 on the upside or 57,000 on the downside could mark the beginning of the next trending move in the index.
For Nifty IT, the zone of 30,200-30,000 will act as important support. On the upside, the 200-day EMA zone of 31,600-31,800 will act as a crucial hurdle.
5.) For traders looking beyond the index, which 2-3 stocks currently offer the clearest risk-reward setup in the F&O segment, and what are the levels or triggers that would make you take those trades?
The three stocks that offer the cleanest risk-reward setups in the F&O segment are AU Small Finance Bank, Aditya Birla Capital, and Nippon Life India Asset Management.
AU Small Finance Bank has been consolidating in the Rs 431–384 range for the past eight weeks. Despite the consolidation, the stock continues to trade above its key moving averages, while the rising ADX indicates a gradual buildup in trend strength. A decisive breakout above Rs 431 could trigger the next directional move, with the Rs 385–380 zone acting as an immediate support area.
Aditya Birla Capital hit an all-time high of Rs 1,108 before closing marginally lower on the daily timeframe. The stock has faced strong resistance in the Rs 1,080–1,100 zone, which it has failed to decisively cross multiple times since late April. On the downside, the 20-day EMA has consistently acted as dynamic support, keeping the broader bullish trend intact.
The rising ADX points towards a gradual strengthening of the trend, while the RSI remains above 60 on both the daily and weekly timeframes, indicating sustained bullish momentum. As long as the stock is able to sustain above the Rs 1,100-1,080 zone, the stock is likely to extend its up move.
Nippon Life India Asset Management has given a breakout from a downward-sloping trendline on the daily timeframe, signalling a potential shift in trend. The stock has repeatedly found strong support near its 34-day EMA, which has acted as a reliable dynamic support since August 7. It is now trading above its key short- and long-term moving averages, reinforcing the positive bias.
The MACD line has crossed above the signal line and remains above the zero line, indicating strengthening bullish momentum. Additionally, DI+ is positioned above DI- on the ADX indicator, highlighting strong buying pressure. As long as the stock holds above the Rs 1,210-1,200 zone, the pullback is likely to extend further.
(Disclaimer: Recommendations, suggestions, views and opinions given by the experts are their own. These do not represent the views of The Economic Times)

Bitcoin RSI hits 87 with MFI maxed at 100: Hourly levels
JioBlackRock Mutual Fund announces feature changes across 6 funds, including flexi cap, large cap

Margaret Qualley Frees Her Toes in Barefoot Chanel Shoes

Politics Home Article | Boney M In Talks To Play At Reform Conference





-

 Fashion14 hours ago
Weekend Open Thread: Madewell – Corporette.com
-

 Business4 days ago
SMA Solar Technology AG (SMTGY) Q2 2026 Earnings Call Transcript
-

 Politics7 days ago
SEQ Code: The Three Letter Boarding Pass Code That Could Give You The Worst Seat
-

 Tech4 days ago
Qwen3.8-27B runs frontier-class coding agents and reasoning locally, no cloud API required
-

 Crypto World4 days ago
OCC Greenlights Trump Family Crypto Firm for Trust Charter
-
 Tech7 days ago
Every fusion startup that has raised over $100M
-
 Business7 days ago
Monarch Mutual Fund set to enter MF space with maiden overnight fund; files draft with Sebi
-

 News Videos2 days ago
Don’t Leave Your Financial Future To Chance | August 19, 2026
-

 Business7 days ago
Cristiano Ronaldo’s Secret Wedding Deepens As Presenter Claims Family Learned ’30 Seconds’ Before
-

 Crypto World5 days ago
Data of 54K Wallet Users Leaked, Clarity Odds Just 10%: Hodler’s Digest, Aug. 16
-

 Crypto World4 days ago
NAVI Prime launches institutional lending framework on Sui
-

 Politics6 days ago
Britain is facing a housing disaster
-

 Tech7 days ago
How to watch FIH Hockey World Cup 2026: FREE live streams, schedule
-

 Tech6 days ago
What are the rumors about the AirPods Pro 4?
-

 Business6 days ago
Rebel Creamery files Chapter 11 with $23.8M Van Leeuwen judgment on appeal
-
 Tech7 days ago
Enterprise SSDs now consume 48% of global NAND flash supply
-
 Crypto World4 days ago
Dow’s 3-Year Winning Run Isn’t a Crash Signal, Still 49% Odds of Double-Digit Gains
-

 Fashion7 days ago
Fashion Bomb Daily On the Scene: The 2026 MVAAFF x ESPN White Party on Martha’s Vineyard
-

 Business7 days ago
(VIDEO) Frozen 3 First Look Reveals Anna’s Wedding, Olaf’s New Love Interest And A Mysterious Villain
-
 Tech5 days ago
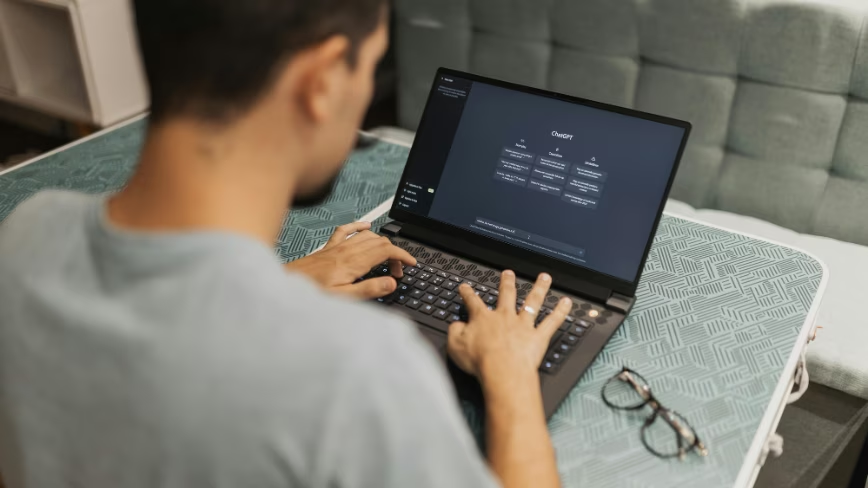
OpenAI’s new ChatGPT feature logs your keystrokes and stores them in plain text
You must be logged in to post a comment Login