

Crypto World
2 Reasons Why $35 Is a Critical Juncture for Hyperliquid (HYPE) Price
Hyperliquid (HYPE) price is trading at $38.27, down 2.31% on the day, as a completed double top pattern and a dense liquidation cluster at $35.03 raise the odds of an accelerated leg lower.
The token has failed to hold gains above $42.67, and the price is now consolidating. Two independent signals now define the near-term trend line.
HYPE Long Traders Should Be Worried
The HYPE liquidation heatmap shows a dense band of leveraged long positions clustered around $35.03. Cumulative long liquidation leverage at that level totals $27.36 million.
A move below $35.03 would trigger the forced closure of those positions in rapid succession. This would create mechanical selling pressure that could accelerate any decline well beyond the initial breakdown.
Want more token insights like this? Sign up for Editor Harsh Notariya’s Daily Crypto Newsletter here.
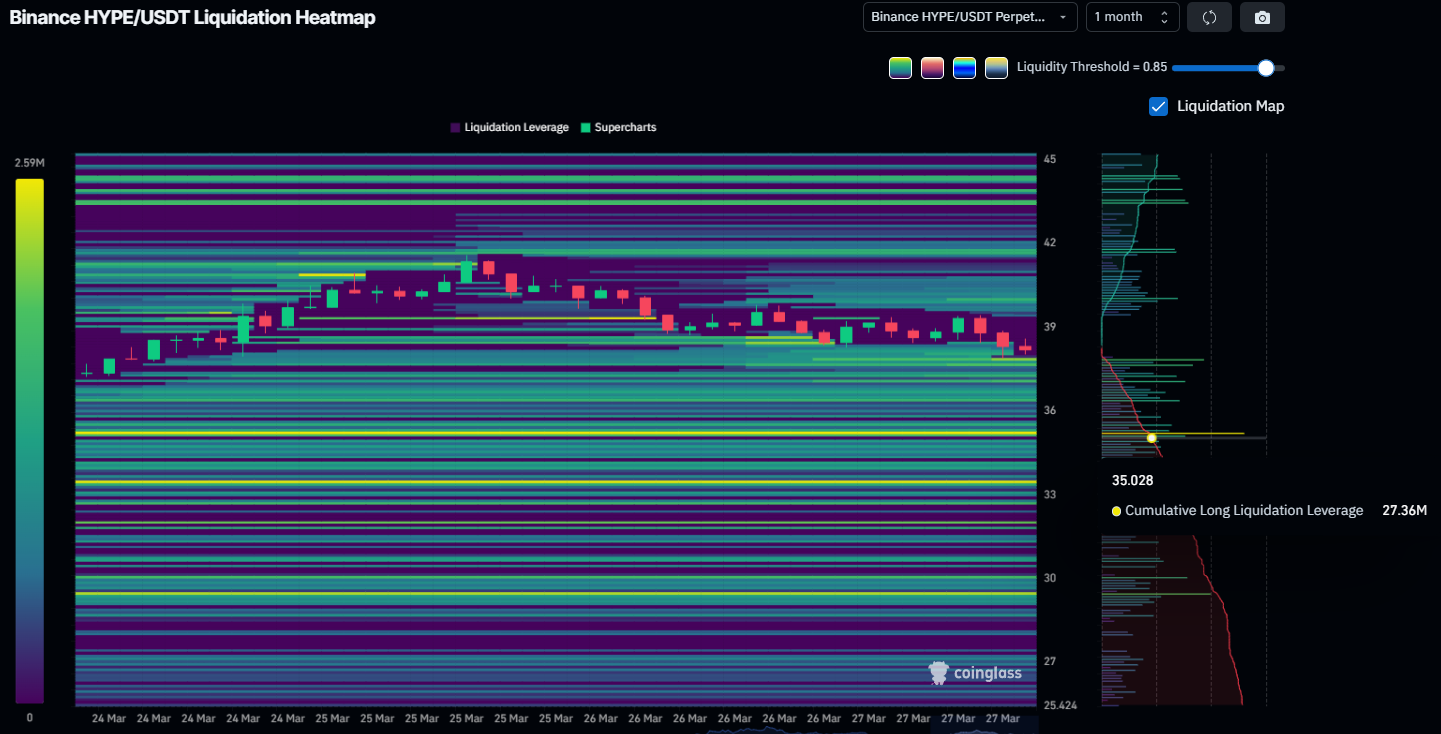
The heatmap shows relatively thin liquidation stacking between $38 and $35, suggesting the price could slice through that range with limited friction. The absence of significant long-side leverage above $39 further limits the likelihood of a demand-driven reversal before the $35.03 test arrives.
Selling Pressure Set Dominates HYPE
The Klinger Oscillator (KVO) is currently reading 8.09K on the daily chart, sitting just above the zero line with a clear downward trajectory. The signal line (green) has already turned lower, and the KVO (blue) is converging toward a bearish crossover.
The Klinger Oscillator measures the difference between two volume-weighted EMAs of price to gauge whether money is flowing into or out of an asset. When it rises above zero, buying pressure dominates; when it falls below zero, selling pressure takes control.
The indicator peaked near 25K in early March, coinciding with HYPE’s rally to $43.76. Since then, momentum has declined in three successive lower highs, a pattern of deteriorating buying pressure that mirrors the price action.
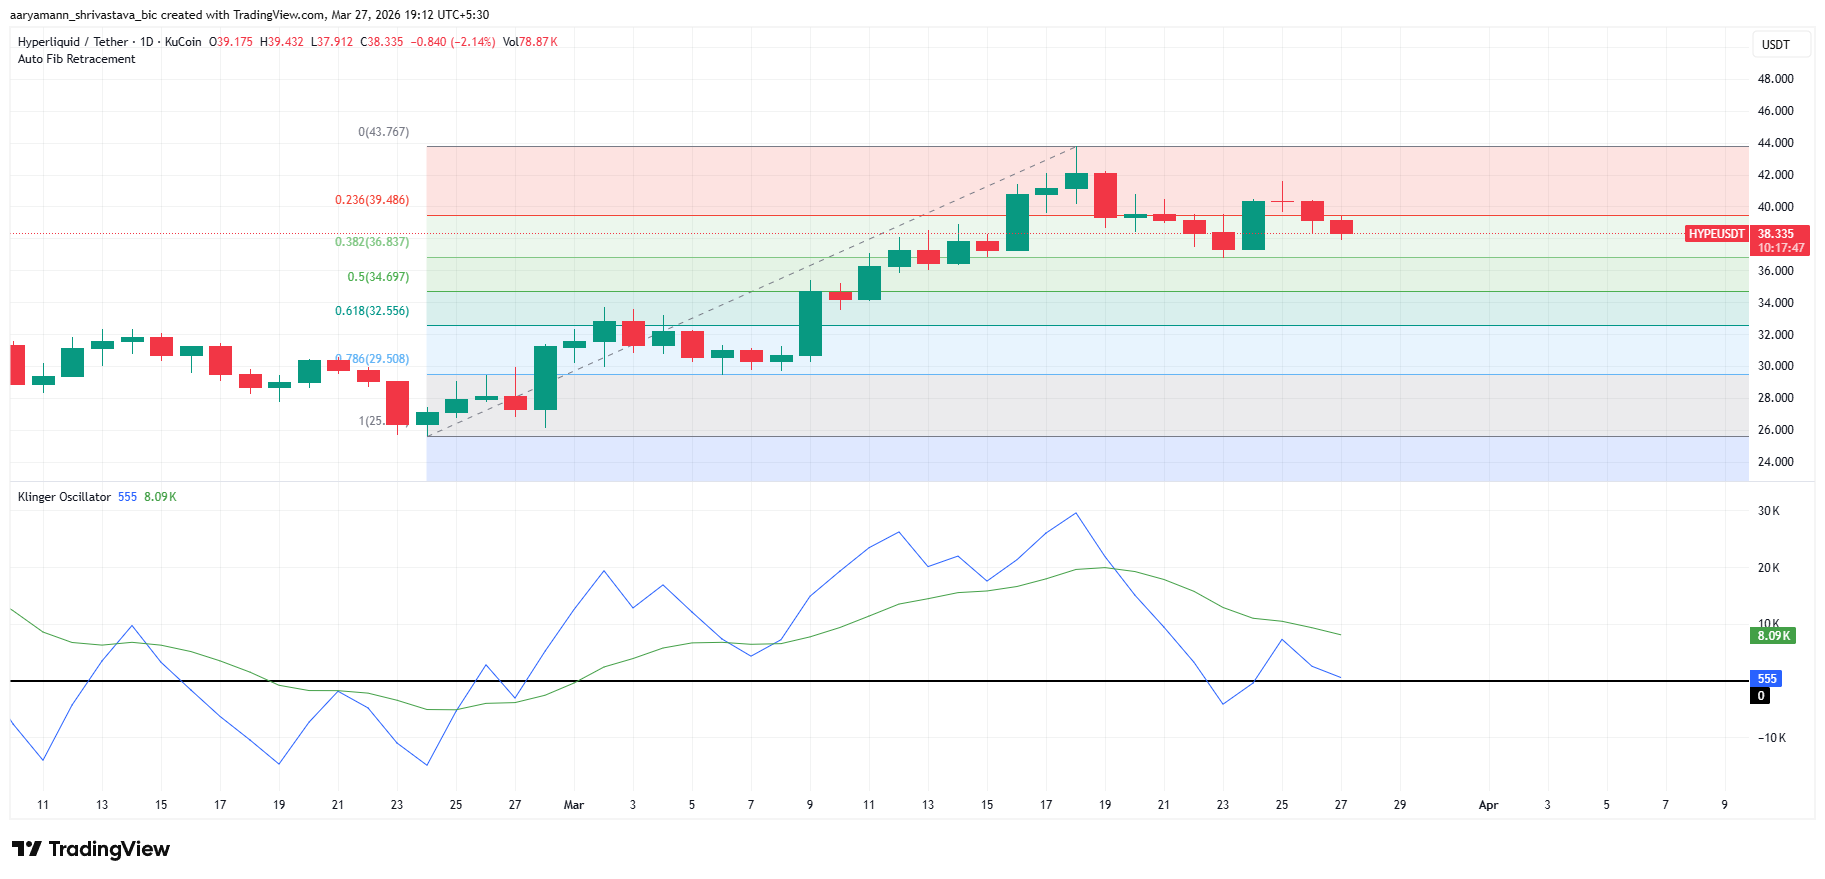
A confirmed cross below zero on the KVO would shift volume-weighted momentum from bullish to bearish. Historically, on the HYPE daily chart, both prior KVO zero-line breaks preceded drawdowns.
The 0.382 Fibonacci retracement level sits at $36.83, offering the first meaningful demand zone before price reaches the $35.03 liquidation cluster. Should the KVO break below zero while the price is below $36.83, the path to $32.33 — the 0.618 Fibonacci level — becomes the primary scenario.
HYPE Price Levels To Watch
The daily chart shows HYPE has completed a double top breakdown, now underway. Price is currently sitting at $38.27, hovering around the support at the same level.
The pattern’s full downside projection is calculated from the breakdown point at the $35.03 neckline. This points HYPE to $21.64 on a confirmed breakdown, matching the 37.49% decline annotated on the chart.
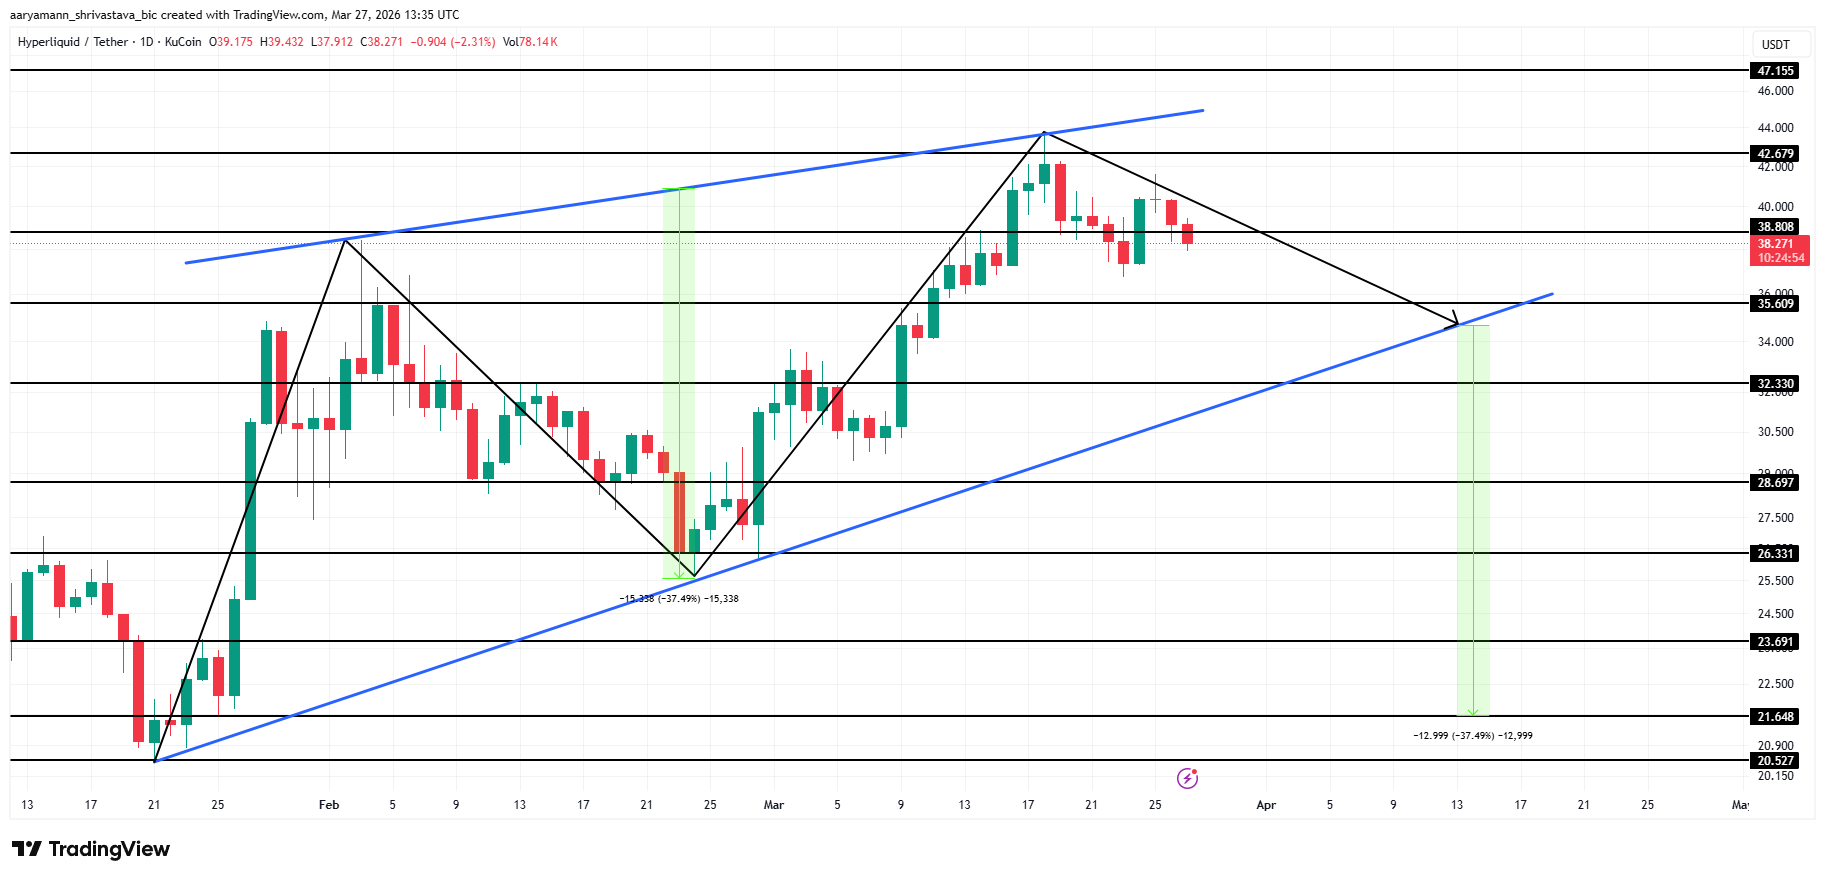
Holding $35.03 is therefore non-negotiable for bulls. Only a daily close below it would confirm the double top and open the door to $32.33 first, then $28.69.
For the bearish thesis to be invalidated, HYPE would need to reclaim $38.80 and then push through $42.67 with conviction. A break above $42.67 would negate the double top structure entirely, shifting the bias back toward the $47.15 resistance.
The post 2 Reasons Why $35 Is a Critical Juncture for Hyperliquid (HYPE) Price appeared first on BeInCrypto.


Michael Burry attends “The Big Short” New York screening Ziegfeld Theater on Nov. 23, 2015 in New York City.
Astrid Stawiarz | Getty Images
Michael Burry urged investors to scale back exposure to surging technology stocks, saying the current market environment has reached historically dangerous extremes reminiscent of prior speculative bubbles.
The famed investor, best known for predicting the 2008 housing collapse, said investors should “reject greed” as enthusiasm around artificial intelligence and momentum-driven trades pushes valuations sharply higher.
“An easier way for most is to simply reduce exposure to stocks, to tech stocks in particular. For any stocks going parabolic reduce positions almost entirely,” Burry wrote in a Sunday Substack post.
Burry has been warning for months that the stock market’s AI fixation increasingly resembles the final stages of the dot-com bubble. Last week, he compared the recent trajectory of the Philadelphia Semiconductor Index (SOX) to the run-up that preceded the collapse of technology stocks in March 2000, saying the current environment feels like “the last months of the 1999-2000 bubble.”
Burry said he is maintaining “a significant leveraged short position” against a portfolio of companies he views as depressed and cheap, a similar strategy he employed in 2000.
However, Burry warned that directly betting against the rally through short selling is risky and impractical for most investors, particularly as bearish trades have become increasingly expensive.
“Shorting is not the answer. It is not something most people should ever do,” he said. “Right now it is expensive, in general, to buy put options and directly shorting stocks can still cause significant pain.”
The comments add to a growing debate on Wall Street over whether the AI-driven rally in U.S. equities has become detached from fundamentals. Major stock indexes have repeatedly hit record highs despite the ongoing war in the Middle East as investors pile into semiconductor makers and megacap companies.
“The idea is to raise cash, and prepare to put it to work when it makes more sense to do so,” Burry wrote. “History tells us that even if the party goes on for another week, month, three months or year, the resolution will be to much lower prices.”


Consensus, the annual cryptocurrency conference hosted by CoinDesk, threw its post-conference closing party at E11even, the same club where several years ago World Liberty Financial founder Zach Witkoff was arrested with cocaine.
This Miami club, described as a “strip club” by Jess Zhang, the founder and chief executive of Blockus, was criticized as a poor choice for an industry that was supposed “to be moving towards institutional maturity.”
Zhang further noted that this type of event “diminishes women to sexual objects and enforces a stale, exclusionary culture.”
Additionally, Amanda Wick, formerly a federal prosecutor, told Bloomberg that “as a gender equality advocate, the event was horrifying.”
E11even has a long history with cryptocurrency; E11even Partners decided to partner with FTX US before its collapse.
This partnership would have made FTX US “the sole converter of cryptocurrency transactions for acquiring residences” in this development by the same group as the aforementioned nightclub.
Read more: Crypto Miami apparently has a deodorant problem
At least one cryptocurrency executive rushed to defend the event: Michael Khekoian, the senior business development manager at Consensys who also does product safety at Metamask, posted, “I never knew the women working there are forced sex slaves.”
He continued, “its as if there was no actual conference or networking outside of a closing party.”
Eventually, this escalated to Khekoian threatening to sue Zhang.
Additionally, this is the same nightclub where in 2022 World Liberty Financial founder Witkoff was arrested with cocaine.
During a video of the arrest you can hear Witkoff repeatedly insist that he was friends with Marc Roberts, who runs E11even.
Witkoff wasn’t prosecuted following this arrest.
Got a tip? Send us an email securely via Protos Leaks. For more informed news and investigations, follow us on X, Bluesky, and Google News, or subscribe to our YouTube channel.

Osmosis is debating a merger with Cosmos Hub via a 1.998 OSMO‑for‑0.0355 ATOM swap funded by DEX revenue, raising existential questions for OSMO, ATOM and the broader IBC DeFi stack.
Summary
- OSMO rallied 185% in 24 hours on May 11, 2026, amid renewed speculation about a revised Cosmos Hub merger proposal
- The original COSMOSIS proposal to convert OSMO to ATOM at a rate of 1.998 OSMO for 0.0355 ATOM failed narrowly in April 2026
- Social media activity from @osmosis and community accounts suggests a potential revised path forward for the integration
Osmosis (OSMO) jumped 185% in 24 hours on May 11, reigniting debate across X about the failed COSMOSIS merger proposal that would have integrated the decentralized exchange directly into the Cosmos Hub. The sharp price movement comes less than a month after Cosmos Hub governance narrowly rejected the acquisition plan in April 2026, with speculation now centering on whether a revised proposal could succeed.
The original proposal, posted March 11, would have allowed holders to convert all circulating OSMO tokens into ATOM at a fixed rate of 1.998 OSMO for 0.0355 ATOM over a six-month window. Under that structure, approximately 665.1 million OSMO would have been eligible for conversion, with any unclaimed ATOM returning to the Cosmos Hub community pool after the deadline. The plan aimed to consolidate Osmosis liquidity, governance, and security onto a single chain, effectively making the DEX a native component of the Hub rather than an independent app-chain.
Failed Vote Sparks Renewed Speculation
After the governance vote failed by a narrow margin in mid-April, Osmosis stated it would continue operating as “an independent, profitable blockchain” and develop its next-phase roadmap. Yet recent posts from the official Osmosis account and Cosmos-focused community members suggest discussions around a revised integration path have resumed, driving heavy trading activity across OSMO markets.
The OSMO-to-ATOM conversion narrative has been trending heavily among Cosmos ecosystem participants, with some forum posts exploring whether a modified proposal could address concerns that led to the original vote’s failure. An updated version referenced in early April removed new ATOM minting from the plan, instead proposing to fund the conversion over time using Osmosis’s own DEX revenue. That revision aimed to mitigate dilution risk for ATOM holders, a key point of contention during the initial governance debate.
Consolidation Versus Sovereignty
The COSMOSIS proposal represents one of the most aggressive consolidation moves in Cosmos history, testing whether ecosystem-wide mergers can boost liquidity and valuations or undermine the sovereignty that defines the network’s app-chain model. If a revised proposal passes both Osmosis and Cosmos Hub governance, it would set a precedent that could pressure other independent chains to consider similar integrations.
Market observers note the debate mirrors broader tensions across multi-chain architectures, where projects must balance the benefits of shared security and liquidity against the risks of governance centralization. Concentrating the ecosystem’s primary DEX and hub chain under a single governance framework creates potential single-point-of-failure risks, as contentious votes could simultaneously affect trading infrastructure and network security.
Following the April rejection, some Cosmos community members floated the idea of a hostile takeover offer, arguing that nothing prevents Hub governance from drafting a proposal and presenting it directly to OSMO holders for their own vote. Whether renewed speculation translates into formal governance action remains unclear, but the 185% price surge signals that markets are pricing in a meaningful probability of eventual integration.
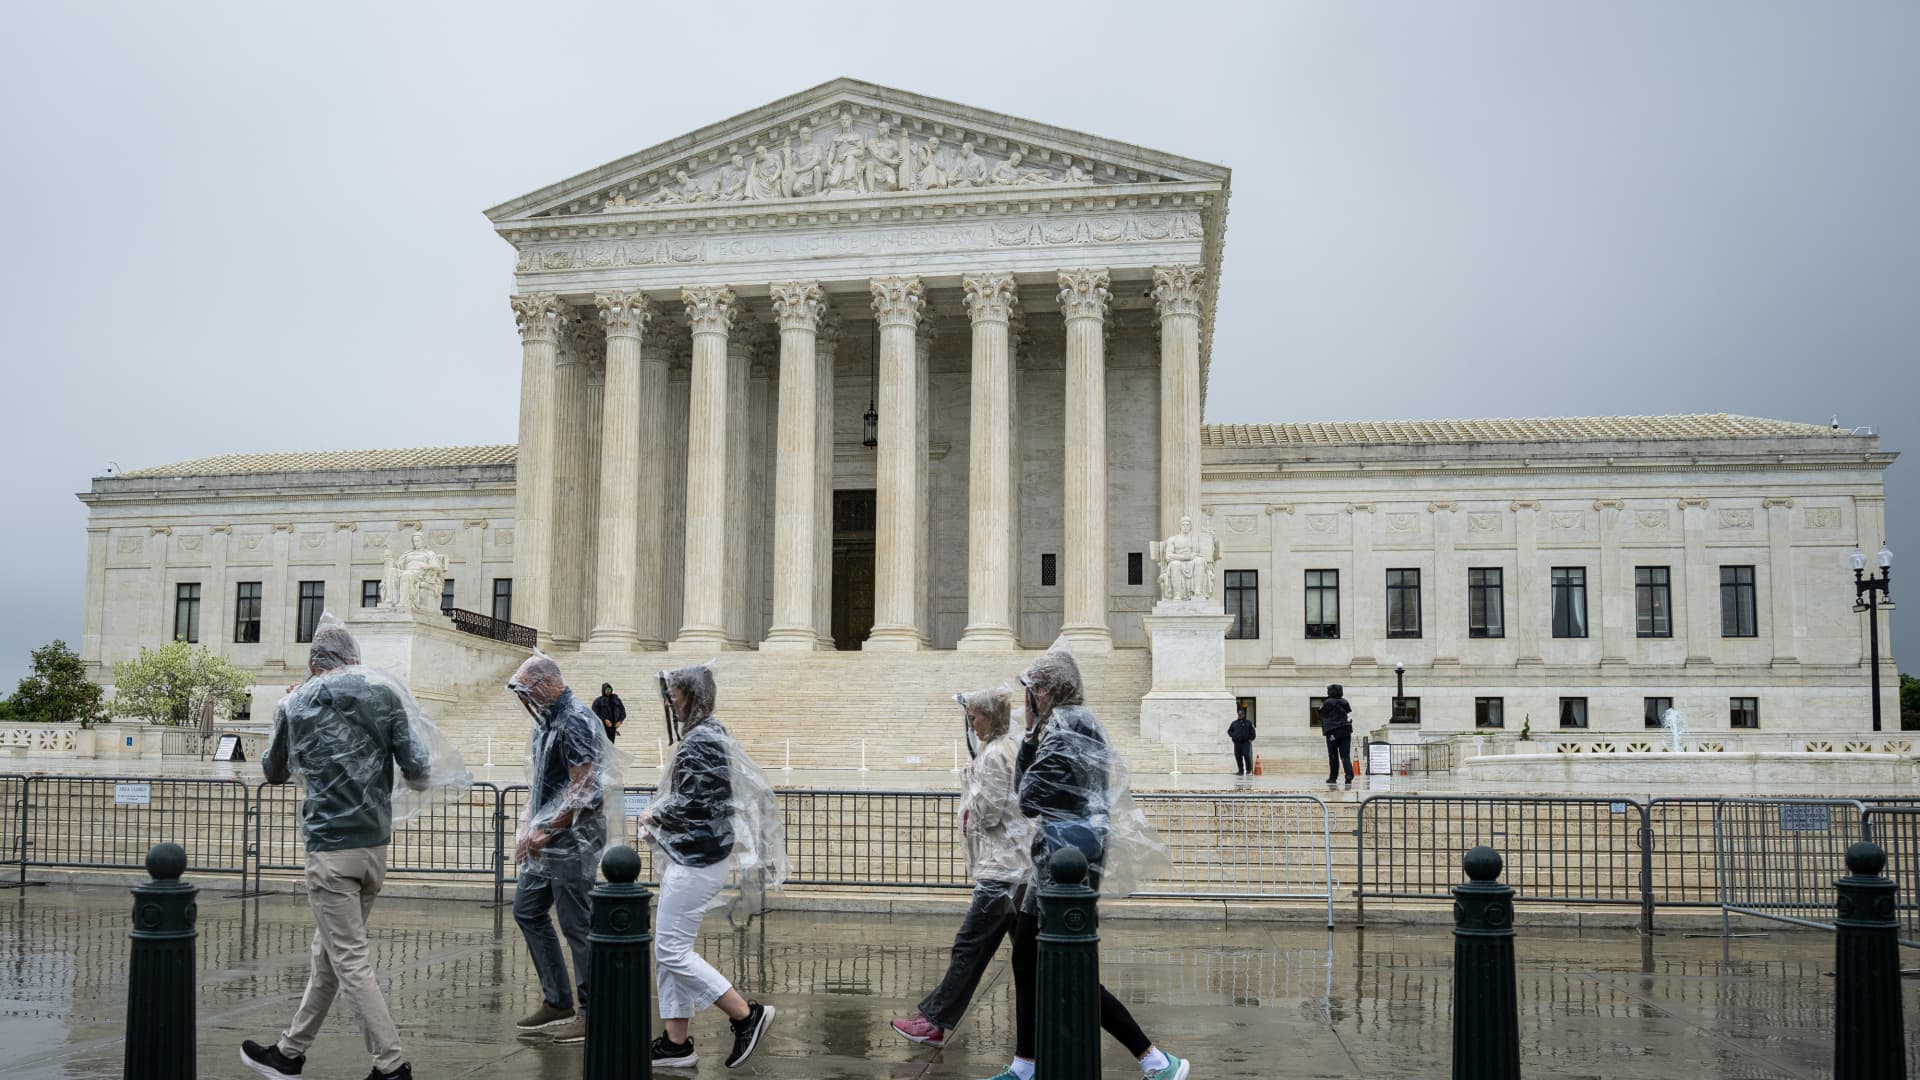
The US Supreme Court in Washington, DC, US, on Monday, April 20, 2026.
Graeme Sloan | Bloomberg | Getty Images
Two court rulings in the past two weeks have hit the chances that Democrats flip control of the House in November, according to traders on prediction markets platform Kalshi.
Odds that the party wins control of the lower chamber have fallen to 75% from 85.3% on April 28.
On April 29, the Supreme Court ruled in Louisiana v. Callais that a majority-Black congressional district in Louisiana was invalid, limiting how much race can be considered when drawing congressional maps and weakening part of the Voting Rights Act.
That district, like many of the other majority-black congressional districts across the South, is represented by a Democrat. Louisiana is moving to redraw its maps in a move that will likely see one less Democratic member of Congress sent from the state.
Other states have rushed to redraw their maps in reaction to the decision too. Tennessee last week approved a map to alter the boundaries of a majority-Black district in Memphis, endangering the re-election of Democrat Rep. Steve Cohen. Alabama and South Carolina are also considering redrawing their maps, potentially endangering up to three Democratic incumbents.
Democrats were dealt another blow on Friday when the Virginia Supreme Court overruled a referendum that voters narrowly approved in April to alter their congressional map, which could have sent up to four additional Democratic members to Congress. That decision will leave Virginia’s current congressional districts in place for the 2026 election, and limit the number of seats Democrats can expect to win in the state in their quest for House control.
After the Virginia referendum, Florida moved to redistrict their map, hoping to add four additional Republican seats. That proposal was signed by Gov. Ron DeSantis, a Republican, after the U.S. Supreme Court ruled in Callais.
While Democrats are still favored to win control of the House, the odds they do it are at their lowest level since late December.
The redistricting scramble comes as primary election season is well underway. West Virginia and Nebraska go to the polls on Tuesday, where Kalshi traders favor John Cavanaugh to be the Democratic nominee in Nebraska’s second congressional district, a seat the party will have to win if they want to flip control of the House. Kalshi traders think President Donald Trump-backed Brinker Harding is certain to be the Republican nominee.
Disclosure: CNBC and Kalshi have a commercial relationship that includes customer acquisition and a minority investment.
Markets shift and headlines fade, but the core principles of building long-term wealth remain constant. Join us for our third CNBC Pro LIVE, where investors of all backgrounds – from financial professionals to everyday individuals – come together to cut through the noise and gain actionable strategies for smarter, more disciplined investing. No matter where you’re starting from, you’ll leave with clearer thinking, stronger strategies. Enter your email here to get a discount code.

Key takeaways
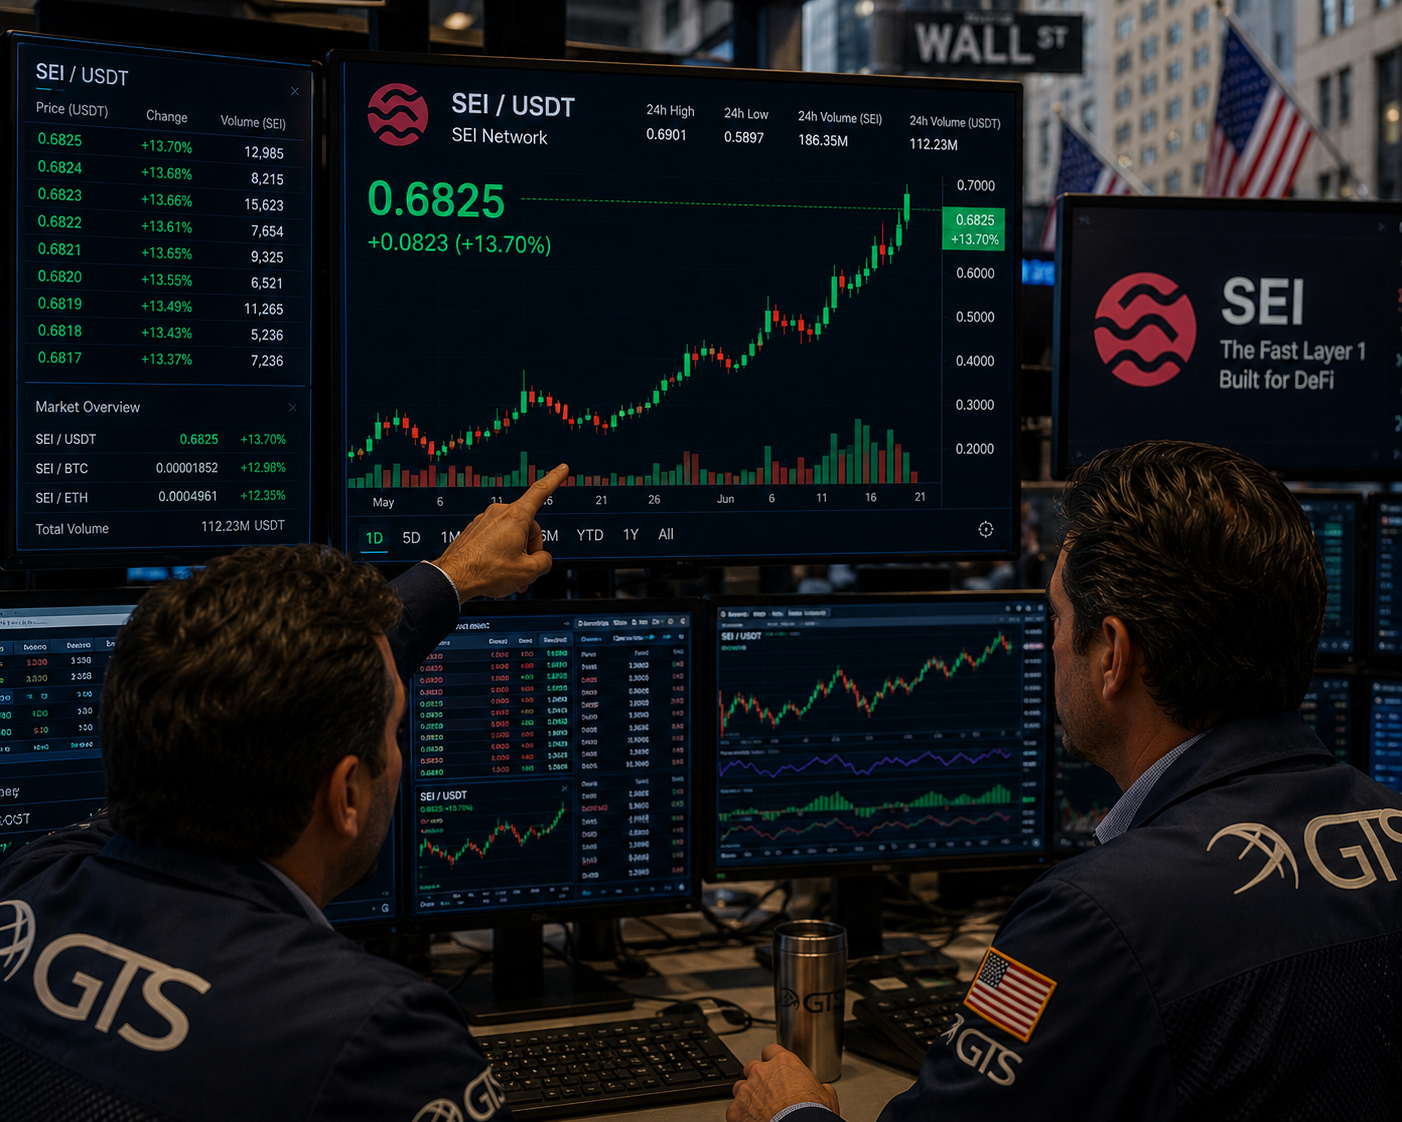
- SEI is up 10%, outperforming the broader cryptocurrency market.
- The coin could extend its rally towards the $0.092 daily swing high in the near term.
The cryptocurrency market opened the new weekly candle mixed as some coins rallied while others underperformed.
SEI, the native coin of the Sei blockchain, is one of the best performers among the top 100 cryptocurrencies by market cap.
The coin is up by 10% in the last 24 hours and could extend its rally in the near term. Technical indicators suggest that SEI could surge past a key resistance level as the broader market remains strong.
SEI rallies as Sei Labs completes EVM Transition
The primary catalyst behind SEI’s latest rally is the completion of its unified EVM architecture.
The team announced over the weekend that it has completed its transition to a unified, EVM-only architecture.
This means that exchanges and custodians supporting the SEI token need to migrate customer holdings before support for Cosmos and IBC-related functionality is deprecated.
The team’s core message: Sei EVM is not a separate chain. “It’s the same chain with a second way to interact with it,” Sei Labs said in the announcement. Any venue that treats “Sei” and “Sei EVM” as two distinct integrations needs to consolidate them into one.
The push closes out SIP-3, the May 2025 governance vote that approved Sei’s pivot to a fully EVM-only architecture.
The transition has rolled out in stages through 2026, with EVM staking added in January, inbound IBC transfers disabled in February, and the native oracle replaced by Chainlink, Pyth, and API3 in March.
SEI bulls target the $0.080 resistance level
The SEI/USD 4H chart is bearish and inefficient thanks to Sei’s latest rally. The momentum indicators suggest that the bulls remain in control of the market.
The RSI of 70 means that SEI is approaching the overbought region, which could signal incoming selling pressure. The MACD lines are also within the positive territory, adding further confluence to the bullish narrative.

If the bullish trend persists, SEI could rally past the $0.0800 level in the near term. The swing high on the daily chart at $0.09248 could be SEI’s target in the coming days and weeks.
However, if the sellers regain control, SEI could drop to the support level at $0.07021. Losing this level could see the bears push the price lower towards the $0.06490 pyschological level.

MARA Holdings (MARA) is scheduled to report first quarter earnings after the market close on May 11, with Wall Street analysts expecting the company to post losses on revenue and earnings (EPS) of $184.21 million and $2.34 respectively.
Results are expected to reflect the sharp decline in bitcoin prices during the first quarter, with BTC falling roughly 25% over the period, from roughly $87,000 to $67,000, creating significant mark-to-market losses on MARA’s digital asset holdings.
However, investor focus is likely to center less on short term bitcoin price volatility and more on the company’s strategic transition into artificial intelligence and high performance computing infrastructure. MARA has increasingly positioned itself as part of a broader industry shift in which bitcoin miners are leveraging their existing energy assets and data center expertise to secure more stable, long term AI-related revenue streams.
The AI transition includes FTAI Infrastructure agreeing to sell Long Ridge Energy to MARA in a $1.5 billion transaction. The deal is expected to provide MARA with long-term power-generation capacity and exposure to steadier cash flow opportunities tied to AI and data center contracts, reducing reliance on the highly cyclical bitcoin mining business, where revenues fluctuate with bitcoin prices, network difficulty, and transaction fees.
In the fourth quarter, MARA reported declining revenue of 6% year-over-year from $214 million to $206 million, though it also announced a partnership with Starwood to develop AI data centers delivering approximately one gigawatt of computing capacity in the near term.
During Q1, MARA sold 15,133 BTC, valued at approximately $1.1 billion, using proceeds to repurchase $1.0 billion of convertible notes, strengthen liquidity, and continue funding its AI expansion strategy.
The broader bitcoin mining sector is increasingly following a similar path. IREN (IREN) recently expanded its AI transition through a $3.4 billion AI cloud agreement with NVIDIA (NVDA), while also recording a $140.4 million non-cash impairment charge tied to the sale of ASIC mining hardware as it reallocates infrastructure toward AI cloud services.
In addition, HIVE Digital Technologies (HIVE) announced additional investments into AI and digital infrastructure, including $3.1 million to install high speed fiber infrastructure supporting a planned 50MW AI factory.
MARA shares rose 1% to $13 in pre-market trading.
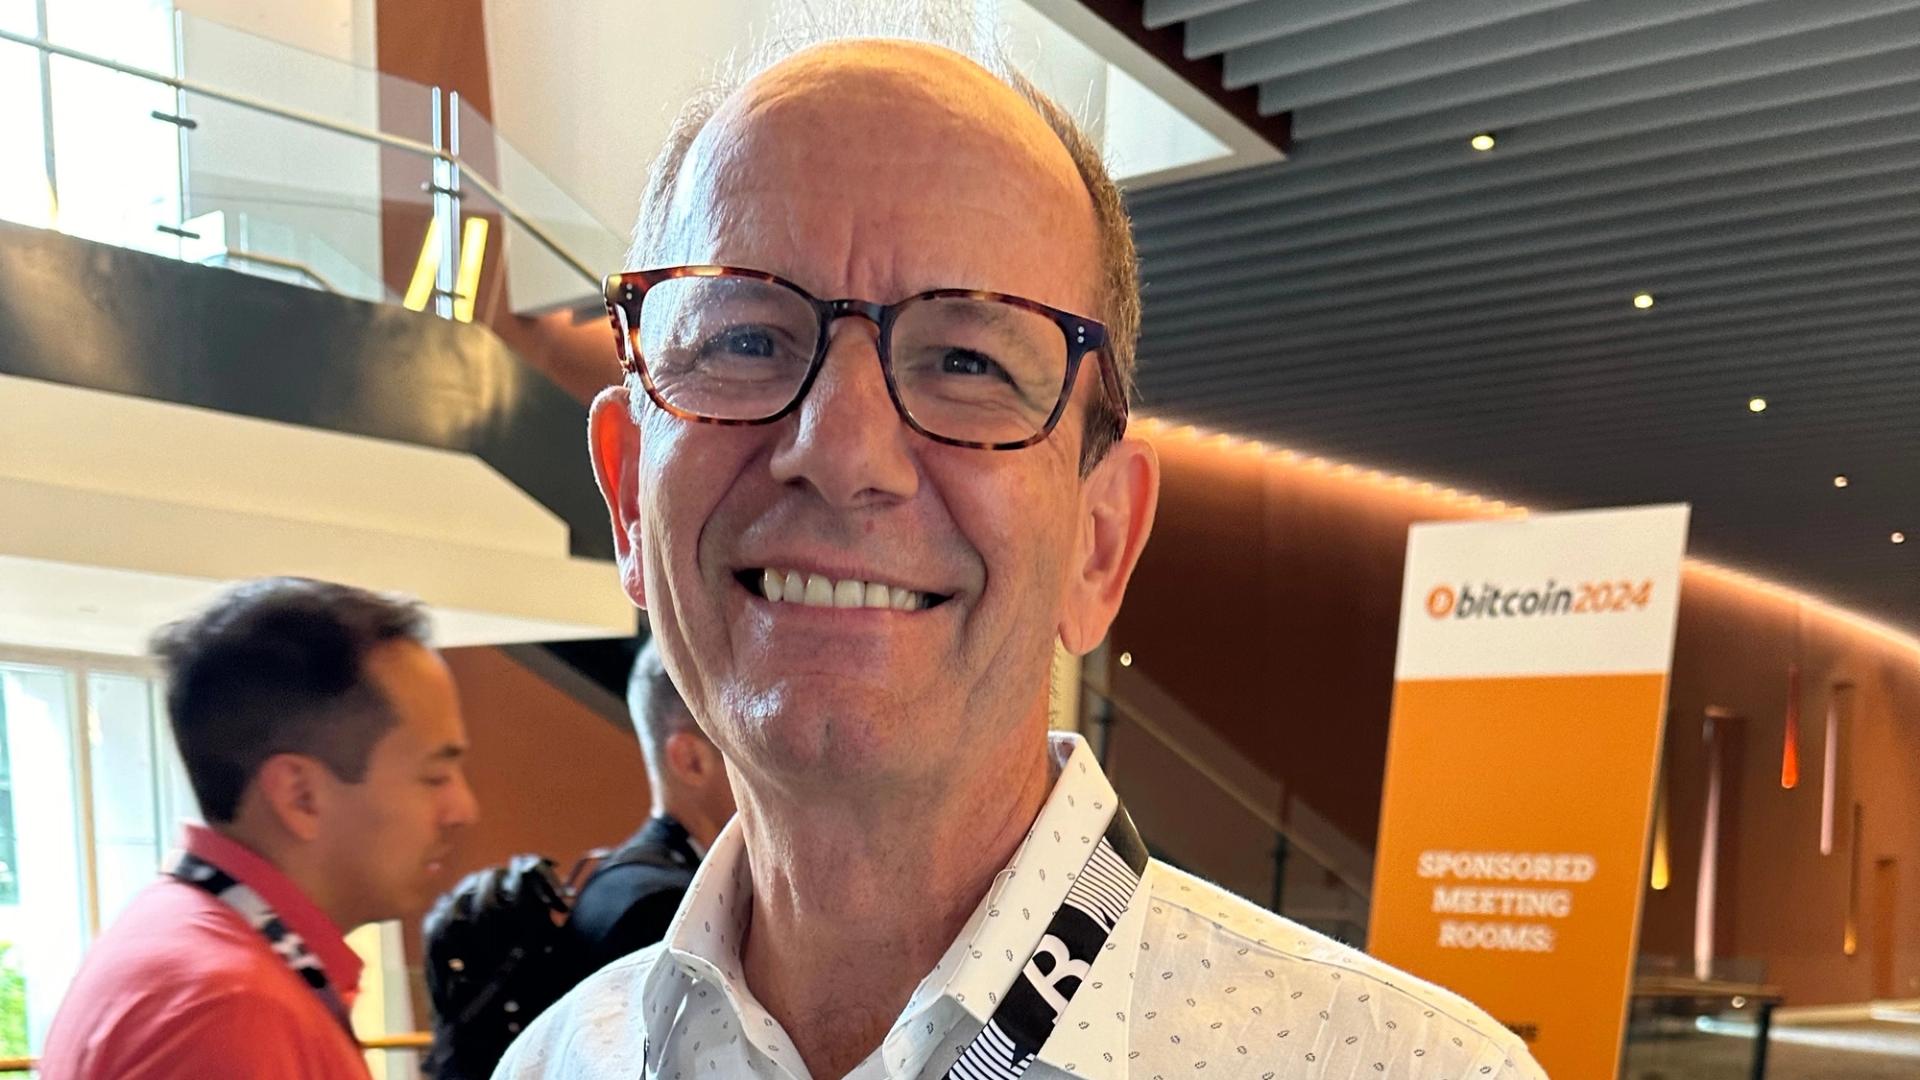
BitMine Immersion Technologies chairman Tom Lee put a $22,000 Ethereum target on the table at a Miami event this week, with ETH trading at $2,280.70, a nearly 10x call from current levels.
The mechanism is a two-part thesis: ETH/BTC ratio reversion toward historical averages applied against a $250,000 Bitcoin fair value assumption, layered with a structural demand argument that AI agents will require on-chain settlement infrastructure that legacy banking cannot provide.
That combination, Lee argued publicly and on stage, makes Ethereum cheap right now.
The tension in the call is real. Every condition in that chain has to cooperate simultaneously. Bitcoin has to reach $250,000.
The ETH/BTC ratio has to recover toward its 2021 peak of 0.087 from its current 0.03. And AI-driven blockchain adoption has to materialize at a scale the market has not yet priced.
What follows is an examination of whether the data supports any of those assumptions – and which one is doing the heaviest lifting.
Discover: The best pre-launch token sales
The Math Behind the $22,000 Target Is Specific – and Demanding
Lee’s ratio math is straightforward. The ETH/BTC long-term average sits near 0.048. The 2021 cycle peak hit 0.087.
Applied to a $250,000 Bitcoin price Lee’s stated fair value, those ratios produce ETH targets of roughly $12,000 and $21,750, respectively.
The $22,000 figure is essentially the bull case of the bull case: peak ratio, peak BTC assumption, both arriving at the same time.

The AI-blockchain demand component is where Lee diverges from a pure ratio trade. His argument: AI agents operating autonomously in the global economy will need a payment layer that functions 24/7 without correspondent banking dependencies.
Ethereum’s uninterrupted uptime record and decentralized validator set make it the default candidate. Lee also cited stablecoin transaction volumes surpassing Visa’s annual throughput, a claim that holds up. Ethereum-based stablecoin volumes (USDC, USDT, DAI combined) ran approximately $220 trillion annualized in 2025, against Visa’s $12.2 trillion.
That data point is not speculative.
On supply, Lee’s position at BitMine adds direct context. The firm holds more than 4% of all circulating Ethereum and generates over $300 million annually from staking rewards, which places Lee’s bullish thesis in direct financial proximity to his institution’s balance sheet.
That conflict of interest is worth naming. It does not make the thesis wrong. It does mean the assumptions deserve scrutiny.
Discover: The best crypto to diversify your portfolio with
Where Ethereum Price Trades Now and What the Chart Needs to Do
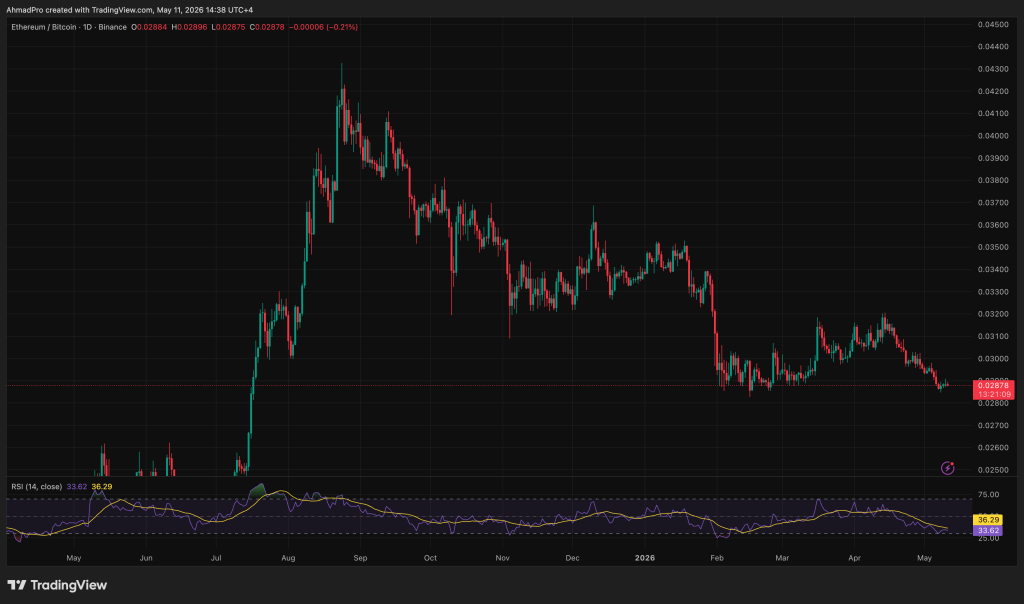
ETH is sitting at $2,330 on the daily chart, and the macro picture here is a coin that peaked near $4,900 in August and has been in a downtrend for the better part of a year, shedding over 60% before finding a floor around $1,750 in February.
The recovery since that low has been the most sustained positive price action since the downtrend began, with price grinding higher lows from February through May and now sitting in the $2,300 to $2,400 zone which is a critical area.
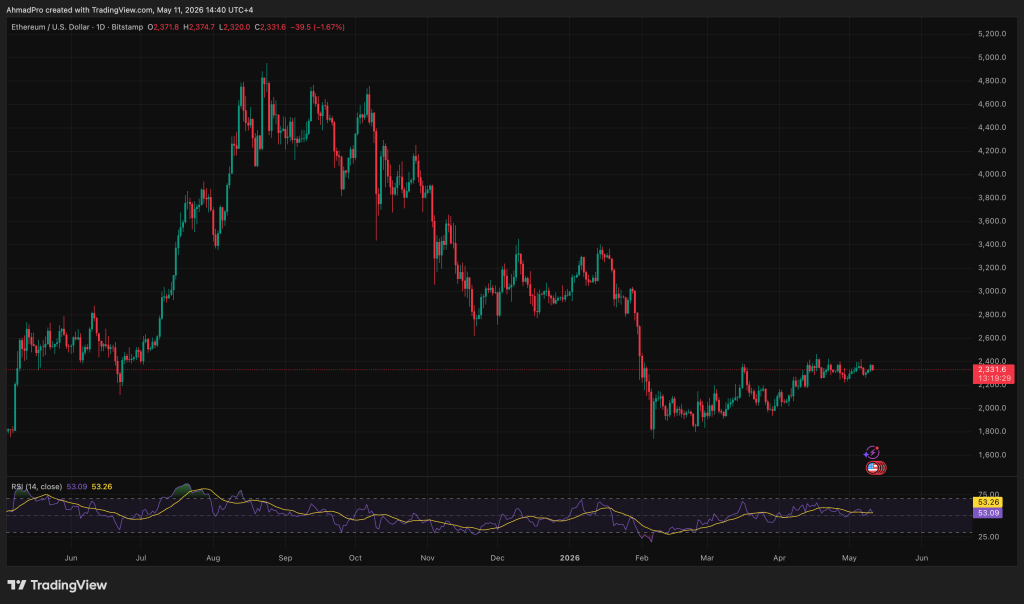
That $2,400 level is where the February breakdown accelerated from, making it the first major overhead supply zone that needs to flip before any meaningful recovery can develop, and price has been churning just below it for weeks without a clean break.
A daily close above $2,400 held over multiple sessions opens $2,800 first, then $3,000 and $3,400 as the next resistance clusters from the November and December distribution.
On the downside, $2,000 is the immediate floor that has held on every dip since March, and $1,750 is the absolute line that cannot break without the entire base structure collapsing.
The longer ETH spends consolidating below $2,400 without breaking down, the more pressure builds for an eventual resolution to the upside, but until that break happens, this remains a recovery inside a longer downtrend and not yet a confirmed reversal.
Discover: The best crypto to diversify your portfolio with
The post Tom Lee Floats $22,000 Ethereum Target: What Has to Be True? appeared first on Cryptonews.
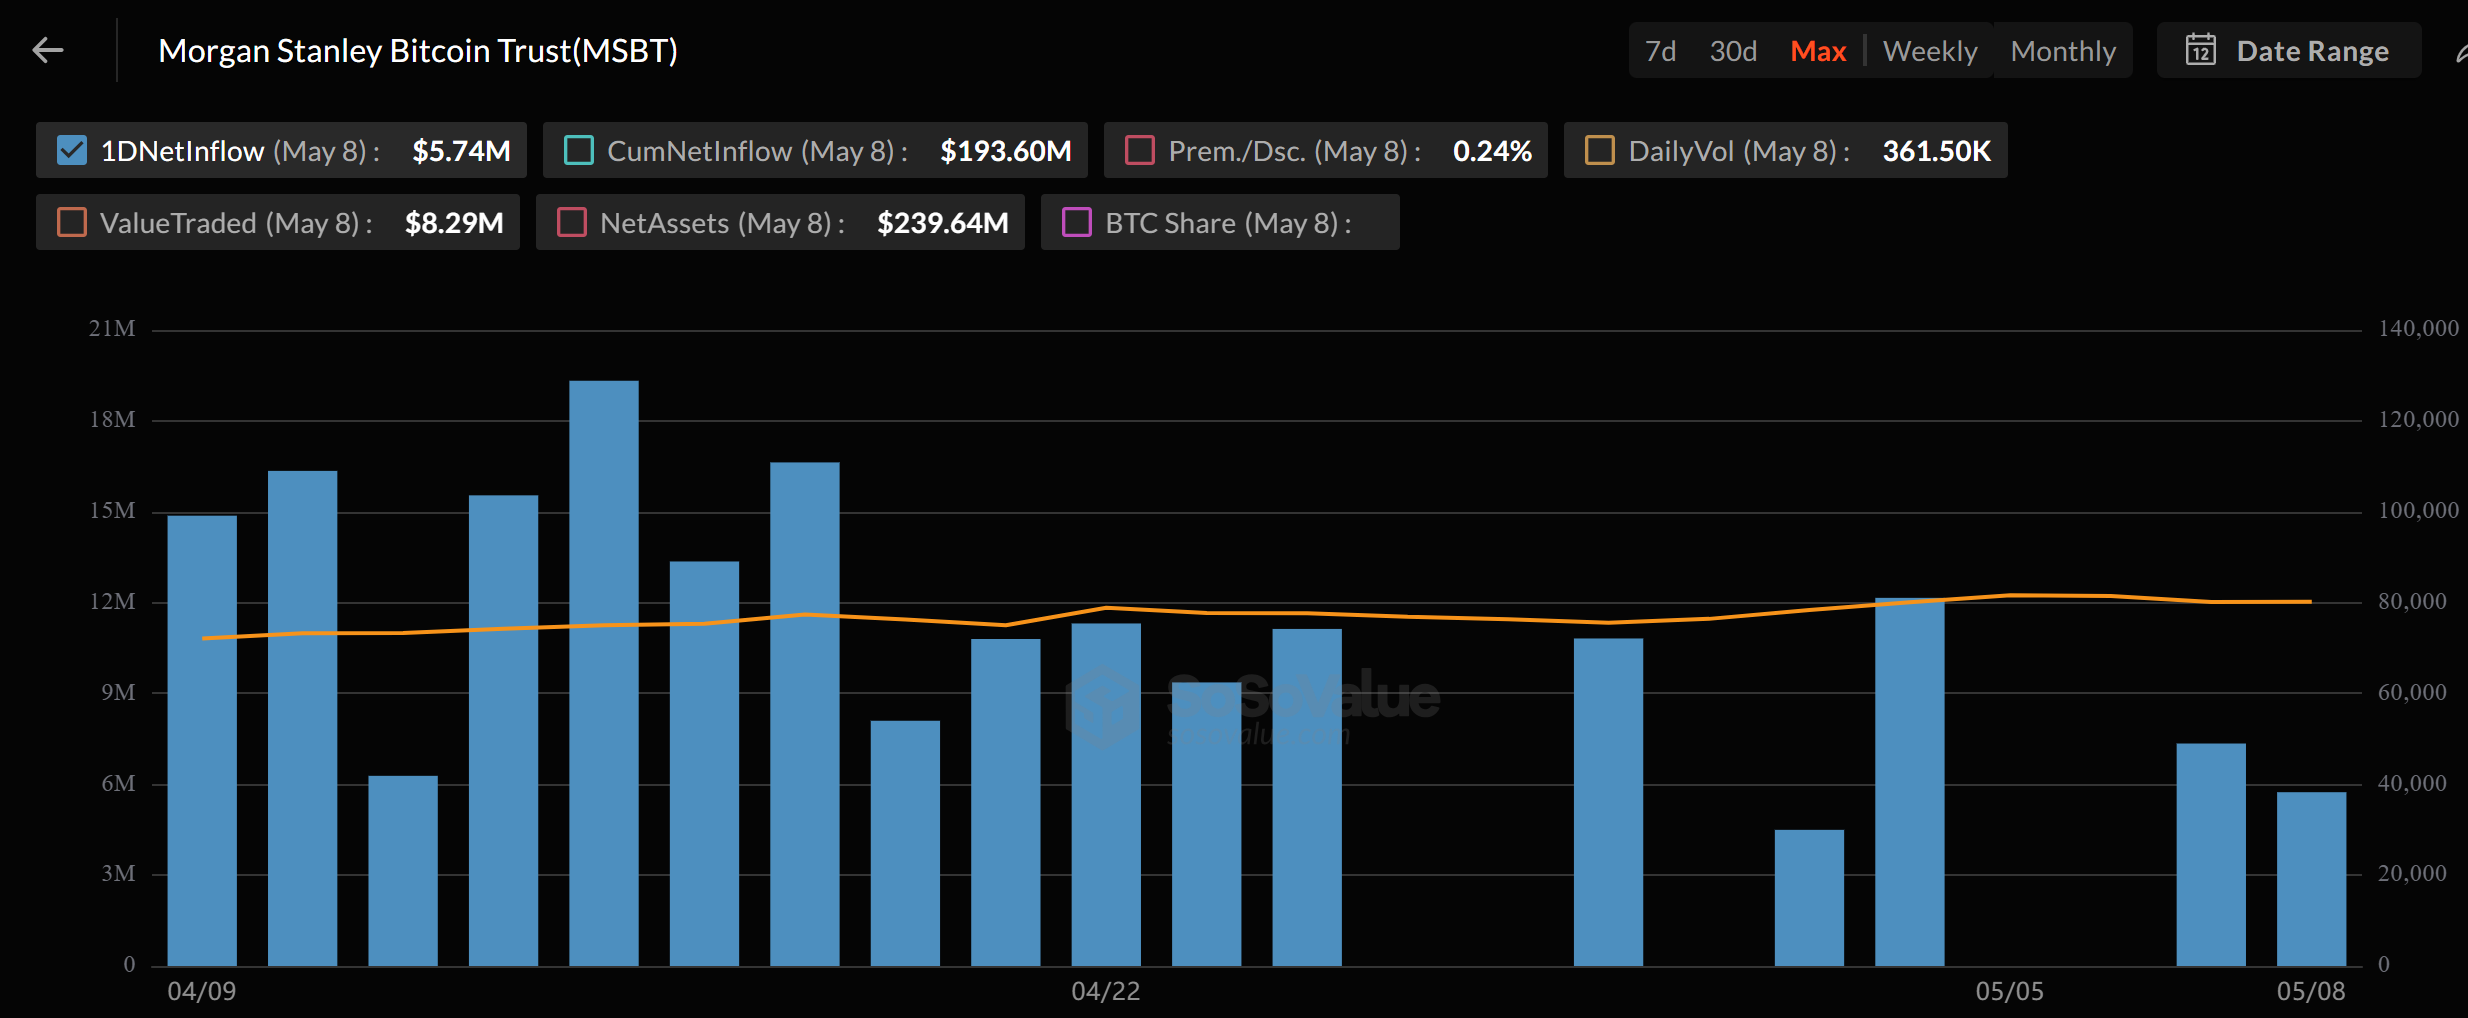
Morgan Stanley’s spot Bitcoin ETF cleared 30 days of trading without a single outflow day, drawing roughly $194 million while BlackRock, Fidelity, and ARK Invest all lost capital over the same stretch.
MSBT, which began trading April 8 on NYSE Arca, posted 17 inflow days and 5 flat sessions through May 8, lifting its asset base above $240 million.
How MSBT Outflanked Every Rival in Month One
SoSoValue data shows MSBT launched with $30.6 million in deposits and $34 million in trading volume on day one. Net inflows climbed to roughly $194 million by May 8, pushing the fund’s bitcoin holdings near 2,920 BTC.

Every other major spot Bitcoin ETF lost ground during the same window. Products from BlackRock, Fidelity, and ARK Invest each posted net outflows as BTC traded between the mid-$70,000s and low-$80,000s.
MSBT’s 0.14% fee, the cheapest in the category, helped insulate it from the rotation.
BlackRock’s IBIT set the 2024 benchmark with 71 inflow days after launch. Its first flat session arrived in April 2024, followed by a $36.9 million outflow on May 1.
MSBT now joins that pattern on a shorter, sharper scale.
Sticky Capital Signals Advisor-Led Allocation
Morgan Stanley’s roughly 16,000 advisors steward more than $9 trillion in client assets. That captive channel gives MSBT reach pure-play issuers cannot match.
The fee gap and in-house distribution help explain why the six-week sector tailwind landed disproportionately on the fund.
Whether MSBT can hold the streak as BTC volatility returns is the next test. The fund’s $240 million asset base sits far below IBIT’s scale.
Still, its first-month retention sets a new bar for late entrants in the spot ETF lineup.
The post Zero Outflows in 30 Days: How Morgan Stanley’s MSBT Outflanks Every ETF Rival appeared first on BeInCrypto.

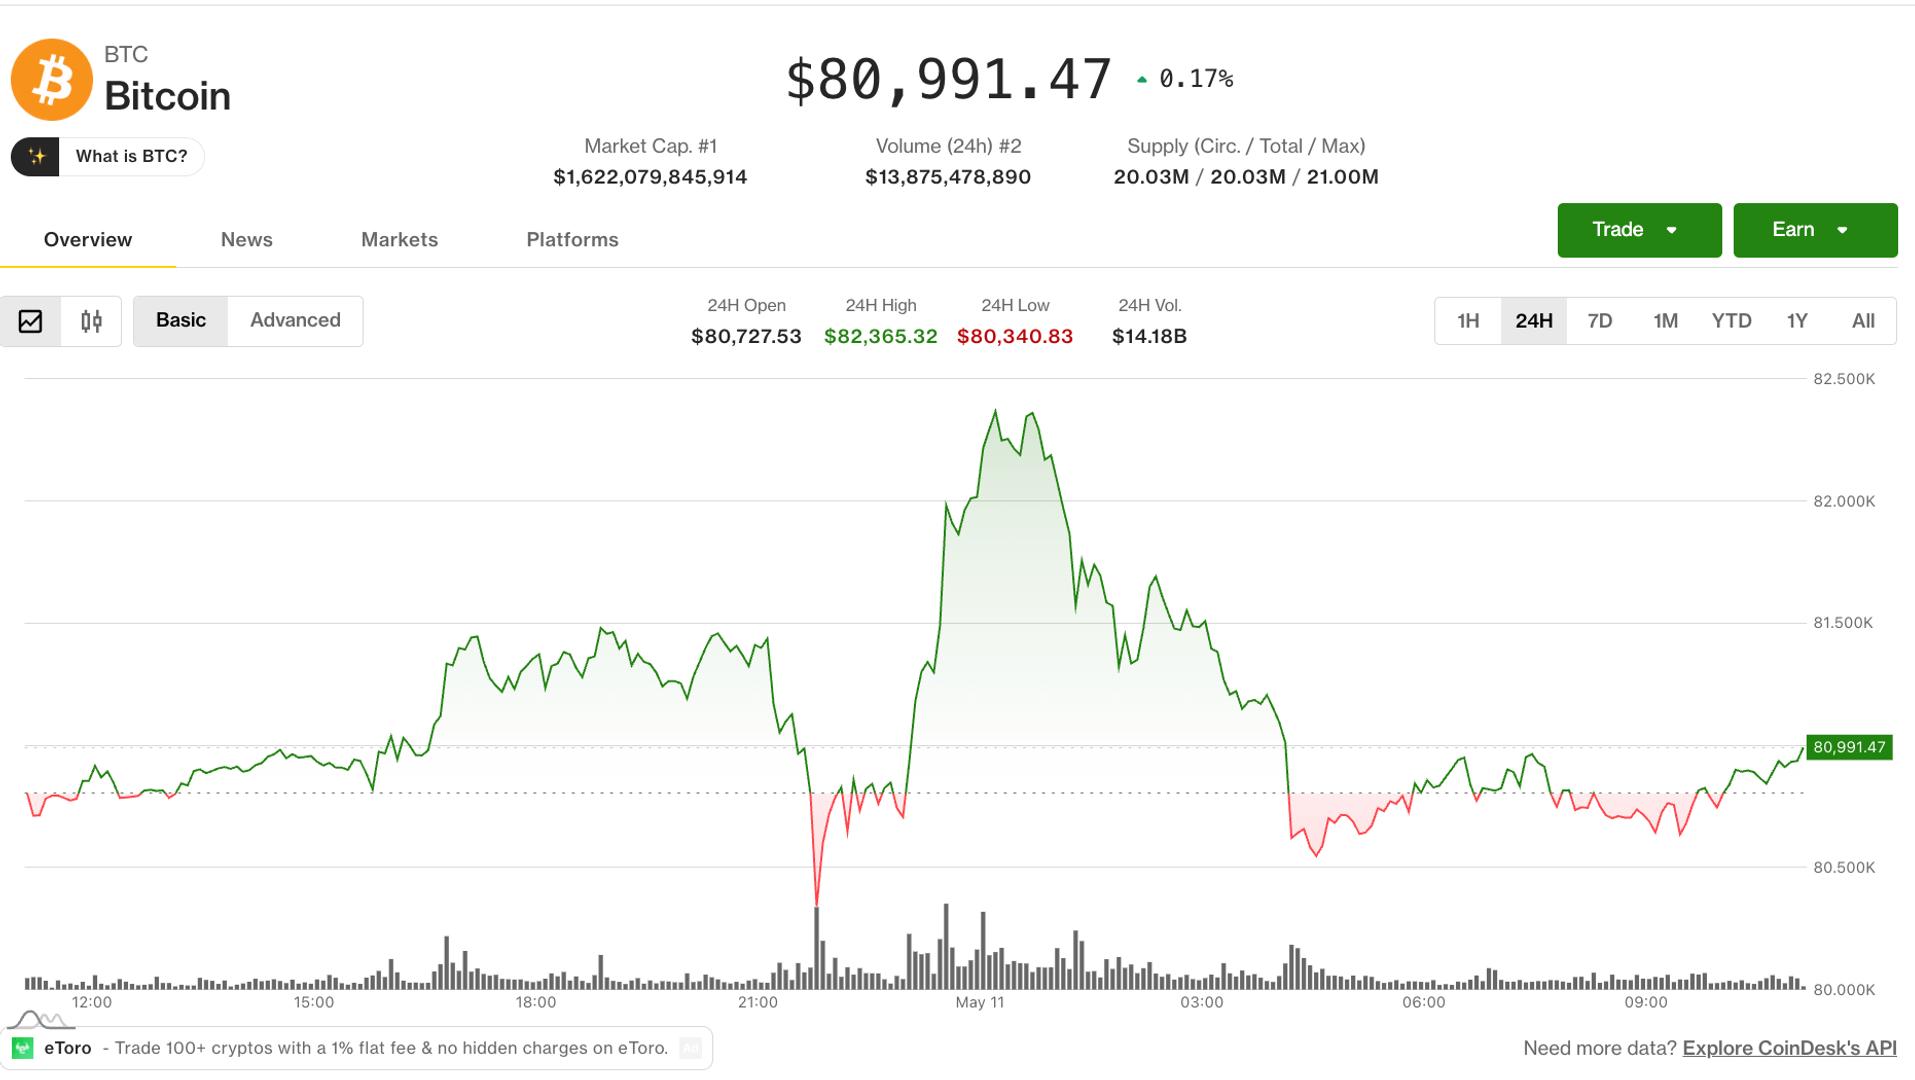
The crypto market started the week in a volatile mood, with bitcoin rising from $80,670 at 23:00 UTC on Sunday before topping out at $82,400 an hour later. The price subsequently dropped to trade in a fairly narrow range just beneath $81,000.
The move coincided with the weekly open of bitcoin futures on the CME and U.S. equity futures — a period that often sparks a frenzy of repositioning and a phenomenon called the “CME gap,” which occurs when the price opens at a different point to where it closed on Friday.
Due to the timing of the move, all crypto benchmarks are down on Monday with the broad CoinDesk 100 (CD100) leading the way at a 1.5% loss while the bitcoin-dominant CoinDesk 5 (CD5) dropping 0.6%.
Price action is also being dictated by geopolitical developments in Iran. U.S. President Donald Trump said Iran’s response to a peace proposal was “totally unacceptable,” leading to a rise in the price of oil and the dollar and a decline in risk assets.
Derivatives positioning
- The market-wide crypto futures open interest (OI) remains pinned just above $130 billion for the fourth straight day, pointing to a lack of fresh leverage inflows and broadly stalled momentum across the derivatives market.
- Centralized exchanges have liquidated over $400 million in leveraged futures bets, with shorts accounting for most of that amount.
- SUI’s OI has surged by 29%, validating the double-digit rise in the token’s price. This, coupled with positive funding rates and 24-hour OI-adjusted cumulative volume delta, points to growing demand for bullish exposure.
- DOGE and HBAR are other notable OI gainers, while BTC and ETH futures OI remains largely steady.
- OI in futures tied to the privacy-focused ZEC token has declined by 6%, a sign of capital outflows.
- Despite the U.S. CPI and PPI releases due later this week, the market remains calm, as evidenced by bitcoin’s 30-day implied volatility index, which is pinned near three-month lows.
- On Deribit, bitcoin calls at strikes, ranging from $81,000 to $86,000 dominate the volume rankings. Call options are inherently bullish plays on the underlying asset.
- Block flows featured bitcoin long call condors, a strategy initiated to profit from low volatility and minimal price movement in the underlying asset.
Token talk
- Venice’s VVV token more than doubled in the past month as traders reacted to a string of emissions cuts, token burns, new products and the growing demand for AI.
- The move started with supply. Venice doubled its subscription-linked burn rate in late April, with Pro, Pro+ and Max subscriptions on the platform now triggering $2, $5 and $10 VVV burns, respectively, according to VeniceStats data.
- Venice then cut annual emissions of the token, which can be used for privacy-focused artificial intelligence, from 6 million tokens to 5 million on May 1, the first step in a planned reduction to 3 million by July, according to the project.
- The rally accelerated after StrikeRobot, which develops AI software for robots, said Venice would become a primary inference API backend for its robotics products, starting with SR Agentic and SR Platform.
- Meanwhile, subscription revenue is rising. Co-founder Jesse Proudman said Monday that subscription and credit purchases hit a record, topping the prior high by 10%.
- VVV remains below its $22.5 January 2025 record. The token had fallen as much as 50% shortly after its debut amid insider-trading concerns tied to early purchases by Aerodrome Finance contributors.
Crypto World
Circle (CRCL) beats earnings estimates but misses on revenue amid $222 million Arc raise


Circle, issuer of the world’s second-largest stablecoin, USDC, posted estimate-beating first-quarter earnings as revenue rose 20% and it raised $222 million for its Arc blockchain network in a presale of the ARC token.
Earnings per share (EPS) of 21 cents beat analyst estimates of 17 cents, while revenue rose 20% to a less-than-forecast $694 million. Adjusted earnings before interest, taxes, depreciation and amortization (Ebitda) grew 24% from a year earlier to $151 million, the New York-based company reported.
USDC onchain transaction volume jumped over 260% from the year-earlier quarter to $21.5 trillion, and USDC in circulation increased 28% to $77 billion.
The ARC token presale values the project at $3 billion. The fundraising round included investment from a mix of Wall Street heavyweights and crypto-native firms, including BlackRock, Apollo Funds, a16z crypto, ARK Invest, CoinDesk’s parent company Bullish, Haun Ventures, Intercontinental Exchange and Standard Chartered Ventures.
The fundraising marks Circle’s most ambitious expansion beyond USDC and payments infrastructure, pushing the stablecoin issuer deeper into the race to build blockchain infrastructure for institutional finance.
Circle also published the Arc whitepaper on Monday, outlining ARC as a “native coordination asset” designed to support governance, validator security and network operations across the chain.
Arc, which began testing in October, is being positioned as a blockchain optimized for stablecoin-based capital markets and regulated financial activity, which includes tokenized assets, cross-border settlement and onchain finance.
Unlike USDC, which functions as a dollar-pegged payment token, ARC appears intended to play a role closer to ether (ETH) on Ethereum or SOL on Solana — helping coordinate the network’s economic and security model.
CRCL shares were nearly 1.2% higher at $115 in pre-market trading at around 7:30 a.m. ET.
UPDATE (May 11, 11:20 UTC): Adds Circle’s first-quarter earnings report information and restructures article to lead with earnings.

‘For any stocks going parabolic reduce positions almost entirely’

Jessica Alba’s Misunderstood Sci-Fi Series Is Going To Be Lost Forever, You Can’t Watch It

Do you have an "emotionally immature" parent?
Manchester United reach agreement with Casemiro over contract clause amid transfer speculation

US brings back mandatory military draft registration

Steven Gerrard disagrees with Gary Neville over ‘shock’ Chelsea and Arsenal claim | Football


-
 Crypto World3 days ago
HarrisX Poll Found 52% of Registered Voters Support the CLARITY Act
-

 Fashion3 days ago
Weekend Open Thread: Marianne Dress
-

 Crypto World4 days ago
Upbit adds B3 Korean won pair as Base token gains Korea access
-

 Tech7 days ago
Image AI models now drive app growth, beating chatbot upgrades
-
 NewsBeat4 days ago
NCP car park operator enters administration putting 340 UK sites at risk of closure
-

 Tech1 day ago
Auto Enthusiast Carves Functional Two-Stroke Engine from Solid Metal
-

 Politics2 days ago
Politics Home Article | Starmer Enters The Danger Zone
-
 Business2 days ago
Ignore market noise, India’s long-term story intact, say D-Street bulls Ramesh Damani and Sunil Singhania
-

 Crypto World6 days ago
UAE Free Zone Deploys Blockchain IDs to Verify Registered Firms
-

 Tech11 hours ago
GM Agrees To Pay $12.75 Million To Settle California Lawsuit Over Misuse Of Customers’ Driving Data
-

 Crypto World5 days ago
Robinhood says Wall Street is building onchain
-

 Crypto World5 days ago
BlackRock CEO Larry Fink Discusses a New Asset Class
-
Entertainment7 days ago
Serena Williams hits Met Gala in metallic dress after GLP-1 reveal
-

 Tech6 days ago
Apple and Samsung are dominating smartphone sales so thoroughly that only one other company makes the top 10
-

 Tech6 days ago
I tested the Xiaomi 17 Ultra’s camera and I don’t think I’ll ever go back to an iPhone
-

 Fashion5 days ago
The Best Work Pants for Women in 2026
-
 Tech4 days ago
AI agents are missing all the discussions your team is having. SageOX has an answer: agentic context infrastructure
-

 Entertainment5 days ago
Sarah Paulson Called Out For Met Gala ‘Hypocrisy’
-
 Sports7 days ago
Everton v Man City LIVE: Haaland’s two-word response as visitors collapse to hand Arsenal advantage in Premier League title race
-

 Politics6 days ago
Met Gala 2026: Madonna’s Dramatic Red Carpet Look Steals The Show
You must be logged in to post a comment Login