
Crypto World
85% Rally Possible Despite Criticism
The ASTER price has fallen nearly 70% from its post-launch highs, reflecting fading hype and rising criticism. User activity and trading volume seem to have collapsed even faster, raising doubts about its recovery.
Yet beneath this weakness, technical patterns and whale accumulation show a different picture. These signals suggest Aster may still attempt a major breakout despite the sharp decline in participation.
Aster User Activity and Trading Volume Collapse After Post-Launch Frenzy
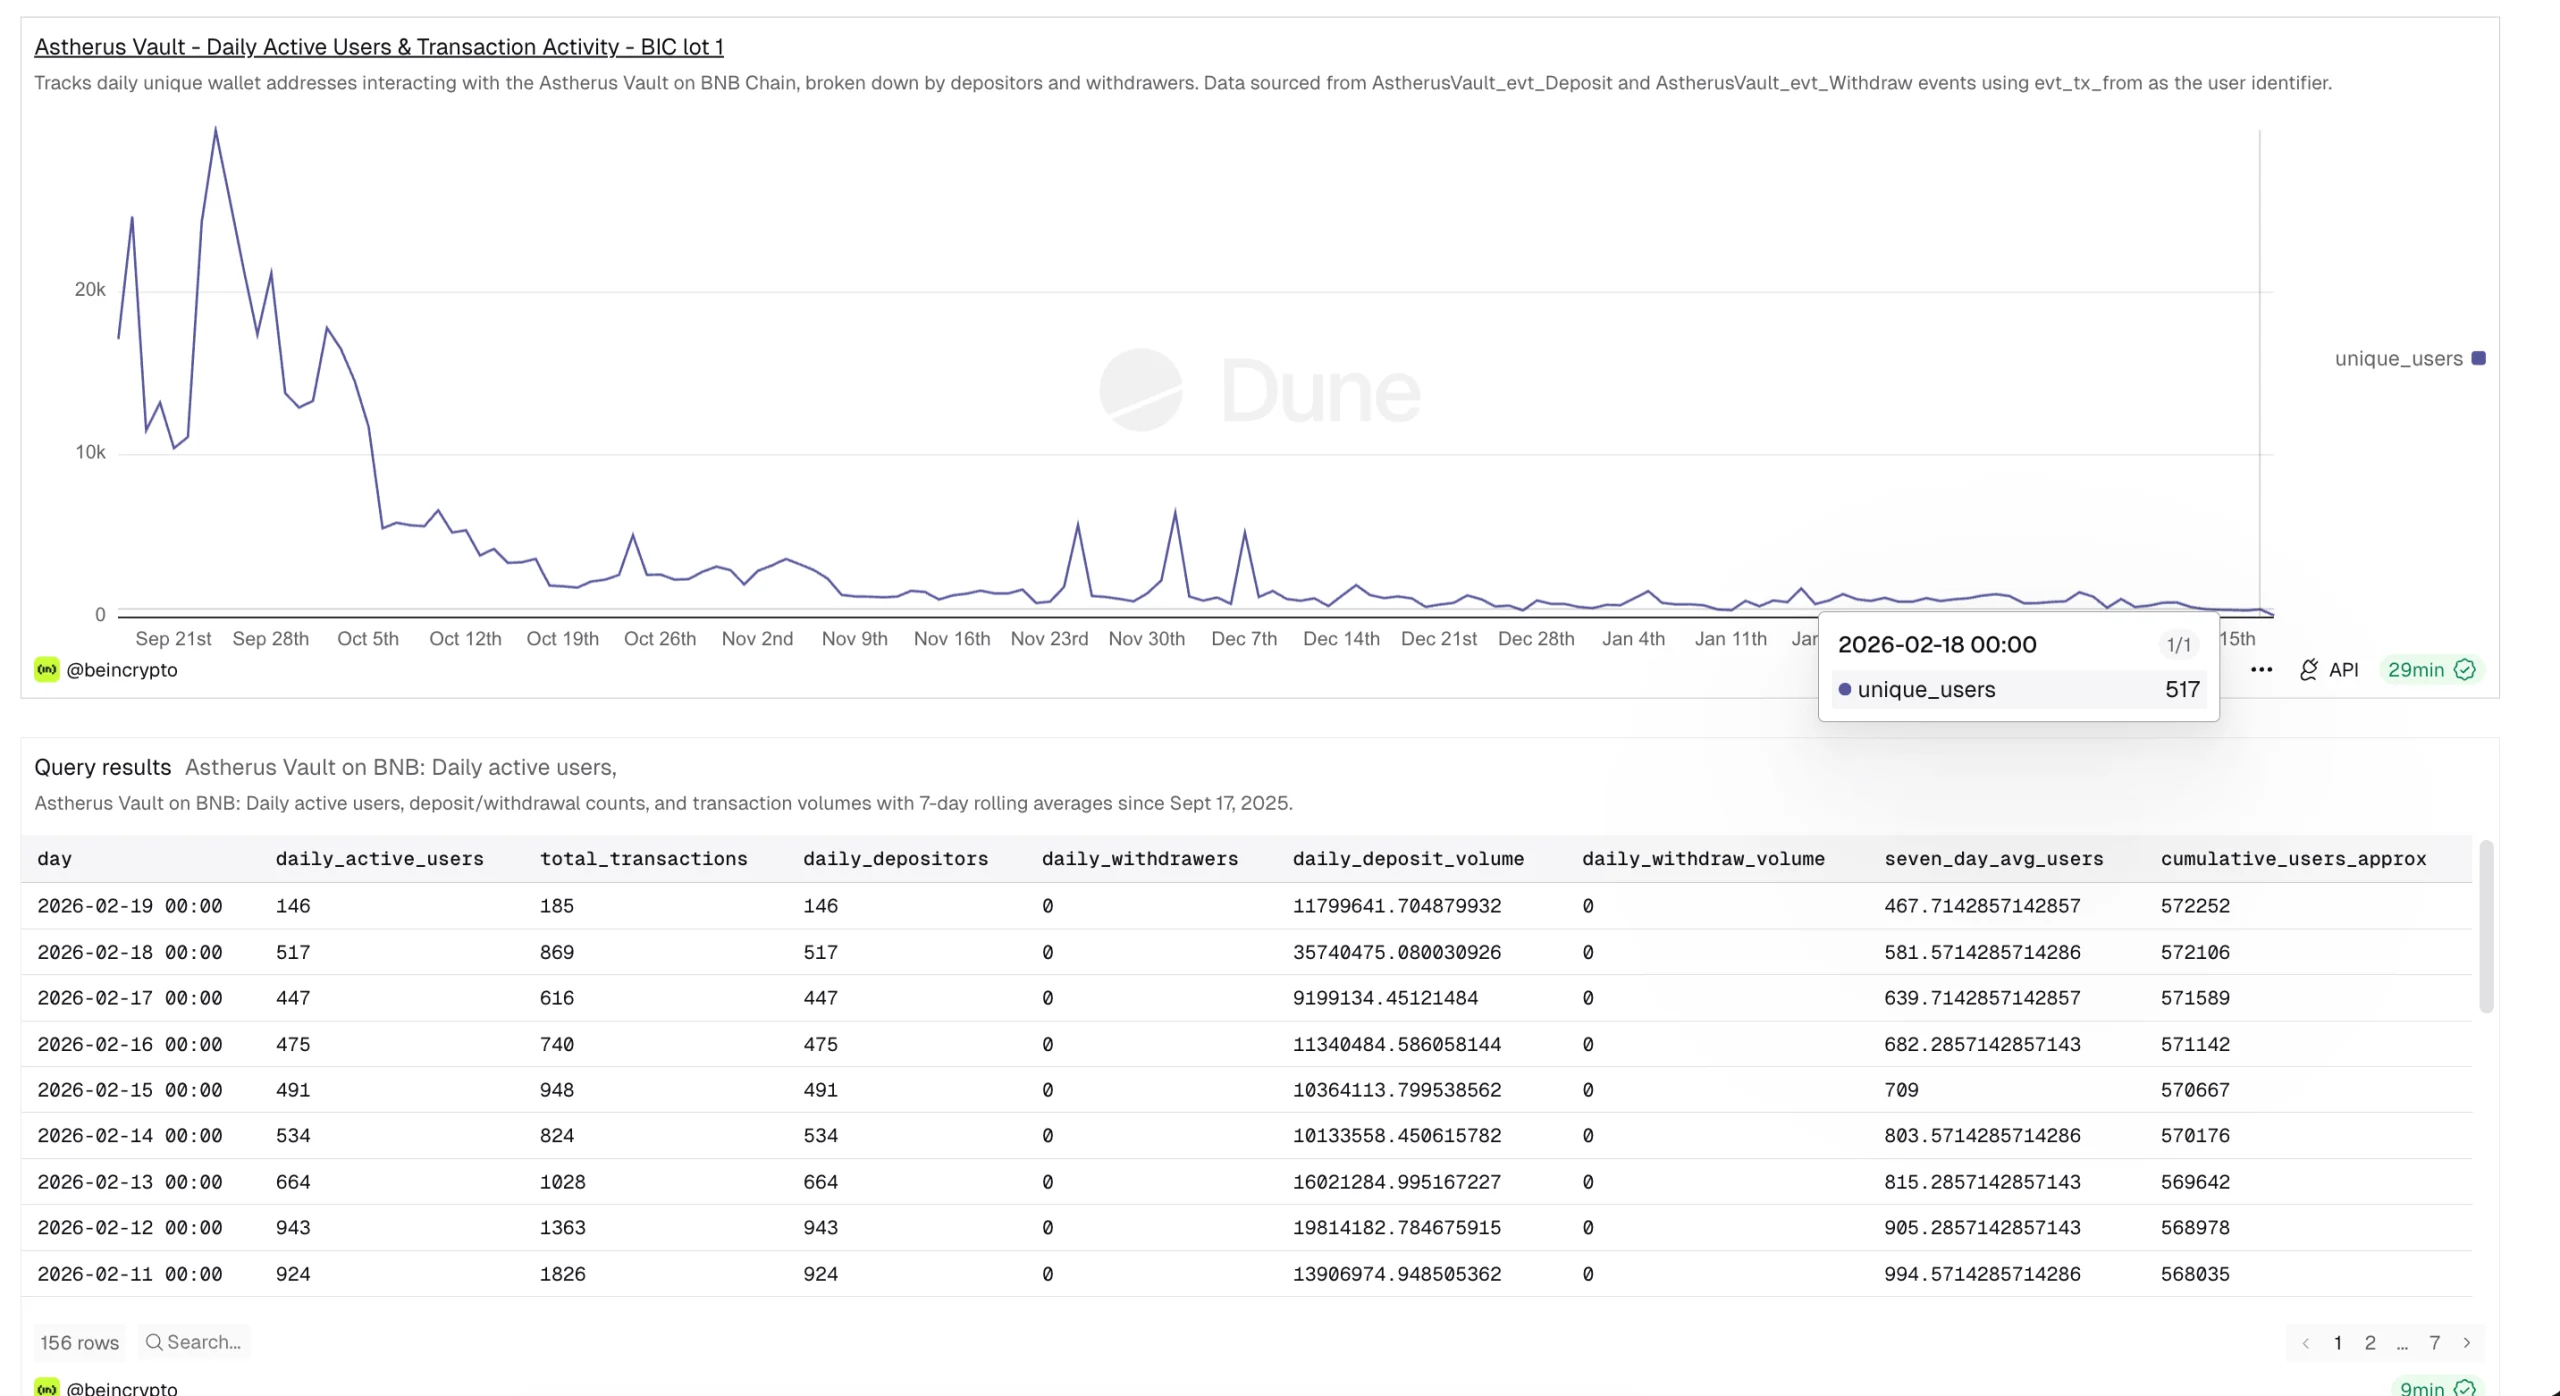
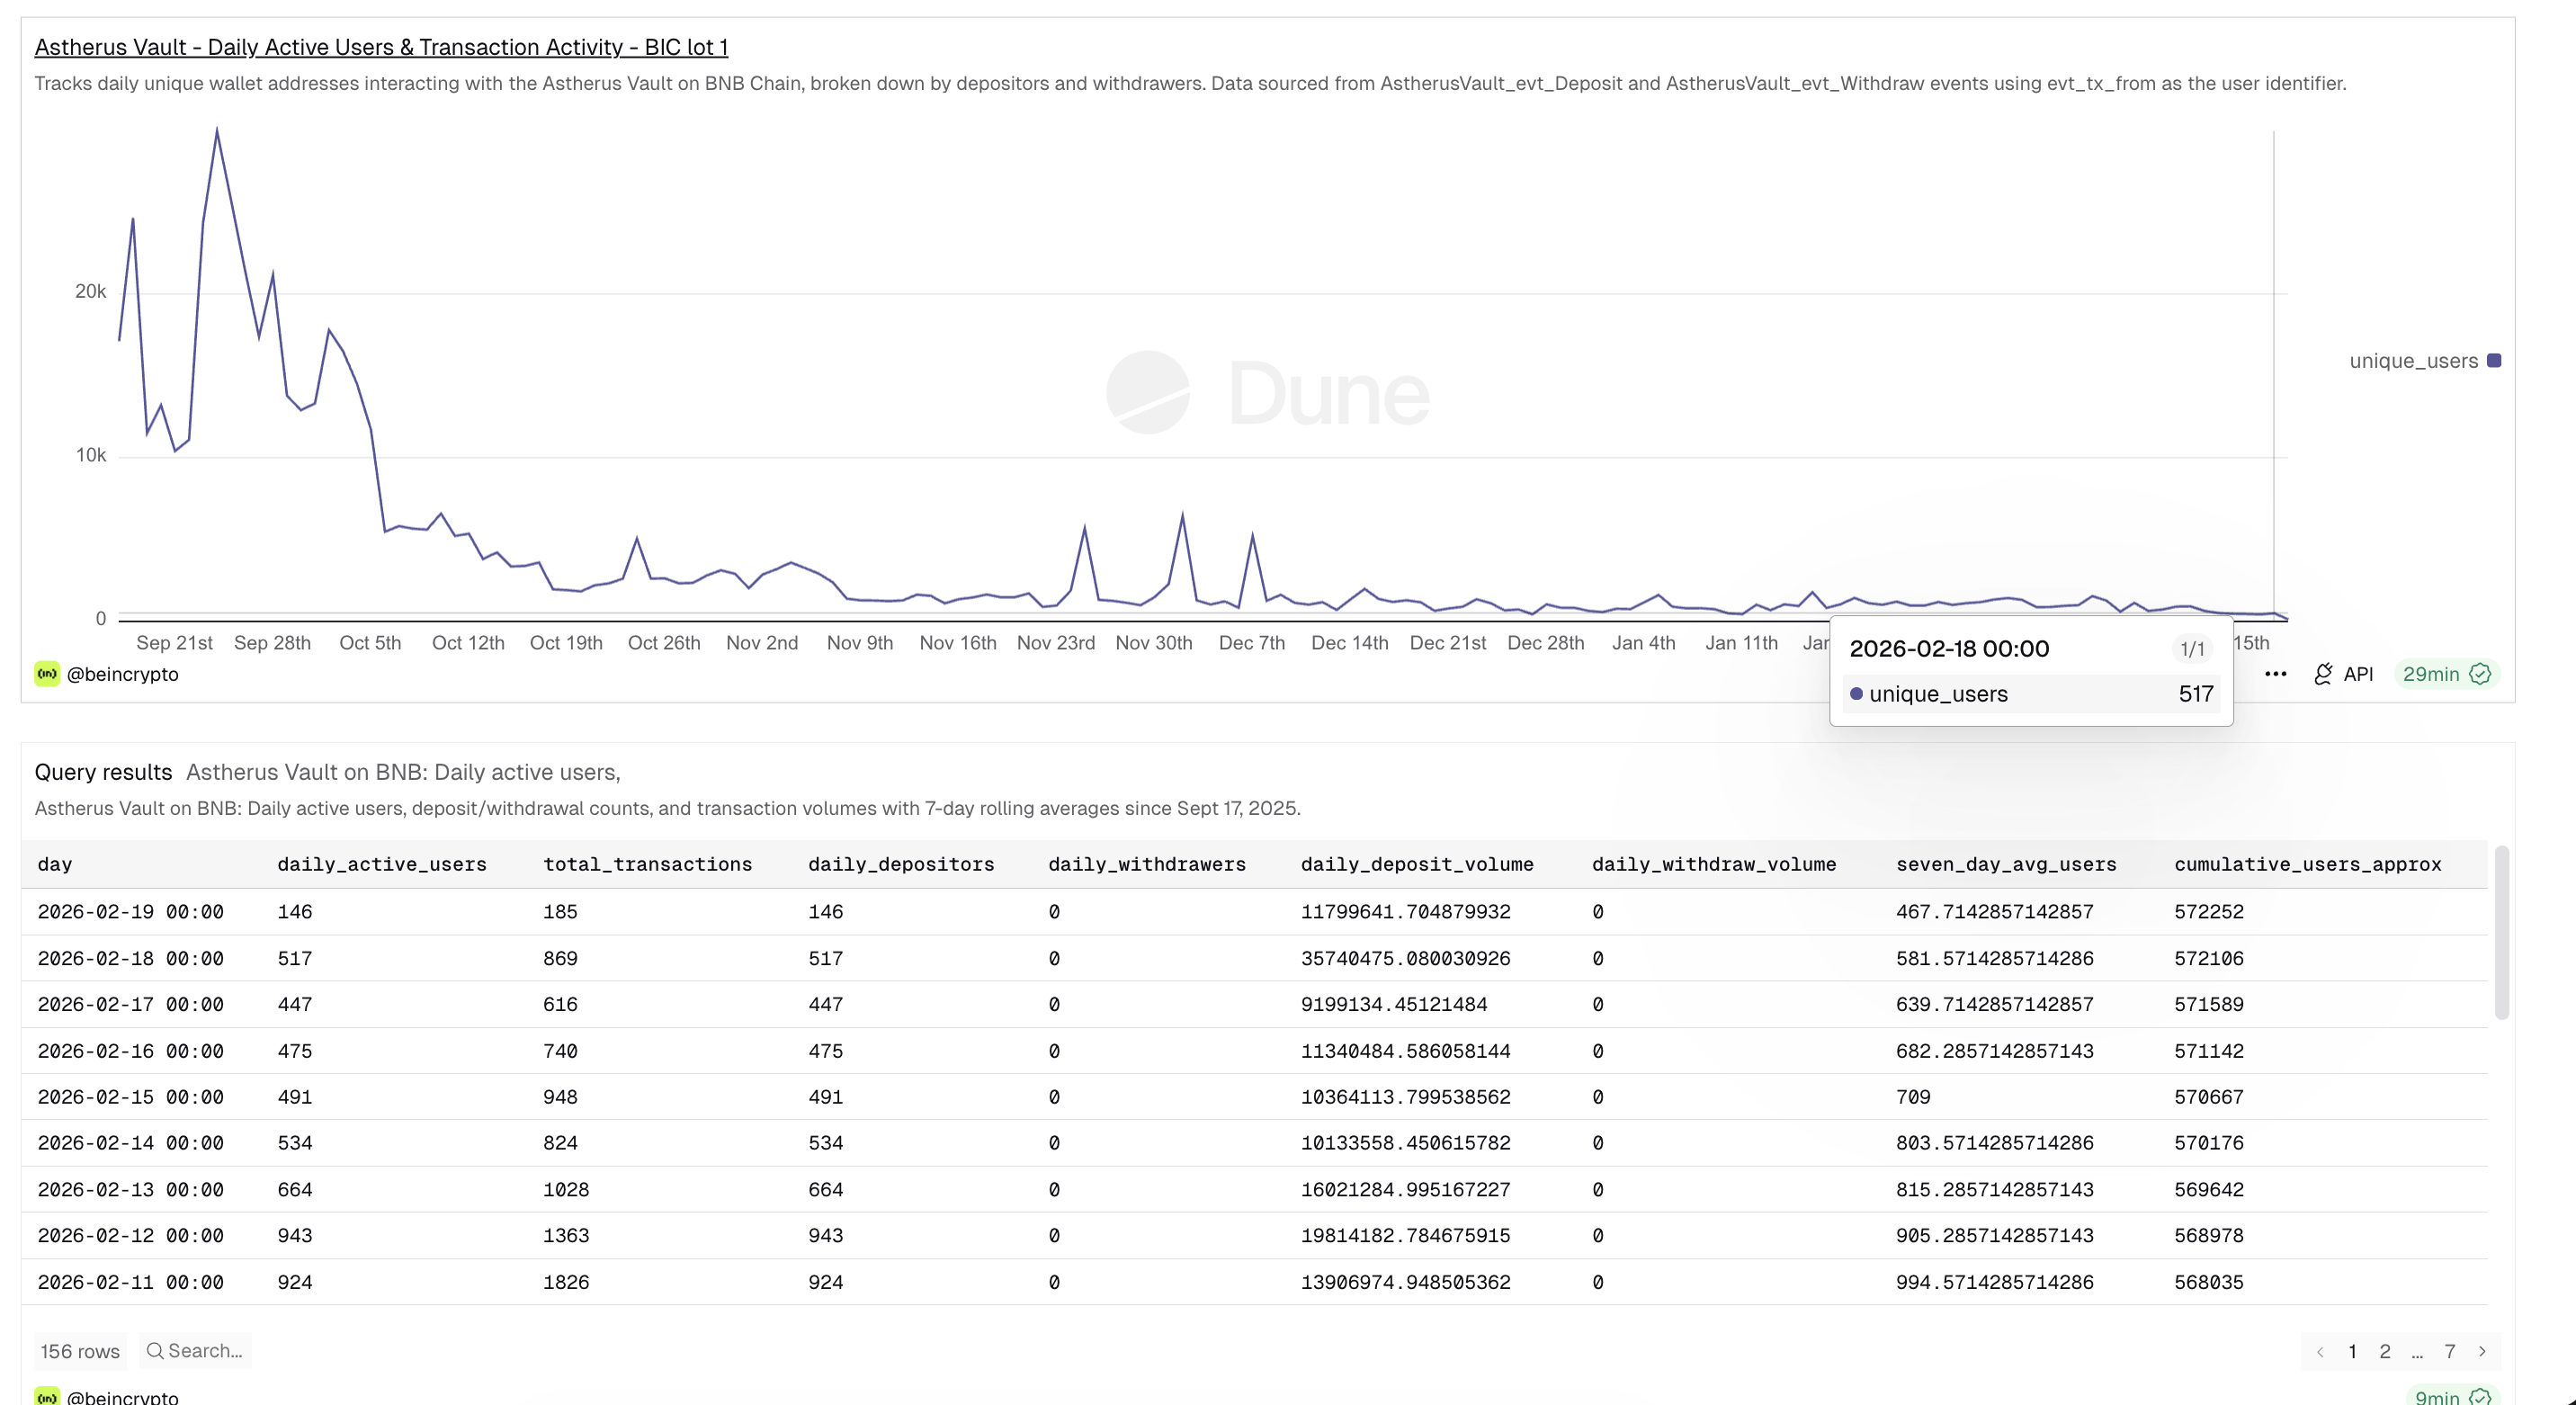
ASTER (formerly Astherus) has seen a dramatic collapse in user participation since its September 2025 token launch.
Daily active addresses interacting with the Astherus Vault on BNB Chain peaked at 29,062 on September 24. As of February 19, that number has fallen to just 146. This represents a 99.5% drop in daily active users.
Disclaimer: These figures reflect Astherus Vault deposit and withdrawal activity on BNB Chain specifically. Aster operates across BNB Chain, Ethereum, Solana, and Arbitrum, and total platform-wide trader activity — including perpetual and spot trading — is likely significantly higher than vault-only metrics suggest.
Trading activity has followed the same trend. Daily decentralized exchange volume on BNB Chain, per data pulled via Dune, has declined from a peak of $327.75 million to just $17.31 million.
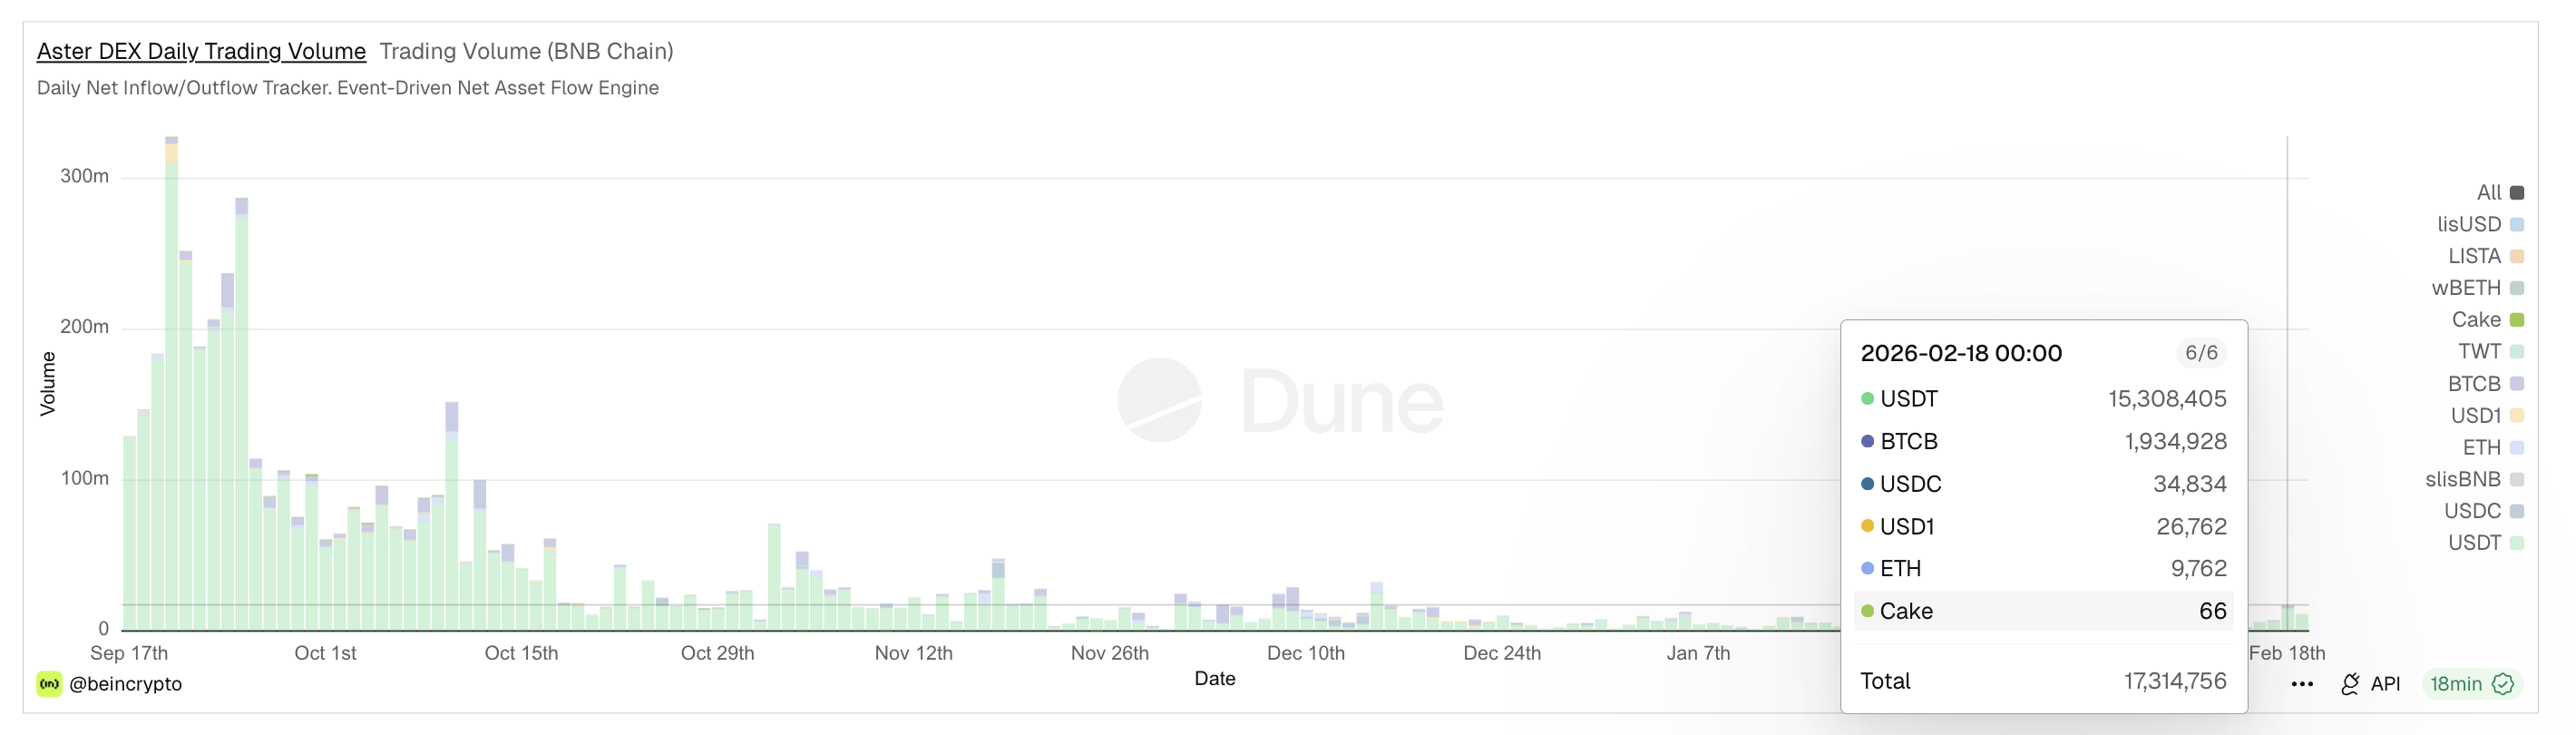
This marks a 94.7% drop in trading volume. On-chain trading volume reflects real buying and selling happening on the blockchain. When it falls sharply, it shows reduced participation and weaker demand.
This collapse aligns with Aster’s price decline. The token is down about 70% from its $2.41 high reached shortly after launch. The drop reflects the end of a possible hype-driven phase.
However, the full picture is more complex. Cumulative unique addresses interacting with the protocol have continued rising, reaching 572,252. This shows new users are still entering the ecosystem, even as daily activity declines.
More importantly, the remaining users are committing large capital. On February 19, total deposits reached $11.8 million from just 146 wallets. This equals an average of about $80,000 per wallet. This shows that while retail participation has dropped, high-value investors remain active.
Additionally, daily withdrawals from the vault have remained at zero consistently since the TGE, indicating that while fewer users are depositing new capital, existing capital is not exiting the system.
Bullish Divergence and EMA Setup Show Early Reversal Signs
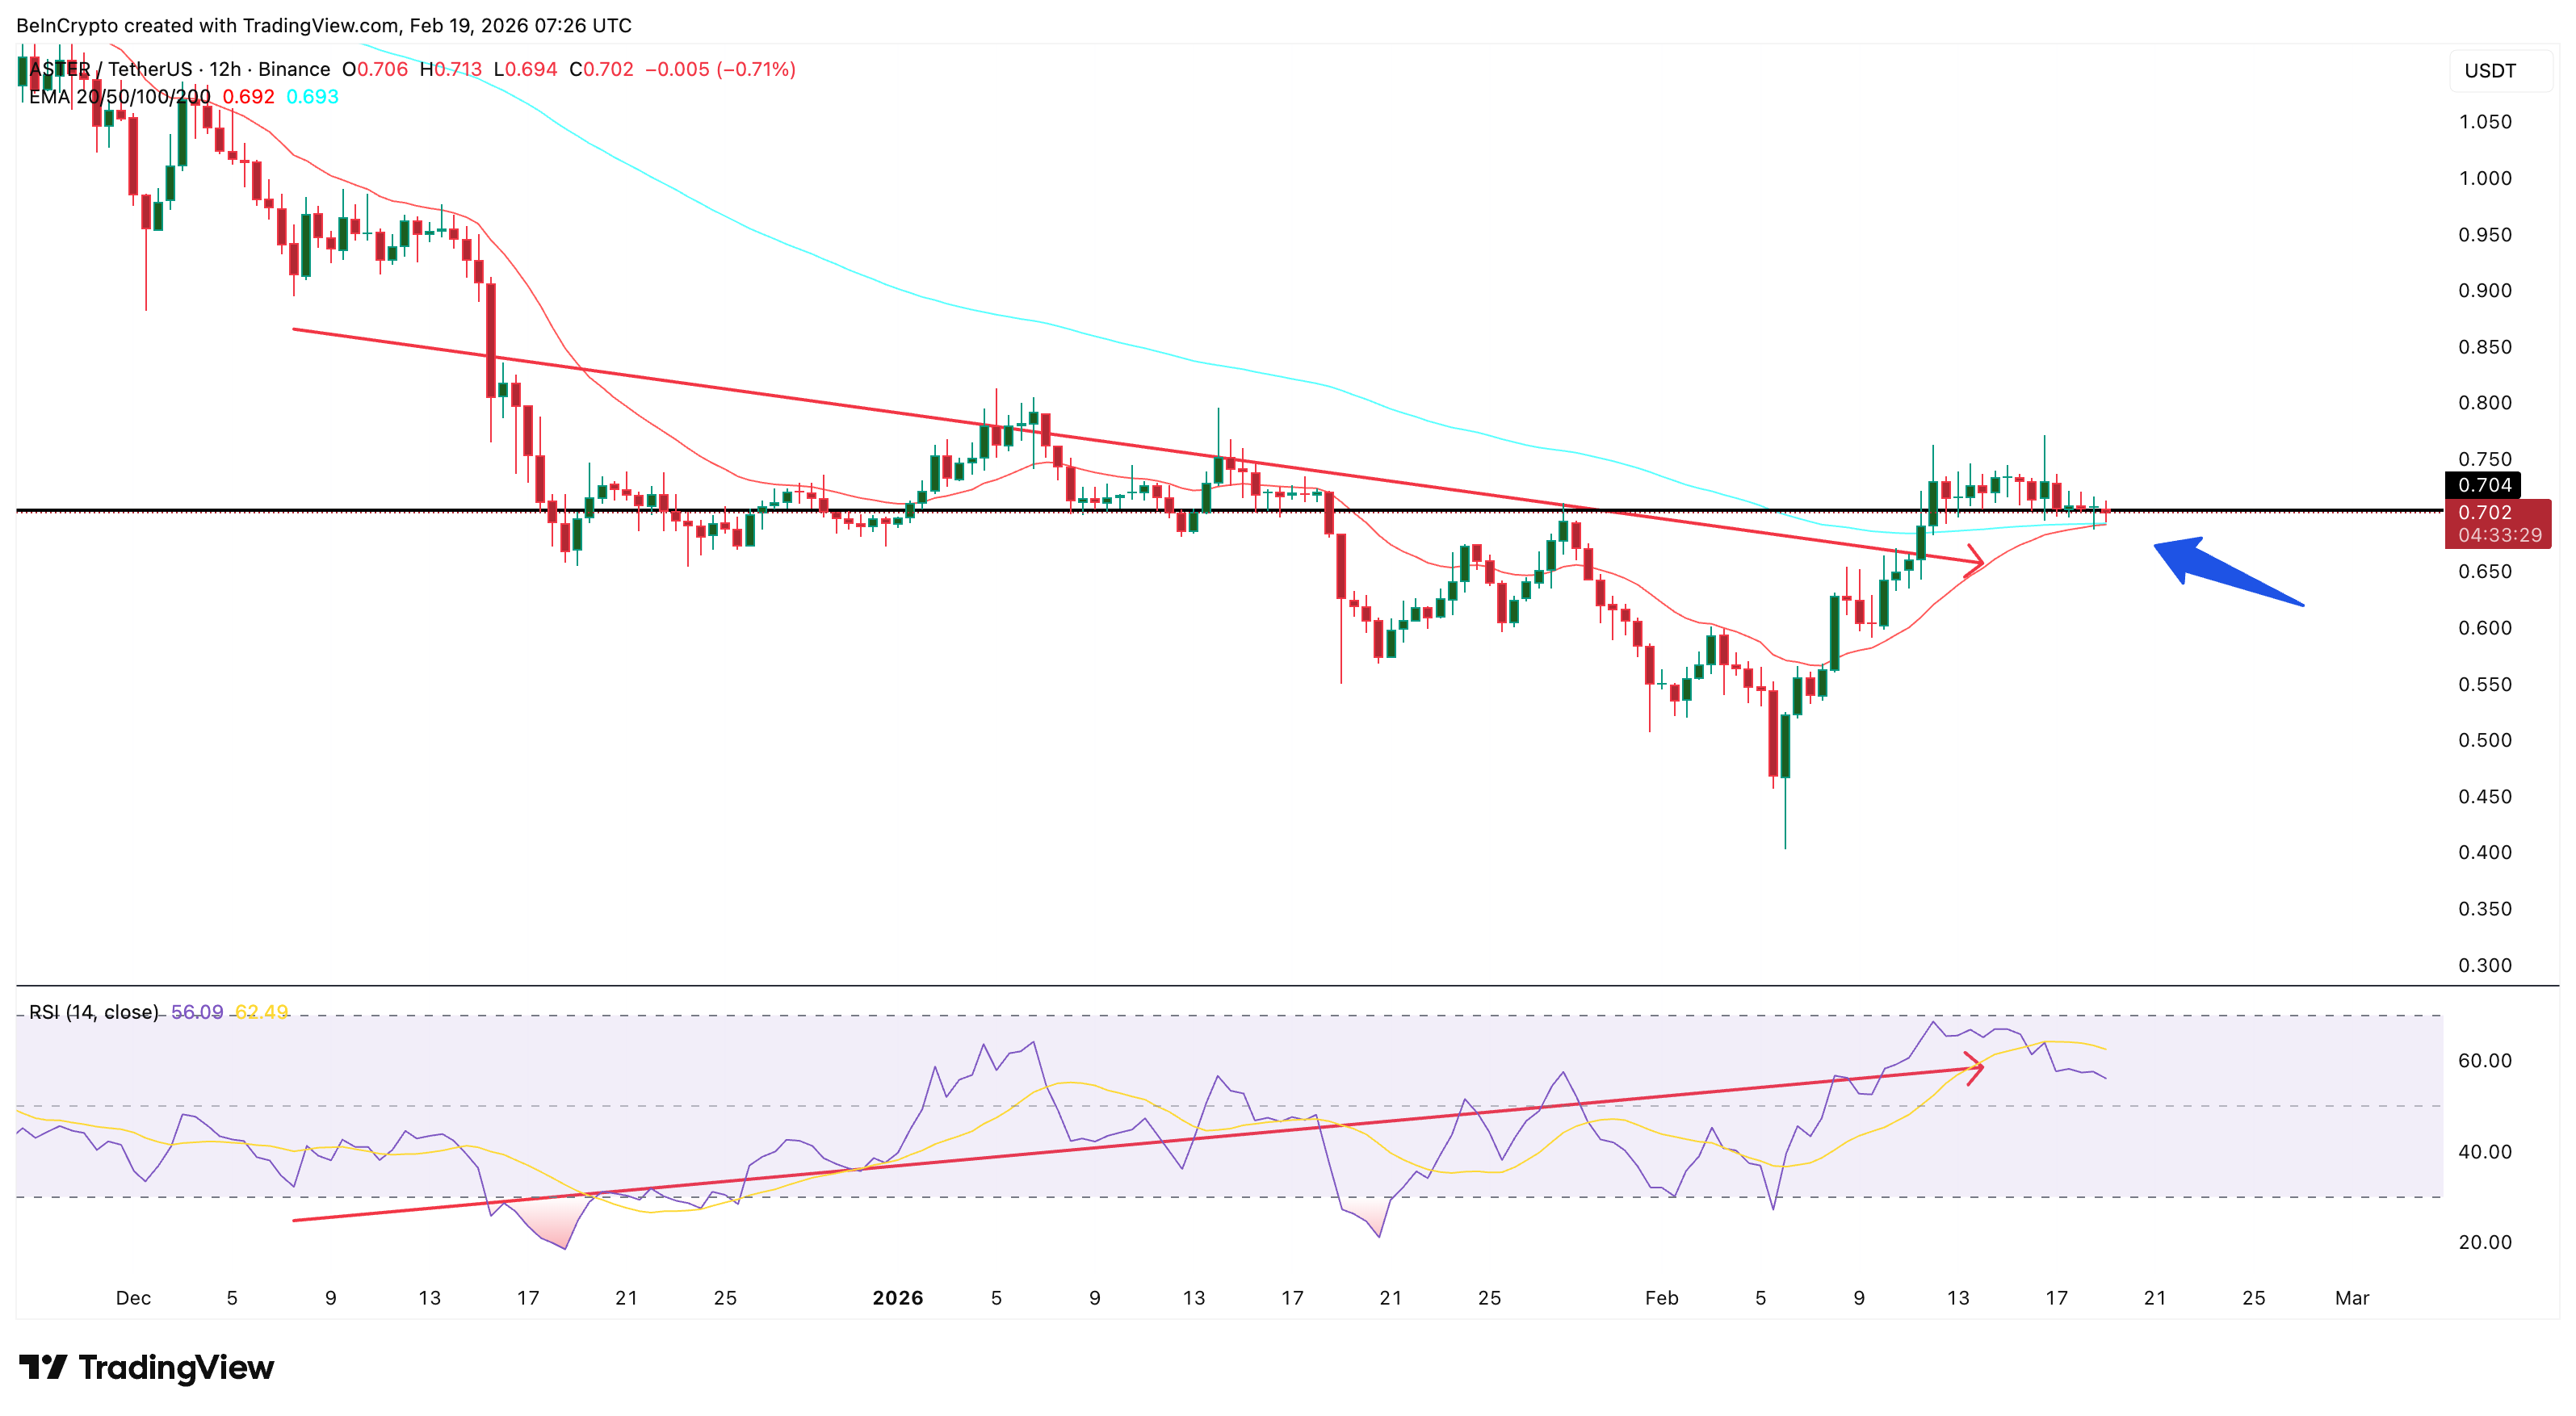
Despite the fundamental weakness, technical indicators show early signs of recovery. On the 12-hour chart, ASTER has formed a bullish divergence between December 7 and February 14. During this period, the price made a lower low. But the Relative Strength Index, or RSI, made a higher low.
RSI measures buying and selling strength on a scale from 0 to 100. When the price falls while the RSI rises, it indicates that selling pressure is weakening. This pattern often appears before a price recovery begins. Aster has not yet fully responded to this signal. This suggests the bullish pressure may still be building.
At the same time, the 20-period exponential moving average, or EMA, is approaching a bullish crossover above the 100-period EMA. EMA tracks the average price over time, giving more weight to recent prices. When shorter EMAs cross above longer ones, it signals strengthening momentum and a possible trend reversal.
The price is also forming an inverse head-and-shoulders pattern.
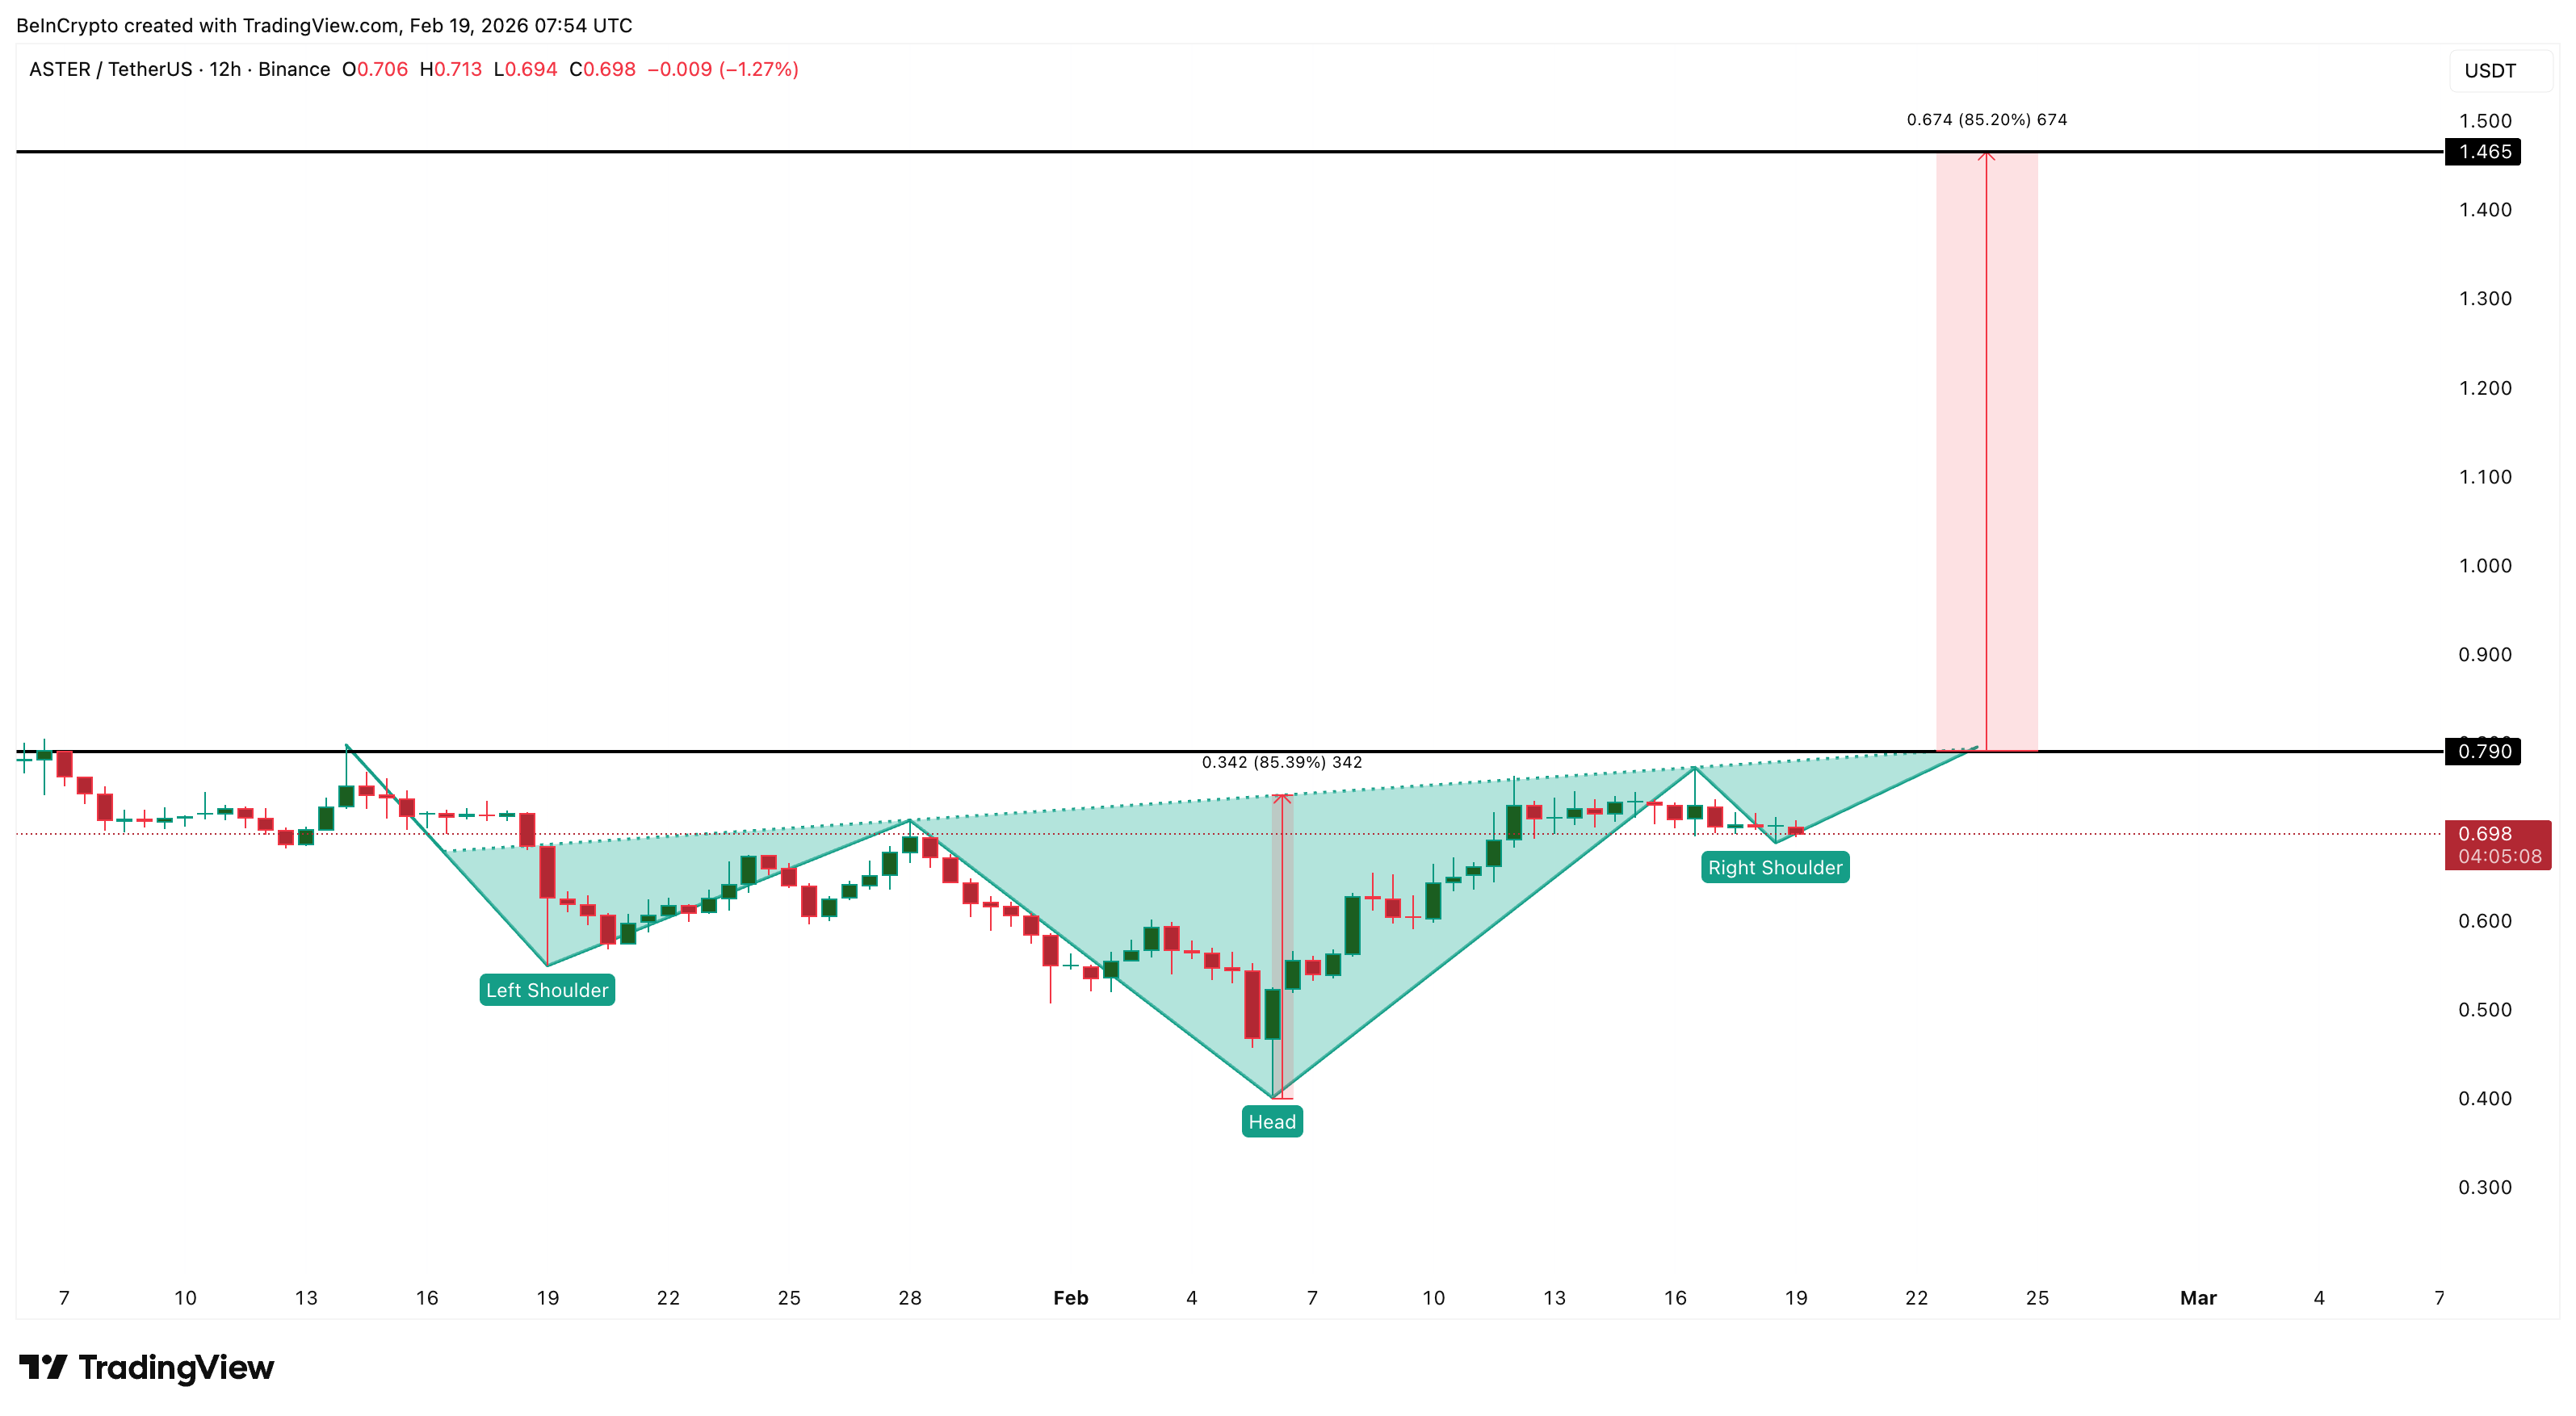
This is a bullish reversal structure showing buyers slowly gaining control. The neckline of this pattern sits near $0.79. A breakout above this level would confirm the recovery.
Whale Accumulation and Sentiment Collapse Create Opposing Forces
Large investors continue accumulating ASTER despite weak public sentiment. Wallets holding between 100 million and 1 billion ASTER have increased their holdings from 2.75 billion to 2.96 billion ASTER since early February. This steady increase shows strong confidence from the largest holders.
Mid-sized whales holding between 1 million and 10 million ASTER have also increased their holdings from 262.48 million to 278.96 million ASTER.
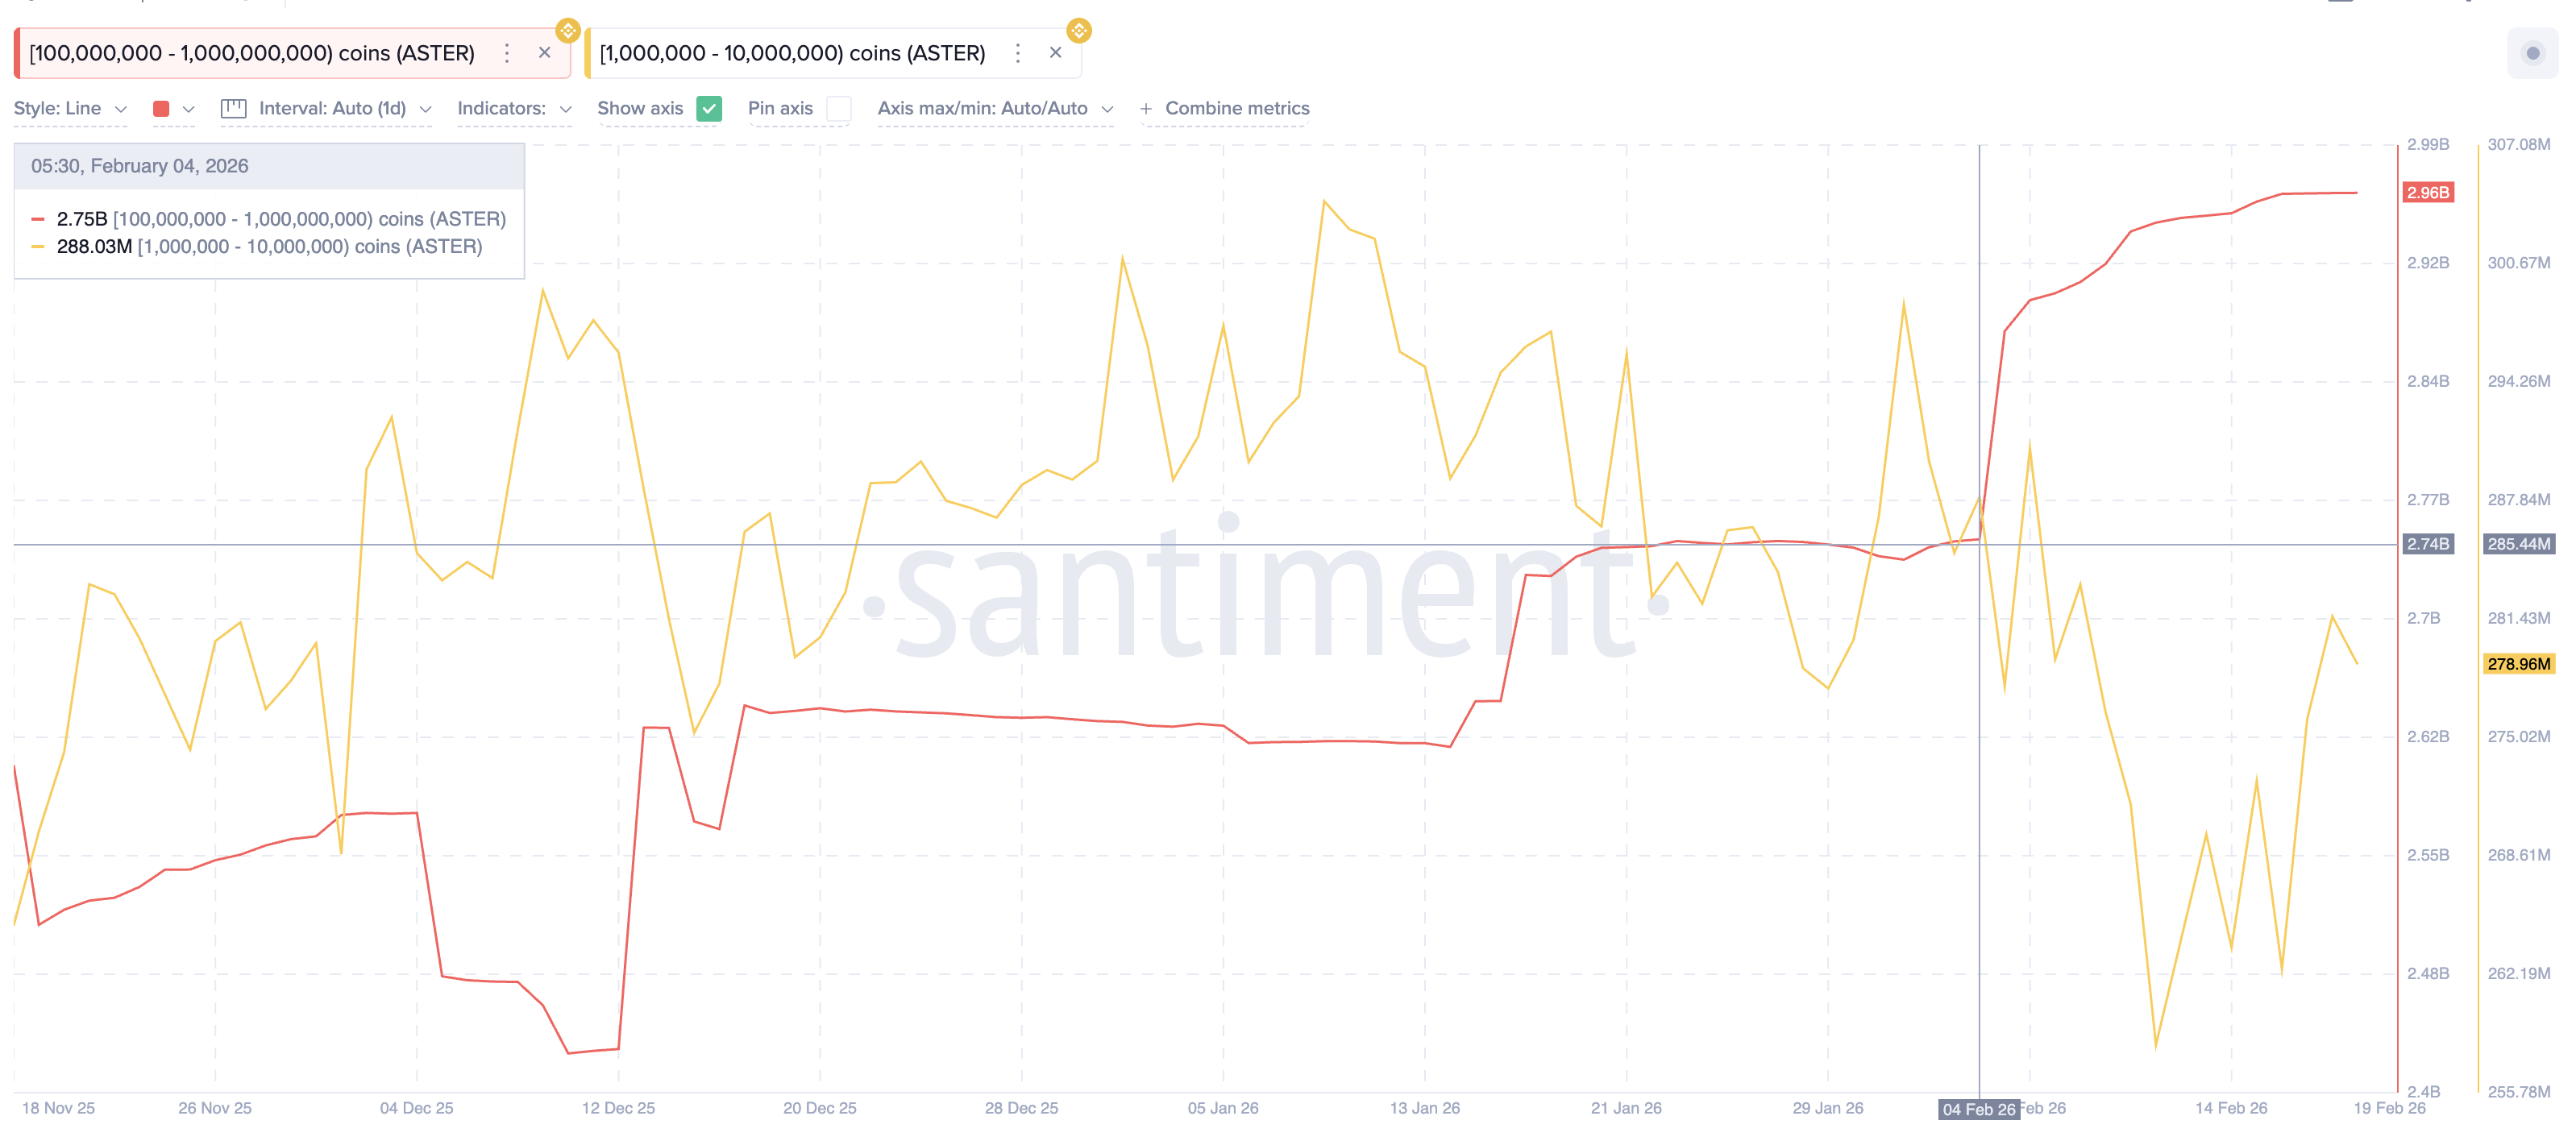
However, some of these smaller whales have recently started reducing positions slightly. This decline appears to be linked to the recent collapse in positive sentiment.
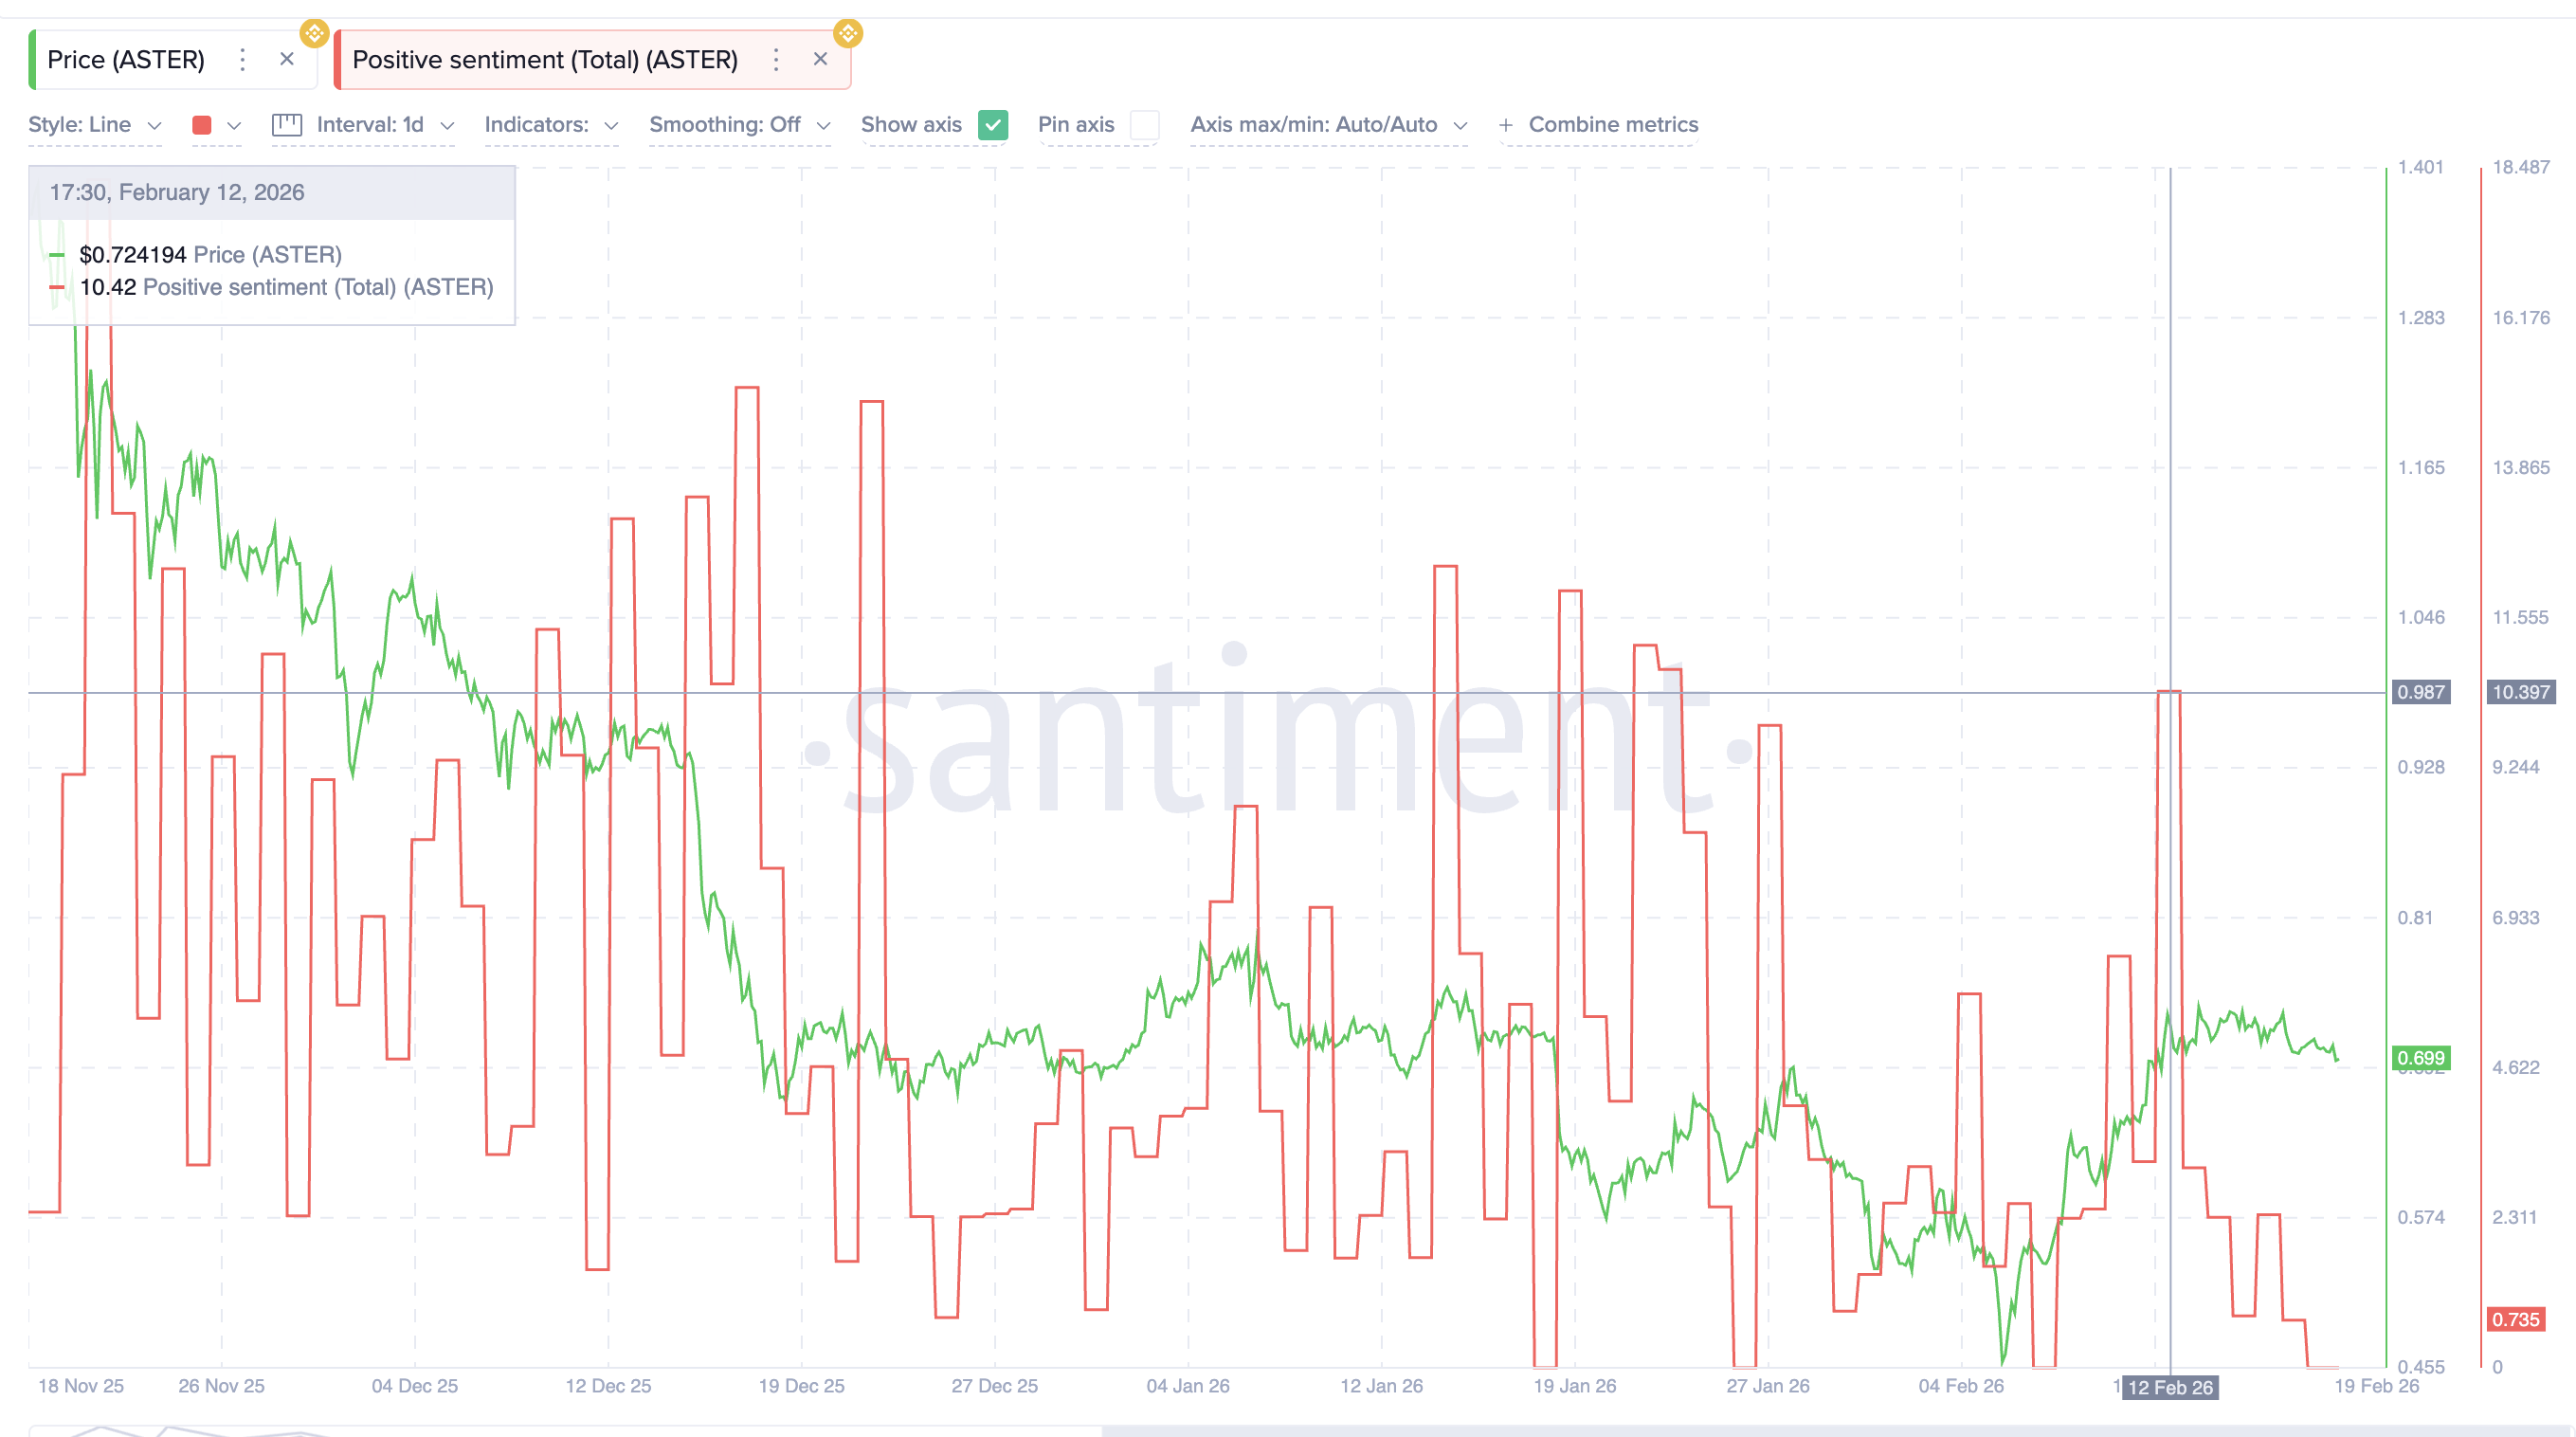
Market sentiment has dropped sharply. Positive sentiment scores fell from 10.39 on February 12 to near zero recently.
Want more token insights like this? Sign up for Editor Harsh Notariya’s Daily Crypto Newsletter here.
This reflects rising criticism and negative perception around Aster’s declining activity, which, based on available data, appears somewhat exaggerated but not entirely unfounded.
This creates a conflict in the market. Large whales continue accumulating, showing long-term confidence. But smaller investors are becoming more cautious as sentiment weakens. This divergence between whale behavior and public sentiment often appears near major turning points.
ASTER Price Levels That Could Trigger an 85% Breakout
The ASTER price now sits near a critical technical level. The neckline of the inverse head-and-shoulders pattern is located at $0.79. A breakout above this level would confirm the bullish reversal. If this breakout happens, the next resistance levels appear at $0.92, $1.06, and $1.29. The full breakout target sits near $1.46. This would represent an 85% rally from current levels.
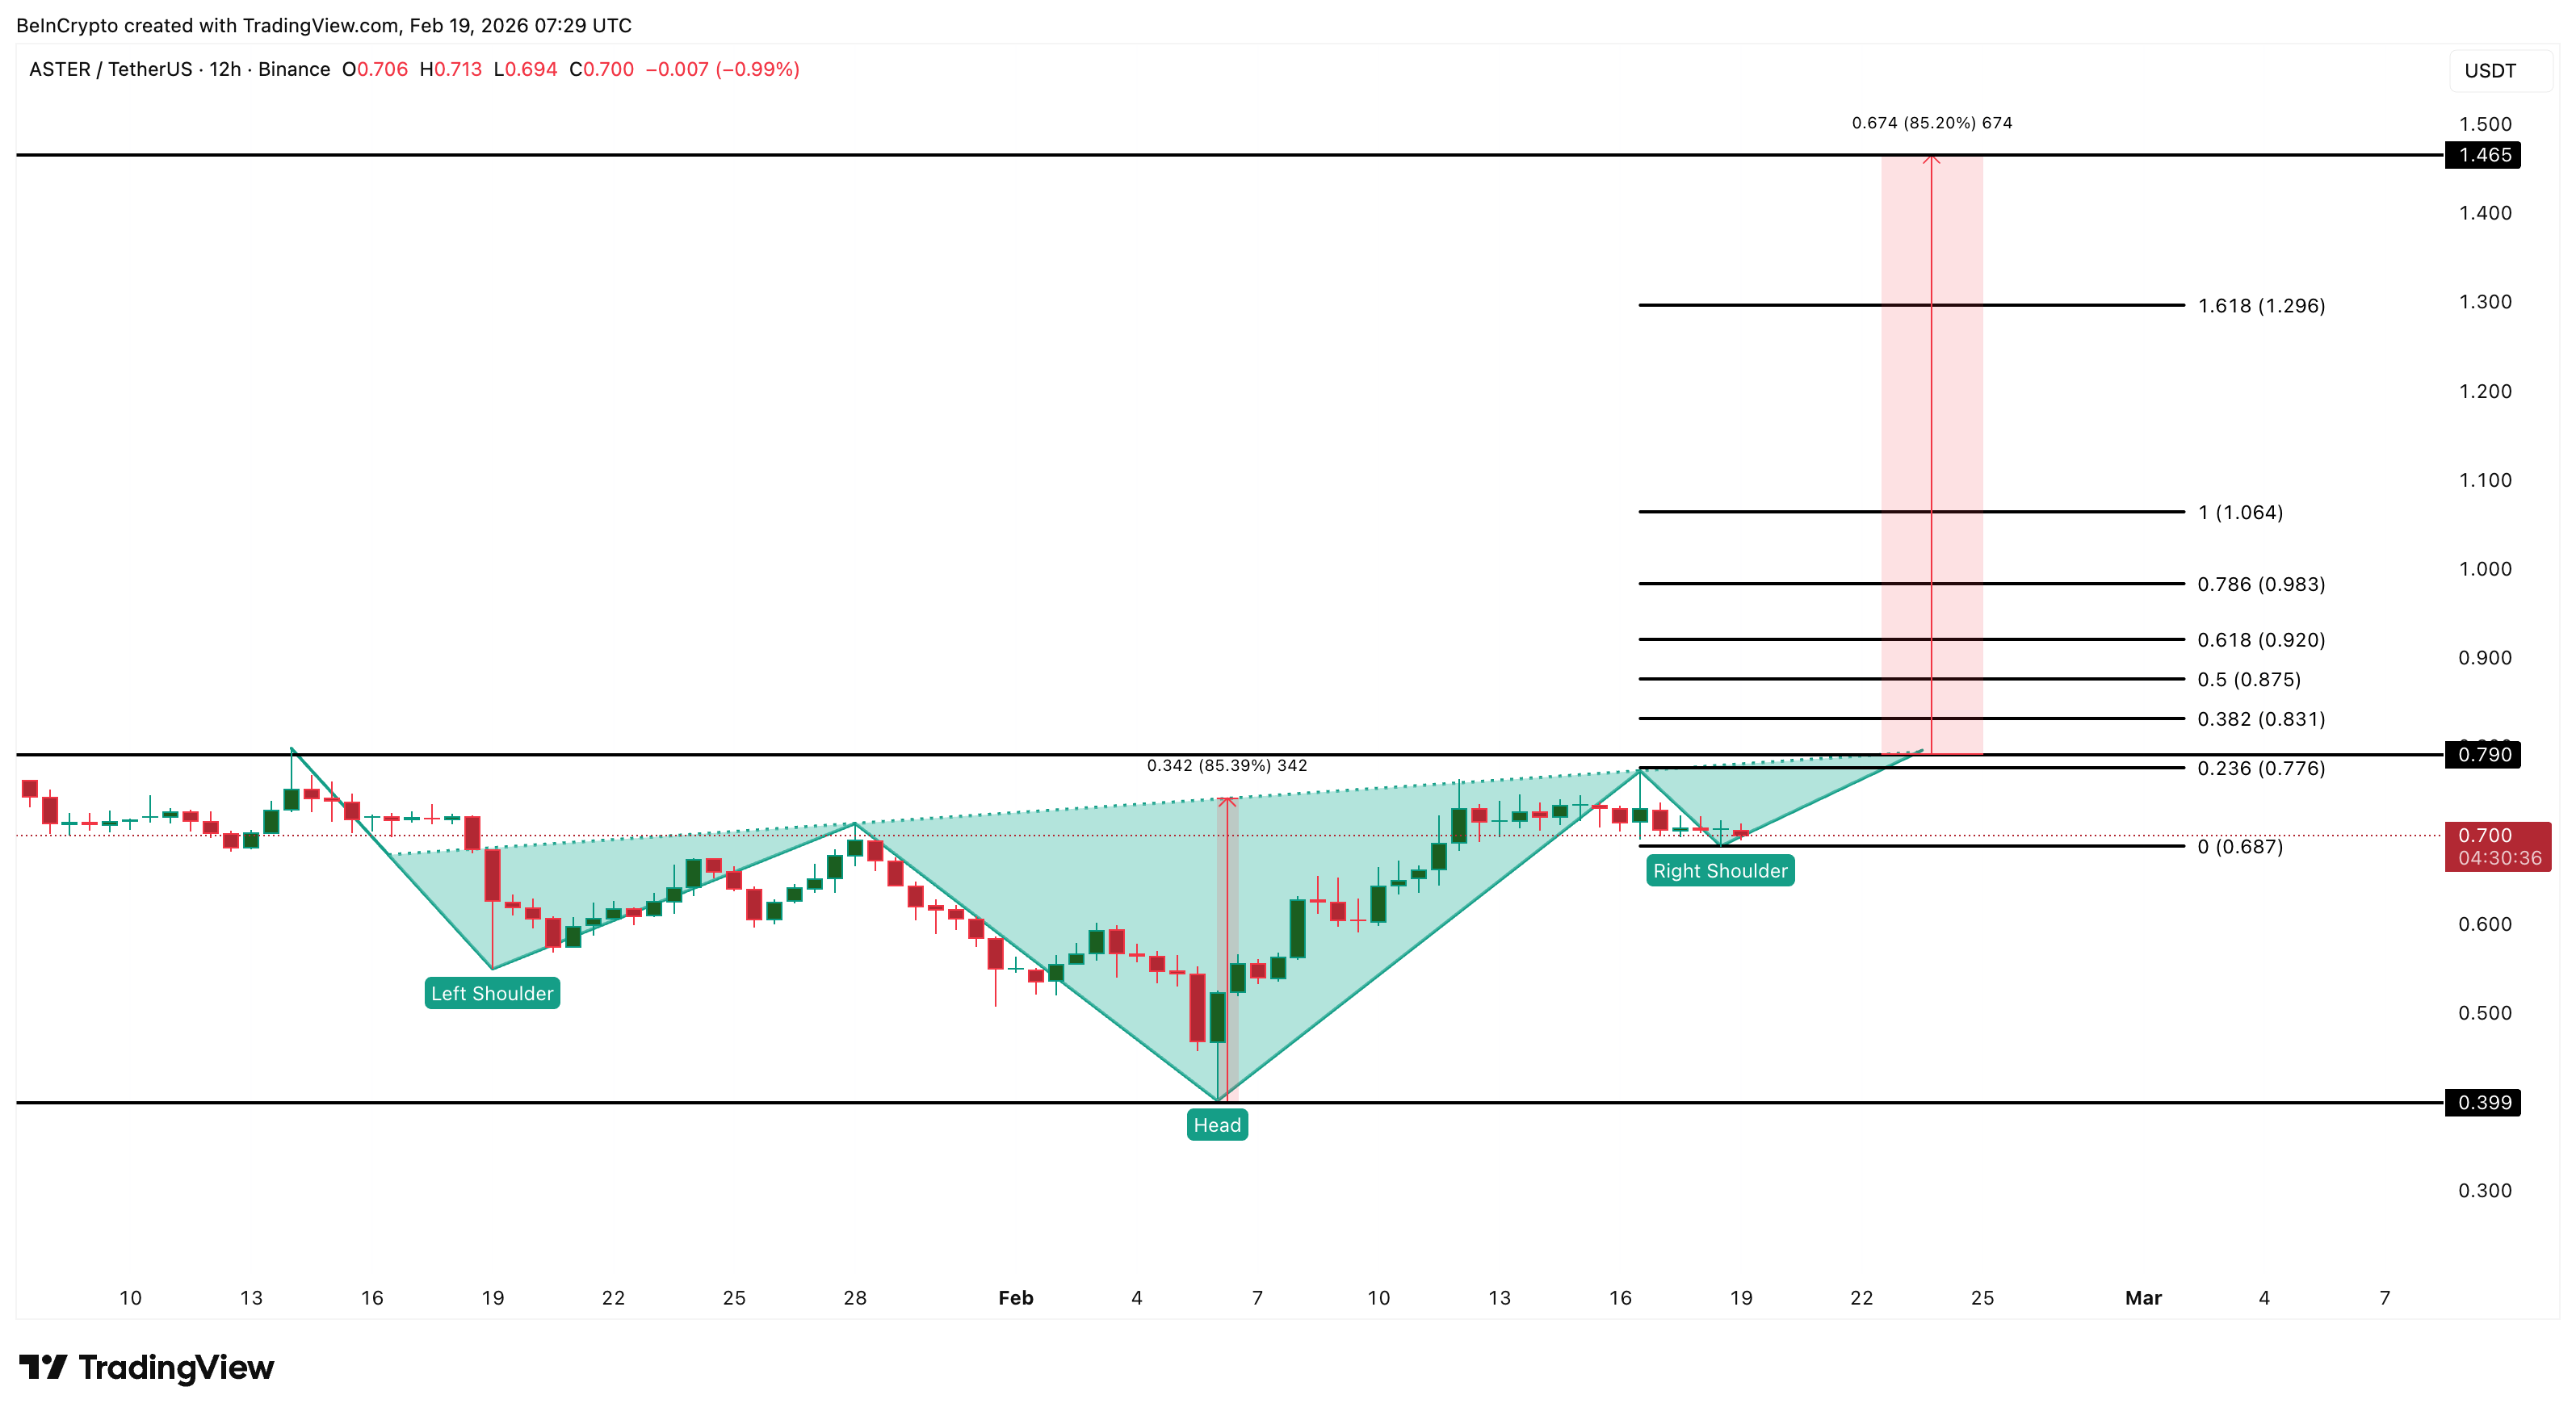
However, downside risks still exist. If Aster falls below $0.68, the bullish setup would weaken. A deeper drop below $0.39 would invalidate the pattern completely and confirm continued bearish pressure.
For now, Aster remains at a turning point. User activity and sentiment have collapsed sharply. But whale accumulation, bullish divergence, and reversal patterns suggest recovery remains possible. The next move above $0.79 or below $0.39 will likely decide Aster’s long-term direction.


Spot Bitcoin exchange-traded funds (ETFs) could surpass gold ETFs in total assets under management (AUM) as investor demand expands beyond the traditional “digital gold” narrative, according to ETF analyst James Seyffart.
“There are just more use cases of why somebody would put a Bitcoin ETF in a portfolio,” Seyffart said on the Coin Stories podcast published to YouTube on Friday. He pointed to Bitcoin’s (BTC) role as digital gold, a store of value, a portfolio diversifier, and a form of digital capital and property, adding that the market also views Bitcoin as a “growth risk asset.”
Seyffart explained that Bitcoin has “all these different ways” of being viewed, while gold only has “one of those things.”
“Our view is that Bitcoin ETFs will be larger than gold ETFs,” he added.
Bitcoin ETFs are a “hot sauce” in the portfolio
“There are so many people that could use it. They could be viewing it to put in their portfolio because they want to bet on like a growth and liquidity trade,” he said. “It can be hot sauce in a portfolio in that way,” he added.

Bitcoin is often compared to gold due to its limited supply and perceived role as a hedge against monetary debasement.
US-based gold ETFs recorded net outflows of $2.92 billion in March, while US spot Bitcoin ETFs attracted $1.32 billion in net inflows over the same period.
Gold and BTC have declined over the past 30 days
The largest US gold-backed ETF, GLD, recorded a $3 billion outflow on Mar. 4, the largest daily withdrawal in more than two years.
On Mar. 19, Cointelegraph cited data from the Bank for International Settlements (BIS) showing retail gold purchases have tripled over the last six months, while Wall Street selling has accelerated over the past four months.
Related: Bitcoin ‘done’ with 85% crashes, says Cathie Wood amid new $34K target
Despite the divergence in ETF flows, both assets have moved broadly in tandem in recent weeks.
Bitcoin is trading at $66,918 at the time of publication, down 8.07% over the past 30 days, according to CoinMarketCap. Meanwhile, gold is trading at $4,676, down 8.25% over the past 30 days, according to GoldPrice data.
In December 2025, Fidelity Digital Assets analyst Chris Kuiper said that, “historically, gold and Bitcoin have taken turns outperforming. With gold shining in 2025, it would not be surprising if Bitcoin takes the lead next.”
Magazine: Solana exec trolls crypto gamers, Pixel tackles play-to-earn issues: Web3 Gamer

TLDR:
- The tokenized US Treasury market hit $12B, far below the $6T traditional money market fund sector.
- Regulatory obligations follow the entities managing assets, not the tokens representing them onchain.
- Embedded compliance built into RWA protocols removes costly intermediary layers found in traditional markets.
- Major jurisdictions including the EU, Singapore, Hong Kong, and Japan are actively building RWA frameworks.
RWA regulation is no longer a side conversation in crypto — it has become the central pillar of tokenized asset infrastructure. As real-world assets move onchain, they carry existing legal obligations with them.
The technology to tokenize bonds, private credit, and equities already works well. However, the legal and compliance layer determines whether those assets carry real, enforceable value for investors.
Without regulatory infrastructure, a tokenized bond is simply a token referencing a bond — nothing more.
The Trust Gap Holding Back Institutional Capital in RWA
The tokenized US Treasury market reached roughly $12 billion as of March 2026. By contrast, the traditional US money market fund industry manages over $6 trillion.
That gap is not a technology problem. The blockchain settles transactions faster, and onchain access is broader than in legacy markets.
The barrier is trust, not capability. A pension fund evaluating a tokenized product needs far more than a working smart contract.
Its compliance team, legal counsel, and board must each confirm that the obligations governing the underlying asset are fully met. That confirmation cannot be approximated — it must be complete.
That standard reflects fiduciary responsibility. These allocators manage other people’s money and carry strict legal accountability for each product they hold.
Every tokenized instrument must meet the same legal standards as traditional market instruments alongside it. That is not a preference — it is a legal requirement.
Plume Network addressed this issue through its RWA Academy series. The team noted that regulatory clarity is “the precondition for institutional capital” in the RWA space.
Regulatory obligations do not sit with the asset itself — they sit with the entities that issue, transfer, and facilitate trading in it. RWA infrastructure must allow those entities to discharge their responsibilities clearly.
Embedded Compliance Is Transforming How RWA Infrastructure Is Built
One key shift in RWA is the transition from bolt-on compliance to embedded compliance. In traditional markets, intermediaries handle compliance at every step of a transaction. Each additional layer adds cost, introduces delay, and reduces transparency for all parties.
Onchain systems can instead build compliance directly into the protocol itself. Transaction screening, transfer restrictions, and KYC/AML verification can all operate within the system. That design eliminates the need for separate compliance layers added after the fact.
The result is a network where compliance is an intrinsic property rather than an add-on feature. That distinction matters enormously for regulated institutions evaluating RWA markets. Institutional adoption of RWA depends on this structural credibility, not just smart contract functionality.
Regulators across major jurisdictions are aligning around the same direction. Europe’s MiCA framework took effect in 2024 and covers all 27 member states.
Hong Kong’s Project Ensemble and Singapore’s Project Guardian are both testing tokenized financial markets with regulatory involvement.
South Korea and Japan are each updating their digital asset laws to accommodate onchain flows. Cross-border fragmentation remains a challenge, but shared principles across frameworks are becoming clearer each month.

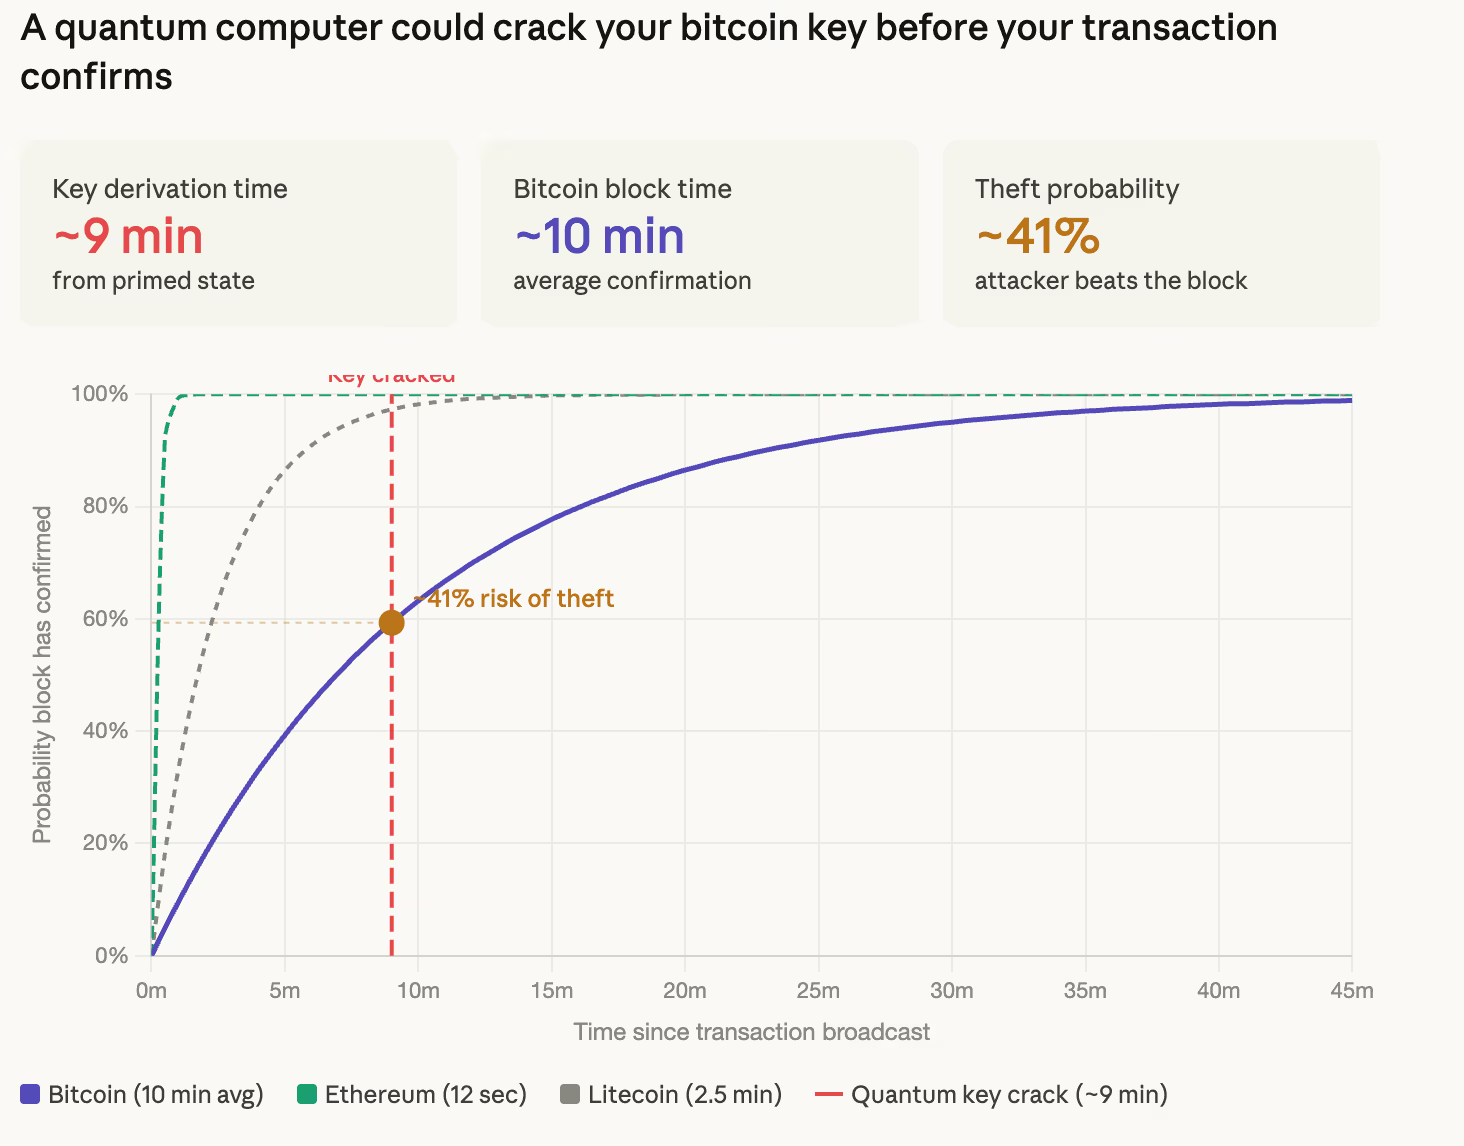
Google’s Quantum AI team said earlier this week that a future quantum computer could derive a bitcoin private key from a public key in roughly nine minutes. The number ricocheted across social media and spooked markets.
But, what does it actually mean in practice?
Let’s start with how bitcoin transactions work. When you send bitcoin, your wallet signs the transaction with a private key, a secret number that proves you own the coins.
That signature also reveals your public key, a shareable address, which gets broadcast to the network and sits in a waiting area called the mempool until a miner includes it in a block. On average, that confirmation takes about 10 minutes.
Your private key and public key are linked by a math problem called the elliptic curve discrete logarithm problem. Classical computers can’t reverse that math in any useful timeframe, while a sufficiently powerful future quantum computer running an algorithm called Shor’s could.
Here’s where the nine minutes part comes in. Google’s paper found that a quantum computer could be “primed” in advance by pre-computing the parts of the attack that don’t depend on any specific public key.
Once your public key appears in the mempool, the machine only needs about nine minutes to finish the job and derive your private key. Bitcoin’s average confirmation time is 10 minutes. That gives the attacker a roughly 41% chance of deriving your key and redirecting your funds before the original transaction confirms.
Think of it like a thief spending hours building a universal safe-cracking machine (pre-computation). The machine works for any safe, but each time a new safe appears, it only needs a few final adjustments — and that last step is what takes about nine minutes.

That’s the mempool attack. It’s alarming but requires a quantum computer that doesn’t exist yet. Google’s paper estimates such a machine would need fewer than 500,000 physical qubits. Today’s largest quantum processors have around 1,000.
The bigger and more immediate concern is the 6.9 million bitcoin, roughly one-third of total supply, that already sit in wallets where the public key has been permanently exposed.
This includes early bitcoin addresses from the network’s first years that used a format called pay-to-public-key, where the public key is visible on the blockchain by default. It also includes any wallet that has reused an address, since spending from an address reveals the public key for all remaining funds.
These coins don’t need the nine-minute race. An attacker with a sufficiently powerful quantum computer could crack them at leisure, working through exposed keys one by one without any time pressure.
Bitcoin’s 2021 Taproot upgrade made this worse, as CoinDesk reported earlier Tuesday. Taproot changed how addresses work so that public keys are visible on-chain by default, inadvertently expanding the pool of wallets that would be vulnerable to a future quantum attack.
The bitcoin network itself would keep running. Mining uses a different algorithm called SHA-256 that quantum computers can’t meaningfully speed up with current approaches. Blocks would still be produced.
The ledger would still exist. But if private keys can be derived from public keys, the ownership guarantees that make bitcoin valuable break down. Anyone with exposed keys is at risk of theft, and institutional trust in the network’s security model collapses.
The fix is post-quantum cryptography, which replaces the vulnerable math with algorithms that quantum computers can’t crack. Ethereum has spent eight years building toward that migration. Bitcoin hasn’t even started.

Coinbase’s bid to build a federally supervised custody and market infrastructure business took a significant step forward when the Office of the Comptroller of the Currency (OCC) granted conditional approval for a national trust bank charter after a six-month review. The decision, however, drew swift pushback from banking groups and reform advocates who argue that the application reveals gaps in risk management, profitability planning, and resolution strategies and that expanding trust powers for crypto activities may exceed the OCC’s statutory remit.
The Independent Community Bankers of America (ICBA) argued that the OCC’s move reflects a broader trend: nonbank entities seeking the benefits of a bank charter without meeting the full regulatory framework that governs traditional lenders. In a statement accompanying its critique, the ICBA warned that the approval could create new safety and soundness risks for consumers and the broader financial system.
The sudden influx of applications demonstrates nonbank entities are seeking the benefits of a US bank charter without satisfying the full scope of US bank regulations.
Coinbase’s bid to broaden its custody and market infrastructure footprint enters a federal regulatory arena that remains unsettled for many crypto activities.
Key takeaways
- OCC grants conditional approval for Coinbase to pursue a national trust bank charter after a six-month review, signaling a potential federal framework for crypto custody and related services.
- Industry and reform groups counter that the application highlights regulatory gaps and could shift risk toward consumers and the financial system if not fully aligned with traditional banking standards.
- Separately, a broad debate over stablecoins and yield-bearing products intensifies scrutiny of how crypto yields fit within or outside existing banking rules, including concerns about potential asset leakage from banks.
- Policy discussions in Washington continue around the US Digital Asset Market Clarity Act, with progress claimed by some lawmakers but key sticking points, such as yield, delaying formal committee action.
Regulatory pushback surrounds Coinbase bank-charter approval
Stablecoins and yield debate intensifies regulatory scrutiny
Bank of America CEO Brian Moynihan estimated that up to trillions of dollars could migrate away from conventional banks if such yields were broadly permitted, potentially constraining banks’ ability to lend and raising borrowing costs for households and businesses.
Policy momentum, investor implications, and what comes next
What to watch next: a clearer alignment on the Digital Asset Market Clarity Act’s key provisions, updates on whether yield-bearing products will be reconciled within traditional banking restrictions, and any further OCC or federal guidance that could define the contours of crypto custody and market infrastructure under a national bank charter.
Crypto World
Chainlink’s $42M LINK Transfer to Binance Sparks Caution as Whale Wallets Hit a One-Year High
TLDR:
- Around 4.9 million LINK tokens worth roughly $42M were transferred to Binance during a low-volume weekend session.
- A single wallet address was responsible for moving 2.5 million LINK directly to Binance in one concentrated transfer.
- Chainlink whale wallets holding 1M or more LINK grew from 100 to 125 between April 2025 and April 2026.
- Analysts remain cautious as large exchange inflows can signal selling pressure, especially during low-liquidity trading periods.
Chainlink has attracted renewed attention following a large on-chain transfer over the weekend. Around $42 million worth of LINK tokens moved to Binance during a period of typically low trading activity.
The movement came alongside fresh data showing a rise in whale wallet accumulation over the past year. Both developments have placed the asset under closer watch from market participants tracking its near-term direction.
The timing has added to growing interest surrounding Chainlink’s current on-chain behavior.
Large LINK Transfers Raise Questions About Exchange Inflows
On-chain analyst Darkfost flagged the transfer on social media this weekend. According to the post, roughly 4.9 million LINK tokens were sent to Binance.
Within that total, 2.5 million LINK came from a single wallet address. The concentration of funds from one source drew added attention to the movement.
The transfers occurred during a weekend, when trading volumes tend to stay lower than usual. Low-liquidity windows can strengthen the price effect of large exchange inflows.
Some participants move large sums during these periods to avoid immediate market disruption. Others may use the timing to position ahead of the regular trading week.
Darkfost outlined two possible explanations for the movement. One is that the Chainlink team relocated funds for custody or under a Binance arrangement.
The other is that a whale or large entity chose Binance for access to its deep order book. The actual reason behind the transfer has not been confirmed.
Large exchange inflows call for a measure of caution from market observers. Funds sent to a trading platform can, under the right conditions, translate into sell-side activity.
Chainlink’s order book is now being watched for any follow-through from these transfers. No major sell event had been reported at the time of publication.
Whale Accumulation in Chainlink Points to Long-Term Confidence
Santiment published data on April 3 showing a notable shift in Chainlink’s whale count. The number of wallets holding one million or more LINK tokens grew from 100 to 125.
That change occurred between April 2025 and April 2026, a period marked by a broader crypto bear market. The data points to quiet accumulation by large holders throughout that time.
Accumulation of this scale often goes unnoticed when price action is flat. On-chain whale metrics, however, offer a longer view of how an asset is being positioned.
Chainlink’s rising whale count reflects steady demand from the top tier of holders. That trend continued even as market conditions remained difficult.
The contrast between exchange inflows and long-term wallet growth presents a layered picture. Near-term transfers to Binance suggest possible selling pressure, while whale accumulation signals continued holding behavior.
These two trends carry different weight depending on one’s investment horizon. Both are expected to remain in focus in the weeks ahead.
Chainlink’s price was recorded at $8.69 at the time of the on-chain activity. Analysts and traders continue to monitor both flows and wallet data for further developments.
Crypto World
Tokenized Real-World Assets Hit $27.65B as Ondo Finance Dominates Equities With 60% Market Share
TLDR:
- The tokenized RWA market reached $27.65B in April 2026, growing 4.07% while most crypto sectors contracted.
- U.S. Treasury debt leads the RWA market at $12.78B, nearly half the total, followed by commodities at $5.4B.
- Tokenized equities hit $941M with a $2.94B monthly transfer volume, marking an 85.78% jump in 30 days.
- Ondo Finance controls 60.07% of the tokenized equity market at $557M, spanning 230 products across 8 asset classes.
Tokenized real-world assets have reached $27.65 billion in total distributed value as of April 2026. The sector grew 4.07% over the past 30 days, standing apart from most crypto verticals.
Capital inflows into RWA remain structurally positive while other segments contract. U.S. Treasuries lead at $12.78 billion, followed by commodities at $5.4 billion and asset-backed credit at $3.19 billion. Tokenized equities are now approaching the $1 billion threshold.
RWA Market Holds Steady as Capital Flows Into Tokenized Instruments
The tokenized RWA market is drawing consistent institutional interest in blockchain-based financial instruments. Investors are moving capital into on-chain versions of Treasuries, commodities, and credit products.
These assets offer dollar-denominated yield without traditional brokerage accounts or wire transfer requirements. Global access without timezone or geographic barriers is a key draw for institutional allocators.
U.S. Treasury debt at $12.78 billion accounts for nearly half the total market value. Commodities follow at $5.4 billion, while asset-backed credit holds $3.19 billion.
Together, these three categories make up the bulk of the $27.65 billion total. The composition reflects a market led by yield-generating and capital-preservation instruments.
The 4.07% monthly growth rate is notable given the current crypto environment. Most sectors are recording outflows, yet RWA continues to attract fresh capital.
That contrast points to a structural shift in how institutional money views on-chain assets. Investors appear to be treating tokenized instruments as a long-term allocation category.
The broader data from rwa.xyz reinforces this trend with consistent upward movement. Monthly figures have held positive across multiple reporting periods.
The market is not being driven by short-term speculation, but by allocation patterns familiar in traditional finance. That behavioral shift separates RWA from most other crypto verticals.
Ondo Finance and xStocks Lead a Concentrated Tokenized Equity Sector
Tokenized equities now sit at $941 million, closing in on the $1 billion mark. Monthly transfer volume reached $2.94 billion, a jump of 85.78% over 30 days.
That creates a 3:1 ratio between transfer volume and total asset value. The ratio points to active trading rather than passive holding behavior among participants.
According to data shared on X, OndoFinance holds 60.07% of the tokenized equity market at $557 million. The platform operates across 230 products and grew 8.28% over the past month.
@xStocksFi holds 26.24% at $243.3 million, making it the second-largest platform. Together, the two platforms control 86% of the entire tokenized equity market.
Securitize, the next closest competitor, holds only $60 million across a single product. That platform declined 38.32% over the same 30-day period.
Every other platform in the space holds under $25 million. The drop-off from the two leaders to the rest of the market is sharp.
Ondo’s growth reflects a portfolio that has evolved well beyond its original design. The platform started with OUSG and USDY as Treasury yield products. It now covers eight asset classes, with U.S. Treasury debt at $2.4 billion making up 76.9% of its total value.
The equity vertical at $557 million has become its second-largest and fastest-growing segment, with top products including S&P 500 ETFs and NVIDIA shares.
Crypto World
Best Crypto to Buy Now as the Search Leads to Pepeto With $8M Raised and 100x Before Binance Listing
The search led right here. The best crypto to buy now is not SOL at $80.49 grinding toward 36% or ADA at $0.24 waiting for a hard fork. It is a presale at millionths of a cent that raised more than $8 million during extreme fear because wallets found it before the crowd had reason to look.
This entry has a higher ceiling because a working exchange stands behind the token, and analysts project 100x before the confirmed Binance listing opens. The search for the best crypto to buy now was leading to Pepeto all along, and the wallets inside acted on that signal first.
Kentucky House Bill 380 mandated hardware wallet backdoors, forcing manufacturers to assist with seed phrase resets per CoinDesk. The provision destroys the foundation of self custody.
CoinGecko showed the market dropping as fears spread across positions. The best crypto to buy now benefits from this shift because capital seeking safety flows toward audited presales with verified contracts, confirmed listings, and tools that protect every wallet before any transaction clears.
Custody Shift and the Presale the Keyword Search Was Leading To
Pepeto: Risk Scorer and Bridge Live With 100x Before Listing
Protecting capital from threats requires action, not another search. Pepeto, considered the best crypto to buy now, delivers contract checking through the risk scorer, keeping wallets safe from malicious tokens before any position opens, the kind of protection that makes a presale entry worth committing to before listing. This is why searching for another update is the wrong approach when the presale fills and the listing draws closer.
The math proves the conviction. More than $8 million entered at $0.000000186 during extreme fear, and analysts project 100x before the Binance listing. That means presale capital converts into returns that SOL at 36% and ADA at 2x cannot come close to matching from current levels.
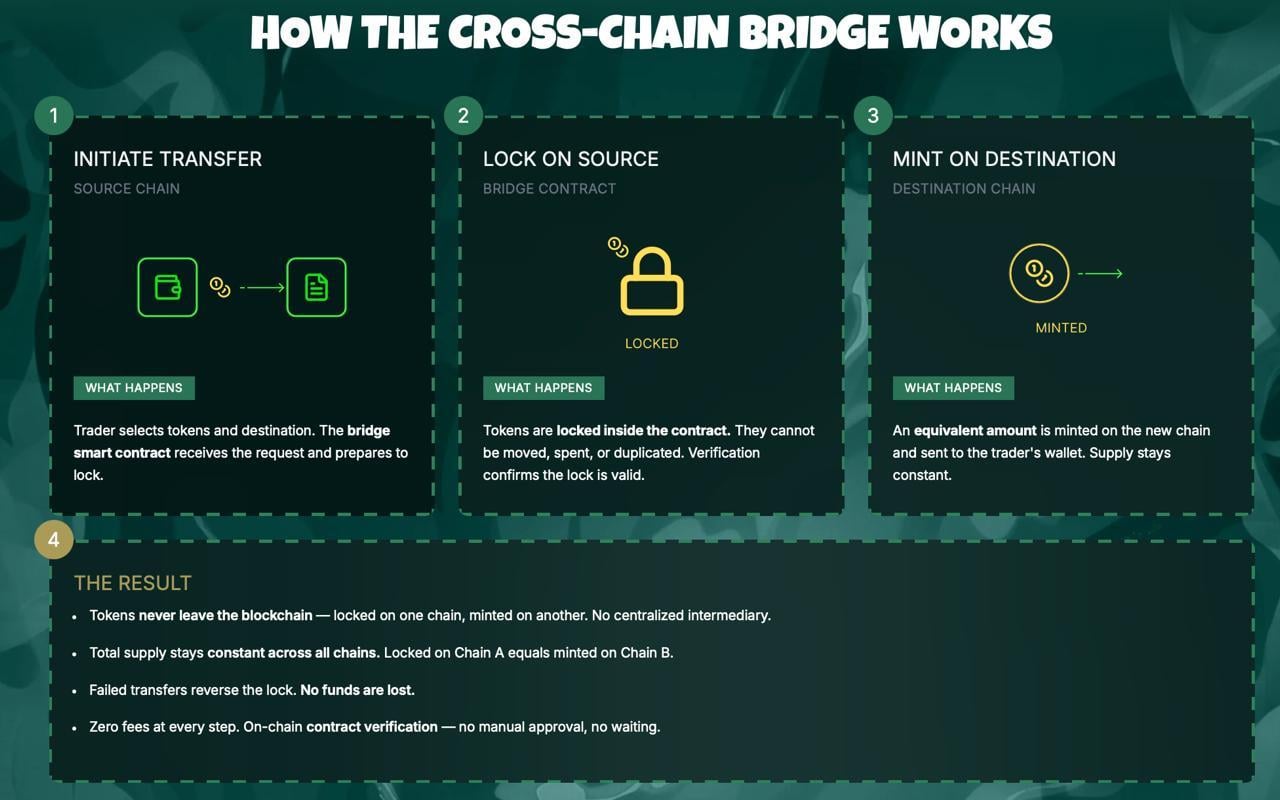
This setup is why wallets leave large cap targets for the Pepeto entry. The cross chain bridge moves assets at zero cost keeping capital whole, and PepetoSwap processes zero fee trades. The platform condenses research into seconds through a clean interface where every tool runs and the layout makes finding what matters simple.
The cofounder who created the original Pepe coin turned zero products into $11 billion, SolidProof audited every contract, and a former Binance expert drives the listing. Staking at 189% APY compounds returns while listing approaches, and every round filling means fewer entries remain for the wallets that have not moved yet.
Solana (SOL): $80.49 Recovering From $285M Drift Protocol Exploit
SOL sits at $80.49, down 2.77% on the week after the $285 million Drift exploit per CoinMarketCap. Support at $75, resistance at $88.
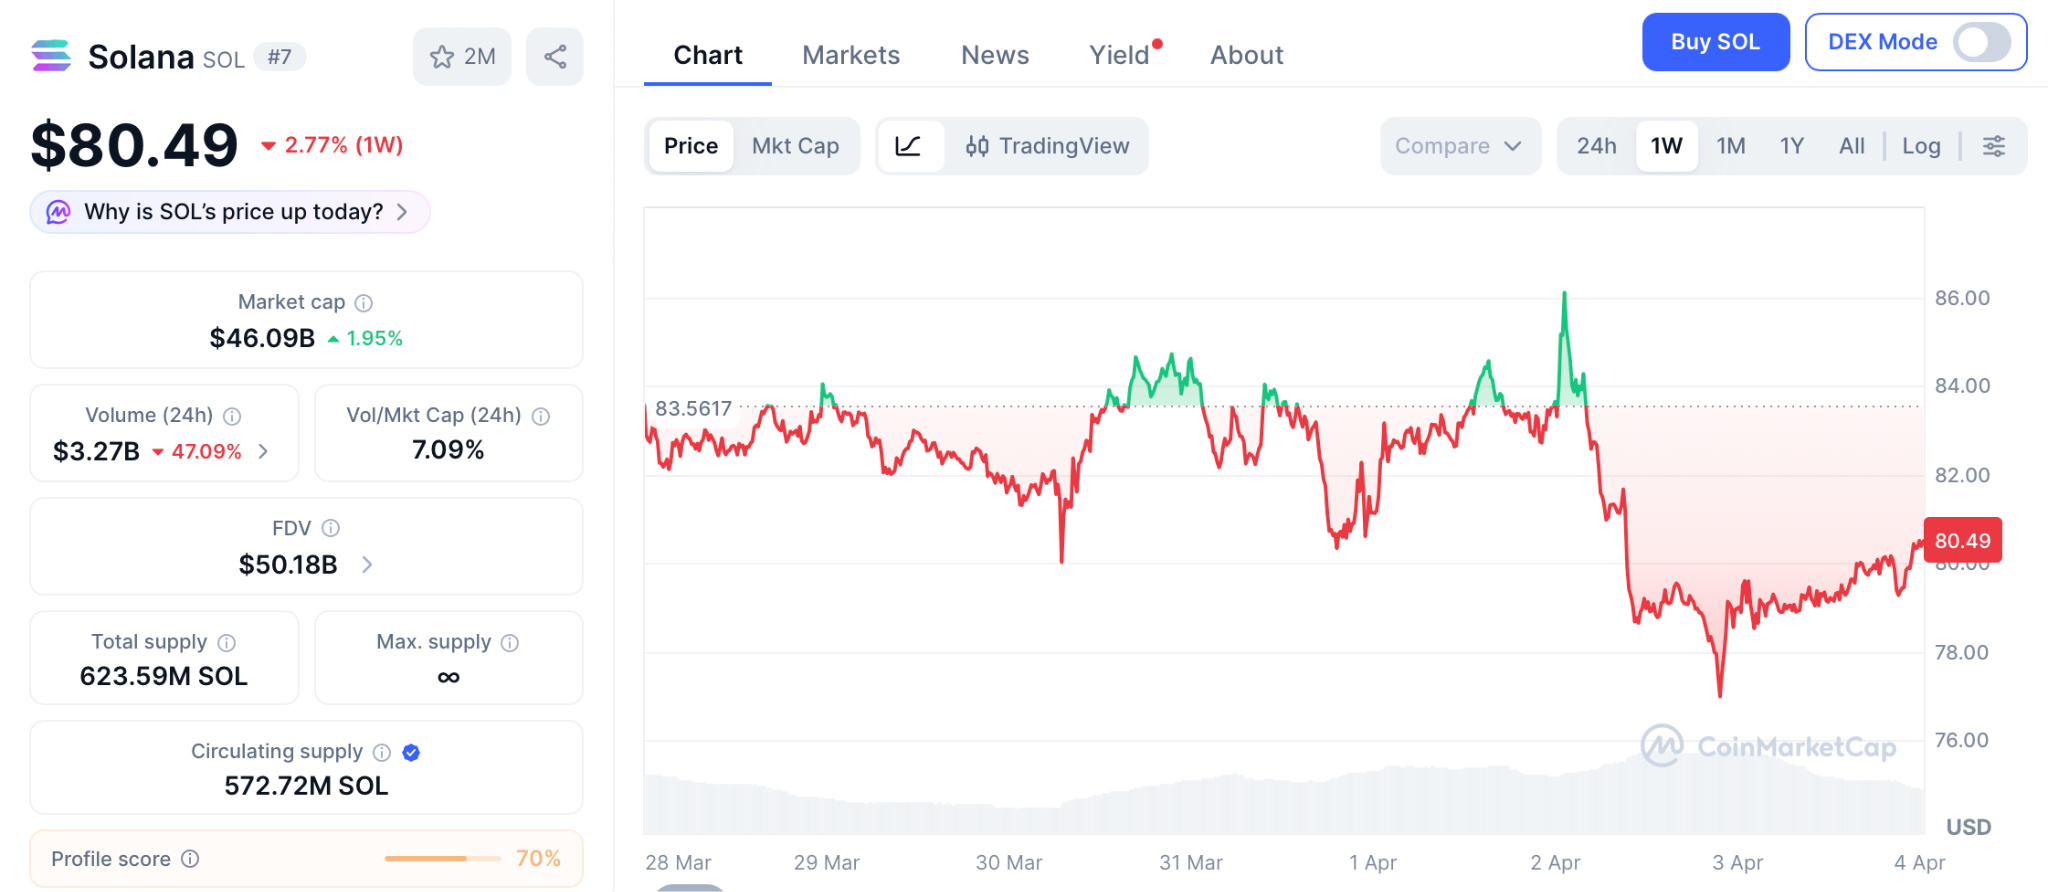
Even $120 delivers 52%, modest next to the presale entry where 100x projections carry a working exchange.
Cardano (ADA): $0.24 Awaits Protocol 11 Governance Overhaul
ADA trades at $0.24 per CoinGecko. Protocol 11 adds on chain governance with the Midnight sidechain.
Even $0.50 delivers 2x from $0.24, a ceiling presale math multiplies past before listing day arrives.
Conclusion: Why the Best Crypto to Buy Now Already Answered the Search
The presale fills right now, making this the best time to enter before the price moves. Another search will not change the outcome for wallets still outside. Early wallets acted before the crowd had reason to look, and the best crypto to buy now has a higher ceiling because a working exchange stands behind the token instead of a whitepaper.
The Pepeto official website shows capital arriving while SOL and ADA debate their next percentage, and entering now means joining the wallets that found the answer before the listing confirms what the capital already proved.
Find the answer at Pepeto before the listing closes the entry the search was leading to.

FAQs
What is the best crypto to buy now in April 2026?
Pepeto leads the best crypto to buy now with a working exchange, risk scorer, and 100x projections before a confirmed Binance listing.
How does the Kentucky bill affect the best crypto to buy now?
The bill threatens custody, making audited presales with verified contracts the safer choice through the Pepeto official website where tools protect positions.
How does the best crypto to buy now compare to SOL and ADA?
SOL and ADA cap returns modestly, while Pepeto offers 100x with working tools, making it the answer the search was leading to.
Disclaimer: This is a Press Release provided by a third party who is responsible for the content. Please conduct your own research before taking any action based on the content.
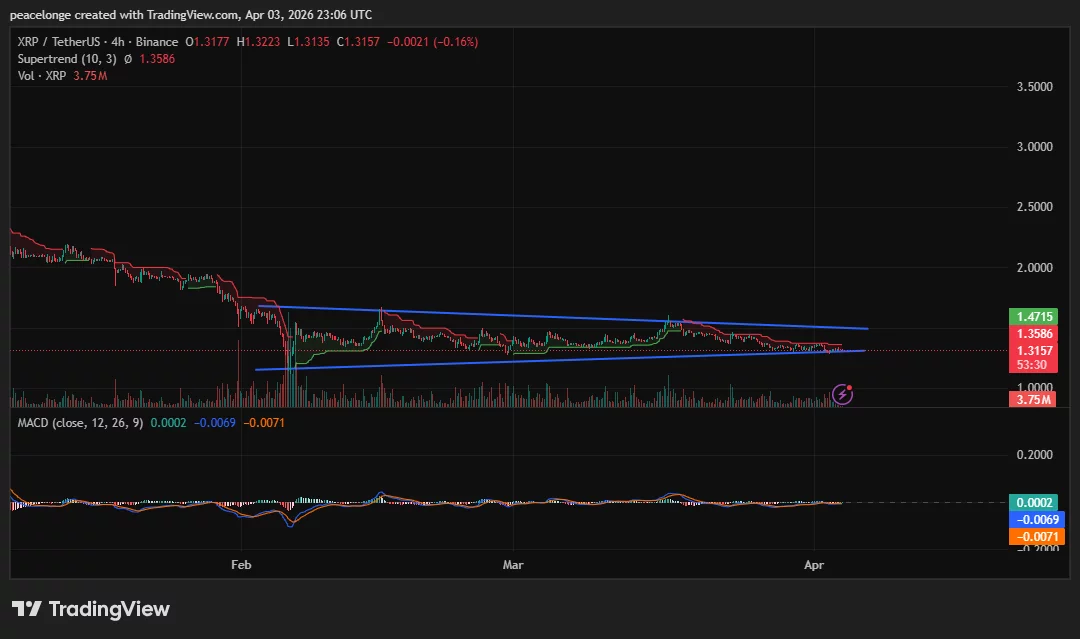
XRP is compressing into the apex of a descending wedge at $1.3157 after months of lower highs and lower lows, with the 4H MACD signal line just crossing into positive territory for the first time since February — a sign that bearish momentum may be approaching exhaustion ahead of what could be the pattern’s most consequential candle close.
Summary
- XRP is trading at $1.3157, pressing against the apex of a descending wedge pattern visible on both the daily and 4H charts, with the daily Supertrend bearish at $1.4894.
- The daily MACD histogram stands at -0.0222, while on the 4H chart the signal line has just crossed marginally into positive territory, signalling that bearish momentum is approaching exhaustion ahead of the wedge resolution.
- A confirmed daily close above $1.47 targets $1.50 and a potential challenge of $1.60, while a break below $1.27 risks an acceleration toward $1.14.
XRP (XRP) is trading at $1.3157 on April 3, 2026, down 0.33% on the day and compressing near the apex of a descending wedge pattern that has formed across both the daily and 4H timeframes since February. The Supertrend indicator on the daily chart sits at $1.4894, in red above price, confirming the prevailing bearish regime. Yet the formation itself is a structure that technical analysts typically associate with bullish reversal potential when it emerges at the end of a prolonged downtrend, provided the lower trendline holds.
On the daily chart, two converging trendlines are clearly visible: a descending upper resistance line and a slightly rising lower support line. Price at $1.3157 is nearing the apex, with the most recent daily low printed at $1.3033. The daily MACD shows a histogram of -0.0222, with the MACD line at -0.0287 below the signal at -0.0065. The reading remains bearish, but the histogram has been contracting, a sign that selling pressure is gradually fading.

On the 4H chart, the same wedge structure is intact. The upper descending trendline aligns with the 4H Supertrend at $1.3586, and the lower rising trendline has provided support on each test since early February. Critically, the 4H signal line has crossed marginally into positive territory at 0.0002, while the MACD line at -0.0069 is approaching zero from below. A full bullish MACD crossover has not yet occurred, but the convergence at near-zero is an early signal of bearish exhaustion.
Key Levels, Price Targets, and Invalidation
Bull case: a daily close above the descending wedge resistance near $1.47 would confirm the breakout, initially targeting $1.4894, the Supertrend level, then $1.50. Above that, $1.60 is the key structural zone where the broader descending channel from July 2025 would be meaningfully challenged. Technical analyst Ali Martinez noted on X (formerly Twitter) that XRP “could offer a short-term buying opportunity” within its multi-year ascending triangle structure at current levels, though he also identified a potential further decline of approximately 30% before a sustained long-term recovery becomes likely.
Bear case: a daily close below $1.27 would break the wedge support and expose XRP to $1.14, the conservative channel breakdown target. A dense supply cluster of approximately 19.6 million XRP is concentrated between $1.27 and $1.28, per Coinglass cost-basis data, making this the most critical demand zone to defend.
Invalidation of the bull case: a daily close below $1.27. Invalidation of the bear case: a daily close above $1.47.
On-Chain and Derivatives Context
U.S. spot XRP ETF monthly inflows turned negative in March 2026 for the first time since the products launched in November 2025, according to SoSoValue data, removing a structural buy-side catalyst that had underpinned price through Q1. XRP open interest across all exchanges now sits near $2.45 billion, down approximately 73% from the September 2025 peak, as detailed in prior crypto.news coverage.
Funding rates have shifted to a positive 0.008%, suggesting fresh long positions are entering near current levels. However, the six-to-twelve month holder cohort has begun trimming positions since March 27, reducing a layer of structural support precisely as the wedge reaches its apex.
As crypto.news has covered, recovery attempts have repeatedly stalled below descending resistance, and the pattern remains intact until buyers produce a decisive daily close above the wedge’s upper trendline. With the 4H signal line at zero and the apex approaching, the next directional candle carries outsized weight.
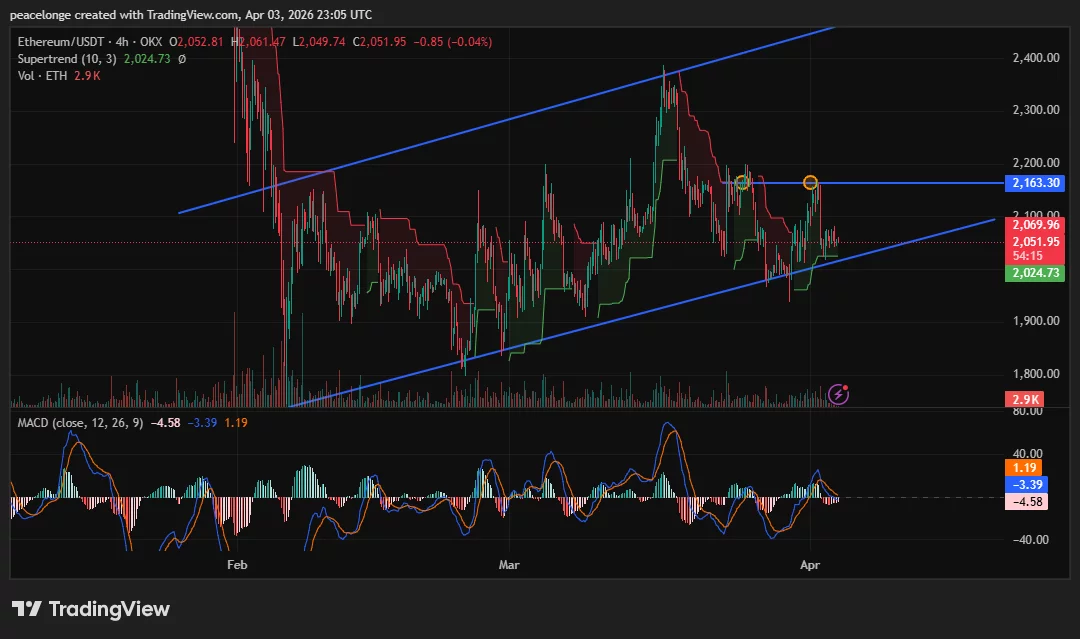
Ethereum is pressing against a double-top resistance zone at $2,163 after two consecutive rejections from the upper boundary of its rising parallel channel, while a marginal bullish MACD crossover on the 4H chart raises the question of whether buyers can finally break through or whether the pattern will resolve to the downside toward $1,980.
Summary
- Ethereum is trading at $2,051.80, holding inside a rising parallel channel on both the daily and 4H timeframes after twice rejecting from the $2,163-$2,166 resistance zone.
- The 4H MACD histogram has just turned positive to 1.19, signalling a bullish crossover, while the daily Supertrend at $1,980.92 remains green, indicating the broader trend structure has not yet broken.
- A confirmed daily close above $2,166 targets $2,250-$2,300, while a loss of $2,024 Supertrend support opens the door to $1,980 and potentially $1,900.
Ethereum (ETH) is trading at $2,051.80 on April 3, 2026, holding inside a rising parallel channel that has been intact since the February lows. Two consecutive rejection candles at the $2,163-$2,166 zone, marked clearly on both the 4H and daily charts, have created a double-top structure at the channel’s upper boundary. With $6.3 billion in Ethereum options having expired today and CME futures offline for Good Friday, traders face a thin-liquidity weekend that could amplify any directional move.
On the 4H chart, Ethereum is trading between the channel’s lower support near $2,024 and the upper resistance at $2,163. The 4H Supertrend at $2,024.73 is still green, confirming the short-term trend has not flipped bearish. More notably, the 4H MACD histogram has just crossed into positive territory at 1.19, with the MACD line at -3.39 crossing above the signal line at -4.58. This is a marginal but technically meaningful bullish crossover, the first since mid-March.

On the daily chart, the picture is more cautious. The MACD histogram sits at -7.33, with the MACD line at -11.11 still below the signal at -3.78. The daily Supertrend at $1,980.92 remains green, meaning the daily trend has not broken bearish. Two orange markers on the chart precisely identify the double-top rejection zone at $2,163-$2,166. A daily close above $2,166 would invalidate the double-top and confirm the rising channel’s upper trendline as the next target.
Key Levels, Price Targets, and Invalidation
Support is layered at $2,024 (4H Supertrend) and $1,980 (daily Supertrend). A daily close below $1,980 would flip the daily Supertrend bearish and break the rising channel structure that has defined price since February, opening a move toward $1,900 as the next major floor.
Resistance: the $2,069 area (the 4H Supertrend upper band visible on the chart) acts as a near-term ceiling, then the double-top zone at $2,163-$2,166. A clean daily close above $2,166 targets $2,250 initially, with $2,300-$2,400 as the broader bull case if the channel’s upper trendline is the objective.
Invalidation for the bullish channel thesis: a 4H close below $2,024 Supertrend support. Invalidation for the bearish double-top thesis: a daily close above $2,200.
Options Expiry and Macro Context
Approximately $6.3 billion in Ethereum options expired on April 3, according to data from Deribit, with spot price trading near the max pain zone for the expiry. Analysts at AnalyticsInsight noted the event is “more like a routine settlement than a major turning point,” given price proximity to max pain, limiting the probability of an expiry-driven spike in either direction.
As crypto.news reported, Ethereum fell 3.4% toward the $2,000 support on April 2 during the broader market selloff tied to U.S.-Iran escalation and the $285 million Drift Protocol exploit on Solana. The fact that the 4H Supertrend held at $2,024 through that sell event is a meaningful signal of buyer resilience at that level.
A sustained hold above $2,024 heading into next week, particularly with the 4H MACD histogram staying positive, would be the first concrete signal that bulls are retaking short-term control. If $2,024 fails, the double-top breakdown and a move toward $1,900 become the primary scenario to watch.


United States President Donald Trump took credit for an unprecedented attack on the Ghadir Bridge, Iran’s largest bridge, as continued geopolitical tensions kept crypto markets suppressed.
Summary
- Trump claimed responsibility for a strike on Iran’s Ghadir Bridge and warned of further attacks if negotiations fail.
- Escalation fears weighed on crypto markets, with Bitcoin dropping from $67,376 to $66,345 following the announcement.
On April 2, Trump shared a video of part of the newly built 136-metre-high cable-stayed bridge between Tehran and Karaj collapsing.
“The biggest bridge in Iran comes tumbling down, never to be used again,” he wrote on Truth Social, and warned that there would be “much more to follow” if Iran doesn’t negotiate.
“Our Military, the greatest and most powerful (by far!) anywhere in the World, hasn’t even started destroying what’s left in Iran. Bridges next, then Electric Power Plants! New Regime leadership knows what has to be done, and has to be done, FAST!” Trump said in a later post.
The latest attack comes just a day after Trump vowed to hit Iran “extremely hard” over the next two to three weeks. The president also reiterated his threat to destroy Iran’s power plants.
“We are going to hit each and every one of their electric generating plants very hard and probably simultaneously,” and has since doubled down after the latest strike.
Trump also added that a new nuclear deal is “nearing completion,” but authorities in Iran have denied that official talks are underway and have vowed to launch a “devastating” retaliation.
Japan’s Nikkei 225 rose 1.28%, while South Korea’s Kospi climbed 2.91%, moving alongside the S&P 500, which erased its 1.1% intraday loss to close up 0.11% on reports that senior Iranian diplomat Kazem Gharibabadi was drafting a protocol with Oman to oversee transit in the Strait of Hormuz.
Bitcoin was also recovering from recent lows near $65,000, but the bullish euphoria was short-lived as news of attacks saw the flagship crypto falling from an intraday high of $67,376 to $66,345 within hours after the Truth Social post.
If no deal is reached between the two nations, the flagship crypto risks falling below the $65,000 mark, which has been acting as a major support level over the past months.
Losing this level would likely confirm a bearish structural breakdown and could weigh heavily on the broader market.
Shreyas Iyer in trouble: PBKS captain fined, one step away from ban | Cricket News

Quordle hints and answers for Saturday, April 4 (game #1531)

Your star sign’s spring 2026 love life tarot horoscope reading


-

 NewsBeat1 day ago
Steven Gerrard disagrees with Gary Neville over ‘shock’ Chelsea and Arsenal claim | Football
-

 Business1 day ago
No Jackpot Winner and $194 Million Prize Rolls Over
-
Entertainment5 days ago
Fans slam 'heartbreaking' Barbie Dream Fest convention debacle with 'cardboard cutout' experience
-

 Fashion9 hours ago
Weekend Open Thread: Spanx – Corporette.com
-

 Crypto World2 days ago
Gold Price Prediction: Worst Month in 17 Years fo Save Haven Rock
-

 Tech5 days ago
The Pixel 10a doesn’t have a camera bump, and it’s great
-
 Entertainment6 days ago
Lana Del Rey Celebrates Her Husband’s 51st Birthday In New Post
-
Crypto World4 days ago
Dems press CFTC, ethics board on prediction-market insider trades
-

 Tech5 days ago
Avatar Legends: The Fighting Game comes out in July and it looks pretty slick
-

 Sports3 days ago
Tallest college basketball player ever, standing at 7-foot-9, entering transfer portal
-

 Tech4 days ago
EE TV is using AI to help you find something to watch
-

 Fashion6 days ago
Amazon Sundays: Soft Spring Layers
-

 Business2 days ago
Login and Checkout Issues Spark Merchant Frustration
-

 Tech6 days ago
Elon Musk’s last co-founder reportedly leaves xAI
-

 Tech4 days ago
How to back up your iPhone & iPad to your Mac before something goes wrong
-

 Tech4 days ago
Apple will hide your email address from apps and websites, but not cops
-

 Politics4 days ago
Should Trump Be Scared Strait?
-

 Crypto World4 days ago
U.S. rule change may open trillions in 401(k) funds to crypto
-

 Tech4 days ago
Flipsnack and the shift toward motion-first business content with living visuals
-

 Fashion5 days ago
The Best Spring Trends of 2026
You must be logged in to post a comment Login