Crypto World
85% Rally Possible Despite Criticism

The ASTER price has fallen nearly 70% from its post-launch highs, reflecting fading hype and rising criticism. User activity and trading volume seem to have collapsed even faster, raising doubts about its recovery.
Yet beneath this weakness, technical patterns and whale accumulation show a different picture. These signals suggest Aster may still attempt a major breakout despite the sharp decline in participation.
Aster User Activity and Trading Volume Collapse After Post-Launch Frenzy
ASTER (formerly Astherus) has seen a dramatic collapse in user participation since its September 2025 token launch.
Daily active addresses interacting with the Astherus Vault on BNB Chain peaked at 29,062 on September 24. As of February 19, that number has fallen to just 146. This represents a 99.5% drop in daily active users.

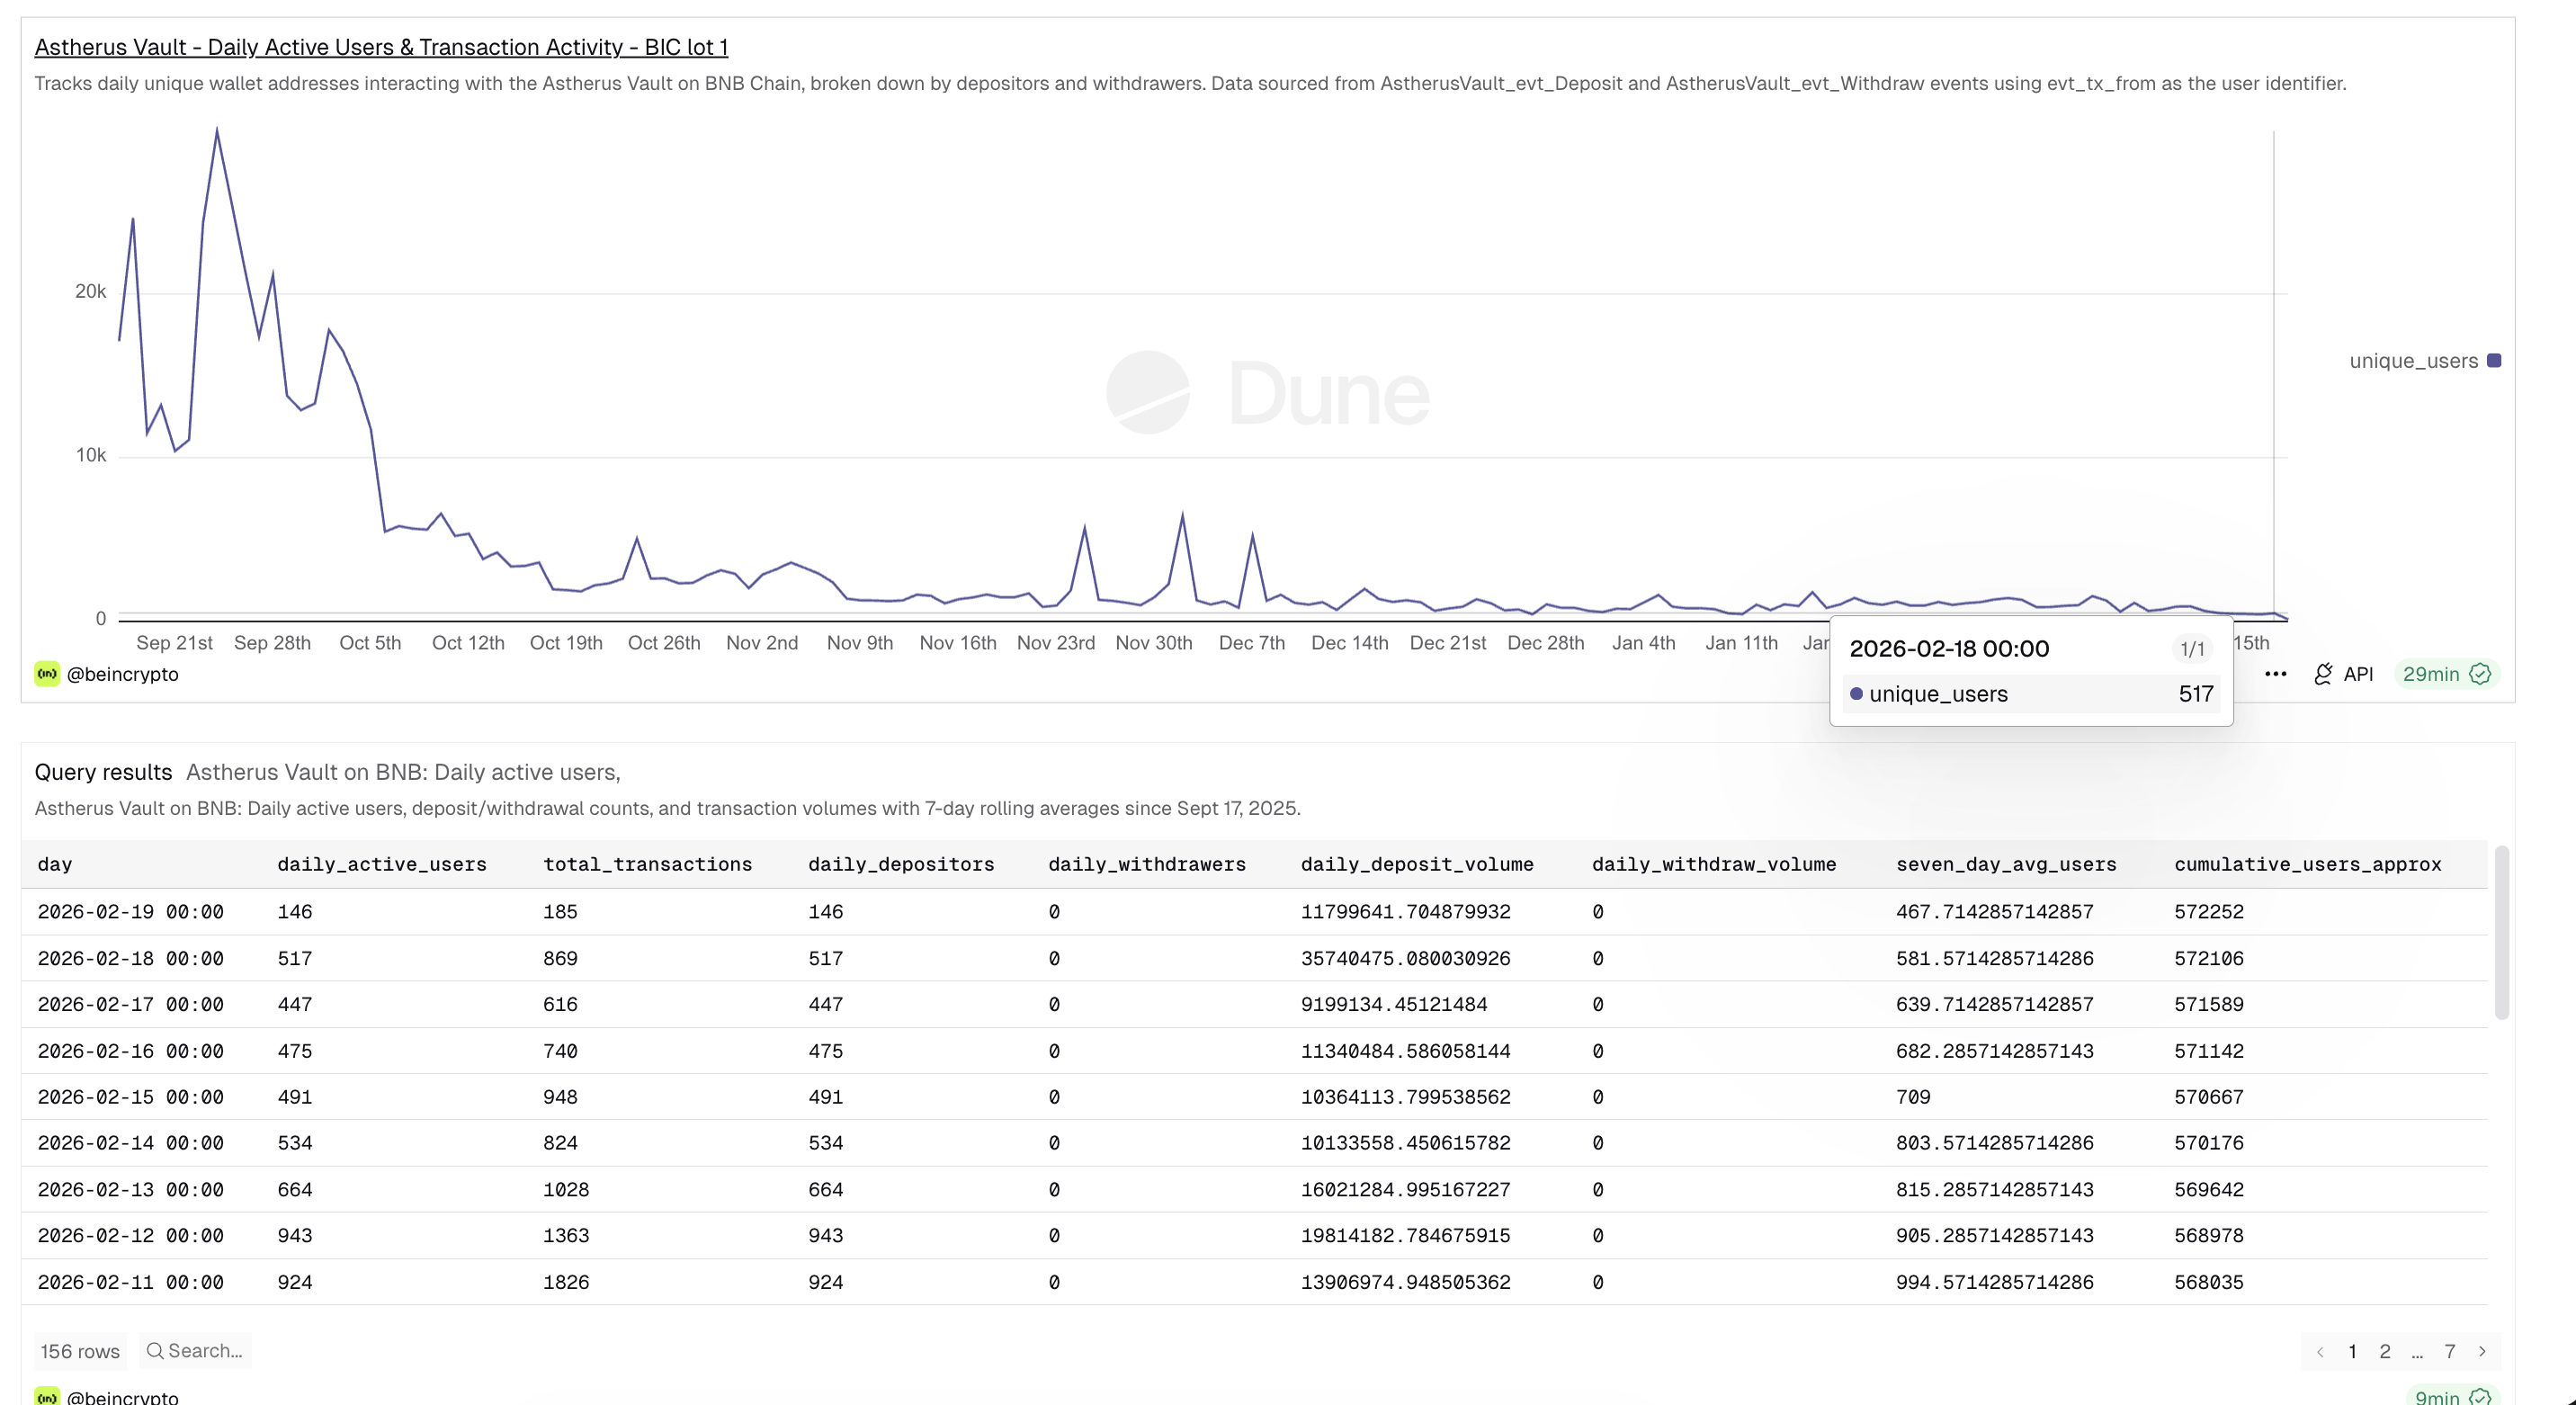
Disclaimer: These figures reflect Astherus Vault deposit and withdrawal activity on BNB Chain specifically. Aster operates across BNB Chain, Ethereum, Solana, and Arbitrum, and total platform-wide trader activity — including perpetual and spot trading — is likely significantly higher than vault-only metrics suggest.
Trading activity has followed the same trend. Daily decentralized exchange volume on BNB Chain, per data pulled via Dune, has declined from a peak of $327.75 million to just $17.31 million.

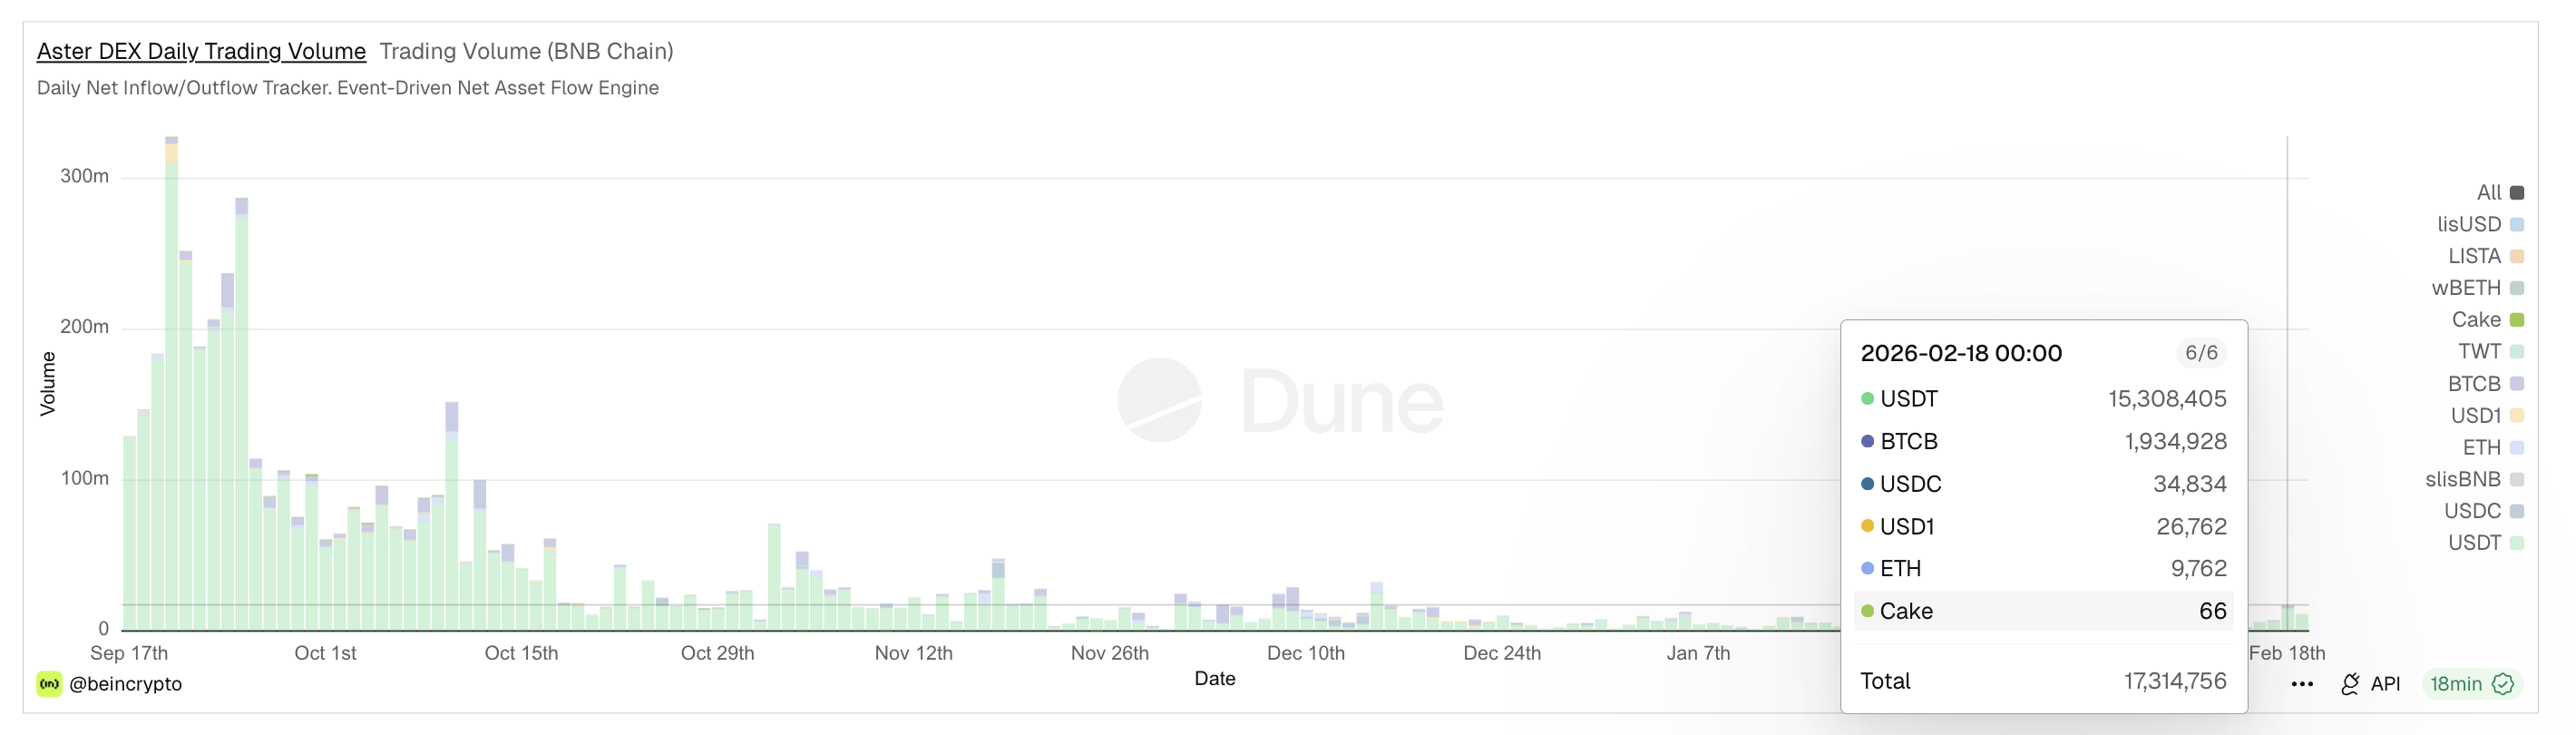
This marks a 94.7% drop in trading volume. On-chain trading volume reflects real buying and selling happening on the blockchain. When it falls sharply, it shows reduced participation and weaker demand.
This collapse aligns with Aster’s price decline. The token is down about 70% from its $2.41 high reached shortly after launch. The drop reflects the end of a possible hype-driven phase.
However, the full picture is more complex. Cumulative unique addresses interacting with the protocol have continued rising, reaching 572,252. This shows new users are still entering the ecosystem, even as daily activity declines.
More importantly, the remaining users are committing large capital. On February 19, total deposits reached $11.8 million from just 146 wallets. This equals an average of about $80,000 per wallet. This shows that while retail participation has dropped, high-value investors remain active.
Additionally, daily withdrawals from the vault have remained at zero consistently since the TGE, indicating that while fewer users are depositing new capital, existing capital is not exiting the system.
Bullish Divergence and EMA Setup Show Early Reversal Signs
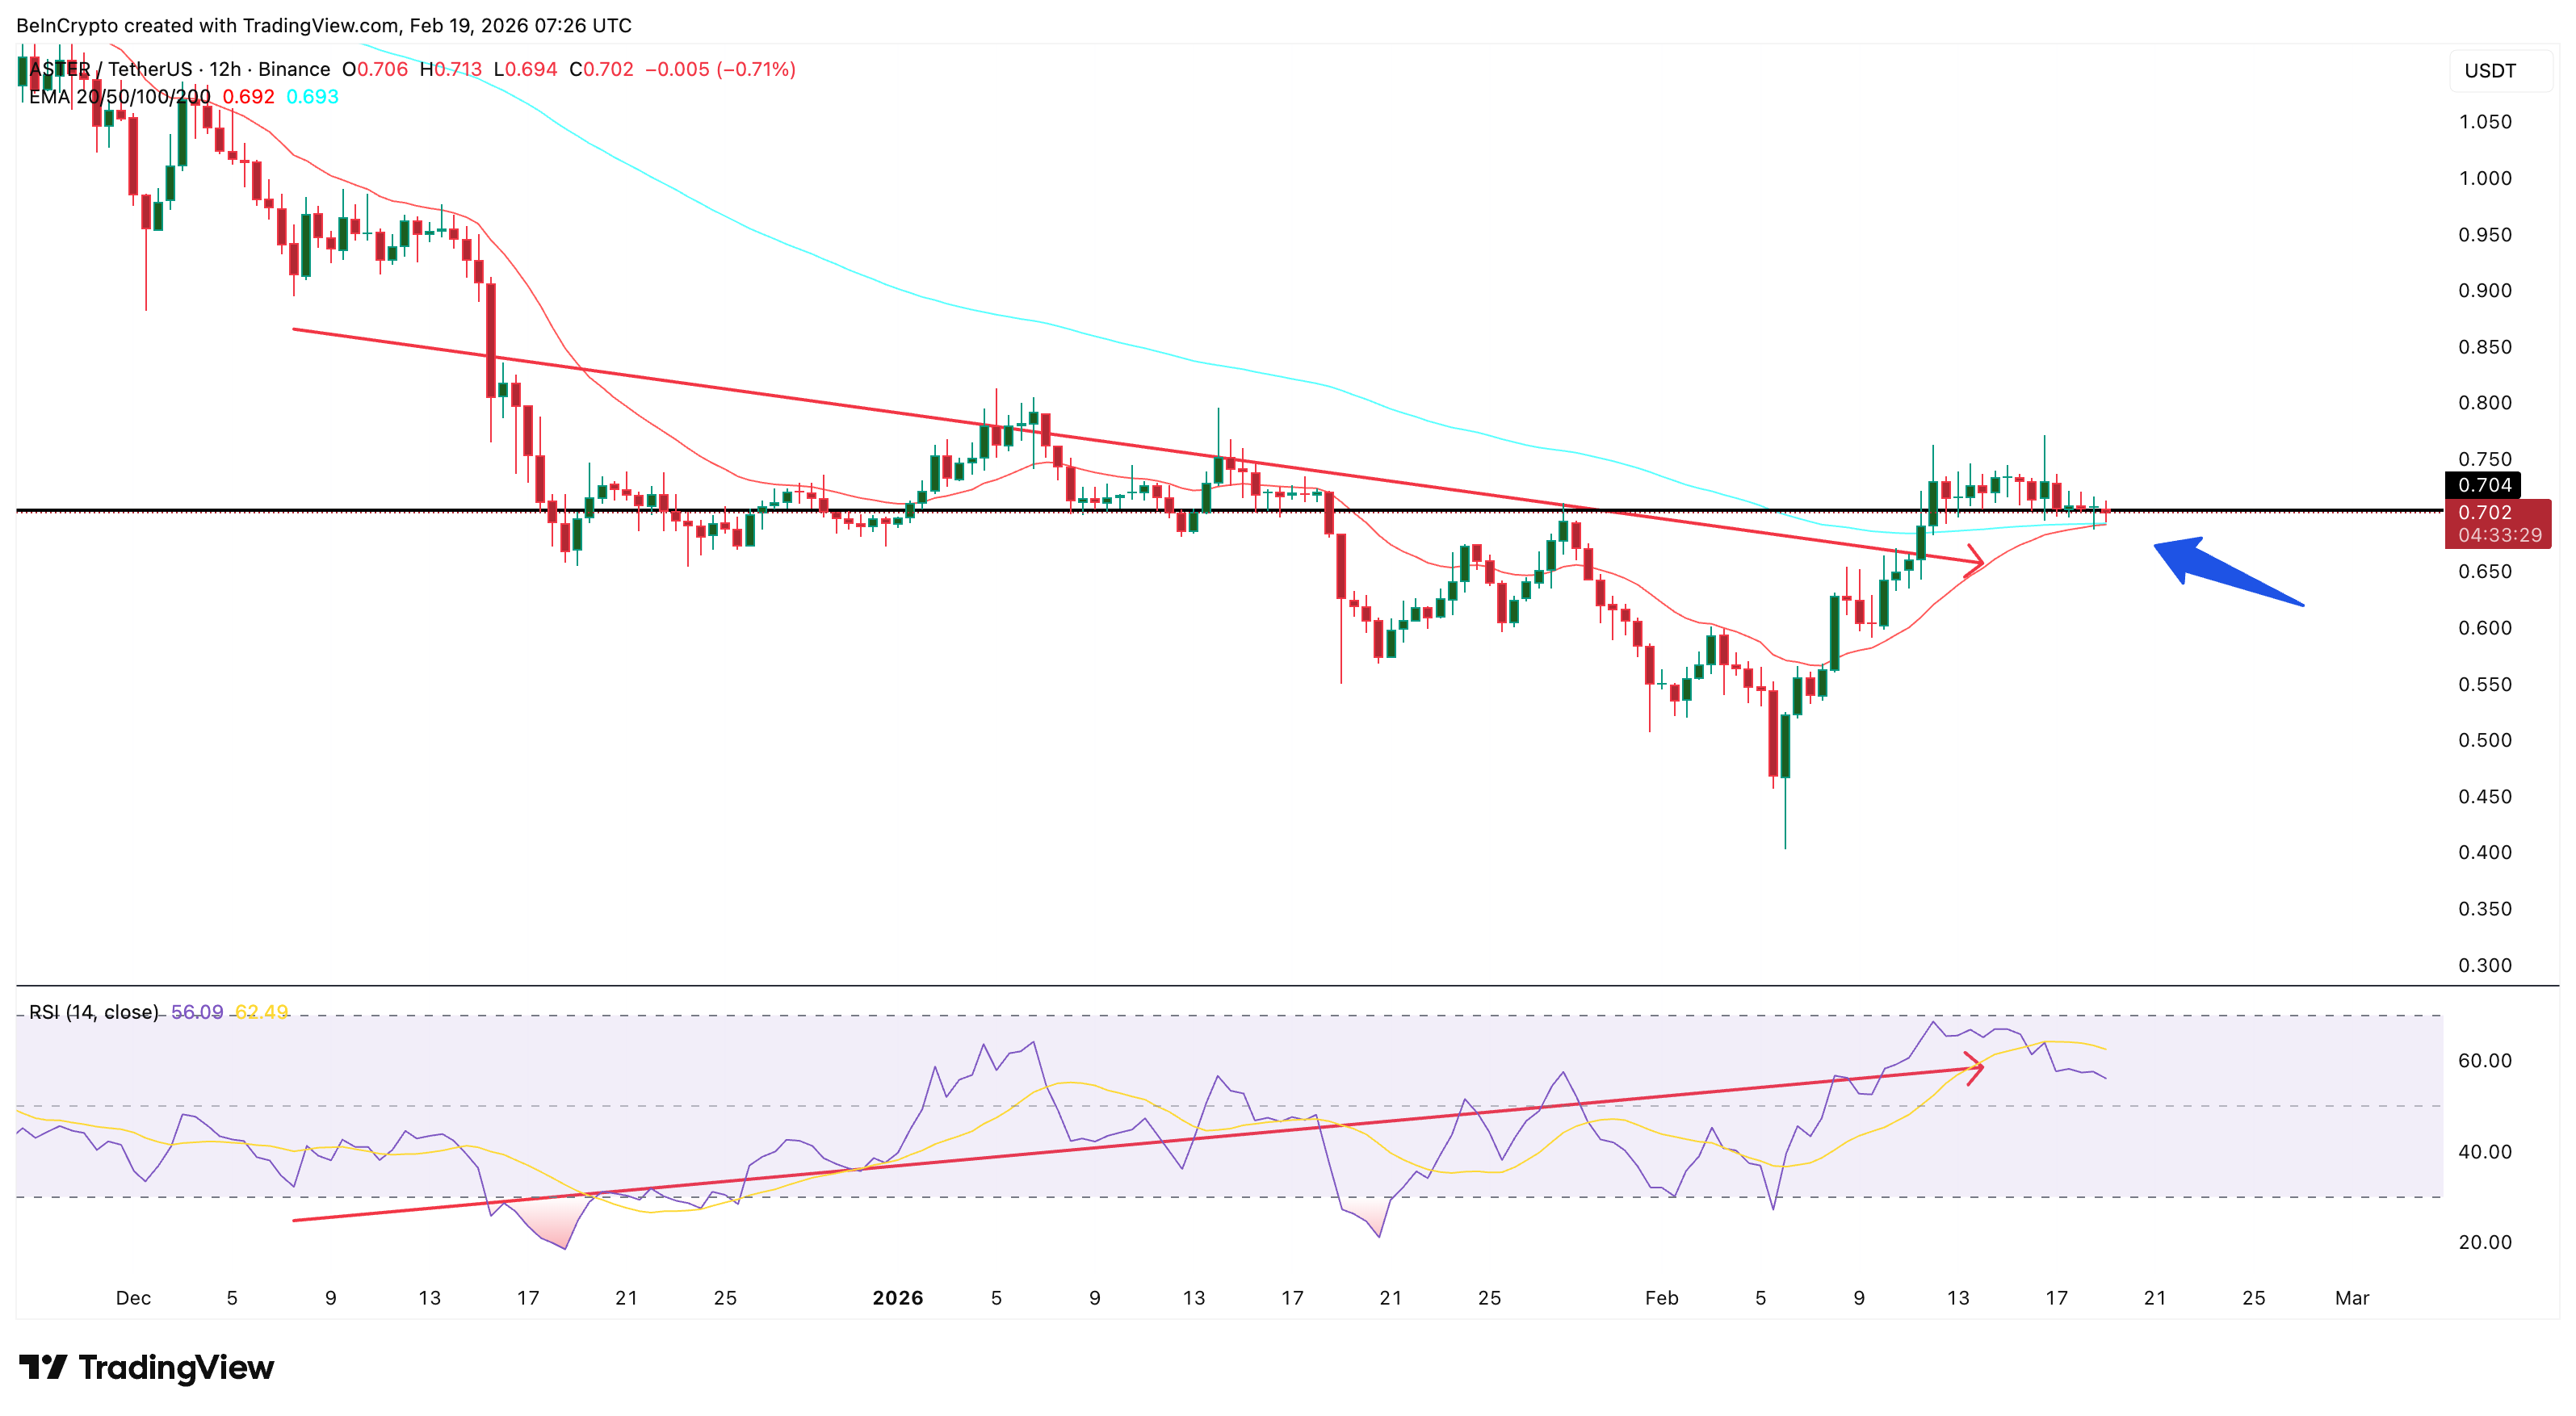
Despite the fundamental weakness, technical indicators show early signs of recovery. On the 12-hour chart, ASTER has formed a bullish divergence between December 7 and February 14. During this period, the price made a lower low. But the Relative Strength Index, or RSI, made a higher low.
RSI measures buying and selling strength on a scale from 0 to 100. When the price falls while the RSI rises, it indicates that selling pressure is weakening. This pattern often appears before a price recovery begins. Aster has not yet fully responded to this signal. This suggests the bullish pressure may still be building.
At the same time, the 20-period exponential moving average, or EMA, is approaching a bullish crossover above the 100-period EMA. EMA tracks the average price over time, giving more weight to recent prices. When shorter EMAs cross above longer ones, it signals strengthening momentum and a possible trend reversal.

The price is also forming an inverse head-and-shoulders pattern.
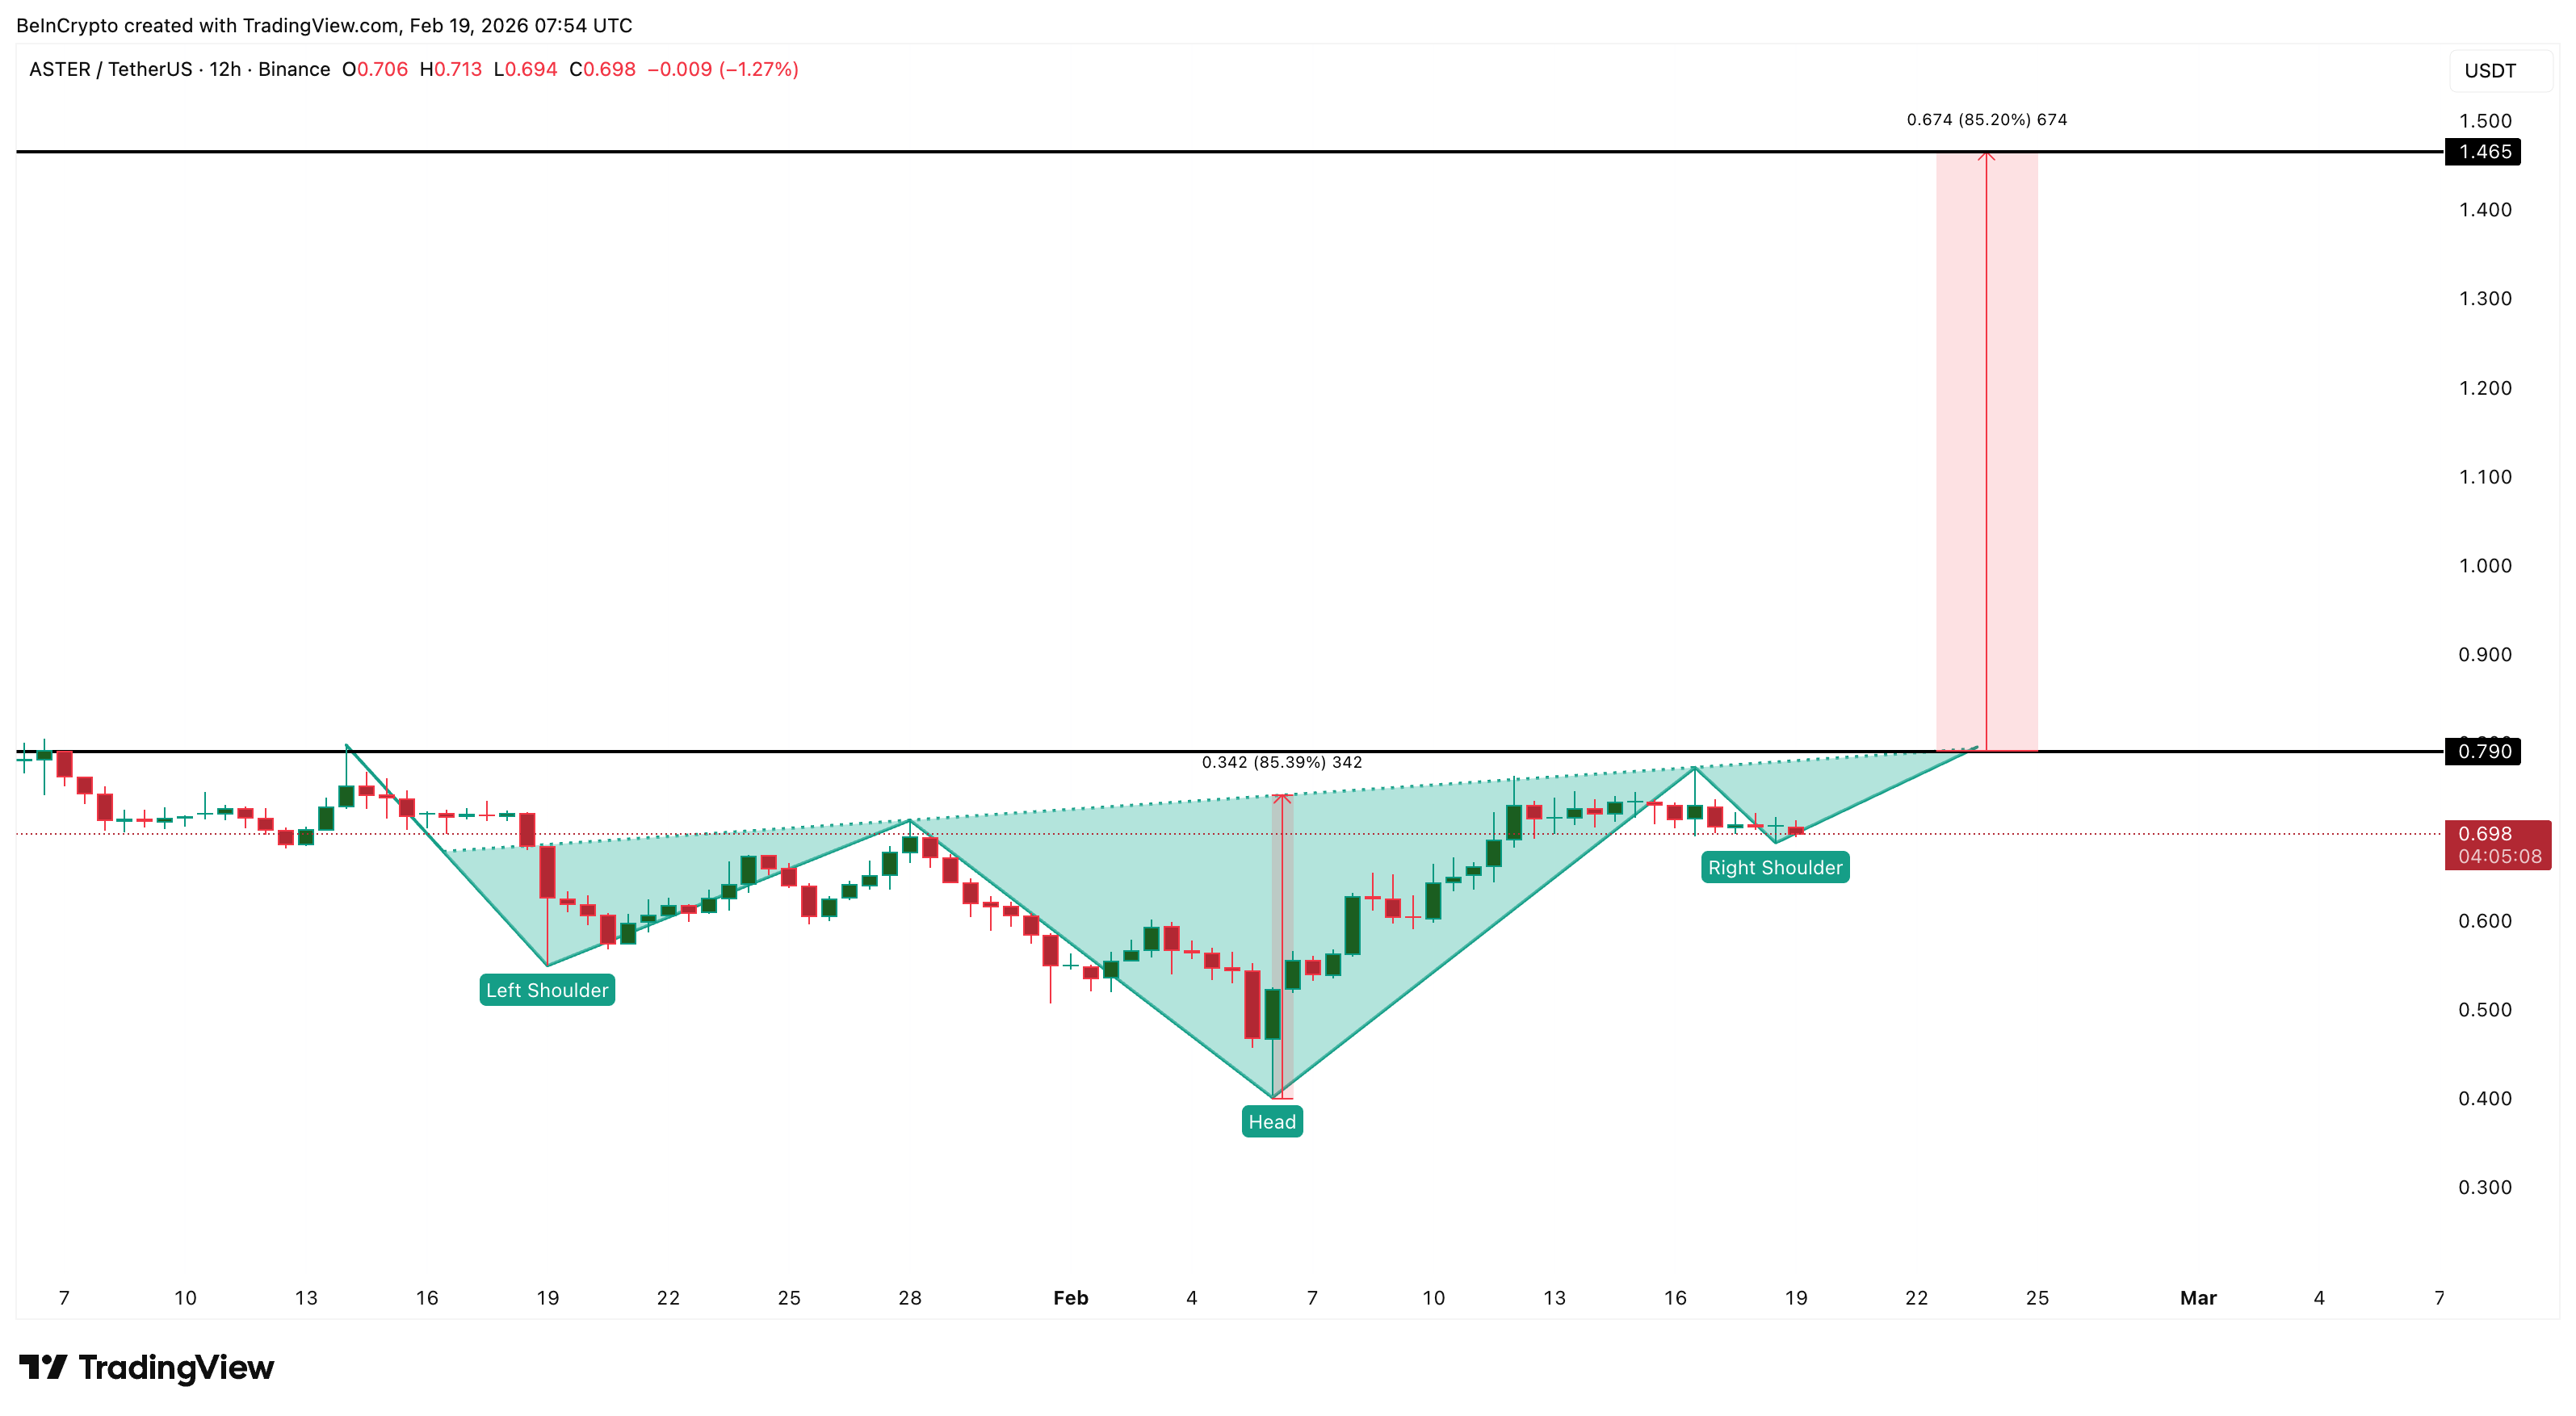
This is a bullish reversal structure showing buyers slowly gaining control. The neckline of this pattern sits near $0.79. A breakout above this level would confirm the recovery.
Whale Accumulation and Sentiment Collapse Create Opposing Forces
Large investors continue accumulating ASTER despite weak public sentiment. Wallets holding between 100 million and 1 billion ASTER have increased their holdings from 2.75 billion to 2.96 billion ASTER since early February. This steady increase shows strong confidence from the largest holders.
Mid-sized whales holding between 1 million and 10 million ASTER have also increased their holdings from 262.48 million to 278.96 million ASTER.

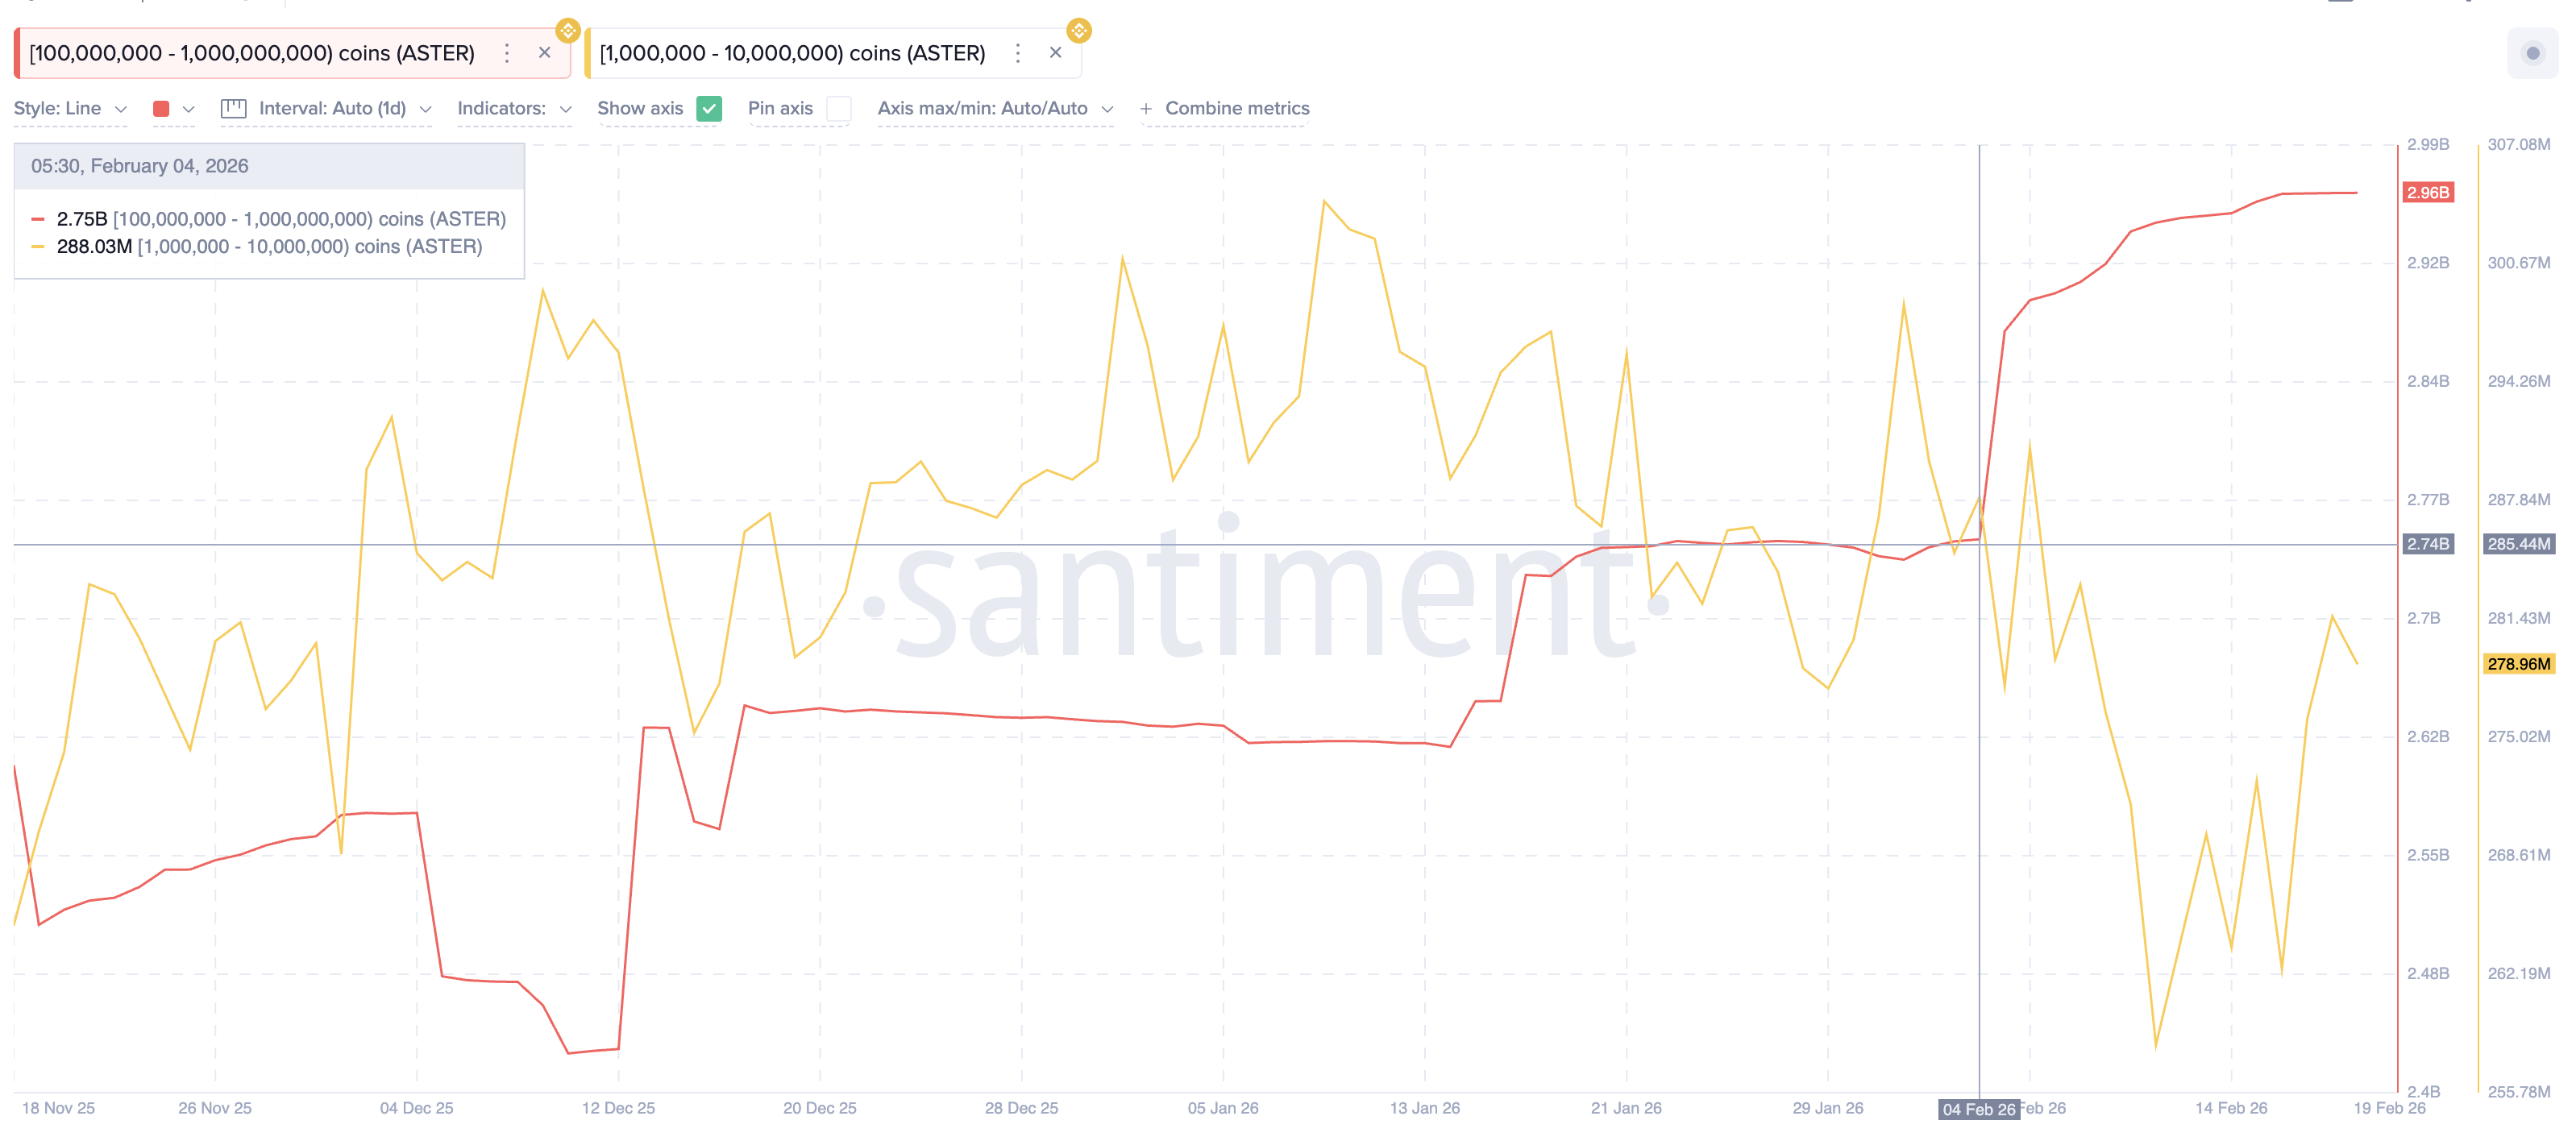
However, some of these smaller whales have recently started reducing positions slightly. This decline appears to be linked to the recent collapse in positive sentiment.
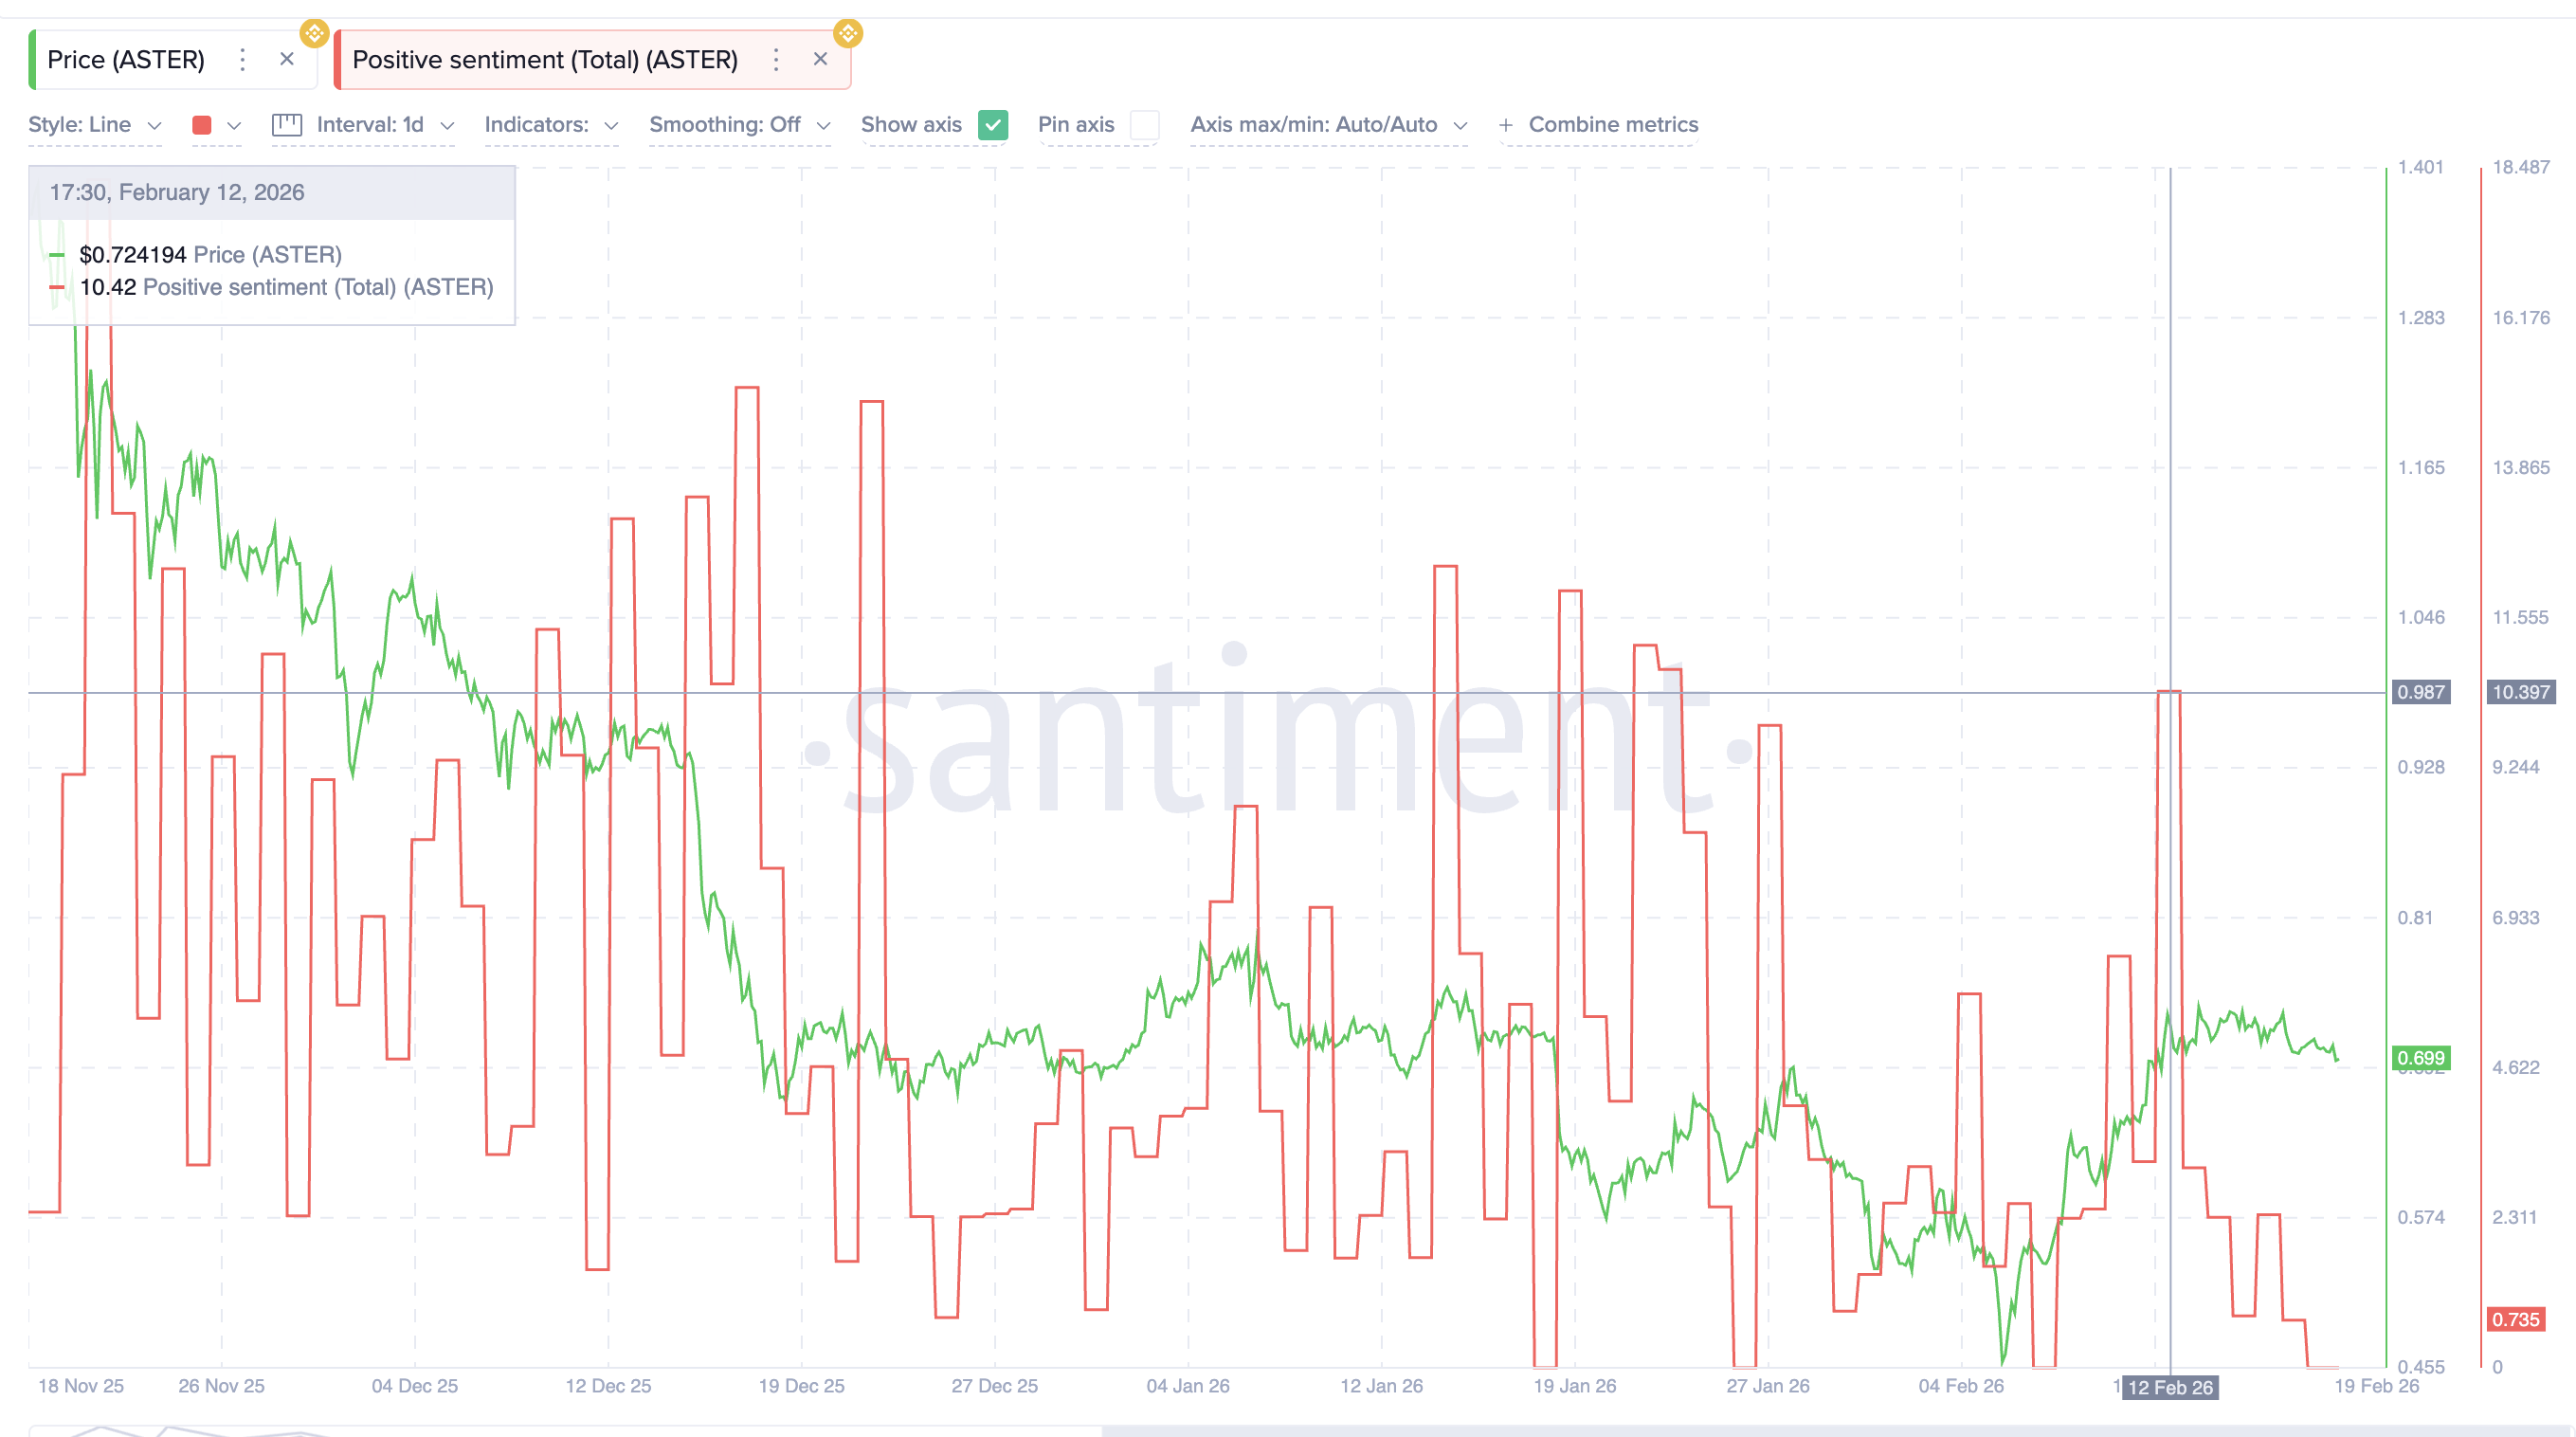
Market sentiment has dropped sharply. Positive sentiment scores fell from 10.39 on February 12 to near zero recently.

Want more token insights like this? Sign up for Editor Harsh Notariya’s Daily Crypto Newsletter here.
This reflects rising criticism and negative perception around Aster’s declining activity, which, based on available data, appears somewhat exaggerated but not entirely unfounded.
This creates a conflict in the market. Large whales continue accumulating, showing long-term confidence. But smaller investors are becoming more cautious as sentiment weakens. This divergence between whale behavior and public sentiment often appears near major turning points.
ASTER Price Levels That Could Trigger an 85% Breakout
The ASTER price now sits near a critical technical level. The neckline of the inverse head-and-shoulders pattern is located at $0.79. A breakout above this level would confirm the bullish reversal. If this breakout happens, the next resistance levels appear at $0.92, $1.06, and $1.29. The full breakout target sits near $1.46. This would represent an 85% rally from current levels.
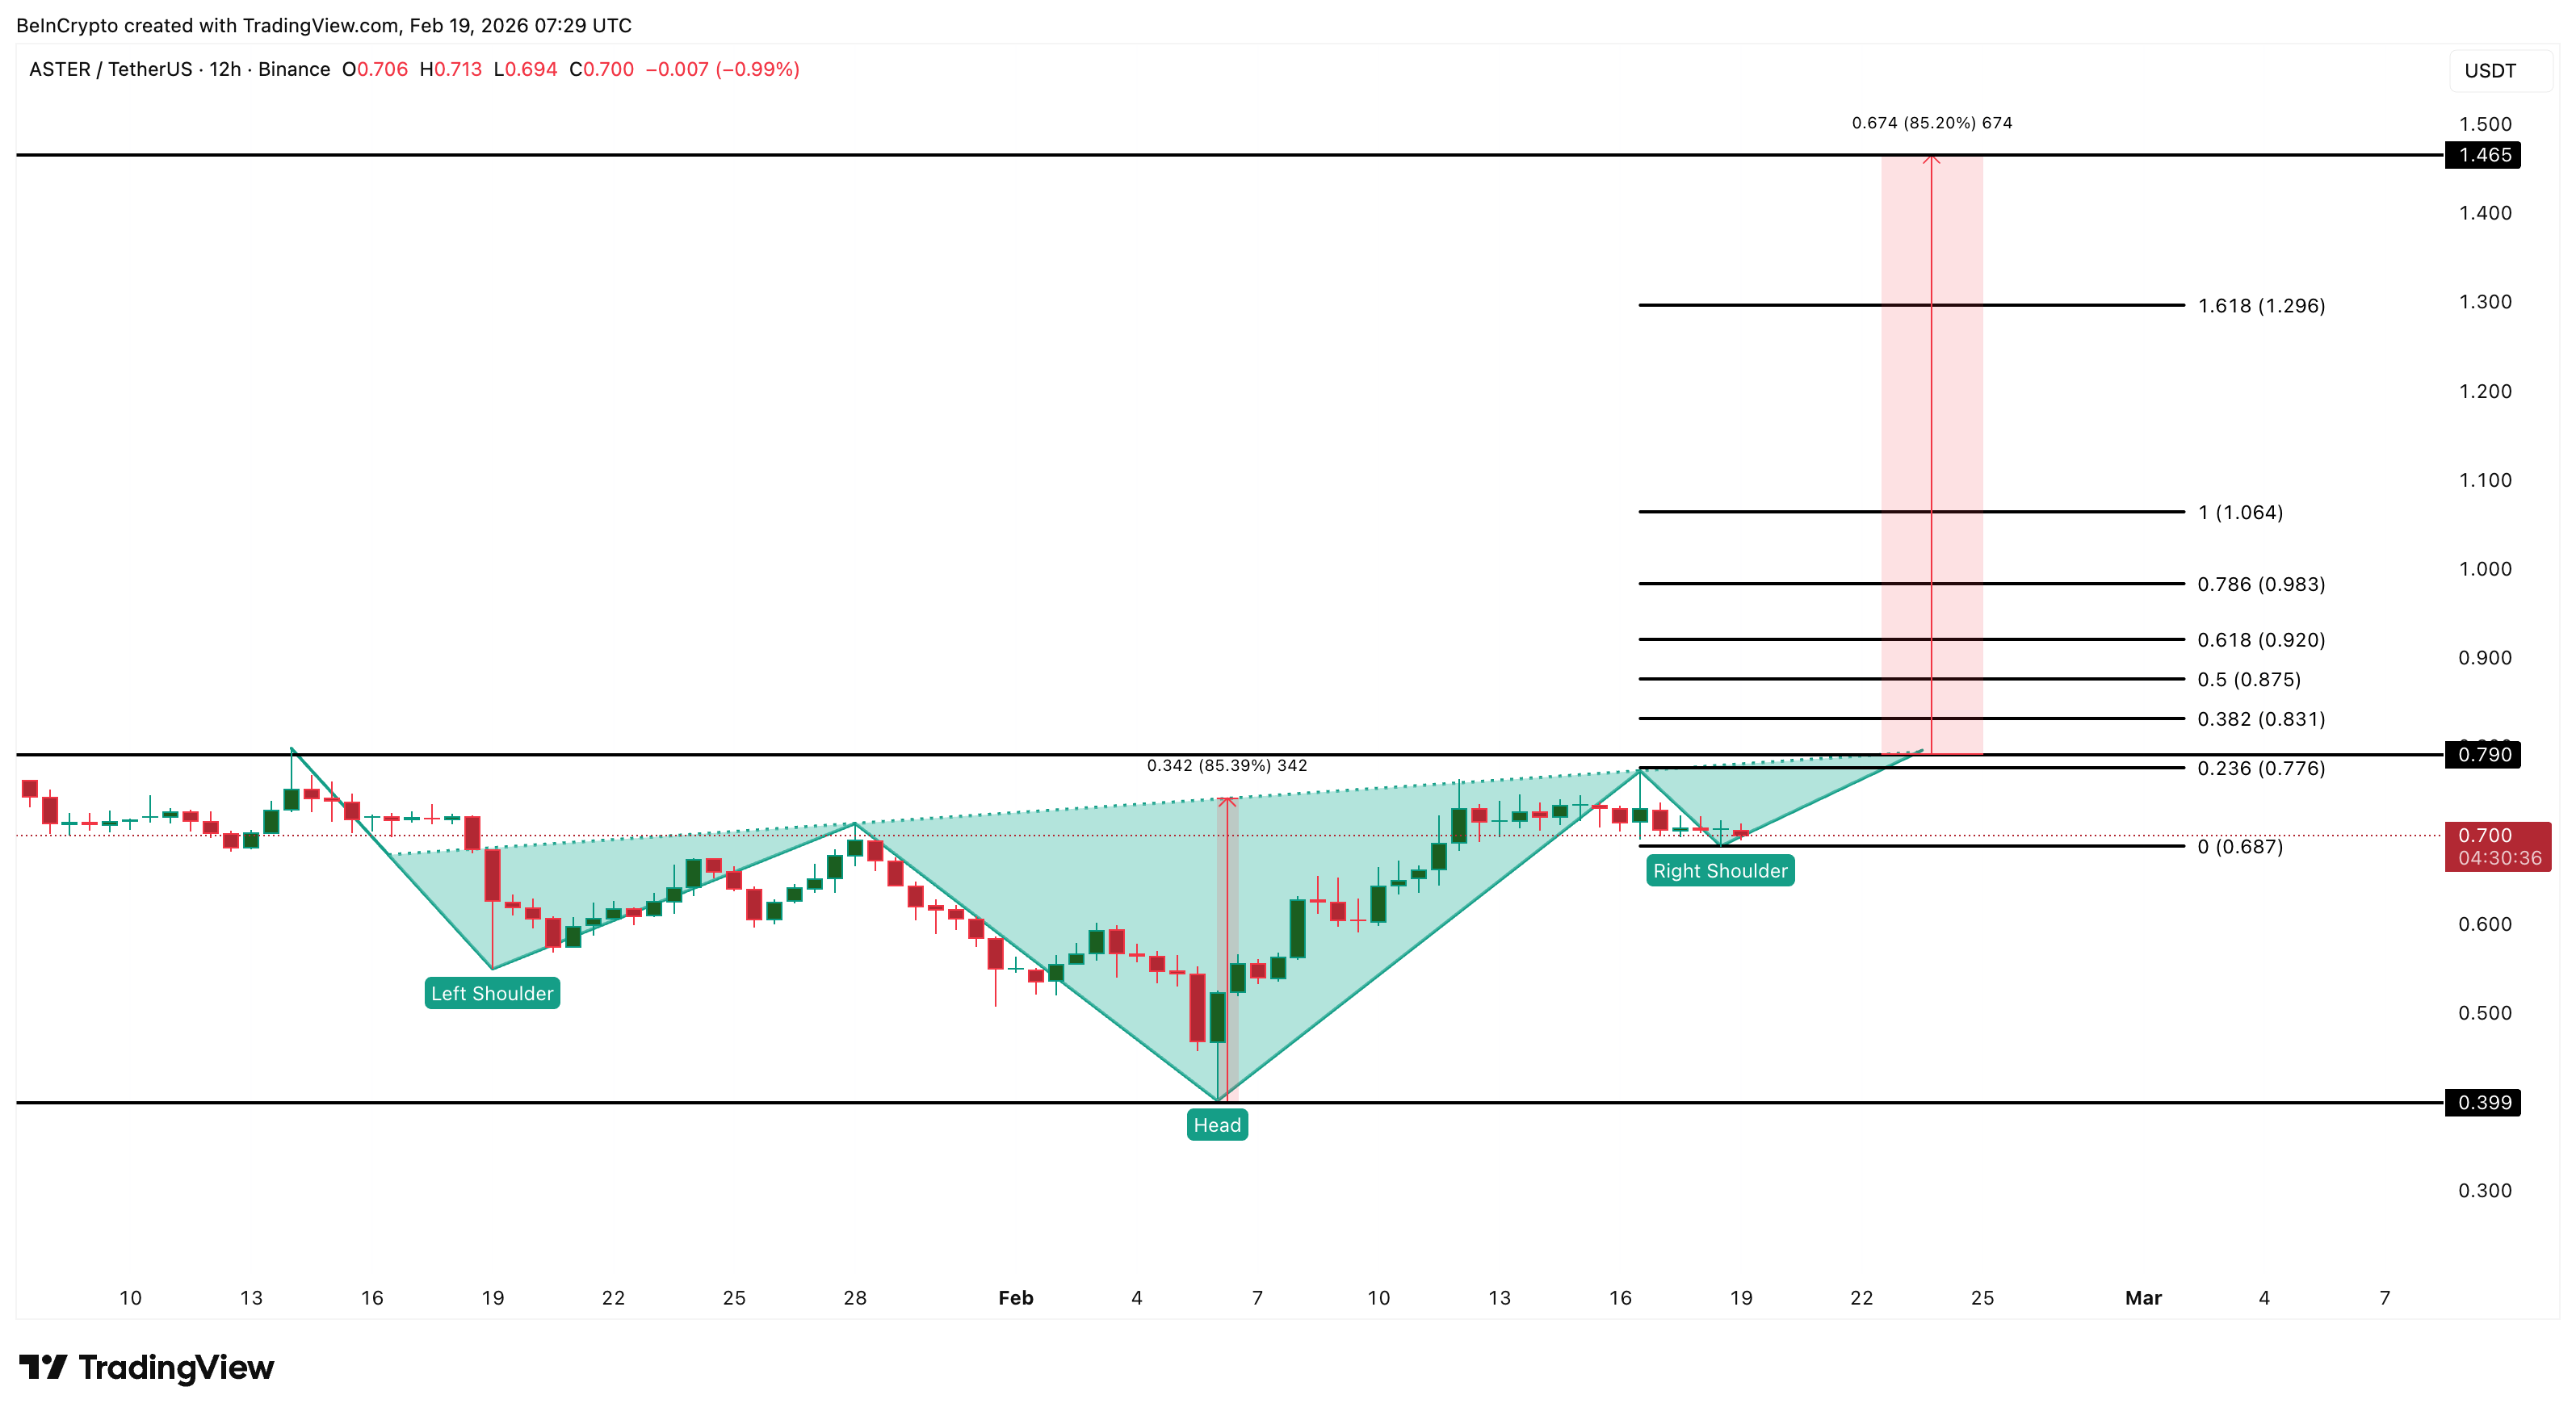
However, downside risks still exist. If Aster falls below $0.68, the bullish setup would weaken. A deeper drop below $0.39 would invalidate the pattern completely and confirm continued bearish pressure.
For now, Aster remains at a turning point. User activity and sentiment have collapsed sharply. But whale accumulation, bullish divergence, and reversal patterns suggest recovery remains possible. The next move above $0.79 or below $0.39 will likely decide Aster’s long-term direction.