
Crypto World
$887 Million Inflows Raise Red Flags
Ethereum has extended its recent decline, slipping toward the $2,000 level. At first glance, the pullback appears to be stabilizing. However, on-chain data suggests the weakness may not be over.
While ETH is hovering near a key level, underlying metrics reveal persistent stress; there is a chance that this cycle mirrors prior downturn patterns.
Sponsored
Sponsored
Ethereum Can Repeat History
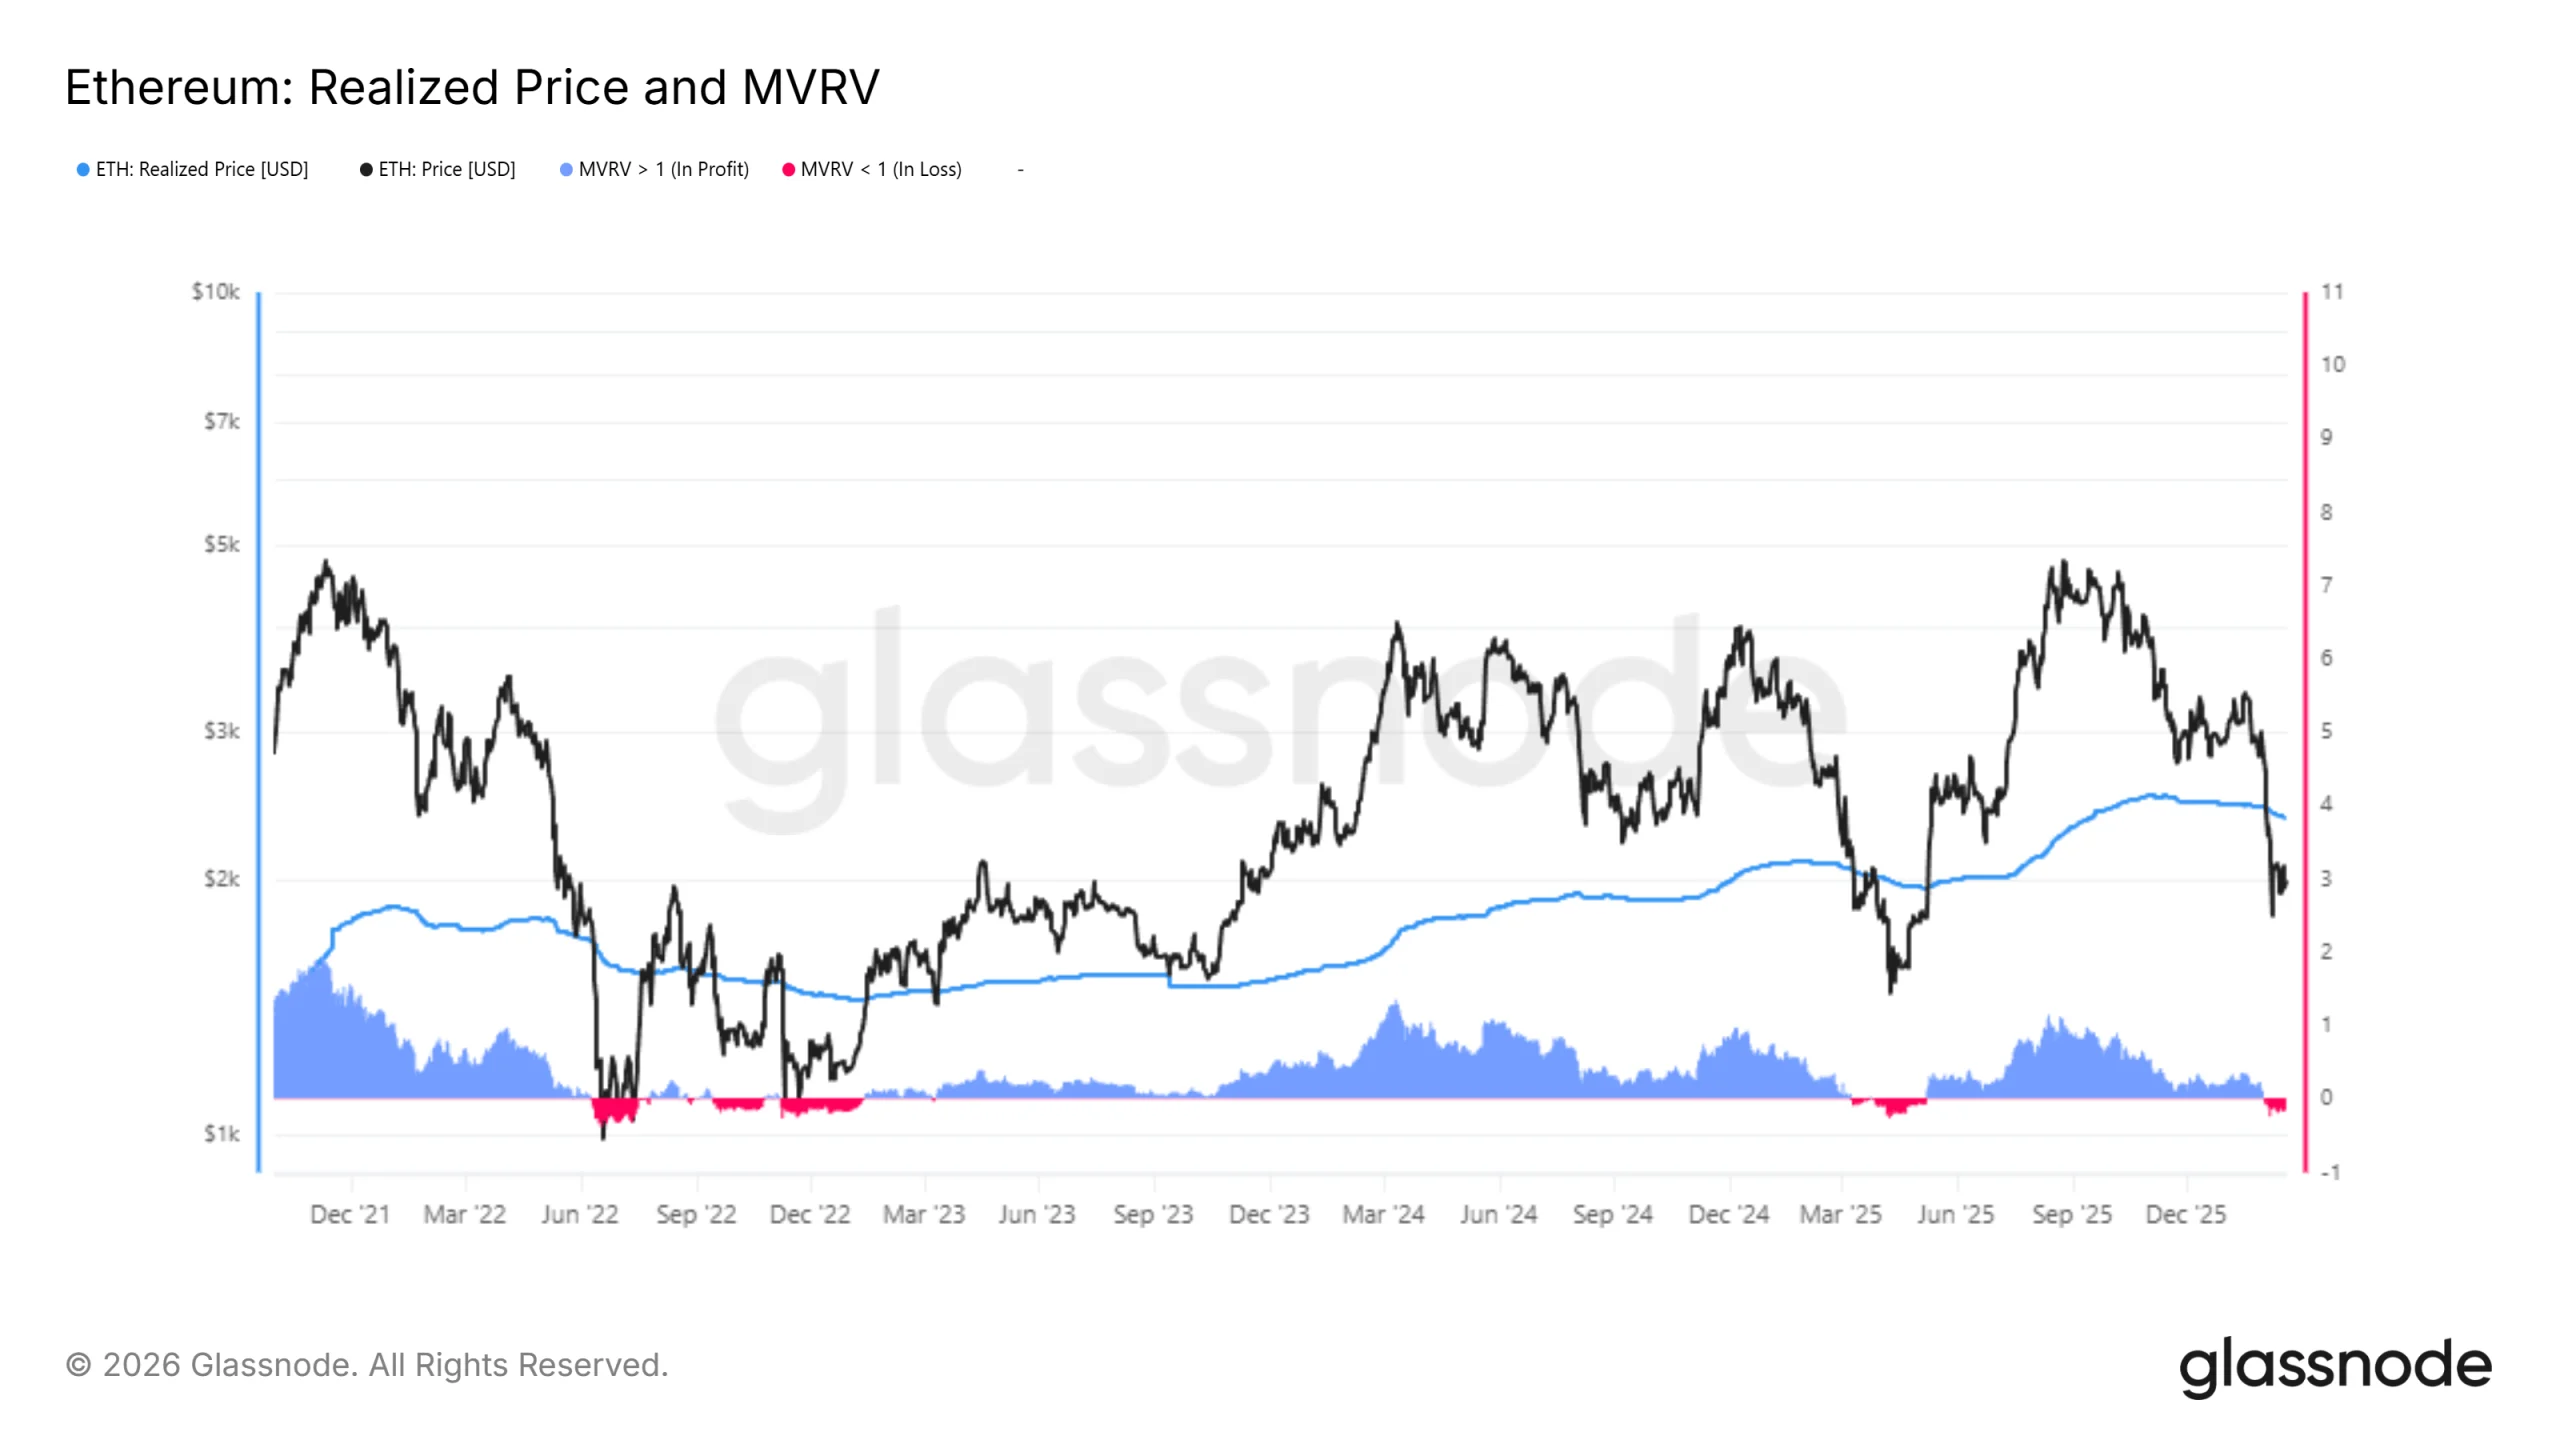
Ethereum fell below its Realized Price toward the end of January. Since then, ETH has remained trapped under this crucial on-chain benchmark. The Realized Price reflects the average acquisition cost of all coins in circulation. Trading below it often signals widespread unrealized losses.
The Market Value to Realized Value, or MVRV, ratio confirms this pressure. ETH’s MVRV has remained below 1.0, indicating that the average holder is at a loss. Extended periods in this zone historically coincide with deep market corrections.
Want more token insights like this? Sign up for Editor Harsh Notariya’s Daily Crypto Newsletter here.
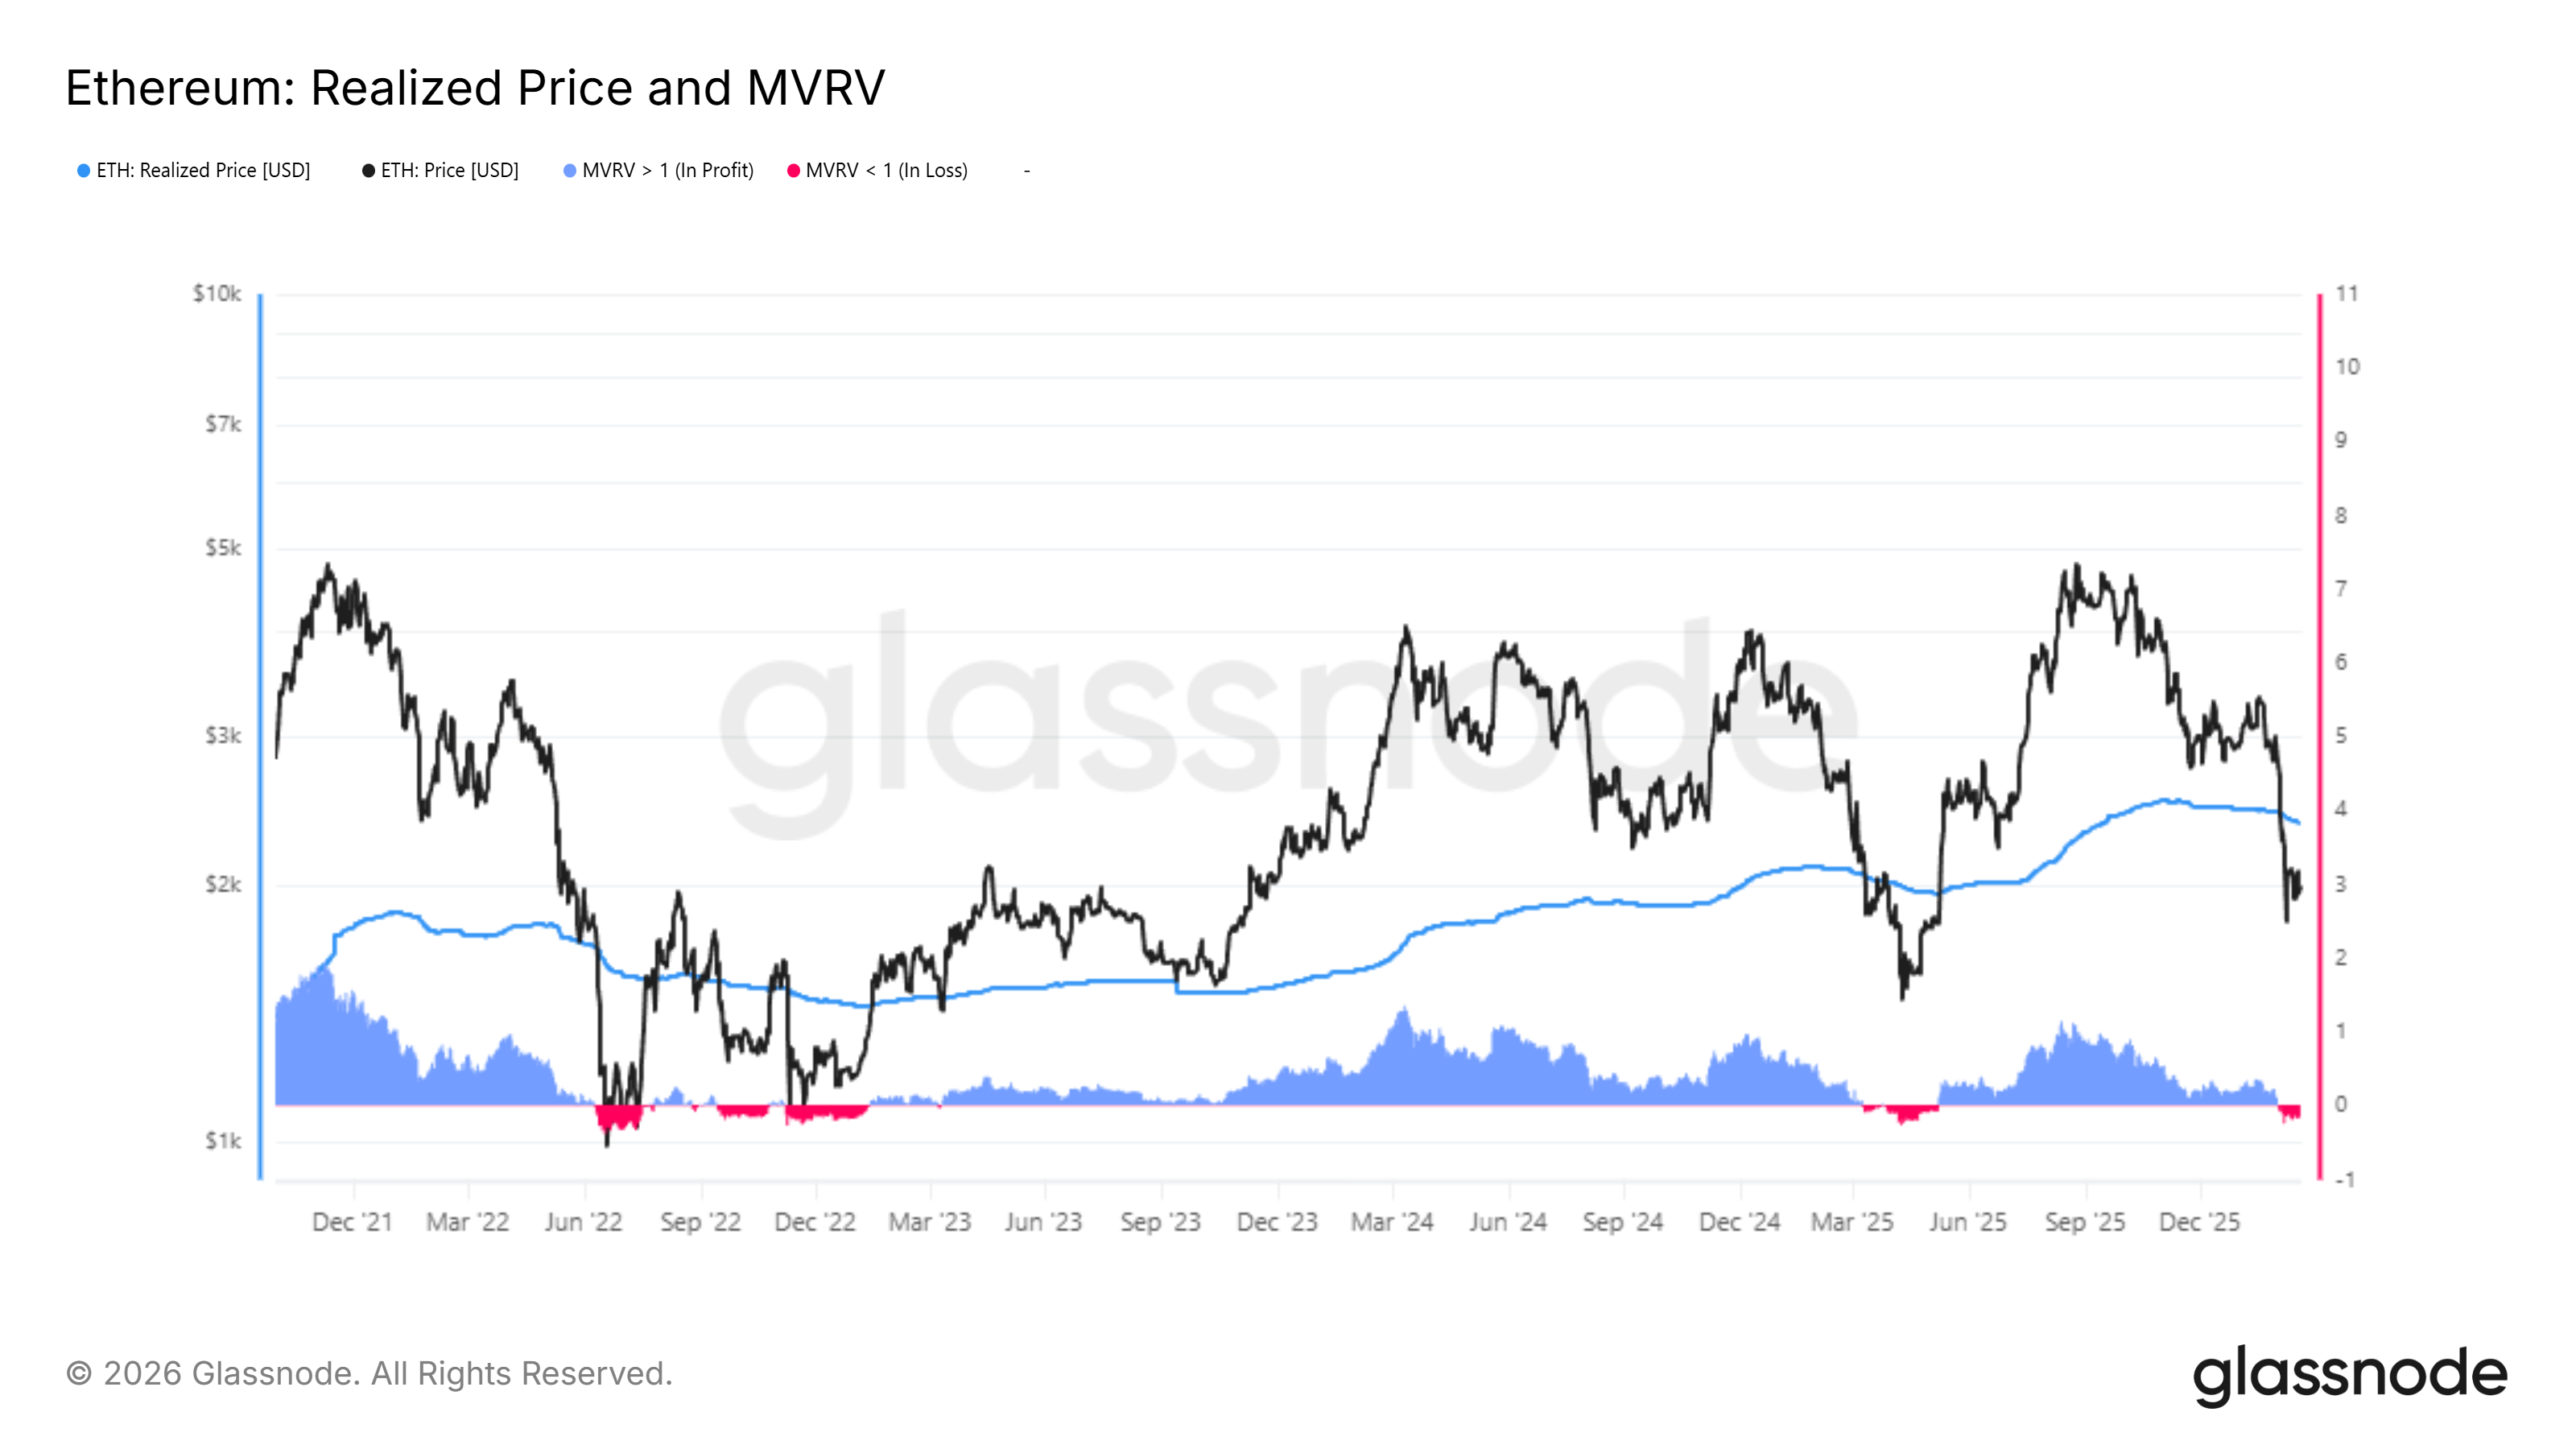
Past cycles show that recovery eventually follows prolonged sub-Realized Price trading. However, such recoveries often occur after capitulation phases. In prior bear markets, ETH experienced additional downside before forming durable bottoms. Current conditions suggest that further decline could precede stabilization.
ETH Selling Is Active
Exchange On-Balance data reveals an increasing supply moving onto trading platforms. Over the past week, approximately 445,000 ETH entered exchanges. At current prices, this represents more than $887 million in potential sell pressure.
Sponsored
Sponsored
Rising exchange balances typically indicate distribution. ETH Investors often transfer assets to exchanges with the intention of selling. The scale of recent inflows suggests heightened caution among holders.
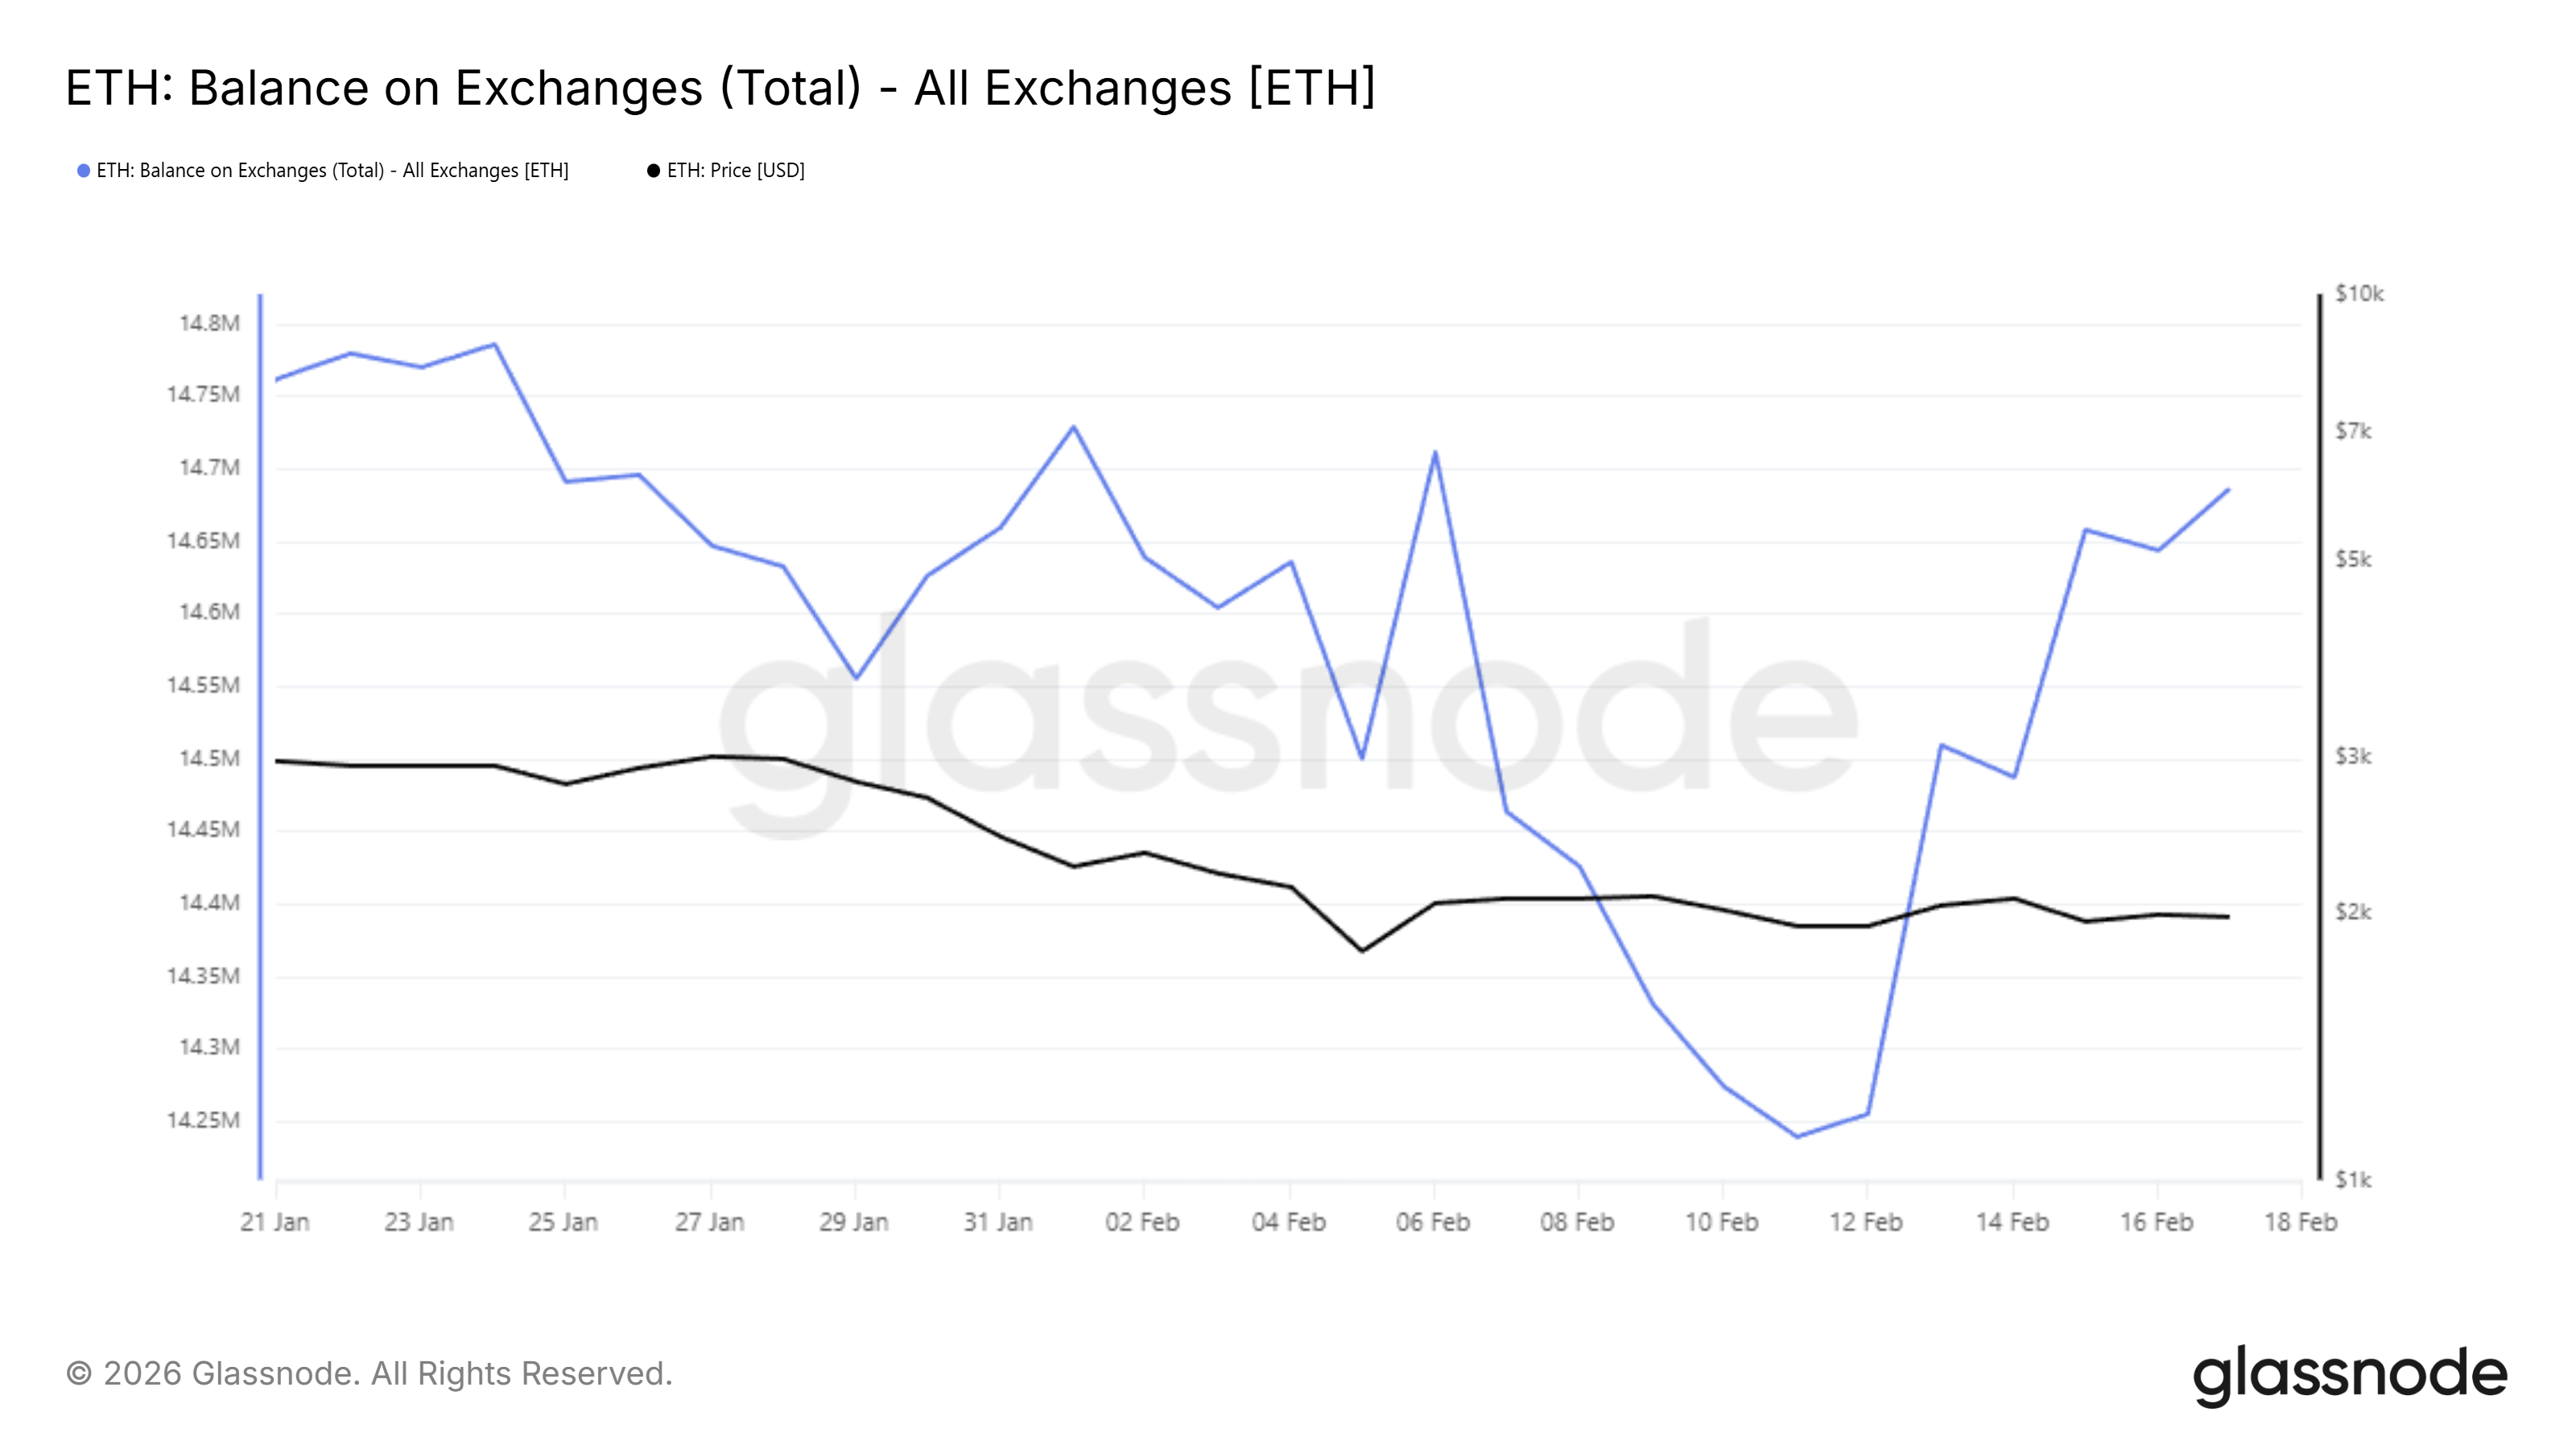
If the price fails to rebound quickly, panic selling could intensify. Similar spikes in exchange deposits have historically preceded sharp drawdowns. The combination of unrealized losses and rising supply increases downside vulnerability.
ETH Price May Witness Further Decline
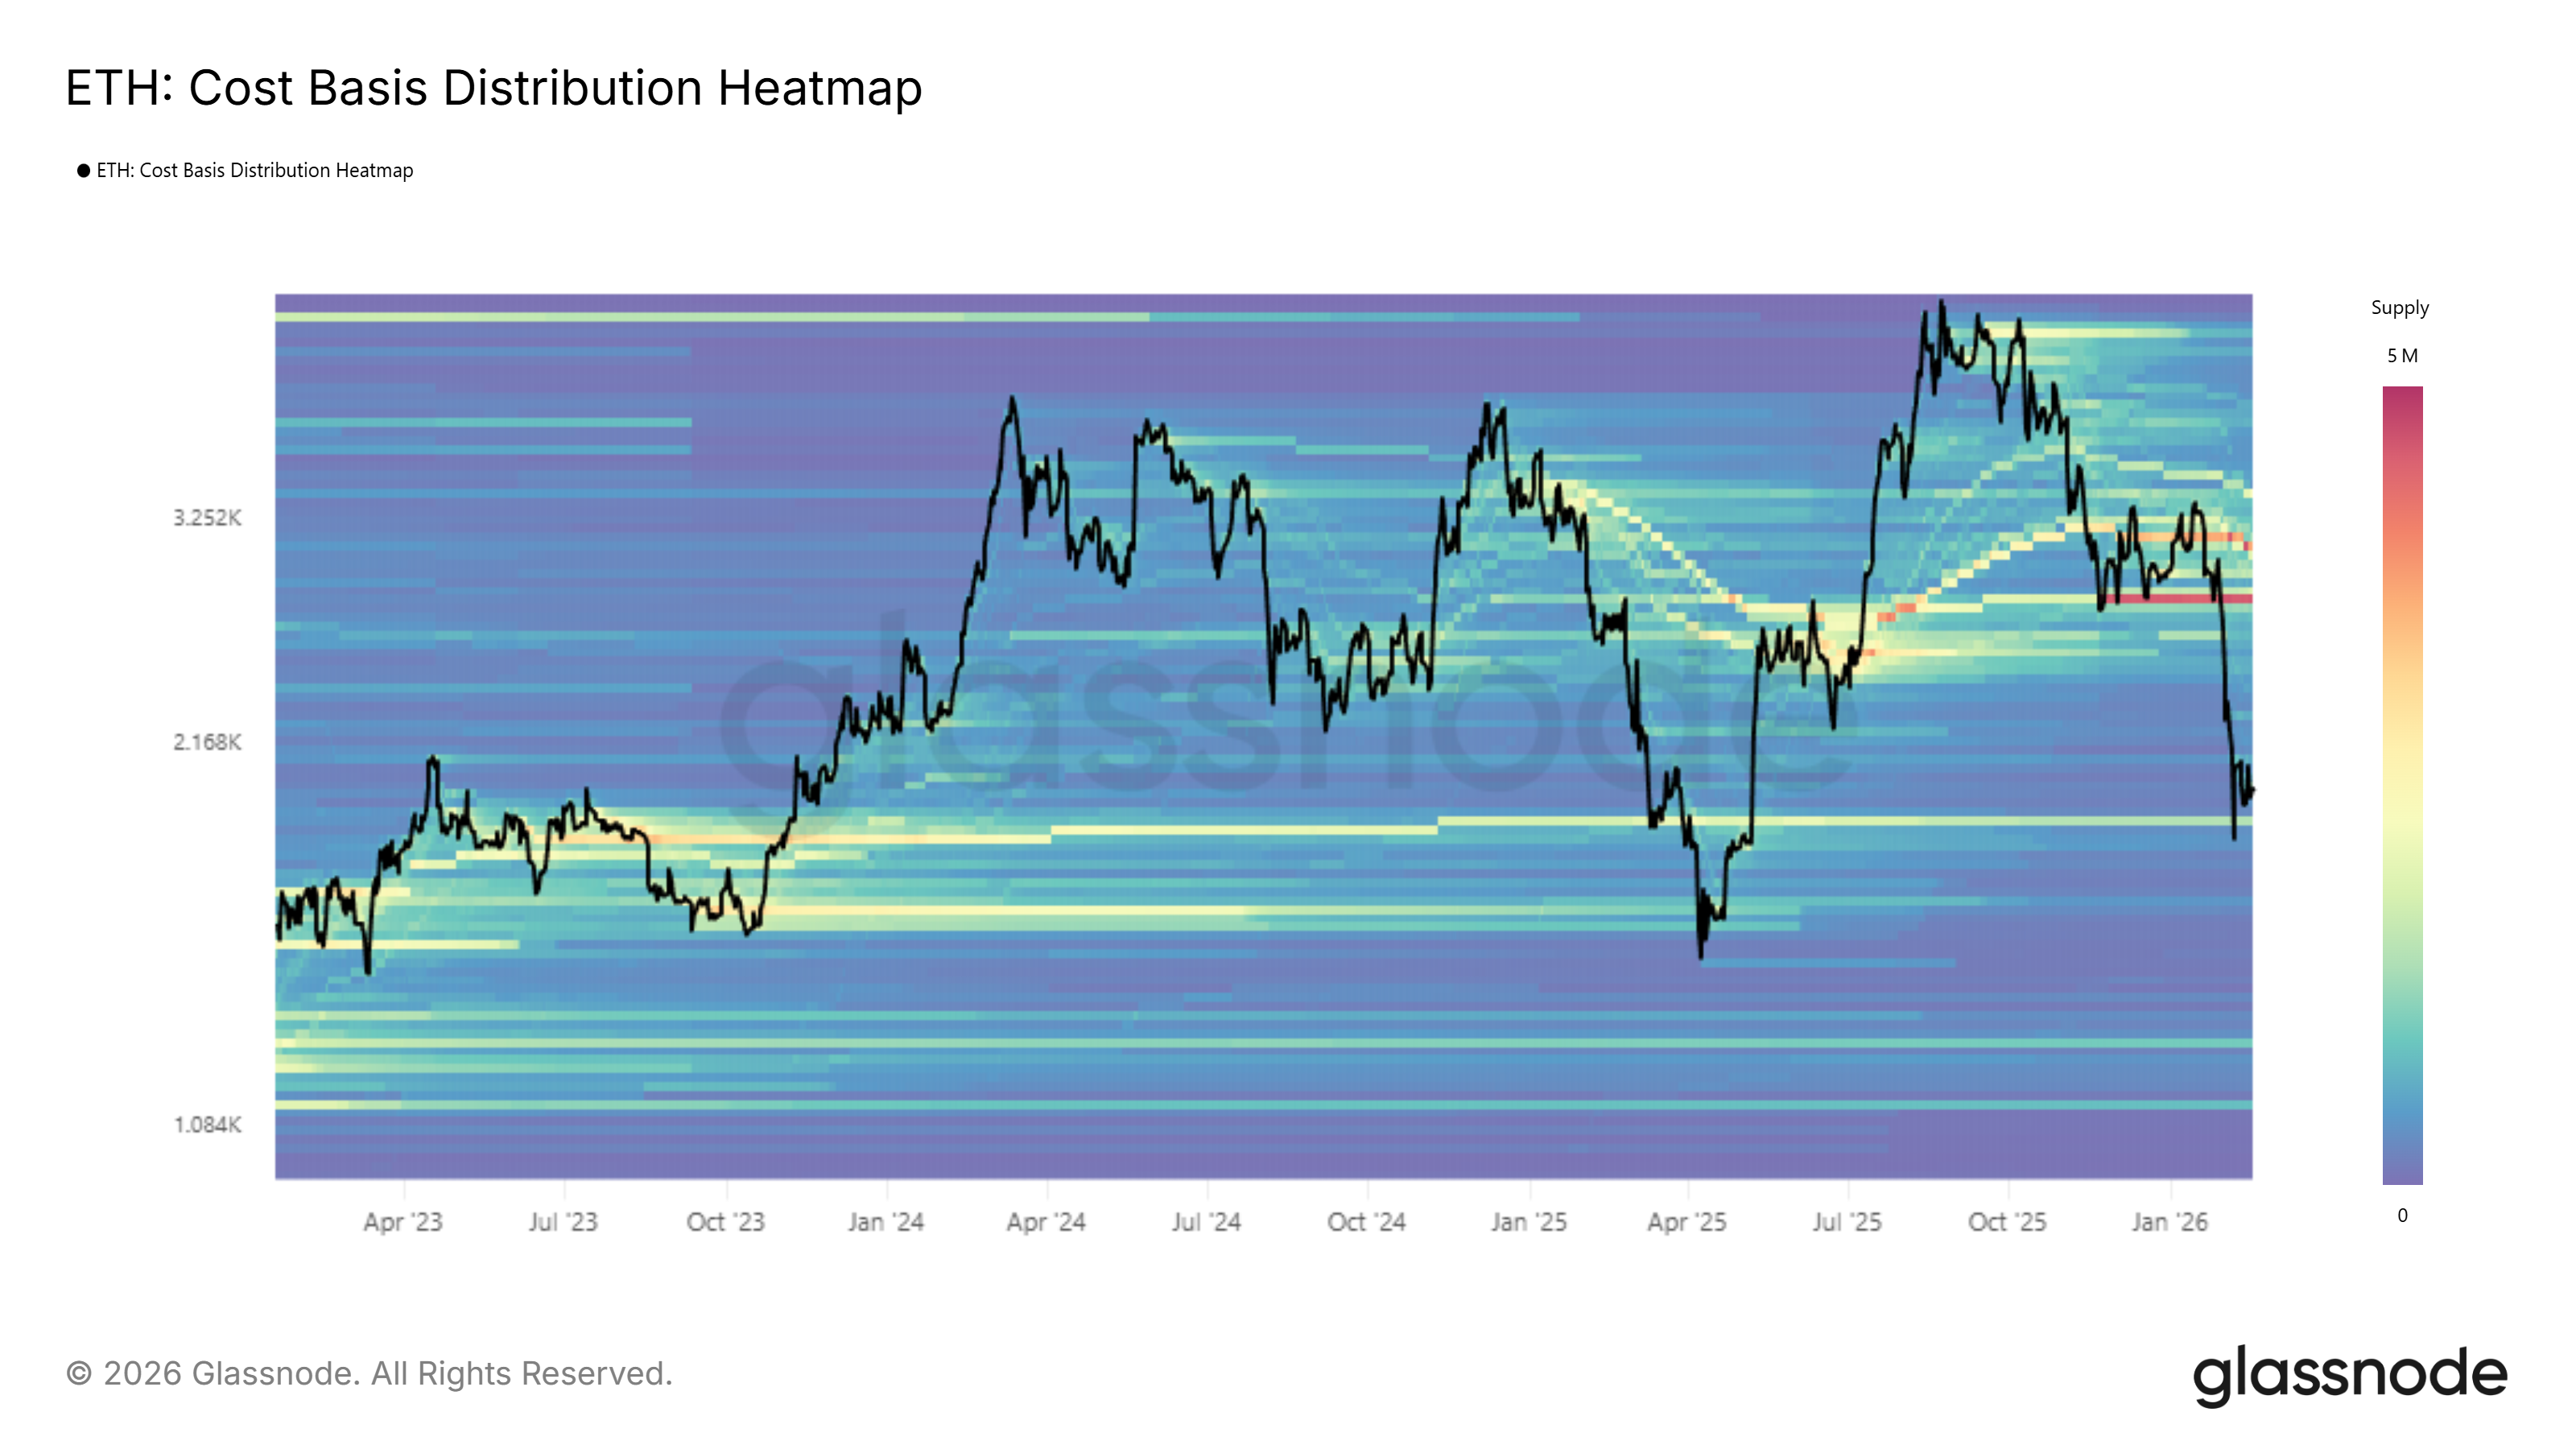
Ethereum is trading at $1,997 at the time of writing. The $2,000 level represents a critical psychological threshold. While this zone may attract short-term buying, persistent selling pressure reduces the probability of a sustained bounce. The $1,866 level represents the next notable support based on the CBD Heatmap.
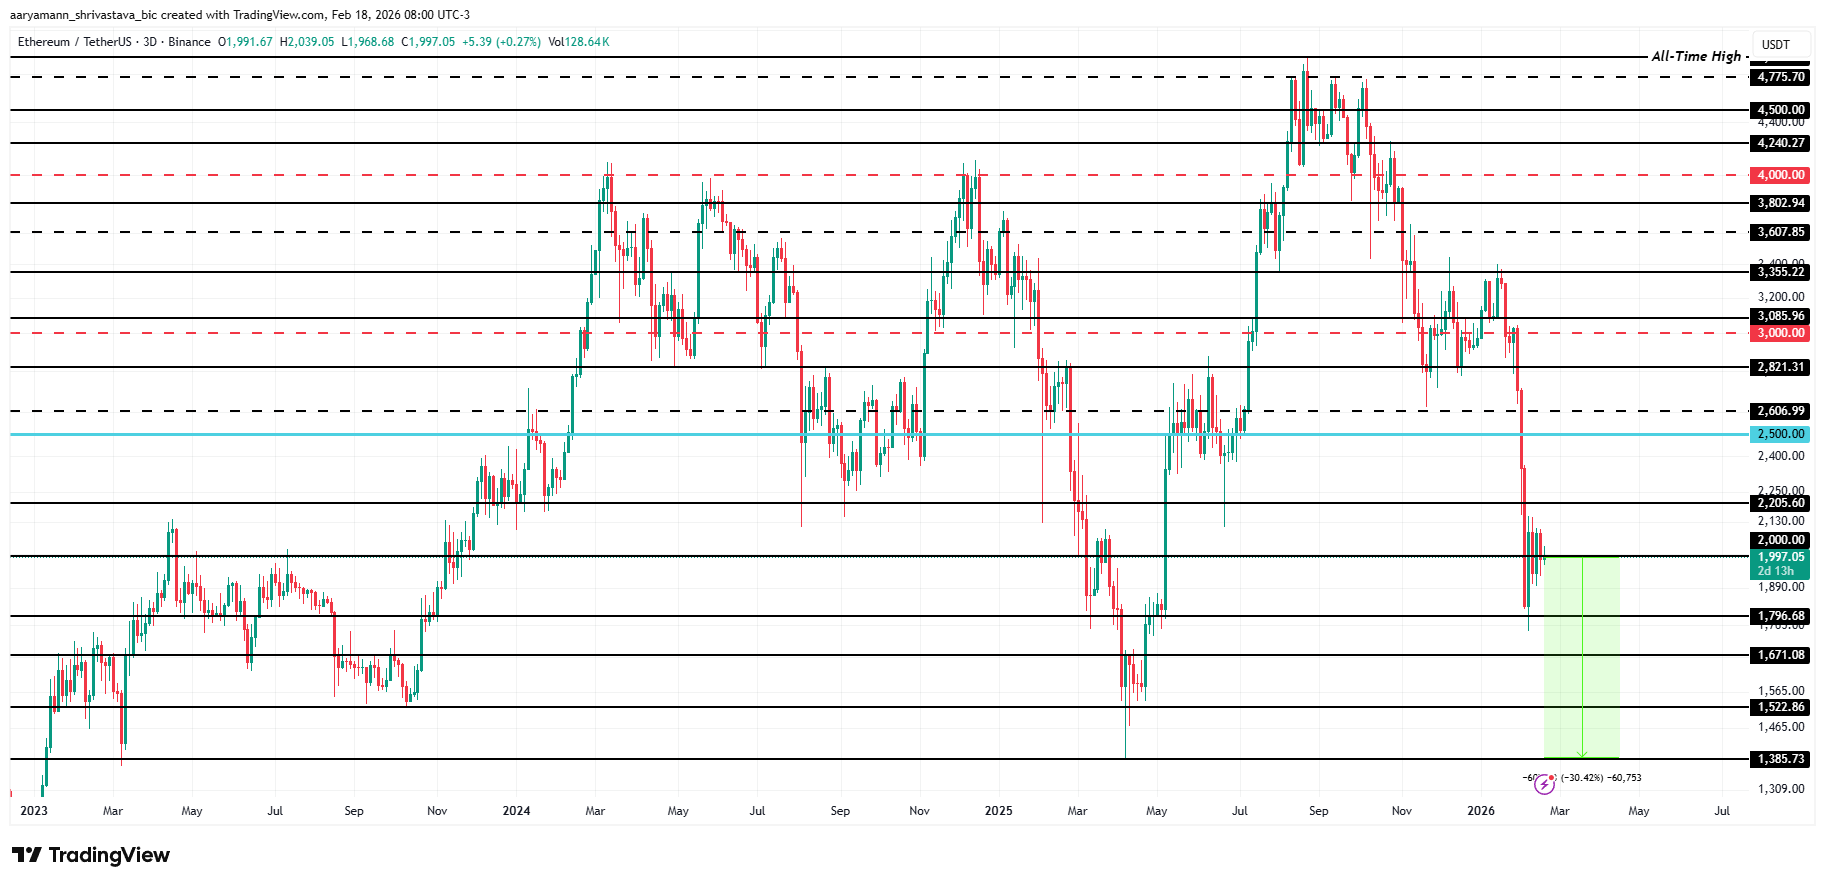
This zone reflects prior accumulation activity. If ETH loses $1,866, downside risk expands toward $1,385. This level has served as a structural bottom during previous cycles. A drop to $1,385 would represent roughly a 30% decline from current levels. The next major support beyond that sits near $1,231.
Conversely, a change in investor behavior could alter the trajectory. If holders reduce exchange deposits and accumulation resumes, ETH could stabilize above $2,000. A rebound may target $2,205 in the short term. Sustained buying pressure could extend gains toward $2,500, invalidating the current bearish outlook.

Crypto markets got gutted today. Bitcoin slid as much as 3% on the session after President Trump signaled escalating military action against Iran, crushing the fragile optimism that had briefly lifted crypto earlier this week.
Trump’s remarks reversed a short-lived rally built on hopes he might end the Iran conflict and reopen the Strait of Hormuz. Instead, investors got harder-line rhetoric. Ether cratered 4%, Solana shed almost 6%, and Brent crude surged more than 5% to above $106 a barrel. It’s a stark reminder that oil shocks move crypto these days.
“Stock and commodity markets continue to whipsaw according to Trump’s latest comments on geopolitical developments,” said Caroline Mauron, co-founder of Orbit Markets. “Bitcoin is largely following stocks’ direction, though in the past few weeks it has shown reduced sensitivity to both good and bad news.”
Bitcoin had actually been holding up relatively well, ending March up 2%, snapping a five-month losing streak, while gold dropped more than 11% over the same period amid energy-supply inflation fears.
Discover: The best pre-launch token sales
Trump Moves Crypto with War?
Today’s selloff tests whether that resilience has a floor, or whether geopolitical pressure finally cracks it. The Iran-oil nexus has rattled Bitcoin before, and the pattern is reasserting itself fast.
Bitcoin is trading near $66,500 at the time of writing, with intraday lows testing that level as selling pressure accelerated through the London morning session. The broader trend remains damaged: BTC sits roughly 45% below its October peak of $126,000, and demand metrics haven’t recovered.

According to CryptoQuant data cited in recent market analysis, apparent Bitcoin demand, the gap between demand and newly mined supply, was negative by approximately 63,000 BTC as of late March. That’s not a small number.
The CLARITY Act Senate Banking Committee markup, expected mid-April, remains the highest-impact regulatory catalyst on the horizon. If that progresses well, it could provide a sentiment floor. For now, the macro tape controls price, and crypto moves on Trump’s comments.
Discover: The best crypto to diversify your portfolio with
Bitcoin Hyper Unbothered By Geopolitics
Bitcoin Hyper ($HYPER) is positioning as the first Bitcoin Layer 2 with full Solana Virtual Machine (SVM) integration, with faster execution than Solana itself, with sub-second finality, low-cost smart contracts, and a Decentralized Canonical Bridge for seamless BTC transfers. And the best part, it doesn’t need a good geopolitical condition to be profitable.
The pitch is direct: fix Bitcoin’s three core failure modes—slow transactions, high fees, and no programmability, without sacrificing Bitcoin’s underlying security. The presale has raised $32 million at a current price of $0.0136, with staking rewards already live. The $32M milestone came alongside ETF inflows, and the presale has shown momentum through volatile conditions.
This article is for informational purposes only and does not constitute financial advice. Crypto assets are highly volatile. Always conduct your own research before investing.
The post Crypto News Today: Trump to Hit Iran Harder, Crypto Butchered appeared first on Cryptonews.


Disclosure: This article does not represent investment advice. The content and materials featured on this page are for educational purposes only.
Crypto mining shifts toward infrastructure and efficiency as Bitcoin stabilizes and institutional demand holds.
Summary
- Rising mining costs and difficulty are pushing users toward cloud mining as a simpler crypto income alternative.
- Demand grows for free mining platforms as users seek passive income without hardware or technical barriers.
- AngelBTC gains traction with transparent contracts and free hashpower rewards, offering accessible entry for beginners.
In 2026, the crypto mining landscape is no longer driven by retail speculation — it’s shaped by infrastructure, efficiency, and accessibility.
Over the past quarter, Bitcoin has remained relatively stable within a consolidation range, while global mining difficulty continues to rise. At the same time, institutional inflows into Bitcoin-related products have stayed consistent, signaling long-term confidence in the asset class.
But behind the scenes, something more important is happening:
Traditional mining is becoming less accessible.
High hardware costs, rising electricity prices, and increasing technical barriers are pushing users toward a simpler alternative — cloud mining platforms.
This is why search demand for terms like “free crypto mining platforms 2026”, “cloud mining without investment”, and “daily passive income crypto” is growing rapidly.
Below are seven platforms worth attention this year.
1. AngelBTC
AngelBTC has quickly gained traction in 2026 by focusing on one core principle: transparent mining contracts with real earning logic.
Unlike older platforms that rely on vague profit claims, AngelBTC structures its mining system around clearly defined contracts, including hashrate, duration, and expected returns.
New users can access daily sign-in rewards that provide free hashpower, making it one of the more accessible entry points for beginners.
Advantages
- Transparent contract structure (clear returns and duration)
- Daily payouts every 24 hours
- Renewable energy-backed mining (hydro, wind, geothermal)
- Low entry barrier with free hashpower system
Drawbacks
- Higher-tier contracts require capital commitment
- Not designed for users seeking ultra-short speculative gains
2. ECOS
ECOS is one of the few platforms operating within a regulated mining environment, which makes it appealing for users prioritizing compliance and stability.
It offers a free trial model, allowing users to explore mining before committing funds.
Advantages
- Regulated mining infrastructure
- Beginner-friendly interface
- Predictable long-term contracts
Drawbacks
- Limited earning potential from free tier
- Less flexible than newer platforms
3. NiceHash
NiceHash takes a different approach by acting as a hashpower marketplace instead of a traditional cloud mining provider.
Users can buy or sell computing power based on market conditions.
Advantages
- Flexible pricing model
- No fixed contracts required
- Suitable for experienced users
Drawbacks
- Complex for beginners
- Earnings depend heavily on market fluctuations
4. BitFuFu
BitFuFu is positioned closer to institutional mining services, offering structured mining products backed by large-scale infrastructure.
Advantages
- Strong infrastructure support
- Focus on Bitcoin mining efficiency
- Stable contract offerings
Drawbacks
- Limited free access options
- Higher entry barrier
5. StormGain
StormGain integrates mining with trading, making it attractive for users who want an all-in-one crypto platform.
Advantages
- Mobile-friendly experience
- Built-in mining feature
- No upfront hardware required
Drawbacks
- Mining rewards are relatively low
- Requires platform engagement to maximize earnings
6. BeMine
BeMine introduces a hybrid model where users can own fractional shares of mining equipment.
Advantages
- Hardware-backed mining exposure
- Long-term earning potential
- Transparent ownership model
Drawbacks
- Less liquidity
- Not ideal for short-term users
7. Kryptex
Kryptex remains popular among beginners who prefer mining using their own computers.
Advantages
- Easy setup
- No contract commitment
- Works with existing hardware
Drawbacks
- High electricity consumption
- Lower profitability compared to cloud mining
2026 industry shift: From hardware mining to cloud access
The biggest shift in 2026 is not about price — it’s about structure.
Mining has transitioned from GPU-based home setups to large-scale industrial operations
As a result, cloud mining platforms are becoming the dominant model.
Users are no longer asking how to build rigs—they are searching for:
- best cloud mining platforms 2026
- free bitcoin mining without investment
- passive income crypto daily payouts
This shift is also driven by:
- Rising mining difficulty
- Increased competition among miners
- Demand for predictable earnings
What users are actually searching
Understanding search intent is critical for choosing the right platform.
High-volume keywords in 2026 include:
- free crypto mining platforms
- cloud mining without investment
- legit bitcoin mining sites
- daily passive income crypto
- best cloud mining platform for beginners
Platforms that align with these queries—especially those offering free entry + transparent contracts—are capturing the majority of organic traffic.
Risks not to ignore
While cloud mining simplifies access, it does not eliminate risk.
Users should always consider:
- Market volatility affecting mining rewards
- Platform credibility and transparency
- Contract lock-in periods
- Unrealistic return promises
A good rule is that if a platform cannot clearly explain how earnings are generated, it’s not worth the risk.
FAQ: Free crypto mining platforms in 2026
Is free crypto mining really possible in 2026?
Yes—but not in the traditional sense. Most platforms now offer free access through bonuses, trials, or limited hashpower rather than unlimited mining.
Which platform is best for beginners?
Platforms with simple onboarding and free entry mechanisms, such as those offering daily rewards, are typically the easiest starting point.
How often are mining rewards paid?
Most modern platforms distribute earnings every 24 hours, depending on the contract structure.
Is cloud mining more profitable than traditional mining?
For most users, yes. It eliminates hardware costs, maintenance, and electricity expenses, making returns more predictable.
Final thoughts
Crypto mining in 2026 is no longer about technical skill—it’s about choosing the right platform.
As the industry becomes more competitive and capital-intensive, accessibility and transparency are becoming the real differentiators.
For users entering the space today, platforms that combine free entry mechanisms, structured mining contracts, and daily payouts are not just more convenient—they represent the future of mining itself.
Disclosure: This content is provided by a third party. Neither crypto.news nor the author of this article endorses any product mentioned on this page. Users should conduct their own research before taking any action related to the company.
Social media platform X is considering implementing new rules for first-time user posts about crypto in an effort to crack down on scammers using phishing attacks to gain access to accounts.
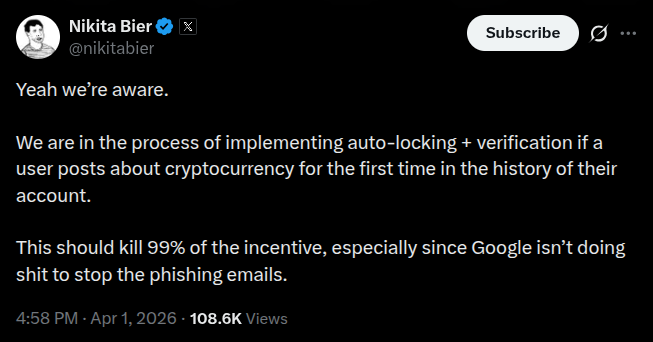
Nikita Bier, the head of product at the platform formerly known as Twitter, made the announcement on Wednesday amid reports that a scammer pretending to be a veterinarian previously responsible for the health of a 193-year-old tortoise named “Jonathan” conned social media users into buying crypto before the truth was revealed.
Bier said that X could auto-lock accounts mentioning crypto for the first time and require them to go through verification. “This should kill 99% of the incentive, especially since Google isn’t doing shit to stop the phishing emails,” read his post.
A scammer pretending to be the veterinarian responsible for Jonathan reportedly posted a link to a Solana-based memecoin before the BBC and other news outlets revealed the truth on Thursday.
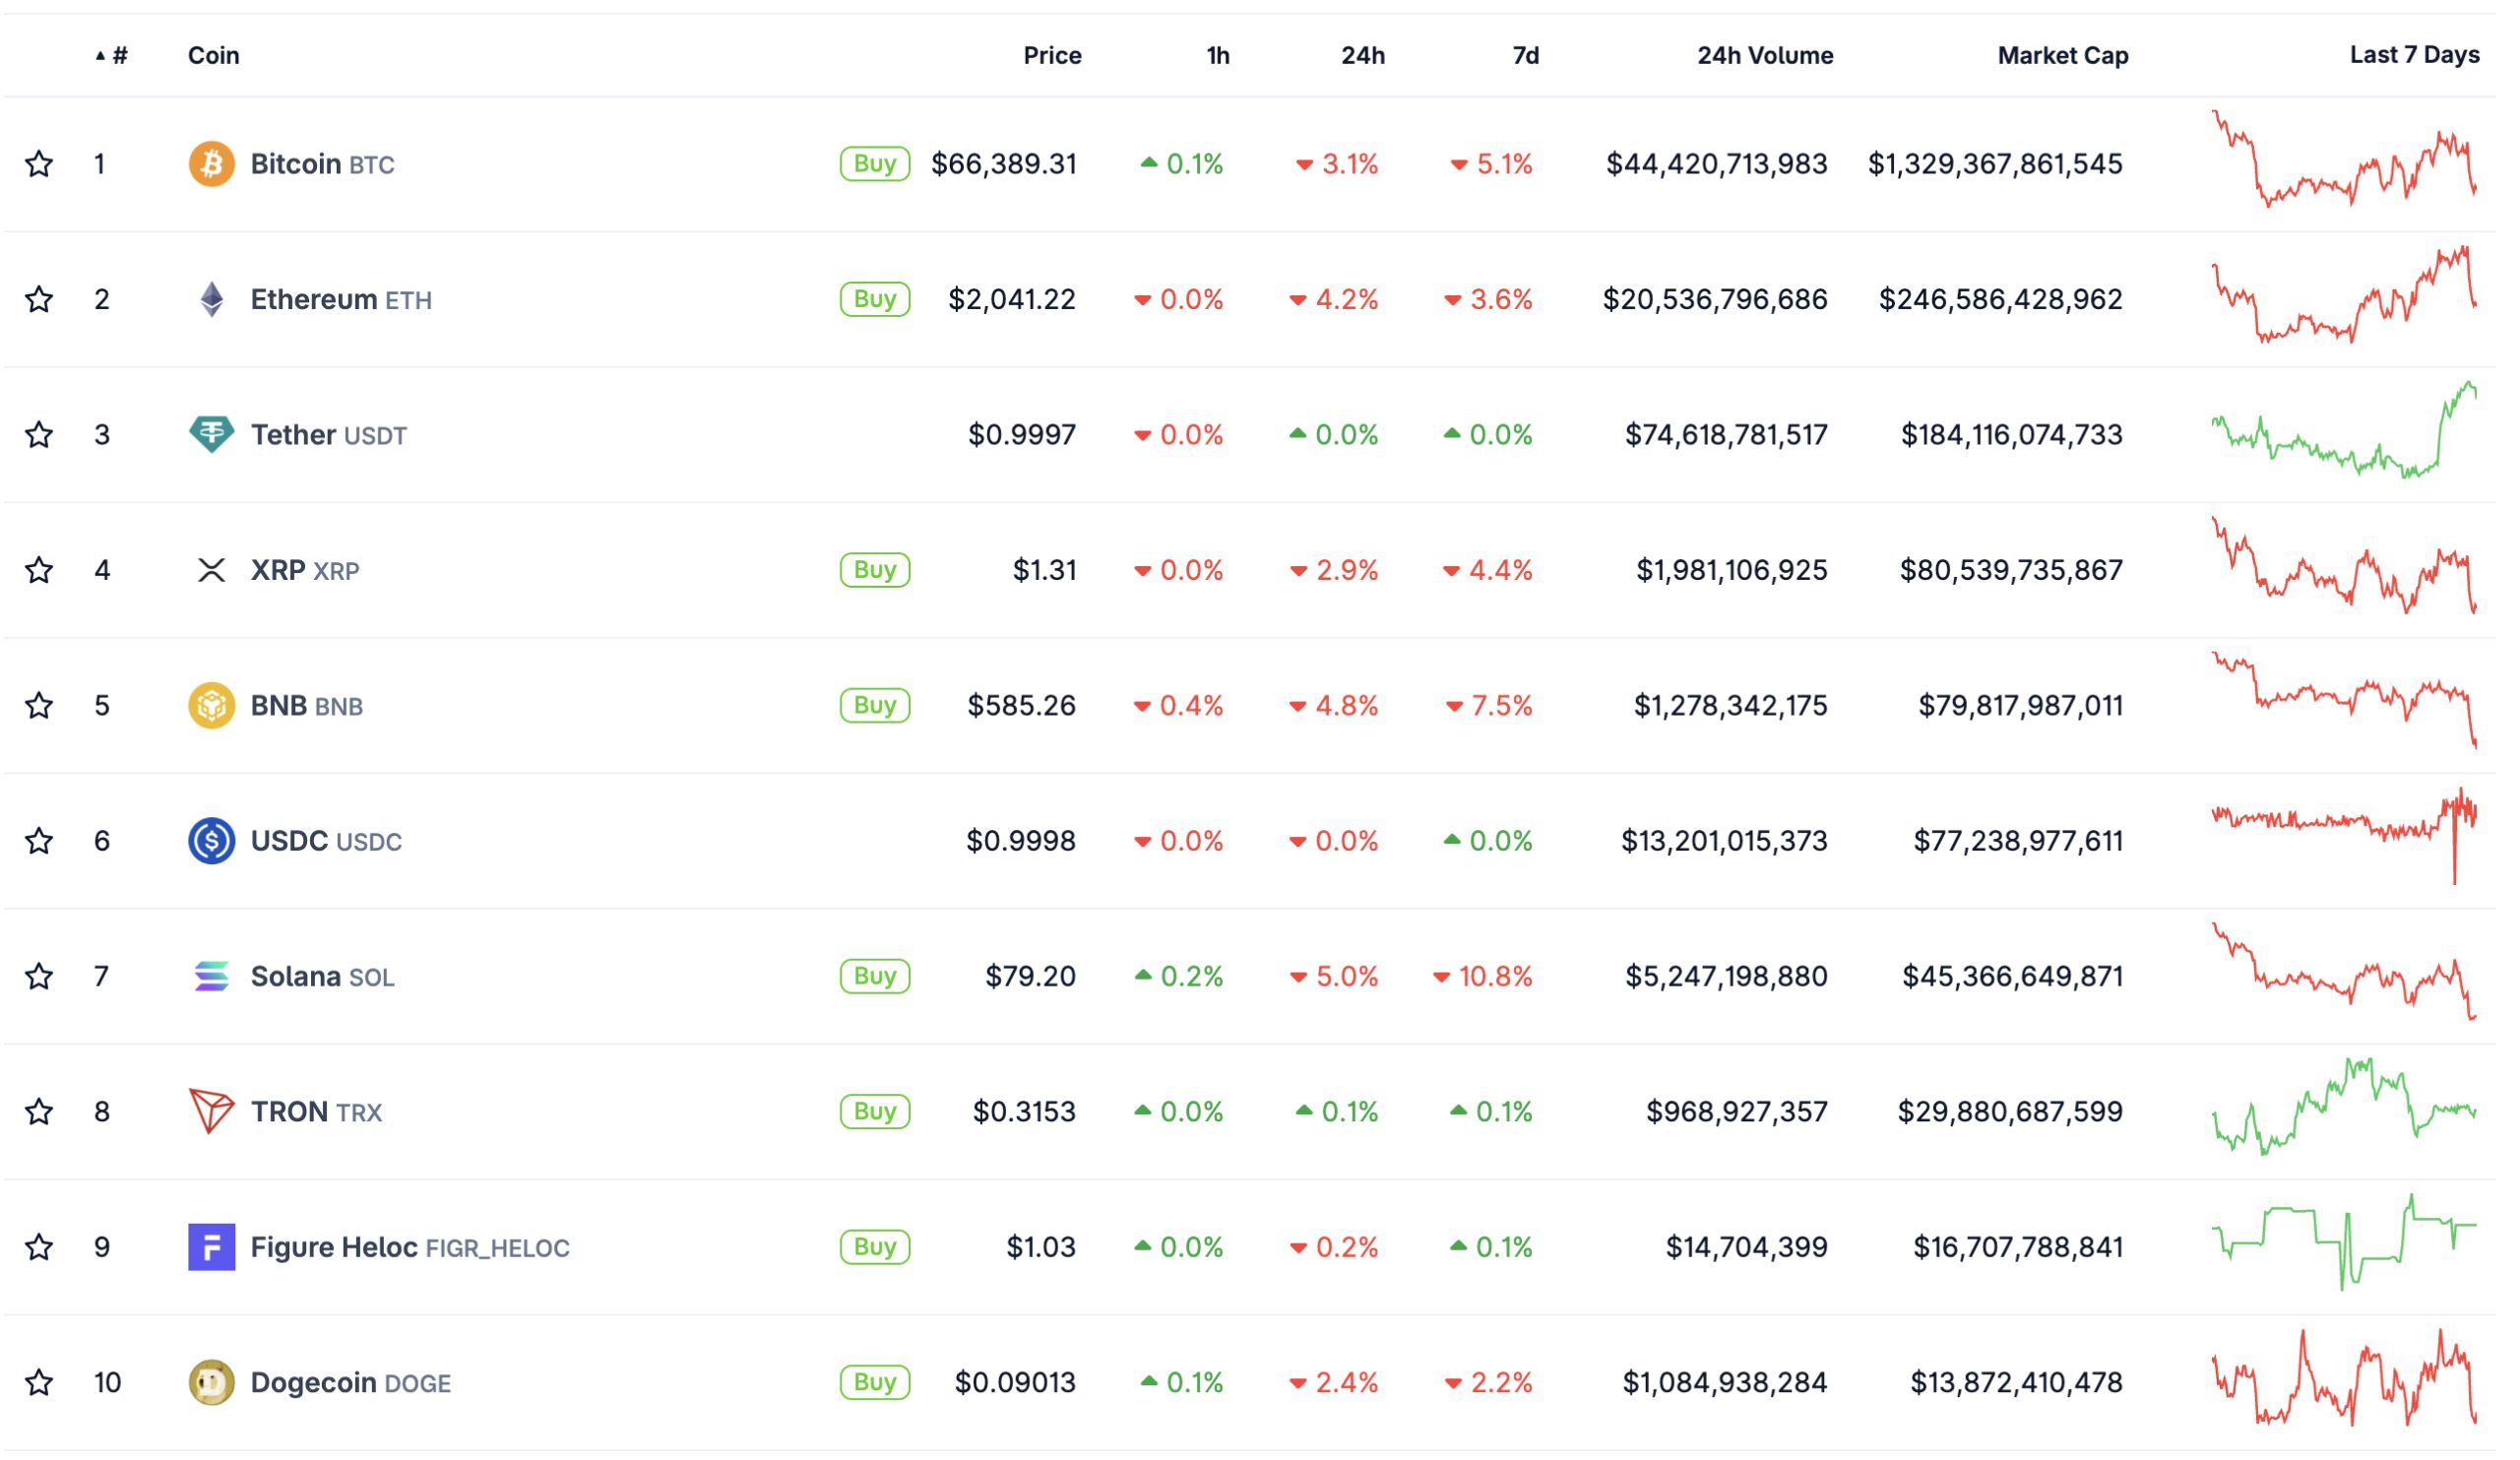
Data from CoinMarketCap showed the price of the Solana-based memecoin, called JONATHAN, surged by more than 6,000% amid the social media posts before sharply dropping. At the time of publication, the token was priced at $0.00007043.
Related: Alleged Huione money-laundering boss extradited to China

Crypto scammer faked death report of world’s oldest tortoise
According to the BBC report, a scammer on the social media platform X, pretended to be veterinarian Joe Hollins, posting that the tortoise had died on the British territory of Saint Helena, an island in the Atlantic. The account reportedly linked to a Solana blockchain memecoin based on Jonathan’s death.
“Jonathan the tortoise is very much alive,” said the real Hollins in a statement to The Guardian. “I believe on X the person purporting to be me is asking for crypto donations, so it’s not even an April fool joke. It’s a con.”
Many scammers have used anonymous or pseudonymous accounts on social media platforms to convince users to send crypto based on false pretenses. Although impersonating an animal like Jonathan is unusual, people have created unauthorized memecoins based on Japanese Prime Minister Sanae Takaichi, US President Donald Trump, and many other public figures.

Many hackers have used X accounts or gained access to legitimate accounts to post scams like fake memecoins or claims to “double your money.”
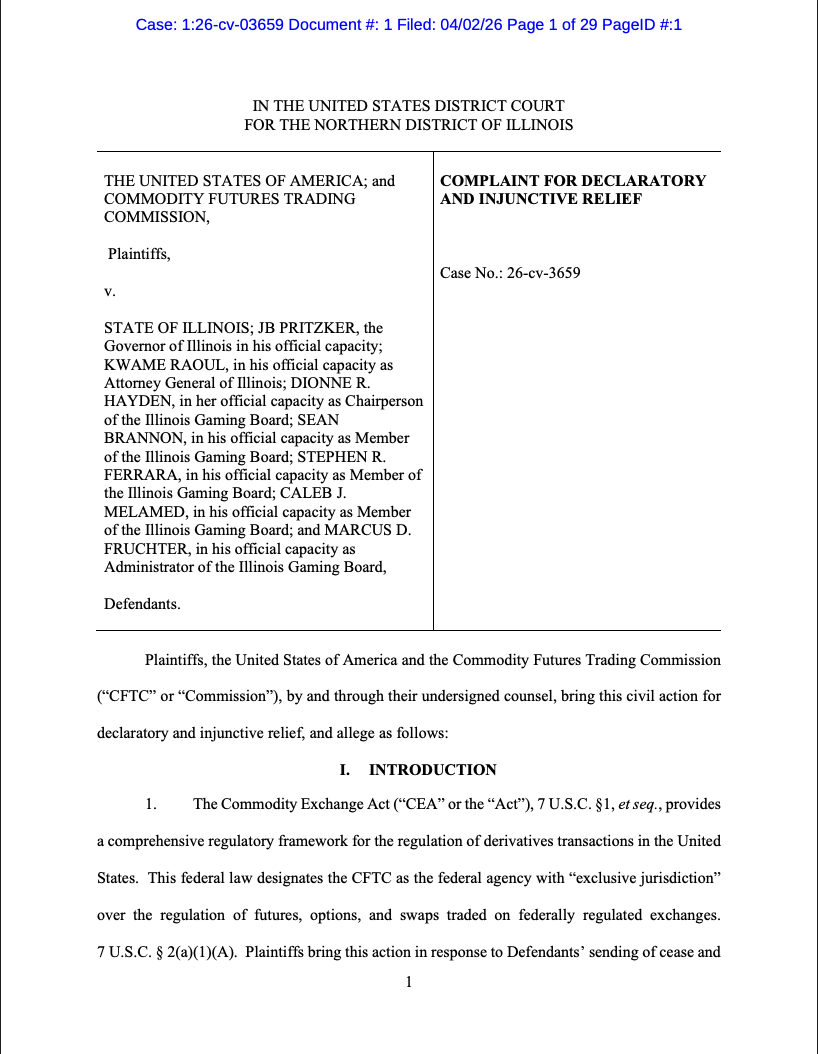
The Trump administration is suing Illinois, Connecticut, Arizona, and their gaming regulators over the federal government’s right to regulate prediction markets.
The Commodity Futures Trading Commission (CFTC) and the US Department of Justice filed separate lawsuits on Thursday against the three states.
In 2025, those states and their gaming regulators sent cease and desist letters to prediction platforms, including Kalshi and Polymarket, claiming that the event contracts offered by the platforms violated state gambling laws and licensing requirements.
The federal financial regulator’s lawsuit against Illinois Governor JB Pritzker, Attorney General Kwame Raoul and the Illinois Gaming Board argues that the Illinois Gaming Board overstepped its authority by categorizing event contracts as “wagers” or “sports betting” instead of asset swaps.

In each of the three lawsuits, the CFTC maintains that it has “exclusive jurisdiction” to regulate “Designated Contract Markets (DCMs),” which include prediction platforms, under the Commodity Exchange Act (CEA). The Illinois lawsuit said:
“Illinois’s attempt to shut down federally regulated DCMs intrudes on the exclusive federal scheme Congress designed to oversee national swaps markets. Prompted by the evolution of national financial markets and repeated conflicts with state law.”
“Unless restrained and enjoined by the court, defendants are likely to continue their attempts to subvert federal law and the exclusive jurisdiction to regulate event contract swaps conferred on the CFTC by Congress,” the lawsuit filing said.
The CFTC lawsuit comes amid increased legal scrutiny of prediction markets by US lawmakers and regulators, as 11 states pursue legal action against prediction market platforms.
Related: CFTC’s top enforcer puts prediction market insider traders on notice
CFTC chief pushes back as legal pressure on prediction markets intensifies
“These states’ aggressive and overzealous attempts to overstep the CFTC have led to market uncertainty and risks destabilizing effects for market participants and our registrants,” CFTC Chairman Mike Selig said after the lawsuits were filed.

State regulators in Arizona, Nevada, Illinois, Maryland, New Jersey, Montana, Ohio, Connecticut, Tennessee, New York and Massachusetts have taken legal action against prediction markets.
At the same time, Congressional lawmakers are attempting to push through legislative proposals that would ban sports-related event contracts and prevent political insiders from participating in prediction markets tied to war.
Magazine: IronClaw rivals OpenClaw, Olas launches bots for Polymarket — AI Eye

TLDR:
- SpaceX targets $75B in its IPO, more than double the global record set by Saudi Aramco in 2019.
- Starlink drove $8B in profit last year, making SpaceX already profitable ahead of its public listing.
- xAI, merged into SpaceX in February, burns $1B monthly, adding risk beneath the Starlink profit story.
- Nasdaq rule changes allow SpaceX to join the Nasdaq 100 within 15 days, triggering billions in auto-buys.
SpaceX IPO preparations are attracting attention from financial markets worldwide. The company has confidentially filed with the SEC and targets a listing as early as June 2026.
SpaceX is looking to raise to $75 billion. That figure would surpass Alibaba’s US record of $22 billion set in 2014. Saudi Aramco holds the global benchmark at $29 billion, raised in 2019. SpaceX is targeting more than double both figures combined.
SpaceX IPO Exposes Deep Valuation Gaps Across the Space Sector
SpaceX reported $8 billion in profit last year on revenue between $15 and $16 billion. Nearly all of it came from Starlink, its satellite internet service.
The company is already profitable at scale, unlike most pre-IPO tech listings. This is not a company pitching an unproven future business model.
At a $1.75 trillion valuation, SpaceX trades at 110 times annual revenue. AST SpaceMobile, by comparison, trades at 452 times revenue and has not yet turned a profit.
Rocket Lab trades at 62 times revenue and is also pre-profit. Both companies also rely partly on SpaceX for their own launch needs.
Market commentator Bull Theory flagged this valuation gap in a recent social media post. The account argued that such pricing between the sector leader and pre-profit rivals creates a conflict.
Historical precedent tends to favor a downward repricing of the smaller names. Investors are watching this dynamic closely.
The retail share allocation is set at 30%, which is three times the standard Wall Street norm. Musk appears to be deliberately converting his broad audience into direct shareholders through this structure.
Retail participation in the SpaceX IPO could therefore reach unusually high levels. The move sets this listing apart from most large-cap offerings in recent memory.
xAI Merger and Nasdaq Rule Changes Shape the Broader Investment Case
One underreported risk in the SpaceX IPO involves the February merger with xAI. The AI company is burning approximately $1 billion per month.
The IPO pitch rests on Starlink’s margins sustaining those losses long enough. The goal is for orbital AI data centers to eventually generate independent revenue.
That makes this more than a standard space company listing. Investors are also funding an AI infrastructure play with no proven revenue to date.
The two businesses are now legally and financially inseparable following the merger. This adds a layer of risk not immediately visible in the headline numbers.
Nasdaq changed its index eligibility rules to accommodate SpaceX specifically. Under the new criteria, the company can join the Nasdaq 100 within 15 days of listing.
That would trigger automatic purchases from index funds tracking the benchmark. Billions in forced buying could arrive shortly after trading begins.
The offering includes $24 billion in US government defense contracts and ownership of X, the social media platform. These assets broaden SpaceX well beyond its launch and satellite operations.
The SpaceX IPO is drawing comparisons to Facebook’s 2012 listing in scale and market impact. Unlike Facebook at that time, SpaceX is already generating substantial profits.

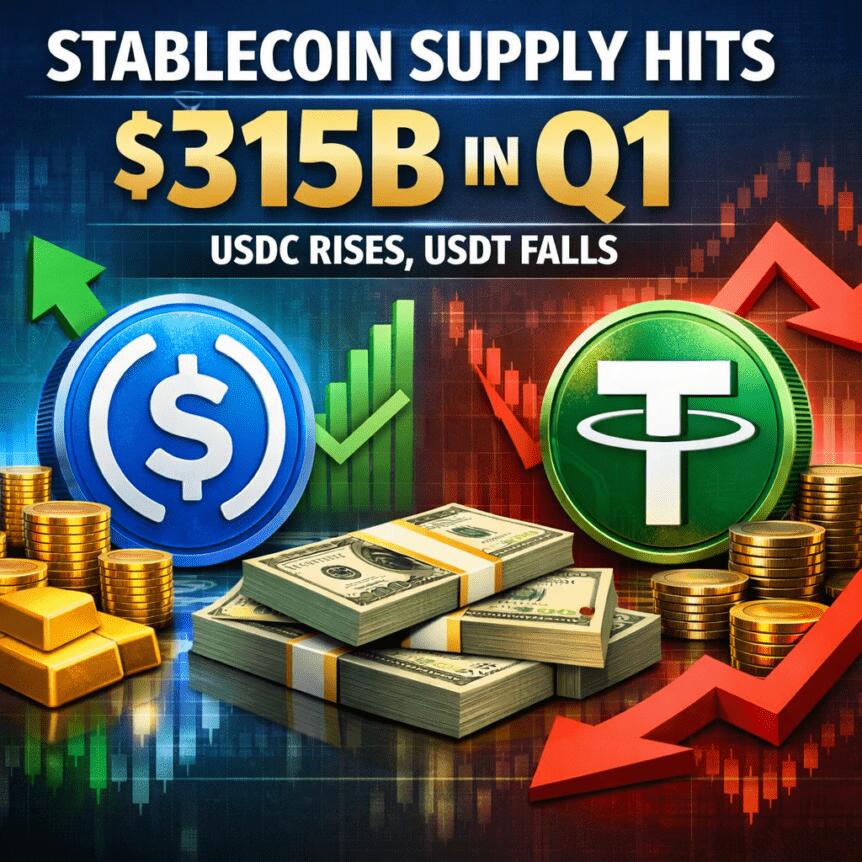
Stablecoins stood out as a rare bright spot in an otherwise muted first quarter for the crypto market. Fresh data from CEX.IO shows the sector expanded despite a broad downturn, underscoring their evolving role as the market’s liquidity backbone and a defensive option for investors navigating volatility.
Overall stablecoin supply climbed to a record $315 billion in Q1, rising by about $8 billion. While that is the slowest pace of growth since the final quarter of 2023, it still marks a net expansion during a period of weaker price action across digital assets. Equally notable is the share of activity they generated: stablecoins accounted for roughly 75% of total crypto trading volume in the quarter—the highest level on record and a signal of ongoing demand for a familiar, fast settlement layer in crypto markets.
Key takeaways
- Record liquidity backbone: Stablecoin supply reached $315 billion in Q1, up about $8 billion year over year, with 75% of crypto trading volume conducted in stablecoins.
- Volume vs. retail: Total stablecoin transaction volume surpassed $28 trillion, reinforcing stablecoins’ central role as the main on-chain liquidity layer, even as retail activity cooled.
- Shift in usage: Retail transfers declined 16% in Q1—the steepest drop on record—while automated activity surged, with bots driving about 76% of stablecoin transaction volume.
- Issuer divergence: USDC supply grew by roughly $2 billion, while USDT declined by about $3 billion—the first meaningful split between the two major issuers since 2022.
- Yield-driven growth amid scrutiny: The market for yield-bearing stablecoins sits around $3.7 billion, with daily trading volumes above $100 million, a dynamic drawing regulatory attention in the U.S.
Bot-driven liquidity reshapes on-chain dynamics
The data depict a notable shift in how stablecoins are used on-chain. While retail demand showed a clear pullback, the rise of algorithmic activity points to a growing involvement from institutions and sophisticated trading strategies. Bots’ dominance—accounting for roughly three-quarters of on-chain stablecoin volume—suggests that liquidity provisioning, arbitrage, and market-making have moved to the forefront of stablecoin use cases.
In a market environment characterized by tighter risk appetites, such automation can enhance price discovery and capital efficiency for major exchanges and liquidity venues. Yet it also raises questions about the resilience of demand when non-retail participants dominate flows, and about the potential for sudden shifts if algorithmic strategies recalibrate in response to evolving market conditions.
Diverging paths for the two largest issuers
Among stablecoin issuers, a clear divergence emerged in Q1. Circle’s USDC saw supply expand by approximately $2 billion, while Tether’s USDt contracted by around $3 billion. This marks the first substantive split between the two since mid-2022 and suggests a relative shift in on-chain usage toward USDC—an outcome consistent with rising USDC transfer activity observed earlier in the year.
Analysts have linked the USDC uptick to broader on-chain utility, including trading, settlement, and financial ops, aligning with data that show USDC’s growing centrality in routine liquidity operations. By contrast, the USDT contraction could reflect a combination of redemption dynamics, reserve management choices, and shifting preferences in certain liquidity pools or markets.
For market participants, the divergence underscores how issuer strategies and trusted rails can influence liquidity distribution across protocols and venues. Investors and builders should monitor whether the USDC-USDT dynamic persists, and what it signals about demand regimes for stablecoins across centralized and decentralized ecosystems.
Further context from industry coverage indicates ongoing upticks in USDC transfer activity, reinforcing the view that USDC is becoming a more prominent vehicle for on-chain finance beyond mere trading pairs.
USDC transfer activity has been cited as a notable trend in on-chain volume, a development that dovetails with the supply data described above.
Yield-bearing stablecoins: growth facing regulatory glare
Another notable dynamic in the quarter was the continued growth of yield-bearing stablecoins, a niche that has drawn heightened scrutiny in the United States. The market for these interest-bearing products sits around $3.7 billion, with daily trading volumes topping $100 million, according to CoinGecko data. The appeal is clear: yield segments can attract capital by offering enhanced returns compared with traditional stablecoins, particularly in an environment of rising interest expectations and evolving DeFi strategies.
However, the same yield-focused segment has become a focal point for policymakers and incumbents concerned about the potential risks and the regulatory framework surrounding crypto markets. Lawmakers and industry participants alike are weighing how yield offerings intersect with investor protection, banking relationships, and the broader stability of the payments and settlement stack. In parallel, traditional banks have pushed back against stablecoins that promise yields, highlighting ongoing regulatory ambiguity as a constraint on product design and market adoption.
In this context, the market data on yield-bearing stablecoins provide a meaningful barometer of how far stablecoin innovation can advance within a regulated framework while balancing the needs of retail users, institutions, and on-chain operators. The relatively modest overall size of the yield-bearing segment — about $3.7 billion — doesn’t yet imply a wholesale shift, but it does suggest that product diversification will continue to shape issuer strategies and market structure decisions in the months ahead.
For readers tracking industry momentum, these dynamics are not isolated. They intersect with broader narratives about stablecoins’ role as a settlement layer, the push toward on-chain financial operations, and the risk-reward calculus for yield-based products in a climate of regulatory review. A recent report highlighted that stablecoins had surpassed traditional payment rails in certain on-chain metrics, underscoring how deeply embedded they have become in crypto liquidity and infrastructure. Earlier analysis noted stablecoins’ growing transfer volumes relative to traditional networks, reinforcing the shift toward crypto-native settlement paradigms.
What this means for traders, users and builders
From an investment and trading standpoint, the quarter’s data suggest that stablecoins remain a critical tool for risk management, liquidity access, and calendar-driven strategies. The sheer scale of on-chain activity—$28 trillion in stablecoin transaction volume—reaffirms stablecoins as the de facto liquidity layer for a broad cross-section of on-chain activity, including arbitrage, price discovery across venues, and cross-border settlement flows.
For developers and protocol teams, the issuer divergence and the dominance of bot-driven flows offer both opportunities and cautions. Platform builders may benefit from deeper liquidity and cheaper execution, but they must consider how to design for resilience in the face of heavy algorithmic participation. Regulators, meanwhile, will likely continue scrutinizing yield-based designs and the broader stability implications of stablecoin markets within the evolving market structure debate. In the U.S., the ongoing policy discussions surrounding a crypto market structure bill and yield rules will shape product features, storage and redemption mechanics, and the viability of certain yield strategies.
What to watch next
Observers should track whether the USDC-USDT divergence persists and how it correlates with on-chain activity patterns and exchange flows. The pace of stablecoin supply growth will be telling as market conditions evolve, particularly if macro cues shift risk appetites or driving factors for demand change. Regulators’ approach to stablecoins with embedded yields will likely influence product development and institutional participation going forward. Finally, the extent to which bot-driven liquidity remains the dominant force behind stablecoin activity will be a key question for traders and market planners in the quarters ahead.
Crypto World
BitGo Mint Goes Live: Institutions Can Now Mint and Redeem Stablecoins from One Platform
TLDR:
- BitGo Mint launches with support for USD1 and SoFiUSD, streamlining stablecoin operations for institutions.
- The platform combines regulated custody, compliance tools, and in-platform reporting in a single workflow.
- BitGo’s global network of market makers, banks, and fintechs gains direct access to native minting features.
- BitGo plans to expand Mint support to tokenized financial products, including money market funds, over time.
BitGo Mint is now live, giving institutional clients a single destination to mint, redeem, and manage stablecoins. BitGo Holdings, Inc. (NYSE: BTGO) announced the launch, with initial support for USD1 and SoFiUSD.
The new tool integrates directly within the existing BitGo platform. It reduces the need to coordinate across multiple providers and manual processes. Institutions can now access minting and redemption from one regulated environment.
BitGo Mint Centralizes Stablecoin Operations for Institutional Clients
BitGo Mint brings minting and redemption into a unified workflow for institutional participants. Previously, institutions had to coordinate across several systems and service providers to complete these operations.
That process added complexity and created multiple points of failure. The new platform consolidates these steps into a single, familiar environment.
Clients using BitGo Mint can access regulated custody alongside policy controls and compliance tools. In-platform reporting keeps all activity visible from one dashboard, improving oversight.
These features are already part of the BitGo platform that institutions rely on daily. Adding mint and redeem capability extends what they can do within that same infrastructure.
At launch, BitGo Mint supports two stablecoins: USD1 from World Liberty Financial and SoFiUSD from SoFi. Both are backed by BitGo’s Stablecoin-as-a-Service offering, which powers the minting and redemption process.
This integration makes these functions accessible to a broad range of institutional participants. Market makers, exchanges, banks, asset managers, and fintechs are all among the targeted clients.
Mike Belshe, CEO and Co-founder of BitGo, addressed the platform’s purpose at launch. “BitGo Mint brings minting and redemption into a unified institutional workflow,” he stated.
He noted that clients can reduce operational complexity while staying within the platform they already use. The statement reflected BitGo’s focus on building practical, scalable digital asset infrastructure.
Issuers and Partners Gain Broader Network Access Through BitGo Mint
BitGo Mint also opens a new distribution channel for stablecoin issuers on the platform. Stablecoins powered by BitGo’s Stablecoin-as-a-Service product suite can be made available through the tool.
This gives issuers direct access to BitGo’s global network of institutional clients. The network includes liquidity providers, market makers, financial institutions, and fintech firms.
World Liberty Financial and SoFi both confirmed their assets are available on the new platform. Their handles, @worldlibertyfi and @SoFi, were cited in the official BitGo announcement.
USD1 and SoFiUSD are the first two assets supported at launch. BitGo has indicated plans to expand native mint and redemption support to additional assets over time.
Among the assets expected to be added are tokenized financial products, including money market funds. This expansion aligns with the growing role of tokenized instruments in institutional finance.
BitGo is building infrastructure to support the full lifecycle of these assets. That covers issuance, movement, settlement, and safekeeping — all within one platform.
BitGo Mint reflects the company’s broader strategy to serve growing institutional demand in digital assets. Stablecoins now play a central role in how institutions transfer and settle value digitally.
Having minting and redemption in one place removes friction across trading and liquidity operations. The platform offers a compliant, practical solution for institutions that operate at scale.

Paradigm is building a prediction markets trading terminal aimed at professional traders and market makers, with partner Arjun Balaji leading the effort since late 2025.
Venture capital firm Paradigm is developing a prediction markets trading terminal targeted at professional traders and market makers, according to Fortune. Paradigm partner Arjun Balaji is spearheading the project, which has been in development since late 2025. The move comes as Paradigm has emerged as one of the most active backers of prediction markets, participating in three successive funding rounds for leading platform Kalshi in 2025.
Paradigm’s push into prediction markets infrastructure reflects growing institutional interest in the sector. The venture firm’s involvement with Kalshi, combined with this new trading terminal development, signals deepening commitment to the prediction markets ecosystem as platforms like Kalshi and Coinbase’s prediction markets offering expand.
Sources: Fortune
This article was generated automatically by The Defiant’s AI news system from publicly available sources.
TLDR:
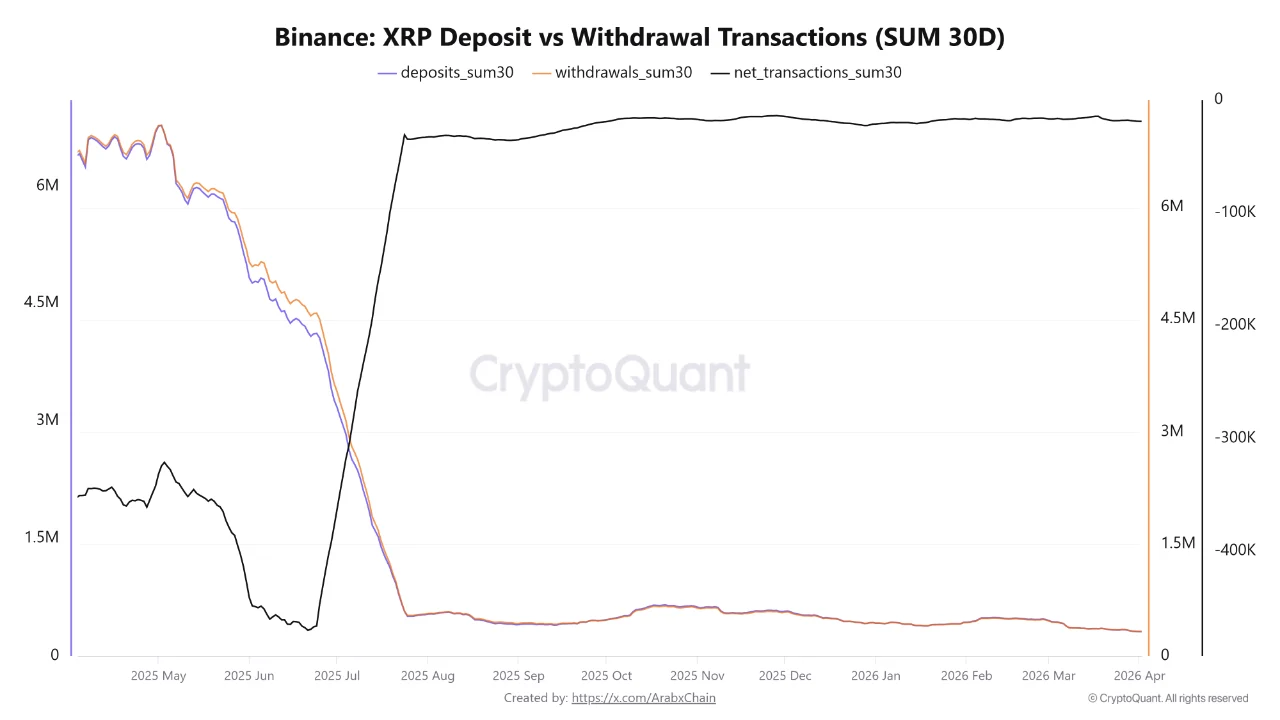
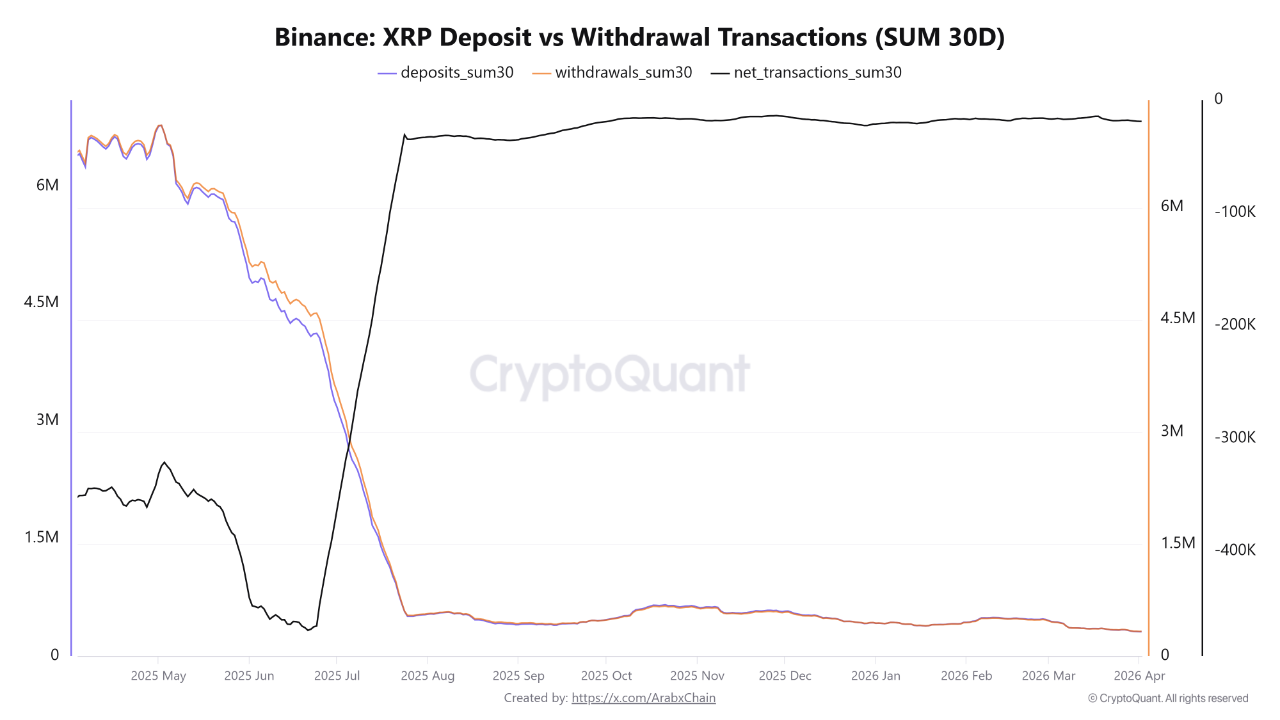
- XRP deposit transactions on Binance totaled 310,500 over the past 30 days, a yearly low figure.
- Withdrawals reached 329,400, creating a net negative transaction balance of roughly -18,900 in total.
- Transaction volumes once exceeded 6 million in a 30-day window before sharply declining in mid-2025.
- Steady XRP outflows from Binance may reflect cold wallet transfers and long-term accumulation behavior.
XRP transaction activity on Binance has dropped to its lowest point this year. Over the past 30 days, deposit transactions totaled around 310,500, while withdrawals reached approximately 329,400.
This resulted in a net negative count of roughly -18,900 transactions. The data reflects a clear decline in trader and investor activity, pointing to a period of visible market stagnation.
Transaction Volumes Reach Year-Long Lows on Binance
XRP deposits and withdrawals on Binance were considerably higher earlier in the year. At certain points in 2025, total transactions exceeded 6 million within a single 30-day window.
A sharp decline began in mid-2025, and volumes have remained subdued since then. The current figures mark the lowest activity levels recorded since that earlier peak.
Source: Cryptoquant
This drop in volume reflects reduced short-term trading interest across the platform. Fewer transactions generally correspond to lower speculative activity in the market.
As buying and selling pressures ease in tandem, price volatility tends to follow suit. The overall environment points to a quieter phase in XRP trading.
Earlier in 2025, stronger engagement from retail and institutional traders drove higher transaction counts. The mid-year reversal was swift, pulling volume down within a short timeframe.
Since then, no notable recovery has appeared in the available data. This extended period of low activity is consistent with the broader market slowdown.
Fewer deposit transactions also suggest a reduced appetite for exchange-based trading. When assets enter platforms at a lower rate, traders are typically less active in short-term positioning.
This aligns with the declining engagement trend observed on Binance. Together, these factors suggest the market has entered a consolidation phase.
Net Negative Transactions Reflect Steady XRP Outflows From Binance
With withdrawals consistently outpacing deposits, a net negative transaction balance has formed. The -18,900 gap reflects a steady movement of XRP away from the Binance platform.
This outflow pattern has persisted throughout the 30-day observation period. Even at low volumes, sustained outflows carry relevance when tracked over time.
This behavior is sometimes linked to accumulation strategies among longer-term holders. Some traders may be shifting XRP into cold wallets or private storage.
This is a common pattern during quieter market periods when speculation recedes. It does not signal selling pressure but rather a shift in asset management approach.
Moving assets off exchanges during calm periods is a recognized risk management strategy. It gradually reduces exchange-held supply, which is a measurable data point.
This trend does not indicate distress but rather deliberate repositioning by holders. Tracking this movement in the coming weeks will provide additional market clarity.
The current XRP data shows reduced activity and steady outflows on Binance. Volumes remain at yearly lows, and assets continue moving off the platform.
These trends reflect observable exchange data. The market is in a low-momentum phase as traders await clearer direction.
Polymarket has added markets tied to equities, commodities and exchange-traded funds, using price data from blockchain oracle provider Pyth Network as the resolution source to determine outcomes for daily contracts.
The new markets include daily up-or-down and closing price contracts for major equity indexes, commodities such as gold and oil, and a range of US-listed stocks, with outcomes settled automatically based on Pyth’s real-time price feeds. The contracts reset at the end of each trading session.
According to the announcement, the offering includes more than a dozen US-listed stocks, including Tesla, Nvidia and Apple, alongside commodities and equity indices.

By making Pyth the resolution layer for these markets, Polymarket is supplanting manual or exchange-specific references with a standardized data source aggregated from trading firms and market makers.
Zug, Switzerland-based Pyth said it also launched a data interface called Pyth Terminal, where users can track live price feeds and the reference values used to settle markets on Polymarket. Traders can follow a live “price to beat” that updates continuously as markets move.
Polymarket allows users to take positions on the outcomes of real-world events, such as sports, elections, financial markets and weather, with contracts resolving based on whether specific conditions are met.
Last week, Intercontinental Exchange, the parent company of the New York Stock Exchange, said it had completed a $600 million cash investment in Polymarket and plans to acquire up to an additional $40 million in shares from existing holders as part of a broader multibillion-dollar commitment to the platform.

Related: Polymarket fee expansion boosts revenue amid regulatory pressure
Oracles expand beyond crypto into real-world data infrastructure
Oracle networks, which bring offchain data such as prices, foreign exchange rates and commodities onto blockchains, are expanding beyond crypto into financial, government and prediction-based applications.
Their role has begun to extend into official data systems, with Chainlink and Pyth Network selected by US government agencies to publish economic data onchain, including GDP and inflation metrics. The announcement sent the PYTH (PYTH) token up more than 70% on the day, lifting its market capitalization past $1 billion.
The announcement comes as oracle providers are being used to power prediction markets and real-world event data, with RedStone integrating data from the CFTC-regulated platform Kalshi across more than 110 blockchains in October.
They are also playing a growing role in connecting crypto platforms to traditional financial markets. In January, Chainlink said it would roll out 24/5 price data for US equities and ETFs to crypto platforms, enabling trading, lending and derivatives tied to tokenized stocks beyond standard market hours.
The following month, Ondo Finance said it had integrated Chainlink as the data provider for tokenized US equities on its Ondo Global Markets platform, where the feeds are used to support lending and collateralization.
Data from DeFiLlama shows a highly concentrated oracle market, with Chainlink accounting for around 64% of total value secured. Other providers, including RedStone and Pyth Network, hold much smaller shares at around 5% each.

Magazine: AI agents will kill the web as we know it: Animoca’s Yat Siu
10 Scariest Underrated Horror Movies of the Last 10 Years, Ranked

Kirk Cousins Cashes In Again as Raiders Make Questionable Move

Mount Everest Climbers ‘Poisoned’ By Guides In Insurance Fraud Scheme

Smart energy pays enters the US market, targeting scalable financial infrastructure

Why Israel is blocking foreign journalists from entering

Bitcoin: We’re Entering The Most Dangerous Phase

XRP Needs This To Happen **NOW**

Low CIBIL Score Par Phone Finance Milega? | Konsa Financier Approve Karta Hai #armanbakshi #shorts

XRP PRICE GLITCHES ARE SO SPECIFIC? – WHEN YOU GET XRP RICH DO THIS – CRASH BEFORE THE PHOENIX RISES
-

 NewsBeat6 days ago
The Story hosts event on Durham’s historic registers
-

 Sports6 days ago
Sweet Sixteen Game Thread: Tide vs Michigan
-

 NewsBeat8 hours ago
Steven Gerrard disagrees with Gary Neville over ‘shock’ Chelsea and Arsenal claim | Football
-
Entertainment4 days ago
Fans slam 'heartbreaking' Barbie Dream Fest convention debacle with 'cardboard cutout' experience
-
 Entertainment5 days ago
Lana Del Rey Celebrates Her Husband’s 51st Birthday In New Post
-
Crypto World3 days ago
Dems press CFTC, ethics board on prediction-market insider trades
-

 Crypto World1 day ago
Gold Price Prediction: Worst Month in 17 Years fo Save Haven Rock
-

 Tech4 days ago
The Pixel 10a doesn’t have a camera bump, and it’s great
-

 Sports2 days ago
Tallest college basketball player ever, standing at 7-foot-9, entering transfer portal
-

 Tech3 days ago
EE TV is using AI to help you find something to watch
-

 Fashion5 days ago
Amazon Sundays: Soft Spring Layers
-

 Business3 hours ago
No Jackpot Winner and $194 Million Prize Rolls Over
-

 Business1 day ago
Login and Checkout Issues Spark Merchant Frustration
-

 Tech3 days ago
Apple will hide your email address from apps and websites, but not cops
-

 Politics3 days ago
Should Trump Be Scared Strait?
-

 Crypto World3 days ago
U.S. rule change may open trillions in 401(k) funds to crypto
-

 Tech3 days ago
How to back up your iPhone & iPad to your Mac before something goes wrong
-

 Tech3 days ago
Flipsnack and the shift toward motion-first business content with living visuals
-

 Tech4 days ago
Avatar Legends: The Fighting Game comes out in July and it looks pretty slick
-

 Tech5 days ago
Elon Musk’s last co-founder reportedly leaves xAI
You must be logged in to post a comment Login