
Crypto World
A $100 million crypto campaign fund with a pro-Trump vibe has so far failed to show up


The crypto industry demonstrated in the last U.S. elections that $100 million spent on congressional campaigns could influence policy outcomes for the sector, so when an emerging crypto political action committee anonymously promised to bring that amount to the 2026 table, it suggested a significant new (unidentified) voice in digital assets politics.
But the Fellowship PAC never arrived.
A September press release received wide attention last year as a major leap in the industry’s already hefty campaign spending from the more established leading super PAC, Fairshake. Among its backers, the new group was reportedly to include Tether, the global leader in stablecoins with its USDT and more recent push into the U.S. with a separate affiliate and the USAT token, though representatives from the company declined to confirm any connection.
“Unlike past political efforts, the Fellowship PAC’s mission is defined by transparency and trust, ensuring political action directly supports the broader ecosystem rather than narrow or individual interests,” the PAC’s original September release said, seeming to suggest it would plot a different course than Fairshake. The release did not identify any officers, donors or key employees, nor did the PAC’s website.
Fellowship’s announcement credited President Donald Trump with a regulatory framework “that puts America on the path to become the global crypto capital.”
When asked about the involvement of Tether, which established its U.S. division around the same time as the Fellowship unveiling, company spokesperson Alex Welch said this week that the global Tether has no say in the PAC but was silent on whether the U.S. operations had any part in Fellowship.
“Tether International has no affiliation or oversight of Fellowship, so any inquiries can be directed to the Fellowship website and associated email,” Welch said in an email.
Repeated attempts to contact Fellowship went unanswered, though it established the website and an account on social media site X, where its most recent activity was reposting a comment from Tether CEO Paolo Ardoino earlier this month. It also registered as a super PAC with the Federal Election Commission, listing its treasurer as Mitchell Nobel, who directs digital-assets strategy at Cantor Fitzgerald, where Trump’s Secretary of Commerce Howard Lutnick was CEO. That firm has also handled Tether’s assets in recent years.
What Fellowship didn’t do, according to FEC records, was receive any money to operate with. Its current filings show zero funds on-hand.
Under U.S. election law, a PAC can’t be funded by a non-U.S. entity. Foreign money influencing U.S. politics has been a longtime concern, and it’s drawn new scrutiny during the Trump administration, including from those suggesting that Trump-supporting PACs may have improper ties to foreign donors. Political involvement from Tether — if it had emerged — may have attracted further scrutiny, even if confined to its U.S. operations, because such a subsidiary would have to represent that its money was generated domestically and its political decisions weren’t guided by foreign nationals.
Meanwhile, the industry’s top super PAC, Fairshake, has said it has $193 million and that the PAC and its affiliates have begun targeting their first campaigns, seeking to ensure pro-crypto candidates eventually join Congress. In the 2024 cycle, Fairshake — primarily funded by Coinbase, a16z and Ripple — supported more than 50 candidates from both parties who are now in the Senate and the House of Representatives.
Some of the earliest 2026 primaries are fast approaching, meaning any new entrants to political spending could arrive late to the party. It’s unclear whether the midterm congressional elections will yet see Fellowship’s “$100 million commitment to back pro-innovation, pro-crypto candidates who will safeguard America’s role as the global leader in digital assets and entrepreneurship.”


Security researcher Taylor Monahan claims North Korean IT workers have infiltrated more than 40 decentralized finance platforms, with the $280 million Drift Protocol exploit last week being the latest operation tied to the network.
Security researcher Taylor Monahan disclosed Sunday that North Korean agents have been embedded inside more than 40 decentralized finance platforms for nearly a decade. The claim connects the $280 million Drift Protocol exploit last week to a broader network of North Korean IT workers operating inside some of crypto’s largest projects. Monahan attributed the coordinated operations to what security researchers have linked to the Lazarus Group, a state-sponsored hacking organization.
The revelation indicates a sustained infiltration campaign targeting DeFi infrastructure rather than isolated attacks. According to NCC Group research cited in reporting on the matter, similar attack patterns have been attributed to North Korean threat actors operating against the crypto sector for more than a decade. The discovery raises questions about operational security practices across major DeFi protocols and the extent of undetected compromises within the ecosystem.
Sources: Taylor Monahan (@tayvano_) on X | Bitcoinist | NCC Group Research
This article was generated automatically by The Defiant’s AI news system from publicly available sources.
Crypto World
24 Hours Left: Here’s Why Ethereum & Bitcoin Cash Holders are Pivoting to BlockDAG Before April 8

Current markets are flashing contrasting signs. The Ethereum foundation recently locked away 15,000 ETH using specific, steady batches, a move signaling deep institutional faith rather than random noise. Meanwhile, Bitcoin Cash dipped over 6% following heavy whale selling, forcing Bitcoin Cash price prediction experts to frantically revise their support zones. Both events demand close attention.
However, no current market event rivals the opportunity BlockDAG (BDAG) is presenting for a few remaining days. With 300,000+ transactions finished, nearly 2 billion tokens committed to staking, and 100+ active smart contracts live, the momentum is undeniable.
A limited buying window at $0.000016 remains available even as the market value hits $0.40. This isn’t a mistake. This massive valuation gap is tangible, and it vanishes forever on April 8. No second chances exist.
Ethereum Foundation Commits 46M to Bolster Network Integrity
By staking 15,000 ETH in 32-ETH chunks, the Ethereum Foundation has initiated its biggest on-chain move yet. This $46.2 million shift turns stagnant treasury assets into active revenue for ecosystem development grants. Blockchain records reveal the funds originated from the “0xde0” address, which maintains over 270,000 ETH. This indicates a major pivot in how Ethereum manages its capital.
Recent Ethereum news emphasizes that staking fortifies the Beacon Chain, enhancing safety while creating consistent yield. By locking these assets, the foundation connects its own goals with those of the users and the protocol itself. Industry experts view this as high-level institutional involvement.

Analysts monitoring Ethereum news observe that these rhythmic, smaller transfers help mitigate operational hazards. Ultimately, this reflects the organization’s enduring dedication. Current Ethereum news suggests the network is entering a fresh era of expansion.
Bitcoin Cash Faces Volatility Following Major Whale Offloading
As a prominent Bitcoin fork, Bitcoin Cash (BCH) is recognized for swift transactions and minimal costs, functioning as a practical digital asset. Its worth relies on usage, rivalry, tech upgrades, laws, global economic shifts, and trader feelings. Experts frequently utilize Bitcoin Cash price prediction to estimate its growth path, weighing both optimistic and pessimistic market environments.
BCH recently slipped 6.19% to $452.76 after massive whale sales triggered forced liquidations. Even so, its efficiency and purpose keep it significant. Participants are tracking usage data and technical progress to refine their Bitcoin Cash price prediction.

Long-term outlooks evaluate the coin’s potential to hit new peaks, ensuring Bitcoin Cash price prediction remains a vital tool for active market participants.
Secure BlockDAG at $0.000016 Before the Window Slams Shut
Finding the best crypto to buy right now usually involves staring at charts and predicting the future. With BlockDAG, the existing infrastructure proves the point. Millions of blocks are finished. Over 300,000 transactions are done. More than 100 smart contracts are currently operational.
With nearly 2 billion tokens staked and weekly payouts active, this project isn’t asking for belief. It is providing proof, and buyers are flocking to that transparency.The followers created something functional before the valuation soared. Then, the price climbed.
That sequence is vital because it proves the core was solid before the crowd arrived. Real utility led the way, not speculation.The countdown has started. A special entry at $0.000016 is active, sitting significantly under the $0.40 exchange rate. This offer expires April 8.

After that, this price point disappears forever. The public market takes control, and anyone seeking BDAG after April 8 must pay the going rate. There is no middle ground.
A $1 price target is being widely discussed, and at $0.40, that goal seems logical given the established tech. At $0.000016, however, the potential is on another level. Early backers are holding assets that have already gained massive value. New exchange debuts are still pending. April 8 concludes this phase permanently. The only uncertainty is where you will stand once that deadline passes.
Final Thoughts
This week’s Ethereum news highlighted major institutional backing, while Bitcoin Cash price prediction models are being adjusted following significant whale-induced dips. Both stories remain essential for digital asset followers.
Then there is BlockDAG. The tech is ready and running. The users, the activity, and the rewards are established. None of this is just a theory anymore. The only remaining question is whether one takes action before April 8 or remains a spectator.
A $0.000016 price compared to a $0.40 market value is a rare opportunity that people often regret missing. This chance is still here, and it is real. April 8 is final. For those seeking the best crypto to buy right now, the ticking clock is the most persuasive factor.

Presale: https://purchase.blockdag.network
Website: https://blockdag.network
Telegram: https://t.me/blockDAGnetworkOfficial
Discord: https://discord.gg/Q7BxghMVyu
Disclaimer: This is a Press Release provided by a third party who is responsible for the content. Please conduct your own research before taking any action based on the content.

Crypto World
The era of easy money in crypto is over as DeFi yields are failing to compete with a simple savings account
Crypto investors who once turned to decentralized finance for easy passive income through juicy yields are running into a new reality: the numbers no longer add up.
DeFi, or onchain finance, is essentially conducting banking transactions on a blockchain, cutting out middlemen like banks and letting investors borrow, lend, and trade in minutes. Back in 2021-2022 (and even through the subsequent crypto winter), DeFi’s returns were more than promising; rates reached 20% on protocols like Aave and thousands of percent on other emerging protocols, which would justify parking some cash for high interest rates, albeit with a higher risk of hacks, exploits and quick liquidations.
Read more: What is DeFi?
Fast forward to 2026, Aave, the largest DeFi lending protocol by total value locked, is currently offering an APY of around 2.61% on USDC deposits. That sits below the 3.14% offered on idle cash at Interactive Brokers, one of the most popular traditional platforms among crypto-native investors. The gap may not seem huge on paper, but it undermines one of DeFi’s core theses: higher returns for higher risk. Instead, money sitting in DeFi is now facing a higher risk for lower returns.
“DeFi: earn 1% below T-bills and lose all your money one time per year,” wrote trader James Christoph on X on March 22.
That blunt take reflects a broader shift. For years, DeFi sold itself as a place where higher returns justified new kinds of risk. Today, that trade-off looks harder to defend.
Where the yield went
It was not always this way.
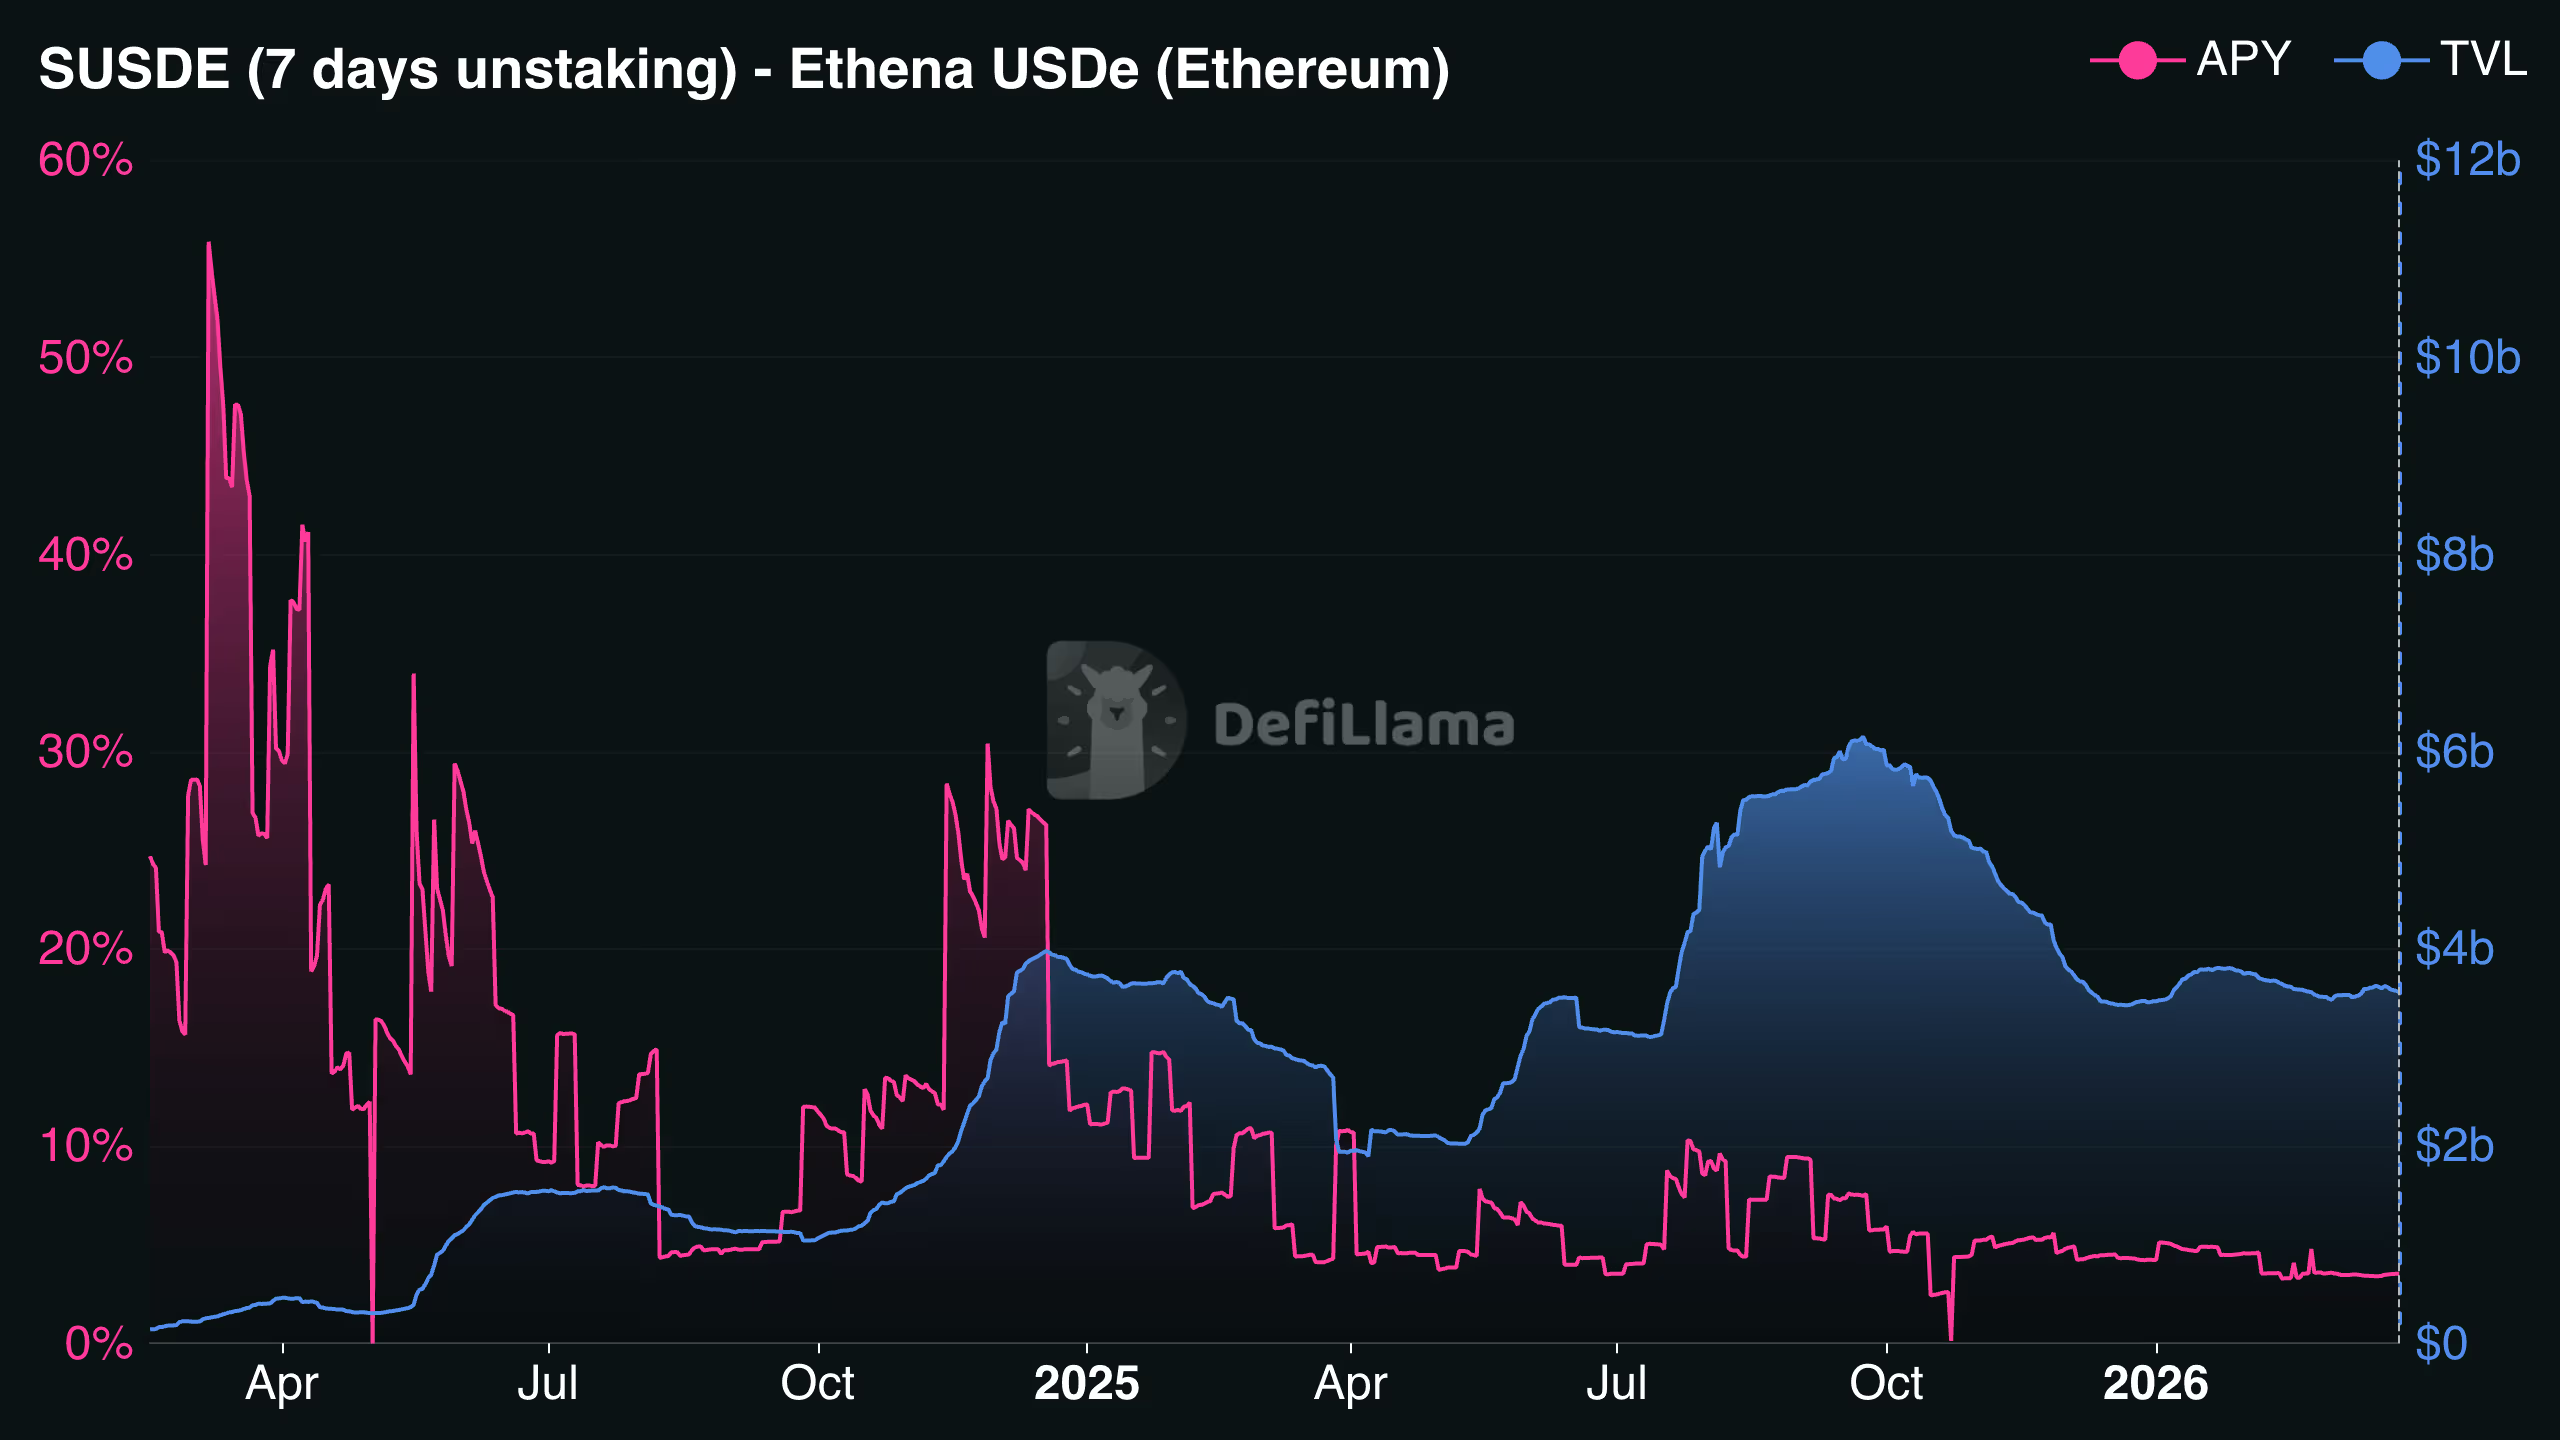
In 2024, DeFi yield looked genuinely competitive. Ethena — a protocol that issues a synthetic dollar stablecoin, USDe, backed by assets and hedged through derivatives positions — saw its sUSDe product offer more than 40% APY at its peak and pulled billions in deposits. But those returns were largely a product of ENA (Ethena’s native token) incentives and trading strategies that didn’t last.

Ethena’s APY has since compressed to around 3.5%, while its total value locked (TVL) has fallen from a peak of roughly $11 billion to $3.6 billion. Ethena didn’t immediately respond to the request for a comment by press time.
The CoinDesk Overnight Rate, which tracks daily borrowing costs across DeFi lending markets, tells the same story — spiking above 35% during the 2023 bull run before collapsing to roughly 3.5% today.

Across the rest of the stablecoin lending market, yields have followed a similar path lower.
Aave’s largest USDT pool yields 1.84%, while several other pools sit below 2%. The extra reward that once boosted returns have largely disappeared. What remains is organic yield driven by borrowing demand, and it is not strong enough to push yields higher.
Data from vaults.fyi shows how far things have fallen. Aave’s two largest stablecoin pools — USDT and USDC on Ethereum — are yielding just over 2% on a combined $8.5 billion in deposits. Lido’s stETH, the largest pool, returns 2.53%, while Ethena’s staked USDe has fallen to 3.47%.
Only a handful of protocols are still beating Interactive Brokers’ 3.14% rates. These are largely private credit products or strategies tied to real-world assets such as Sky’s USDS Savings rate of 3.75%, which has emerged as one of the more attractive refuges in this environment, sitting above the Aave average and drawing $6.5 billion in deposits.
But the rate comes with a caveat: around 70% of Sky’s income derives from offchain sources, including U.S. Treasury products, institutional credit lines, and Coinbase USDC rewards. For investors who came to DeFi specifically to avoid that kind of exposure, the distinction matters.
Aave does still offer more competitive rates on select stablecoins beyond its flagship USDC pool. Its sGHO product currently yields 5.13%, while other options of V3 Core Ethereum include USDG at 5.9%, RLUSD AT 4.4% AND USDTB AT 4.0%. But these sit outside the headline figures that most comparisons focus on.

Paul Frambot, co-founder of Morpho, a lending infrastructure protocol, says this bleak outcome for yields was inevitable.
“Undifferentiated lending converges toward risk-free rates because when every depositor shares the same collateral, the same parameters, and the same outcome, there is limited room for specialization and returns compress,” he told CoinDesk.
Morpho, with over $10 billion in deposits, offers a different model. Its platform lets curators build lending vaults – essentially customized pools with their own risk parameters, collateral choices and yield strategies, managed by specialist teams rather than governed by a single set of rules. Some of these curated vault models can still generate relatively higher yields. Its Steakhouse Prime USDC and Gauntlet USDC Prime vaults are both yielding 3.64%, while one vault, Sentora’s PYUSD offering, is at 6.48%.
Frambot says the difference comes down to how risk is managed. “What makes the vault and curator model different is that it externalizes risk curation and opens it up to real competition,” he said. “That creates an open marketplace for yield, where returns are driven by the quality and differentiation of strategies rather than liquidity alone. That is also why bluechip stablecoin yields on Morpho are on average higher than in pooled models and backed by straightforward collateral like BTC and ETH.”
Still, the yields are nowhere near what they were in previous years.
Aave frames the current weakness as cyclical rather than structural. The protocol points to unusually depressed crypto sentiment – with the Fear and Greed Index below its 2022 lows – as a key driver of reduced borrowing demand, which in turn weighs on deposit rates. “Stablecoin rates on Aave have largely tracked leverage demand,” a spokesperson told CoinDesk. “We do not see them as structurally lower going forward.”
The company also notes that its weighted-average stablecoin deposit yield over the past year has still beaten Interactive Brokers’ top offering, meaning depositors who entered before 2025 would still be ahead today.
‘Really dark’
Lower yields, though, are only part of the story. Confidence across DeFi has also taken a hit.
Balancer Labs, once one of the most recognizable names in decentralized exchange infrastructure, has recently shut down after a $110 million exploit. Governance tokens across the sector are trading at low valuations. For many, it feels like energy has been drained out of the space.
Jai Bhavnani, a prominent DeFi investor, wrote on X that the space is feeling “really dark,” describing the combination of yield compression, protocol shutdowns, and recent exploits as a perfect storm.
“LPs are realizing most protocols are too much risk too little reward,” he wrote. “There is no catalyst on the horizon to change things.”
Some in the same thread pushed back, arguing that market downturns tend to flush out the weakest projects and leave behind only those protocols that can genuinely sustain themselves. This counterpoint has historical precedent; DeFi has survived prior cycles and emerged with more resilient infrastructure. That may be true, but it offers little comfort to investors sitting on compressed returns today.
Then there is smart contract risk, or more precisely, the growing range of risks that smart contract audits cannot catch.
Last month, Resolv, a yield-bearing stablecoin protocol, was exploited for roughly $25 million. An attacker deposited 100,000 USDC into the protocol’s minting contract and received 50 million USR in return, roughly 500 times the expected amount. The issue was not a flaw in the smart contract code itself. Instead, the system lacked basic safeguards such as oracle checks and minting limits.
The protocol now holds $113 million in assets against $173 million in liabilities. USR is trading at $0.13, having lost its $1.00 peg and continuing to tumble into the end of March.
The Resolv hack sits within a broader pattern. Hackers stole more than $2.47 billion worth of cryptocurrency in the first half of 2025 alone, already exceeding all of 2024, according to CertiK’s Hack3d report. Wallet compromises accounted for $1.7 billion of that total. Immunefi CEO Mitchell Amador told CoinDesk earlier this year that onchain code is actually getting harder to exploit, but that attackers are adapting, pivoting to operational failures, stolen keys, and social engineering instead. For example, the more recent $270 million exploit on Drift protocol was part of a social engineering program by North Korea.
For investors weighing up a 2%-3% yield on DeFi against 3.14% at a traditional brokerage, that context is hard to ignore. The extra return that once justified the exposure has largely disappeared.
But the deposit rate comparison only tells part of the story. An Aave spokesperson said: “For borrowers and margin traders, Aave offers much more competitive rates than IBKR — currently 3.2% on Aave vs. up to 6.14% on IBKR. Borrowers on Aave also benefit because their collateral continues to earn yield, further reducing effective borrowing costs compared to IBKR.”
Regulatory ‘Clarity’
On top of compressed yields and persistent security risks, DeFi is now facing a regulatory threat targeting its yield model.
The Digital Asset Market Clarity Act, the crypto industry’s most significant pending legislation, includes a provision that would ban passive stablecoin yield earned simply for holding a dollar-pegged token. That would mean rewards tied to activity, such as payments or transfers, would still be allowed, although the distinction remains unclear. Something that crypto industry insiders who reviewed the draft described to CoinDesk as “overly narrow and unclear.”
Recently, 10x Research’s Markus Thielen said that if the Clarity Act is passed, it could re-centralize yield into traditional finance and regulated products, creating a headwind for DeFi.
Bottom line: the DeFi provisions of the bill remain unresolved, with several Senate Democrats citing concerns about illicit finance. But the direction of travel on yield is clear enough: at a moment when DeFi returns are already struggling to justify the risk, Washington is potentially moving to narrow the options further.
That leaves DeFi in a tight spot. Yields are down. Risks remain. And new rules could limit what returns are left.
For now, the math that once drew investors in is looking much less convincing.
Read more: How North Korea’s 6-month-long secret espionage program has crypto community rethinking security

Ether treasury managers are increasingly looking beyond straightforward staking rewards to extract higher yields, with liquid staking and other active deployment strategies moving into the mainstream playbook. Speaking at ETHCC 2026, Kean Gilbert, head of institutional relations at Lido Finance, highlighted liquid staking as a pathway for treasuries to earn extra returns while maintaining exposure to ETH staking benefits.
In the United States, listed staking products for Ether have proliferated, and public disclosures show treasuries experimenting with a blend of staking approaches. The current landscape includes several exchange-traded or registered products that package staked ETH into visible yields, alongside native staking options. As investors compare these vehicles, the underlying economics remain uneven, with different structures and fees complicating apples-to-apples judgments about potential returns.
Key takeaways
- Liquid staking offers a transferable token that can be deployed elsewhere in DeFi while ETH remains staked, enabling yield-enhancing strategies beyond simple staking rewards.
- Treasury managers are weighing active deployment methods—such as posting ETH as collateral and borrowing against it—as potential sources of higher return relative to passive staking vehicles.
- Public filings show real-world adoption of liquid-staking alongside native staking, with companies reporting notable portions of rewards attributable to liquid-staking activity.
- The U.S. ETF landscape for staked ETH has grown, but reported yields vary across products, and several datasets indicate that direct yield comparisons are not straightforward.
- Analysts emphasize that actively managed treasury strategies offer potential premium through dynamic deployment, even if headline yields on ETFs don’t directly mirror on-chain staking rewards.
Active yield and the logic of liquid staking
Liquid staking, at its core, allows Ether holders to stake their assets while receiving a tradeable token representing their staked position. That token can be used across DeFi protocols, giving treasuries a path to generate additional yield without surrendering staking exposure. At ETHCC 2026, Gilbert framed liquid staking as a viable mechanism for treasury desks to pursue incremental returns by layering on additional strategies on top of the basic staking rewards.
Beyond simply staking, some treasury operations are considering using ETH as collateral to borrow against it, enabling a form of leverage that could boost overall yield if managed prudently. In practice, this means treasuries may activate a range of DeFi primitives—collateralized loans, liquidity provision, and cross- protocol basis trading—to capture returns that passive staked ETH products alone cannot deliver.
“A staked ETH ETF is a passive vehicle. A DAT trading at a meaningful mNAV premium is promising something a passive ETF structurally cannot deliver, which is active, dynamic deployment of spot inventory across opportunities as they arise.”
That perspective comes from Jimmy Xue, co-founder and chief operating officer of Axis, a quantitative yield platform. He adds that the premium reflected in a mutualized treasury’s market value—often described as a market net asset value or mNAV premium—signals investor confidence in a manager’s ability to deploy a treasurer’s ETH treasury across opportunities as they emerge. In his view, basis trading and related strategies can be major yield sources for treasury-oriented products, helping to bridge the gap between simple staking rewards and the full spectrum of deployed yields.
Yield figures and the ETF contrast
The current U.S. ETF lineup for staked Ether includes a set of products that publicly disclose staking economics, but direct comparisons to on-chain staking returns are not straightforward. Among notable offerings are:
- REX-Osprey ETH + Staking ETF, which launched in September 2025.
- Grayscale’s Ethereum Staking ETF and Ethereum Staking Mini ETF.
- BlackRock’s iShares Staked Ethereum Trust ETF, introduced on March 12.
Issuer disclosures reveal varying fee structures and payout assumptions, which complicates simple yield comparisons. For example, Grayscale’s Ethereum Trust pages show net staking rewards around 2.26% as of April 6, while Grayscale’s ETH Staking product page lists about 2.56% as of April 2. By contrast, on-chain native ETH staking yields have hovered around 2.7% to 2.8% per year according to data from Staking Rewards. The discrepancy underscores how ETF mechanics—management fees, hedges, and the timing of reward accrual—shape reported yields even when the underlying staking economics are similar.
As Xue noted, the real value proposition of an actively managed treasury is not simply the headline yield but the ability to deploy capital from spot inventory across opportunities as they arise. This view aligns with the broader market trend of treasury desks seeking to convert passive staking into diversified, yield-enhancing activity through liquid staking and related strategies.
Glass‑door into real-world adoption: Sharplink and BTCS
Public disclosures provide a rare window into how Ether treasuries are actually deploying liquid-staking strategies. Sharplink Gaming, the second-largest Ether holder by reported holdings, disclosed that it had staked 14,516 ETH as of March, generating roughly 30.8 million dollars in staking rewards. Of those rewards, about one-third were attributed to liquid staking, with the remaining two-thirds stemming from native staking, according to a March 1 filing with the U.S. Securities and Exchange Commission. It’s worth noting that Sharplink’s broader 2025 results showed a material net loss—about $734 million—driven by the downturn in the crypto market during the year’s latter half. The filing provides a tangible backdrop to the tension between mark-to-market losses and staking yield, a dynamic that treasury desks must manage in real time.
BTCS Inc., ranked among the larger Ether treasuries by returns, has also integrated liquid staking into its program. The company holds 29,122 ETH and has liquid-staked 4,160 ETH through Rocket Pool nodes, a figure disclosed in a July 2025 SEC filing. That mix illustrates how treasuries blend native staking with liquid staking to diversify revenue streams and preserve liquidity while maintaining exposure to Ether’s yield potential.
Market observers have approached these disclosures with caution, recognizing that each firm’s structure—and the data they publish—reflects unique risk profiles, governance practices, and fee frameworks. Yet the trend is clear: treasury operations are increasingly reporting and quantifying liquid-staking activity as a meaningful component of total yield generation, rather than treating it as a separate, marginal strategy.
Where the space goes from here
As more Ether treasury players disclose their strategies, the debate over what constitutes the best approach will intensify. The ETF route provides visibility and regulatory clarity for investors seeking traditional, paper-traded exposure to staked ETH; liquid staking and other active yield methods offer potential upside through more dynamic management, albeit with higher complexity and counterparty considerations. The field is at a point where the lines between passive exposure and active treasury management are increasingly blurred, and investors are paying attention to who can consistently convert ETH into productive capital deployments.
ETHCC 2026 underscored that the conversation around liquid staking is transitioning from niche experimentation to a standard item on treasuries’ flight plans. For many market participants, the critical question is not only whether liquid staking can outperform passive staking on a headline basis but whether treasury managers can reliably manage risk and liquidity while pursuing higher, more diversified yields.
Looking ahead, investors and builders should watch several developments: the pace at which more treasuries disclose liquid-staking activity; how ETF providers adjust for complexities in yield reporting and fee structures; and how risk management frameworks evolve as treasuries deploy capital across collateralized and leverage-based strategies. If the past year offers a guide, the next chapter of Ether treasury management will hinge on transparent disclosures, prudent risk-taking, and the ability to translate sophisticated yield engineering into durable, risk-adjusted returns.
As the market weighs these approaches, one certainty remains: the sophistication of Ether treasuries is rising, and liquid staking is no longer a niche feature but a core instrument in the ongoing quest to turn ETH in all its forms into productive capital.
Bitcoin (BTC) remains below $70,000 on Tuesday as traders weigh conflicting signals from a dramatic Trump ultimatum on Iran against reports of positive ceasefire talks.
An 8 PM ET deadline set by President Trump for Iran to reopen the Strait of Hormuz has turned Tuesday into a binary event for risk assets.
War Signals Pull BTC in Both Directions
Vice President JD Vance said Tuesday that the war would conclude “very shortly” and that military objectives had been completed.
Meanwhile, a senior U.S. official reportedly told Fox News that Washington is in direct contact with Tehran, describing the talks as “positive” with a possible breakthrough by the end of the day.
However, Trump posted a starkly different tone on Truth Social. He warned that “a whole civilization will die tonight” while claiming “Complete and Total Regime Change” had occurred.
“A whole civilization will die tonight, never to be brought back again. I don’t want that to happen, but it probably will… We will find out tonight, one of the most important moments in the long and complex history of the World,” said Trump.
The post referenced 47 years since Iran’s 1979 Islamic Revolution.
Former White House Communications Director Anthony Scaramucci called the statement a veiled nuclear strike threat.
Skeptics vs. Hawks Frame a Binary Trade
Not everyone reads Trump’s rhetoric at face value. Macro commentator Rational Aussie argued that the escalating language signals weak leverage, not genuine intent.
They predicted Trump would extend the deadline overnight and markets would rally on the reversal, a pattern traders have labeled “TACO Tuesday” for “Trump Always Chickens Out.”
“Trump will Taco…his rhetoric gets increasingly deranged when the worst things are going for him – that’s how he negotiates. He has to make everyone believe he has genuinely lost the plot…He’s trying to create leverage that doesn’t exist by artificially creating what is most scarce: fear of consequence. I fully expect to wake up 8 hours from now to a headline something along the lines of ‘we were so close to giving the orders,” they wrote.
Meanwhile, Iran is not backing down quietly. A senior Iranian source reportedly said that if the situation spirals out of control, Tehran’s allies would close the Bab el-Mandeb waterway.
That Red Sea chokepoint handles a significant share of Europe-bound shipping and is already vulnerable to Houthi disruption.
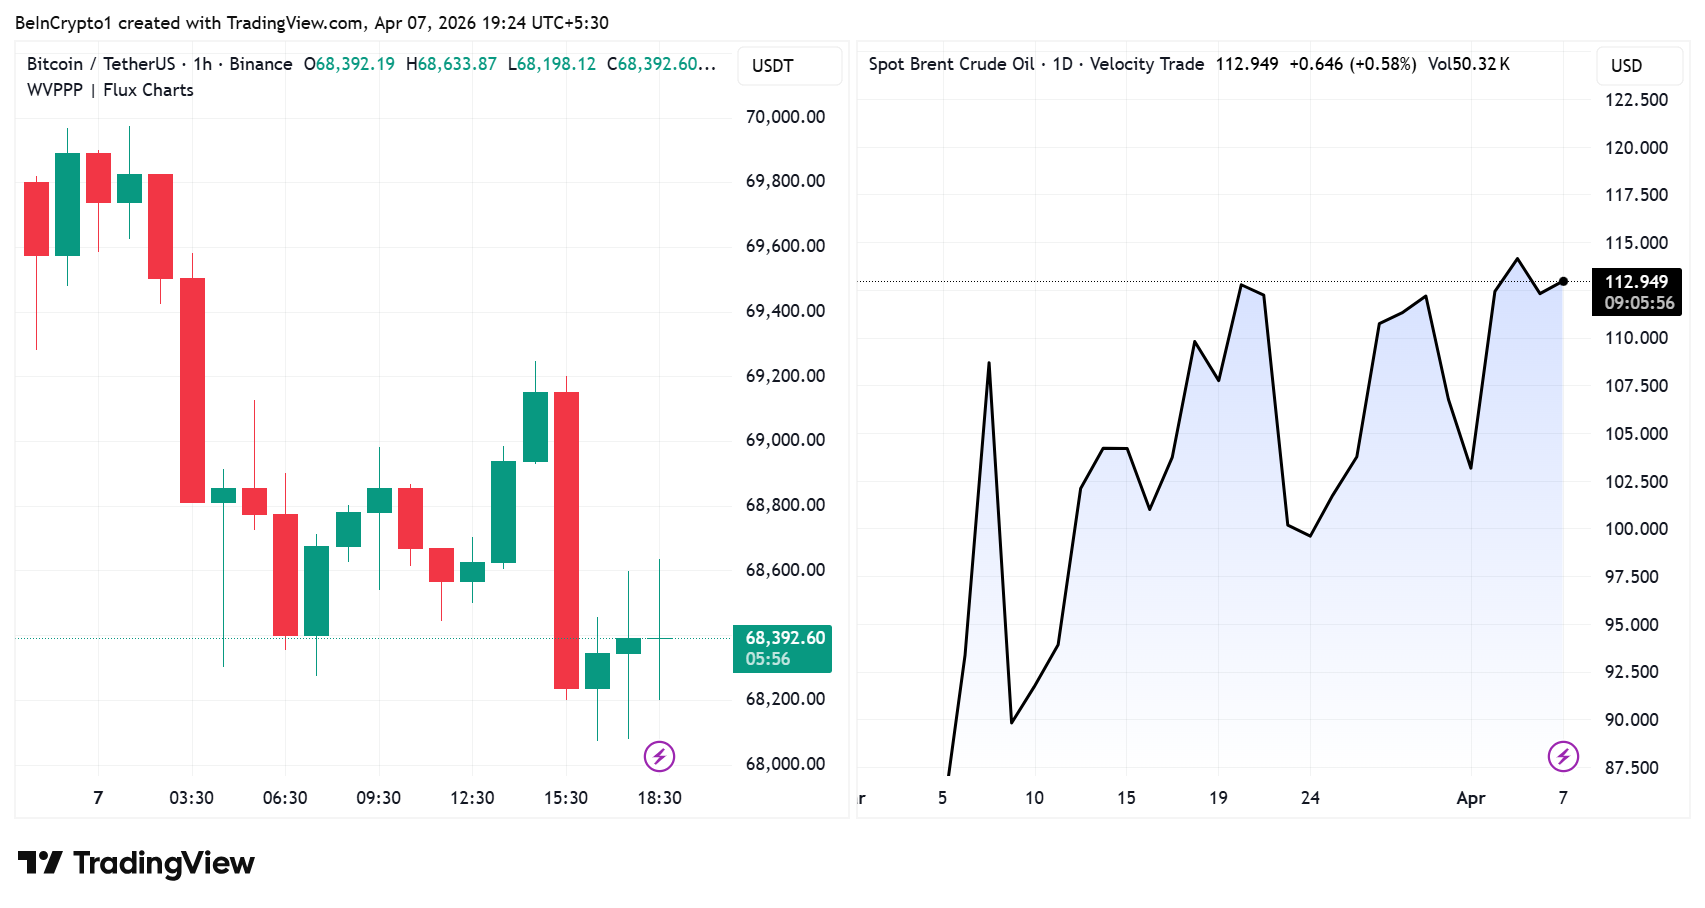
The Strait of Hormuz closure has already removed roughly 20% of global oil supply from the market, pushing Brent crude above $110 per barrel.
A simultaneous Bab el-Mandeb shutdown would compound that shock across energy, fertilizer, and shipping costs.
What Comes Next for BTC
Bitcoin opened Tuesday at $68,860, down 0.2% from Monday. It briefly touched $68,200 before recovering and was trading for $68,392 as of this writing.
The Fear and Greed Index remains deep in extreme fear territory, where it has stayed for over a month.
- If the deadline passes without escalation, the “TACO” thesis holds, and a relief rally becomes likely.
- If strikes on civilian infrastructure proceed, further selling pressure and liquidation cascades could push BTC toward the $66,000 support zone tested last week.
Traders have a few hours left to find out which version of tonight they get.
The post Trump’s Ultimatum Splits Markets Between Nuclear Fear and “TACO Tuesday” appeared first on BeInCrypto.
Crypto World
Swift Advances Dual-Track Strategy for Faster Cross-Border Payments and Tokenized Value

TLDR:
- Swift introduces a dual-track model combining its payment scheme with a blockchain-based shared ledger system
- The framework supports real-time cross-border payments and regulated tokenised value movement across networks
- Major banks like BBVA, BNP Paribas, CaixaBank, and Citi are backing the new retail payments framework
- The system connects over 11,500 institutions, enabling scalable and secure global transaction processing
Swift has outlined a dual-track strategy to reshape cross-border payments, combining its existing infrastructure with a blockchain-based shared ledger.
The approach focuses on improving speed, accessibility, and interoperability while maintaining trusted connections across its global financial network.
A dual-track strategy for modern payments
A recent post shared by Swift on X introduced its evolving payments framework and direction. The message framed the future of payments as a coordinated system rather than a single solution. It described how Swift is building on its established network while adding new digital capabilities.
The first component of this strategy centers on Swift’s payments scheme. This system is designed to deliver faster and more efficient cross-border transactions.
It supports financial institutions that rely on secure and standardized messaging across international markets. As a result, banks can process transactions with reduced friction and improved consistency.
At the same time, Swift is working on a blockchain-based shared ledger. This second track focuses on enabling continuous, real-time payment processing across borders.
The system is also structured to support regulated tokenised assets, which are becoming more relevant in financial markets.
The combination of these two systems creates a parallel structure. Each track addresses different needs while remaining connected.
Traditional payment flows continue to operate, while newer digital rails expand capabilities. This approach allows institutions to adopt innovation without disrupting existing operations.
Swift’s network already connects over 11,500 financial institutions across more than 200 countries and territories. Therefore, any enhancement to its system has a wide reach.
By integrating both traditional and blockchain-based systems, Swift aims to support a broader range of payment use cases.
Banks support framework for retail transactions
Several global banks have joined Swift in supporting the rollout of its updated payments framework. These include BBVA, BNP Paribas, CaixaBank, and Citi. Their participation reflects early adoption of the system in real-world banking environments.
The framework focuses on improving retail transactions, especially cross-border consumer payments. These payments often face delays and higher processing costs. Swift’s updated model aims to address these issues by improving speed and reliability.
Through the payments scheme, banks can continue using familiar systems while gaining efficiency. Meanwhile, the shared ledger introduces new options for processing value instantly. This is particularly relevant for tokenised assets that require constant availability.
The integration of both systems allows financial institutions to test and expand new services. Banks can gradually adopt blockchain-based features while maintaining operational stability. This phased approach reduces risk while encouraging innovation.
Swift’s announcement also pointed users to further details through its official website. The shared post emphasized how both tracks work together rather than compete. It framed the development as a step toward a more connected and flexible financial system.
As global payments evolve, financial institutions continue to explore ways to improve transaction speed and transparency.
Swift’s dual approach reflects this shift by combining established infrastructure with emerging technologies. The framework is structured to support both current needs and future developments in cross-border finance.
The rollout of this model is ongoing, with participating banks playing a key role in implementation. As adoption expands, the system is expected to handle a wider range of payment types. This includes both traditional transfers and digital asset-based transactions.
Swift’s strategy shows how financial networks are adapting to changing demands. By aligning multiple technologies, the organization is positioning its network to handle diverse payment flows in a connected manner.
Onchain stablecoin volume will hit $33 trillion in 2026. That’s the headline figure from a Ripple flyer at XRP Tokyo 2026.
The major XRPL conference takes place on April 7 in Japan. The message to fintechs is clear: stablecoins are no longer optional.
The Stablecoin Pitch to Fintechs
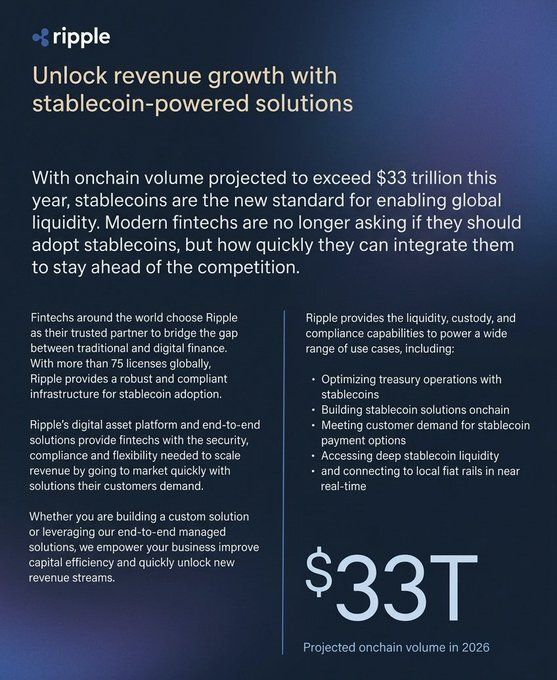
The flyer outlines Ripple’s value offer. It states: “With onchain volume set to exceed $33 trillion this year, stablecoins are the new standard for global liquidity. Modern fintechs no longer ask if they should adopt stablecoins. Instead, they ask how quickly they can integrate them to stay ahead.”
Furthermore, the company calls itself “the trusted partner to bridge traditional and digital finance.” The company holds more than 75 licenses globally. As a result, it offers what it calls a “robust and compliant setup for stablecoin adoption.”
Fun Fact: The $33 trillion figure would make stablecoin volume larger than the GDP of the US and China combined!
Why Ripple and XRP Matter in Japan
Japan has long been one of the most crypto-friendly markets in the world. The country introduced clear regulations early on and continues to lead in adoption. For Ripple, Japan represents a key strategic region.
SBI Holdings, one of Japan’s largest financial groups, has partnered with Ripple since 2016. Together, they formed SBI Ripple Asia to drive blockchain adoption across the region. This partnership gives the company direct access to Japanese banks and financial institutions.
Additionally, Japanese regulators have taken a progressive stance on digital assets. This creates a favorable environment for RLUSD and Ripple’s broader product suite.
As a result, Japan serves as a testing ground for institutional crypto adoption and provides valuable insights into integrating blockchain solutions into traditional financial infrastructure at scale.
XRP Tokyo 2026
XRPL Japan organized XRP Tokyo 2026 with Ripple as the title sponsor. The conference focuses on XRP’s growing role in institutional adoption, RWA tokenization, and DeFi.
Moreover, the company’s presence at the event highlights its continued push into Asia. With 75+ licenses globally and a clear path for RLUSD, Ripple continues to grow its fintech partnerships across the region.
The post Ripple Reveals $33 Trillion Stablecoin Prediction at XRP Tokyo 2026 appeared first on BeInCrypto.


AVAX One signs a no‑upfront‑capex 10MW AI/HPC microgrid deal in Alberta and buys 220 S21 Pro miners, lifting hash rate 33% and formalizing a dual AI infra plus Bitcoin mining strategy.
Summary
- AVAX One Technology (Nasdaq: AVX) signed a FEED proposal for a 10MW AI/HPC microgrid data center in Alberta, led by BlueFlare Energy Solutions, with no upfront capital outlay.
- The facility will use behind‑the‑meter natural gas to power one of Alberta’s first dedicated AI compute centers, while 220 newly purchased Bitmain S21 Pro miners monetize capacity during build‑out.
- The miner buy, executed for under $500,000, lifts AVAX One’s Alberta hash rate by roughly 33%, from about 150 PH/s to more than 200 PH/s, formalizing a dual AI infrastructure and Bitcoin mining strategy.
AVAX One Technology has committed to a 10 megawatt AI and high‑performance computing microgrid data center in Alberta, Canada, tying its turnaround story to the convergence of power‑hungry AI workloads and Bitcoin mining economics. In a statement released via GlobeNewswire, the company said it has signed a Front End Engineering & Design (FEED) proposal with BlueFlare Energy Solutions for a 10MW AI/HPC micro‑grid at the 4‑31 Battery site, describing the facility as “one of Alberta’s first dedicated micro‑grid‑powered AI and high‑performance computing data centers.” The FEED will be conducted “without any upfront capital commitment from AVAX One,” relying on an independent review from one of three pre‑qualified international engineering firms to define technical, regulatory and cost parameters before a final investment decision.
According to AVAX One, the 4‑31 Battery site offers behind‑the‑meter natural‑gas‑to‑power capability, proximity to 138 kV transmission lines, redundant fiber and highway access, giving the project both cheap energy and export optionality. BlueFlare CEO Landon Ruszkowski called the FEED engagement “the first formal step in what we believe will become a landmark AI infrastructure project in Alberta,” emphasizing that the study will set the foundation for a scalable, modular compute build‑out. AVAX One CEO Jolie Kahn framed the initiative in macro terms, saying, “We are launching a strategy that we believe directly aligns with one of the most significant infrastructure‑type opportunities of the coming decade. Demand for AI and high‑performance computing continues to accelerate, while access to power remains the primary bottleneck.”
While the FEED runs in parallel with early site work, AVAX One has bought 220 Bitmain Antminer S21 Pro machines for under $500,000 to immediately monetize available power and stabilize cash flow. The company said the purchase will “increase [its] total hash rate capacity in Alberta by approximately 33%, from roughly 150 petahash to more than 200 petahash,” effectively turning the interim phase of the AI project into a Bitcoin mining expansion. A KuCoin flash note on the announcement highlighted the move as a deliberate “dual‑track strategy of ‘mining + AI computing,’” arguing that rapid monetization of stranded energy can improve the risk‑reward profile of AVAX One’s AI infrastructure build.
Management is now explicitly positioning AVAX One as a hybrid AI infrastructure and Bitcoin mining platform, using low‑cost Canadian natural gas as the common input. “Our goal is to leverage behind‑the‑meter energy and modular data center design to support both AI and digital asset workloads, capturing upside from two fast‑growing, power‑constrained markets,” Kahn said, adding that the FEED structure “allows us to advance a 10MW AI/HPC opportunity without dilutive upfront capital while our mining operations generate cash flow.”
Crypto World
US Spot Bitcoin ETFs Draw $471M as BTC Nears $70K; LiquidChain Pitches Layer-3 DeFi Buildout

U.S. spot Bitcoin ETFs took in $471 million on Monday, marking their strongest single-day inflow since 25 February and helping drive Bitcoin back toward the $70,000 level.
The move points to a renewed pickup in institutional demand even as macro risks remain in focus. Traders are increasingly positioning for a larger volatility event into mid-Q2, with markets also factoring in a steadier interest-rate backdrop and possible easing in Middle East tensions.
As capital returns to crypto, some investors are also rotating beyond Bitcoin into infrastructure projects aimed at addressing blockchain scalability. Among them is LiquidChain (LIQUID), a Layer 3 network targeting high-frequency trading and complex decentralized applications.
Bitcoin had spent weeks consolidating between $65,000 and $68,000, but recent price action suggests sentiment is improving. The $70,000 area, previously viewed as a psychological ceiling, is now being watched as support, while 24-hour trading volume has risen 35% to $52 billion.
Analysts continue to point to a potential supply squeeze as ETF issuers absorb Bitcoin faster than new coins are mined. Michaël van de Poppe (@CryptoMichNL), founder of MN Consultancy, said Bitcoin is showing strength and that the market may be entering a fresh expansion phase.
https://twitter.com/CryptoMichNL/status/204122794227395017641227942273950176
On-chain data has also supported the more constructive view. The Cumulative Value Days Destroyed (CVDD) floor has recently reset, a signal often interpreted as evidence that long-term holders have completed a distribution cycle and that a new floor may be forming.
At the same time, Bollinger Bands on the daily chart are at their tightest levels in years, indicating compressed volatility. Historically, similar setups have preceded moves of 40% or more, leaving traders focused on the likelihood of a sharp breakout rather than continued sideways trade.
Why scalability plays are drawing attention
While Bitcoin remains the market’s primary store-of-value trade, a higher-risk appetite is also benefiting projects tied to network capacity and execution speed. That backdrop has put Layer 3 protocols such as LiquidChain (LIQUID) on investors’ radar.
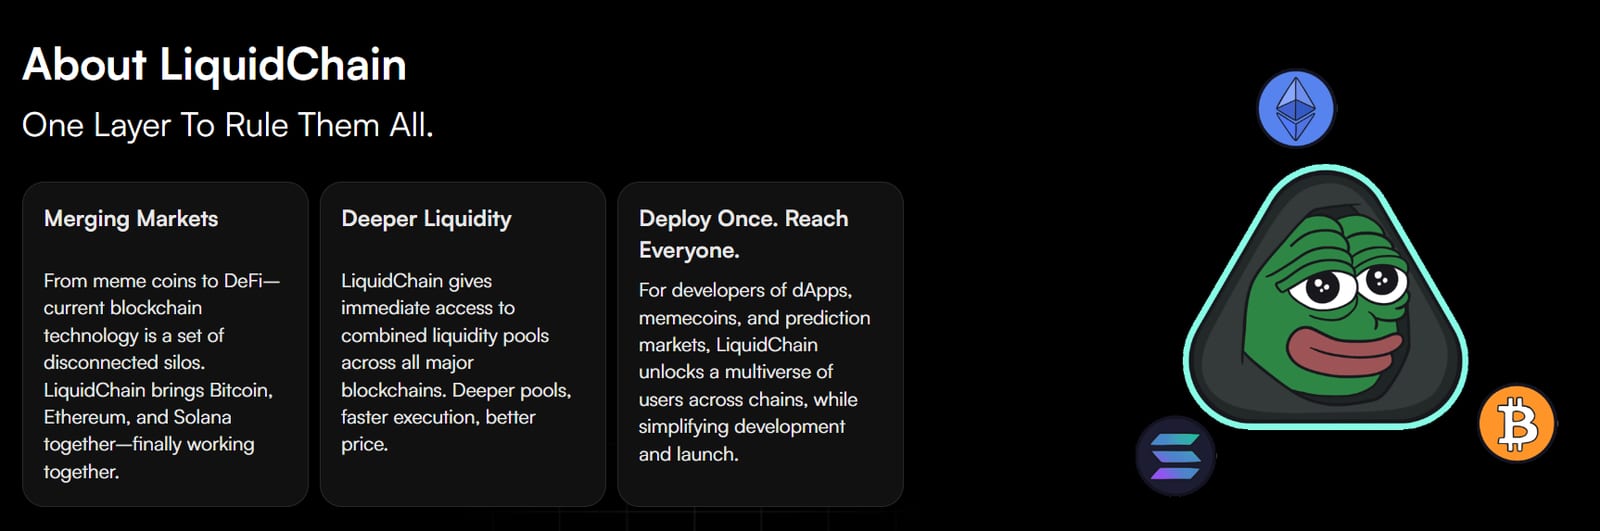
LiquidChain is building a Layer 3 network that sits on top of existing Layer 2 systems, with a focus on decentralized finance and gaming use cases. The project says it aims to connect Bitcoin, Ethereum, and Solana in a unified execution layer spanning the three largest blockchain ecosystems.
According to the project, its infrastructure uses ZK-rollup technology to offer sub-second block times and near-zero gas fees while relying on the security of underlying networks. The architecture is intended to support high-throughput applications that are harder to run efficiently on traditional chains.
The LIQUID token is designed for gas fees, governance, and staking within the ecosystem. LiquidChain says early users can already access staking with rewards of up to 42% APY, while interest has increased ahead of a mainnet launch expected later this quarter. The project also says its community has grown by more than 50% over the past month.
LiquidChain access and staking options
Users interested in the project can visit the official LiquidChain website, connect a supported crypto wallet, and review the available documentation and community resources.
The platform says it supports multiple wallets and offers bridging from major Layer 2 networks. It also points users to the Best Wallet app, available via the Apple App Store and Google Play, for integrated support for ecosystem tokens, including LIQUID.
After acquiring tokens, users can participate in early staking, which the project says currently offers up to 42% APY.
For updates, users can follow LiquidChain on X and join the official Telegram group.
The post US Spot Bitcoin ETFs Draw $471M as BTC Nears $70K; LiquidChain Pitches Layer-3 DeFi Buildout appeared first on Cryptonews.


- Toncoin adoption grows with 87 million Telegram wallet users in the US.
- Market sentiment remains bearish due to altcoin rotation and whale activity.
- The resistance at $1.28 will likely define Toncoin’s short-term price movements.
Toncoin (TON), the native token of the TON blockchain, has been in the spotlight recently due to the ongoing Sub-Second mainnet activation and its integration with Telegram’s massive user base.
💎 The Sub-Second mainnet activation starts now!
TON Core has just shared the completion of the Bug Bounty & stated that changes were already implemented. Now they are moving to the next stage – Sub-Second Mainnet activation.
For additional reliability, activation will be… pic.twitter.com/ddSdwXDnYM
— TON 💎 (@ton_blockchain) April 1, 2026
The upgrade, which is scheduled to run from March 31 to April 12, is set to improve the network’s speed, efficiency, and scalability, which could impact Toncoin’s adoption and market behavior.
However, despite its technological potential, Toncoin has faced a challenging market environment in recent months.
Currently, TON coin trades around $1.23, down about 2.5% over the past 24 hours.
This underperformance is largely linked to a broader trend in the crypto market known as altcoin sector rotation, where investors move their capital from higher-risk altcoins into more stable assets.
The Altcoin Season Index, which measures market interest in altcoins, has dropped significantly, highlighting the cautious sentiment among traders.
This environment has made it difficult for Toncoin to break out from its current range, despite ongoing development progress.
TON adoption and ecosystem growth
TON’s growth is closely tied to its adoption within Telegram, which now supports over 87 million active users in the United States with its self-custodial TON Wallet.
This wallet allows users to transfer and stake Toncoin directly within the messaging app, offering a seamless on-ramp for millions of potential users.
Such integration provides Toncoin with a unique advantage, as it could benefit from network effects far faster than many other Layer-1 blockchains.
On-chain activity supports this potential, with Toncoin showing consistent daily usage.
According to available data, the network records hundreds of thousands of active wallets and millions of daily transactions.
This suggests that while Toncoin’s price has been stagnant, actual usage is steadily growing, signaling a foundation for long-term adoption.
However, a significant portion of the token supply, around 68%, is held by whales.
This concentration increases the risk of large sell-offs, making sudden price spikes less predictable.
Toncoin technical analysis
Toncoin presents an intriguing case of technological potential versus market sentiment.
Its integration with Telegram gives it a unique edge, and the Sub-Second mainnet activation may improve network performance, but short-term price action remains uncertain.
From a technical perspective the short-term support lies near $1.02, with a secondary floor around $0.81.
If the price rebounds following the Sub-Second mainnet activation, the immediate resistance sits at $1.34, followed by higher resistance levels at $1.50 and $1.90.

Historically, a break above $1.28 has always meant momentum for higher price ranges.
But while the Sub-Second mainnet activation could provide a short-term positive driver, the token’s price is still largely influenced by broader market conditions rather than project-specific developments.
On the downside, analysts highlight that failure to hold the $1.20 level could lead to tests of the yearly low around $1.10, especially if broader altcoin rotation continues.

‘Dune 3’ Is Already Sold Out 9 Months Before Release
EastEnders legend Michelle Collins posts from hospital in a wheelchair after nasty injury

Streaming Giant Powers Ahead With AI, Free Channels and Profitability


-

 NewsBeat5 days ago
Steven Gerrard disagrees with Gary Neville over ‘shock’ Chelsea and Arsenal claim | Football
-

 Business5 days ago
No Jackpot Winner and $194 Million Prize Rolls Over
-

 Fashion4 days ago
Weekend Open Thread: Spanx – Corporette.com
-

 Crypto World6 days ago
Gold Price Prediction: Worst Month in 17 Years fo Save Haven Rock
-

 Business2 days ago
Three Gulf funds agree to back Paramount’s $81 billion takeover of Warner, WSJ reports
-

 Business3 days ago
Expert Picks for Every Need
-

 Sports3 days ago
India men’s 4x400m and mixed 4x100m relay teams register big progress | Other Sports News
-

 Business6 days ago
Login and Checkout Issues Spark Merchant Frustration
-

 Sports7 days ago
Tallest college basketball player ever, standing at 7-foot-9, entering transfer portal
-

 Crypto World7 days ago
Bitcoin enters the public bond market as Moody’s gives a first-of-its-kind crypto deal a rating
-
Crypto World7 days ago
Bitcoin stalls below key resistance as technical signals skew bearish
-

 Tech5 days ago
Commonwealth Fusion Systems leans on magnets for near-term revenue
-
Business2 days ago
No Jackpot Winner, Prize to Climb to $231 Million
-

 Politics7 days ago
Starmer’s centre has collapsed, and the left was right all along
-

 Crypto World6 days ago
Ripple rolls out enterprise crypto treasury platform for corporates
-

 Fashion1 day ago
Massimo Dutti Offers Inspiration for Your Summer Mood Board
-
Crypto World7 days ago
AI Memory Rout Wipes 9% Off Nvidia Stock: Chart Says More Pain Ahead
-

 Crypto World6 days ago
Why It’s Partnering, Not Issuing
-
 Sports7 days ago
How to teach yourself the perfect impact position with every club
-
Sports6 days ago
Tom Pelissero Drives the Final Nail in the Coffin
You must be logged in to post a comment Login