
Crypto World
A 99.93% loss, and are DAOs done?

Welcome back to Inside DeFi
Today’s edition looks at a gung-ho swap which lost the user almost $50 million. It seems multiple warnings can’t save the kind of madman who’s prepared to swap such size from a mobile-based hot wallet.
We also take a look into the move away from DAOs, and finish up with some short snippets from the security space.
Technical difficulties in the Aave sphere
On Thursday, one spectacularly unlucky (or gung-ho) user took a 99.93% loss on a low liquidity $50 million trade.
They swapped $50 million of (Aave-wrapped) USDT to just $35,000 of (Aave-wrapped) AAVE. The trade was made via Aave’s controversial CoW Swap integration which kicked off a months-long governance battle in December.

Read more: Aave Labs faces backlash over CoW Swap integration
That said, swapping such a large sum in a single transaction, apparently from a phone, and after having accepted price impact warnings, doesn’t exactly scream “bulletproof opsec practices.”
While both CoW Swap and Aave have pledged to return the fees, it’s a very small dent in an enormous loss.
Aave founder Stani Kulechov detailed the UI warnings the user ignored, but recognized the result was “far from optimal.”
He also admits the industry needs “additional guardrails… to better protect users.”
Justifying why such swaps aren’t blocked, CoW Swap said, “Preventing users from making trades… can lead to terrible outcomes in some situations (e.g. a market crash).”
Former governance delegate Marc Zeller was quick to rub some salt in the wound. He also pointed out that the loss wouldn’t be possible on the previous swap tool, which Aave Labs replaced.

Read more: Across Protocol accused of looting DAO treasury of $23M
It’s clear who the loser is in this debacle – the one who lost $49,965,000. But the big winners were the MEV bot backrunning the trade and Titan Builder, which apparently made a total of $34 million in tips, sent straight to Coinbase.
The loss wasn’t the only technical glitch in the Aave-sphere this week. Almost $27 million was liquidated the day before due to a faulty update of Chaos Labs’ Correlated Asset Price Oracle.
Are DAOs done?
Now that Aave Labs has flexed its voting power over the DAO, others are taking note.
Across Protocol has proposed ditching the DAO, in favor of a “US C‑corp, via a token-to-equity exchange and token buyout.”
The thinking is that a change in governance will lead to “clearer accountability, faster execution, and a structure that can scale ops, partnerships, and product development over time.”
Co-founder Hart Lambur said “tokens are undervalued and underappreciated… the reality for Across is that having a token generally hurts more than it helps.”
The post goes on to state that the firm’s future focus will be stablecoins and “agentic payments.”
While others are rushing to tokenize equity, Across seems keen on doing quite the opposite.
Sky, formerly Maker DAO, is another (not so explicit) example of centralizing governance, albeit over a longer timeframe.
While some lament the perceived capture of one of DeFi’s longest-established DAOs, it seems to be working for the protocol, economically speaking.
Revenue within each DeFi vertical is concentrated into just one or two winners, as DeFiLlama’s 0xngmi points out. Many of those getting left behind are dropping like flies, or being forced to make tough decisions.

Read more: Across Protocol accused of looting DAO treasury of $23M
The chart comes from an article by Joel John of Decentralisedco, and questions the purpose of tokens. It notes that, while DeFi revenues have grown enormously, “most protocols lack a mechanism to return value to token holders.”
To be useful to holders, tokens must provide “claims to economic activity and the ability to guide governance.”
In cases where one or both of these aren’t in the interests of those holding sway over governance power, we may see more projects tearing off the DAO mask in the weeks and months to come.
Security snippets
A bite sized breakdown of some of the week’s security news.
The ongoing wave of front-end attacks continued to hit popular DeFi projects’ websites this week. Lending protocol Compound Finance and Solana memecoin launchpad BONK.fun were both affected.
No losses were found in relation to the former, while Bubblemaps found $20,000 was lost to the latter.
A SlowMist security researcher, who goes by “23pds,” shared a deep dive into a (possibly North Korean) campaign targeting a range of crypto companies’ supply chains, “from staking platforms, to exchange software providers, to the exchanges themselves.”
The hackers were successful in “exfiltrating proprietary exchange software containing hardcoded secrets.”
Security firm Cantina’s CEO, Hari Mulackal, examined the pressures facing the crowdsourced security model. He says security researchers, customers, and platforms all “hate it.”
In addition to problems with subjective bug severity and costs, Mulackal cites AI, which is “starting to be genuinely useful at finding bugs,” as a growing threat.
To combat endless submissions of slop bounty reports, a staking/penalty system or charge to submit bugs may provide reviewers some respite.
The post came in response to a security researcher’s claim that they “Lost $120K + 1st Place to an AI.”
Read more: DeFi, meet Claude: Moonwell’s ‘vibe-coded’ oracle in $1.8M blowup
Cosmos Labs published an investigation into the root cause of January’s $7 million hack of SagaEVM. The vulnerability was found to affect a number of chains built on the Cosmos EVM stack, specifically those which had used the “ICS20 precompile.”
The report explains that, “under certain execution conditions,” the vulnerability “could allow repeated use of the same token balance within a single transaction.” Affected networks were advised to disable the vulnerable precompile before a permanent fix was deployed.
A price cap oracle mishap saw $27 million in wstETH liquidated on Aave on Tuesday. While the incident isn’t exactly a blackhat exploit, more a failure of Chaos Labs’ code, oracle attacks have seen a recent uptick.
To finish off, in the latest installment of AI behaving badly, one of Alibaba’s research AIs allegedly cryptojacked itself.
The agent broke out of the “bounds of the intended sandbox,” triggering security alerts.
It had hijacked GPU capacity assigned for its own training, repurposing the compute to mine cryptocurrency.
— Jake Harrison


James Wynn, the high-leverage crypto trader known for turning $7,600 into $25 million on PEPE, warned traders that markets will deteriorate further before recovering. Wynn outlined a multi-asset defensive strategy, shorting US equities and going long on oil while selectively buying Bitcoin (BTC) dips with spot capital.
All these is amid the US President Donald Trump’s fiery geopolitical message on Sunday against Iran and the Strait of Hormuz.
James Wynn’s Macro Bets and the Iran Factor
The trader’s positioning reflects a broader macro thesis tied to geopolitical escalation. James Wynn said he is short the S&P 500 and Nasdaq, long on WTI crude oil, and accumulating BTC on pullbacks.
He also flagged positive expected value in the Singapore dollar, Chinese yuan, euro, and British pound. He expects gold to hold its price or reach new all-time highs soon.
On real estate, Wynn acknowledged his own exposure to the sector, calling it a losing position while stressing the importance of diversification.
His strategy aligns with the current geopolitical environment. President Donald Trump gave Iran a 48-hour ultimatum on Truth Social, threatening to strike power plants and bridges if Tehran does not reopen the Strait of Hormuz by Tuesday.
Iran has kept the Strait effectively closed since the US-Israel military operation began on February 28, disrupting roughly 20% of the world’s oil supply.
Low Liquidity Wicks and Liquidation Hunts
Separately, James Wynn warned about Bitcoin price action. He flagged a Sunday manipulation wick on BTC that occurred during low trading volume, calling it further proof of what is coming next.
“Another classic low-volume manipulation wick on Bitcoin on a Sunday further proves what’s about to come,” he indicated.
Indeed, a $1,000 BTC price pump within 10 minutes on Sunday liquidated $28 million in short positions in a single hour, amid continued low-liquidity leverage hunting.
BTC is trading near $67,201 as of this writing, with the Fear and Greed Index stuck at 12, deep in extreme fear territory. The token has held a $65,000 to $73,000 range for weeks despite sustained bearish sentiment.
With Trump’s self-imposed Tuesday deadline approaching and oil prices hovering above $100 per barrel, the macro backdrop for risk assets remains volatile.
The post James Wynn Reveals His Defensive Play Amid Trump’s Fiery Iran Message appeared first on BeInCrypto.


Polymarket has removed a betting market tied to the rescue of U.S. service members in Iran, after intense backlash and criticism from lawmakers this weekend.
The market allowed users to wager on when the U.S. would confirm the rescue of two airmen after an F-15E fighter jet was shot down over Iran. The crew members have since been rescued.
Rep. Seth Moulton, a Democrat from Massachusetts, criticized the listing in a post on X, calling it “disgusting” and arguing it reduced a military rescue effort to a financial trade.
Moulton has taken a hard line on prediction markets, recently banning his staff from using platforms such as Polymarket and Kalshi over concerns that financial incentives could influence policy decisions.
A Polymarket spokesperson said the listing did not meet its integrity standards removed shortly after it appeared. The company added that it is reviewing how the market passed internal safeguards.
The incident comes as prediction markets face rising pressure in Washington. A group of congressional Democrats last month introduced legislation that would ban contracts tied to elections, war and government actions.
Separately, several senators have urged the Commodity Futures Trading Commission to prohibit markets linked to individual deaths, citing national security concerns.
Regulators are also asserting authority over the sector. The CFTC said this week it filed lawsuits against three states over efforts it believes attempt to bypass federal oversight of prediction markets.
Industry scrutiny has expanded beyond politics. The NFL has asked operators to avoid offering contracts it views as objectionable or open to manipulation, including bets tied to officiating decisions or events known in advance.
Still, the market is expanding. Kalshi has late last month secured a license to offer margin trading to institutional investors, while new players are entering the market. Among them is JPMorgan, whose CEO, Jamie Dimon, has signaled that it is looking to enter the fray.

Latest Acquisitions Drive Overall Holdings To Greater Heights
The recent purchase comes after a huge one announced last week. Bitmain has already accumulated more than 71,000 ETH, boosting total holdings to more than 4.7 million ETH. It now holds nearly 4 percent of the total Ethereum supply. The company still aims to own five percent of Ethereum’s supply in the market. In addition, the strategy signals a long-term accumulation plan that targets market positioning. The aggressive buying has, however, exposed it to price volatility.
Statistics indicate that Bitmain has a large unrealized loss on its Ethereum investment at present. The average purchase price is above current market rates, which has impacted portfolio value. This puts the firm under pressure as market conditions remain uncertain. Since the beginning of the year, Bitmain’s stock has fallen more than 30 percent. Nonetheless, it posted a small profit in the last week along with a slight uptick in Ethereum’s price. Moreover, this movement suggests a more favorable mood even amid ongoing geopolitical threats.
According to Tom Lee, the company will continue purchasing at current levels despite the unstable markets. He explained that the plan rests on optimism about the broader economic outlook. Therefore, current pricing is seen as an opportunity rather than a risk for the firm. Lee noted that present oil prices are lower than historical highs when adjusted for inflation. He compared current levels with those observed in previous market cycles. He added that this analogy supports the belief that the economy can sustain higher energy prices.
Notably, the leading cryptocurrencies have remained relatively stable even amid geopolitical tension. Both Bitcoin and Ethereum have avoided further losses during the recent conflict period. Consequently, Bitmain is still consolidating its assets in line with the long-term plan.

Bitcoin price now reflects capital inflows over halving cycles. Institutional adoption reshapes Bitcoin’s long-term market behavior. Credit systems and banks now influence Bitcoin growth trajectory. Bitcoin traded near $68,000 as market structure signals a major shift in price drivers. Michael Saylor said the four-year cycle no longer defines market behavior. He added that capital flows now guide Bitcoin’s direction across global financial systems.
For years, traders linked price growth to halving events that reduced mining rewards. Saylor now rejects that model and points to structural market evolution. As a result, Bitcoin’s role continues to expand beyond its early speculative phase.
Institutional adoption continues to reshape demand patterns across regulated financial platforms. Large firms now integrate Bitcoin into treasury strategies and financial products. Consequently, the asset reflects broader economic forces instead of isolated supply shocks.
Capital Flows Replace Halving Cycles
Saylor emphasized that capital movement now determines Bitcoin price trends in modern markets. He linked this shift to increased access through banks and digital credit systems. Liquidity conditions now influence price behavior more than programmed supply changes.
Financial institutions have expanded Bitcoin access through structured investment products. These platforms allow broader participation from corporate and traditional finance sectors. As a result, capital inflows and outflows now drive short-term and long-term price movements.
Analysts now focus on fund allocation trends rather than historical halving timelines. This shift reflects a deeper connection between Bitcoin and global financial systems. Consequently, Bitcoin responds more directly to macroeconomic conditions and liquidity cycles.
Institutional Adoption Redefines Market Structure
Traditional finance has increased its involvement in Bitcoin through custody, trading, and reserve strategies. This participation has improved liquidity while stabilizing extreme price swings over time. Institutional demand now plays a central role in shaping market direction.
Companies continue to build services that integrate Bitcoin into regulated financial ecosystems. These developments expand access and improve trust among large-scale participants. Bitcoin gains recognition as a global digital capital asset across multiple sectors.
The asset now appears in portfolios alongside traditional financial instruments. This integration reflects growing acceptance across banking and corporate environments. Consequently, Bitcoin’s valuation aligns more closely with broader capital market dynamics.
MicroStrategy Strategy Fuels Ongoing Debate
MicroStrategy remains a focal point in discussions about institutional Bitcoin accumulation strategies. The company built a large Bitcoin position through consistent and aggressive purchases. Therefore, it holds a unique position within the evolving digital asset landscape.
Market commentator Adam Livingston noted that early accumulation created a strong competitive advantage. He suggested that replicating such a strategy now requires significantly higher capital. As a result, few firms can match the company’s scale and timing.
At the same time, this approach continues to influence corporate treasury strategies worldwide. Firms now evaluate Bitcoin as a reserve asset within diversified portfolios. Consequently, MicroStrategy’s model remains central to discussions about institutional adoption.
Michael Saylor, Executive Chairman of Strategy (MicroStrategy), hit back at Peter Schiff after the goldbug posted data suggesting Bitcoin (BTC) had lagged gold, silver, and equities over five years.
The exchange reignited a long-running public feud between two of the loudest voices on opposite sides of the Bitcoin-versus-gold divide.
Schiff’s Five-Year Window and Why It Matters
Schiff highlighted Bitcoin’s measly 12% gain over the past five years, comparing that figure to the NASDAQ’s 57.4% gain, the S&P 500’s 59.4% rise, gold’s 163% surge, and silver’s 181% rally.
“If the appeal of Bitcoin is its superior long-term performance, why should anyone keep HODLing it?” posed Schiff.
The five-year window he cited begins near April 2021, when BTC traded close to its then all-time high of approximately $69,000.
That starting point captures both the 2022 crypto crash and the slower 2024-2026 recovery. As of this writing, BTC trades for $66,847.
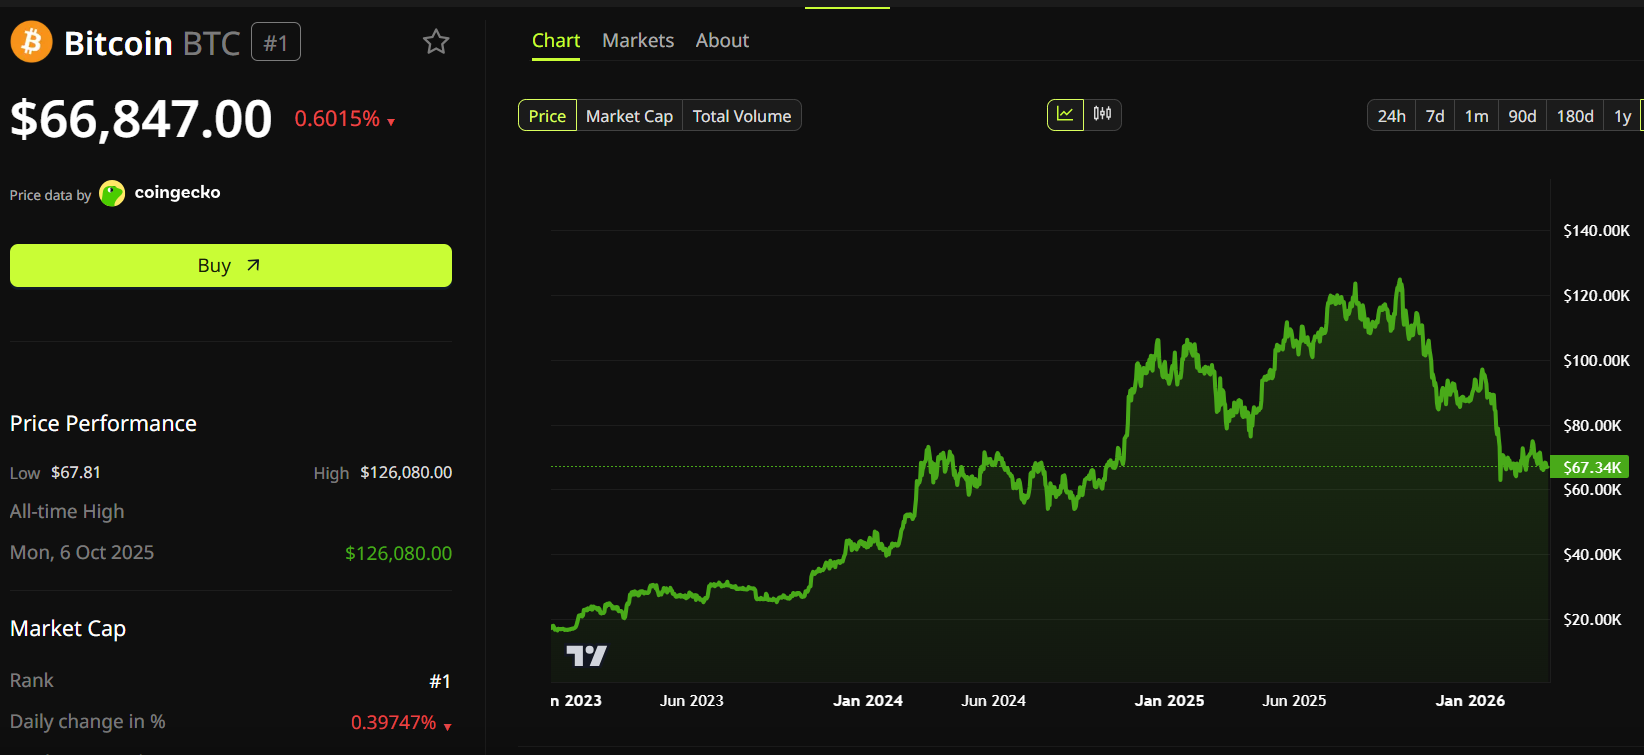
Gold, meanwhile, has surged above $4,700 per ounce. That represents a gain of over 160% from its April 2021 level near $1,780, confirming Schiff’s figures.
The precious metal hit an all-time high of $5,602 in late January 2026 before pulling back amid broader macro volatility tied to the Iran conflict and rising inflation expectations.
Schiff followed up with a separate post targeting Strategy directly. He noted that MSTR stock had outperformed the NASDAQ, gaining 68.5% over five years, but argued the rally had nothing to do with BTC’s performance.
“It’s due to investors’ willingness to overpay for MSTR so Saylor could keep overpaying for Bitcoin. Sell MSTR before it crashes,” warned Schiff
Saylor Responds With Annualized Returns
However, according to Michael Saylor, Schiff’s analogy is flawed. Saylor measured Bitcoin’s performance from August 2020, the month Strategy began its corporate BTC treasury strategy.
With this, the Bitcoin believer highlighted BTC annualizing at 36%, compared to 16% for gold (GLD), 15% for the Nasdaq-100 (QQQ), 14% for the S&P 500 (SPY), 5% for real estate (VNQ), and negative 1% for bonds (BND).
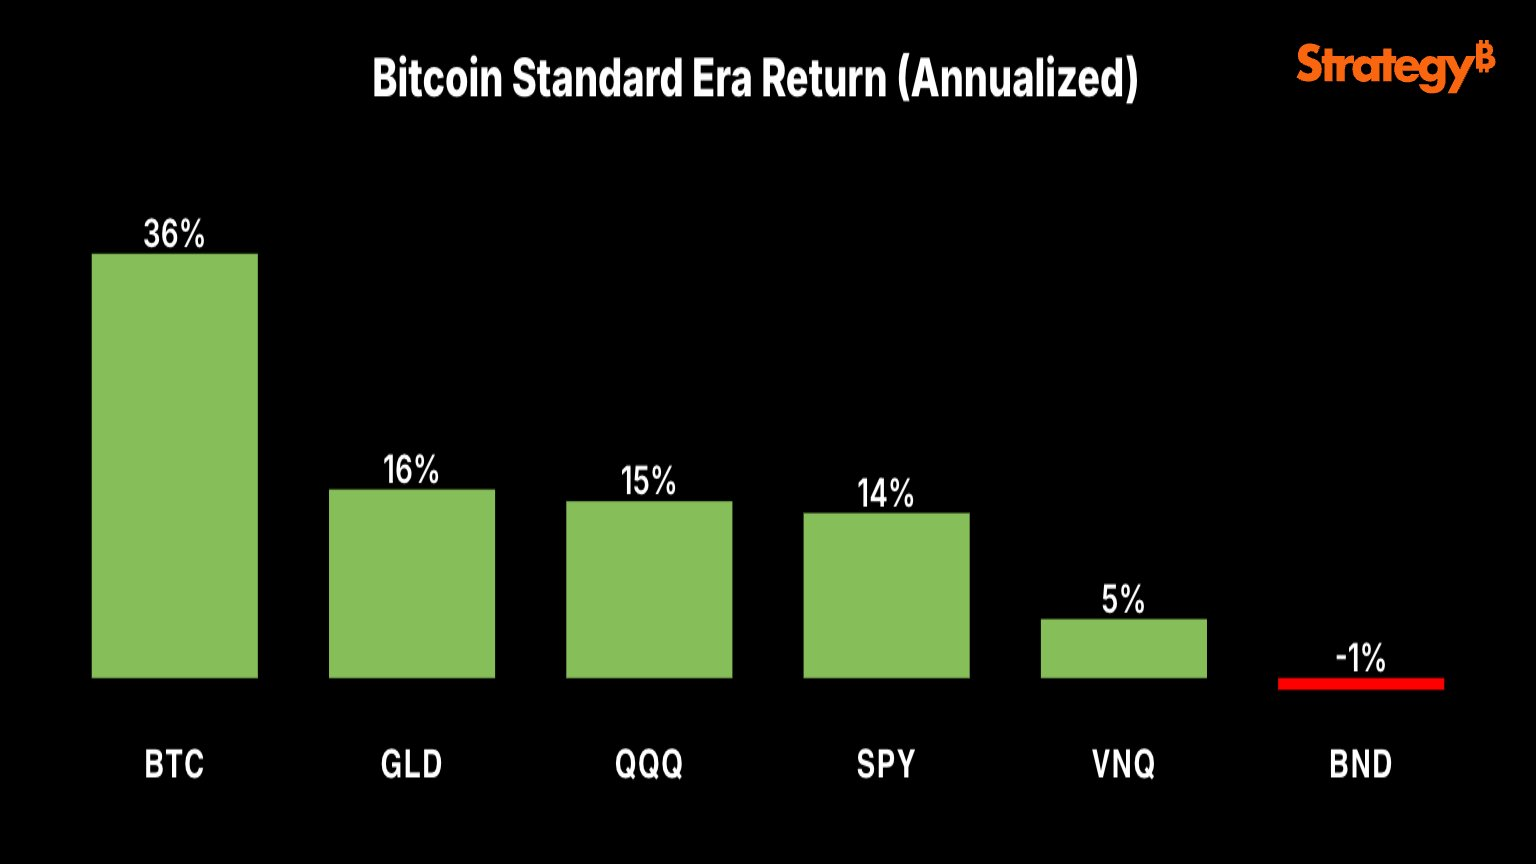
“Timeframes matter. Since Aug 2020, Bitcoin has been the top-performing major asset, and it’s not even close. Zoom out further, and the gap only widens,” Saylor challenged.
Strategy held 762,099 BTC as of this writing, making it the largest corporate holder of the cryptocurrency. The company acquired its holdings at an average price of roughly $75,699 per coin, putting its position below break-even at current spot prices.
A Familiar Feud With Higher Stakes
The Schiff-Saylor rivalry has become a recurring feature of crypto commentary. Schiff has called Strategy’s business model a “fraud” and predicted the company would eventually go bankrupt.
In December 2025, he challenged Saylor to a public debate at Binance Blockchain Week in Dubai. Saylor did not accept.
However, Schiff and CZ, the founder and former CEO of Binance, recently debated on the same topic, Bitcoin versus gold, with the outcome exposing a core divide between gold-backed stability and crypto innovation.
The post Michael Saylor Exposes the Fatal Flaw in Peter Schiff’s Anti-Bitcoin Argument appeared first on BeInCrypto.
Crypto World
Bitcoin Price Prediction: OCC Grants Crypto Bank Charter as Pepeto Targets 100x While ETH and XRP Hold

Bitcoin price prediction shifted this week after the OCC granted conditional approval for the biggest US crypto exchange to become a federally regulated trust bank, pulling digital assets deeper into the traditional banking system.
While the wider market has cooled with major coins pulling back, Pepeto stands out as the top presale entry with its Binance listing getting closer every day.
With a working exchange already live and $8.68 million raised, Pepeto combines real technology with a presale that analysts see running 100x once the listing opens, making it the play that the next rally is about to reward.
The OCC gave Coinbase conditional approval for a national trust bank charter on April 2, placing the largest US crypto exchange under direct federal oversight, according to CoinDesk.
The charter lets Coinbase handle custody services across all 50 states under one set of rules instead of juggling separate state licenses, according to Bitcoin Magazine. Pension funds and sovereign wealth funds often need bank-grade oversight before moving capital into crypto, and this approval knocks down one of the last walls.
The biggest stamp of trust in crypto history just dropped, and the presale entries set to ride that wave are where the real gains live.
Pepeto: The Presale Where 100x Lines Up as the Bitcoin Price Prediction Turns Bullish on Federal Backing
While the CLARITY Act sits stuck in committee, the direction is obvious, and sharp traders are hunting for the best entries to catch the recovery forming underneath.
Pepeto ranks near the top because a live exchange with $8.68 million committed and a Binance listing closing in gives it everything needed to stand as one of the best plays of 2026.

The math speaks for itself. At $0.0000001862, analysts see 100x once the Binance listing opens. The person who created the original Pepe token, which hit $11 billion on hype alone, built this exchange with a veteran from Binance’s listing team. Every swap runs through PepetoSwap at zero cost, every cross-chain move between ETH, BNB, and Solana lands at full value, and every token gets flagged for scam patterns before your capital touches it, all verified clean by SolidProof.
What drives Pepeto daily is real utility, and 188% APY staking grows every position while the listing window gets tighter. The entries that turned early believers into millionaires in past cycles all shared one trait: they found a working project before the crowd showed up, and Pepeto at presale pricing is that exact setup right now.
Ethereum (ETH)
ETH trades at $2,041 per CoinMarketCap, holding just above the $2,000 floor as the broader rally has not yet carried altcoins higher.
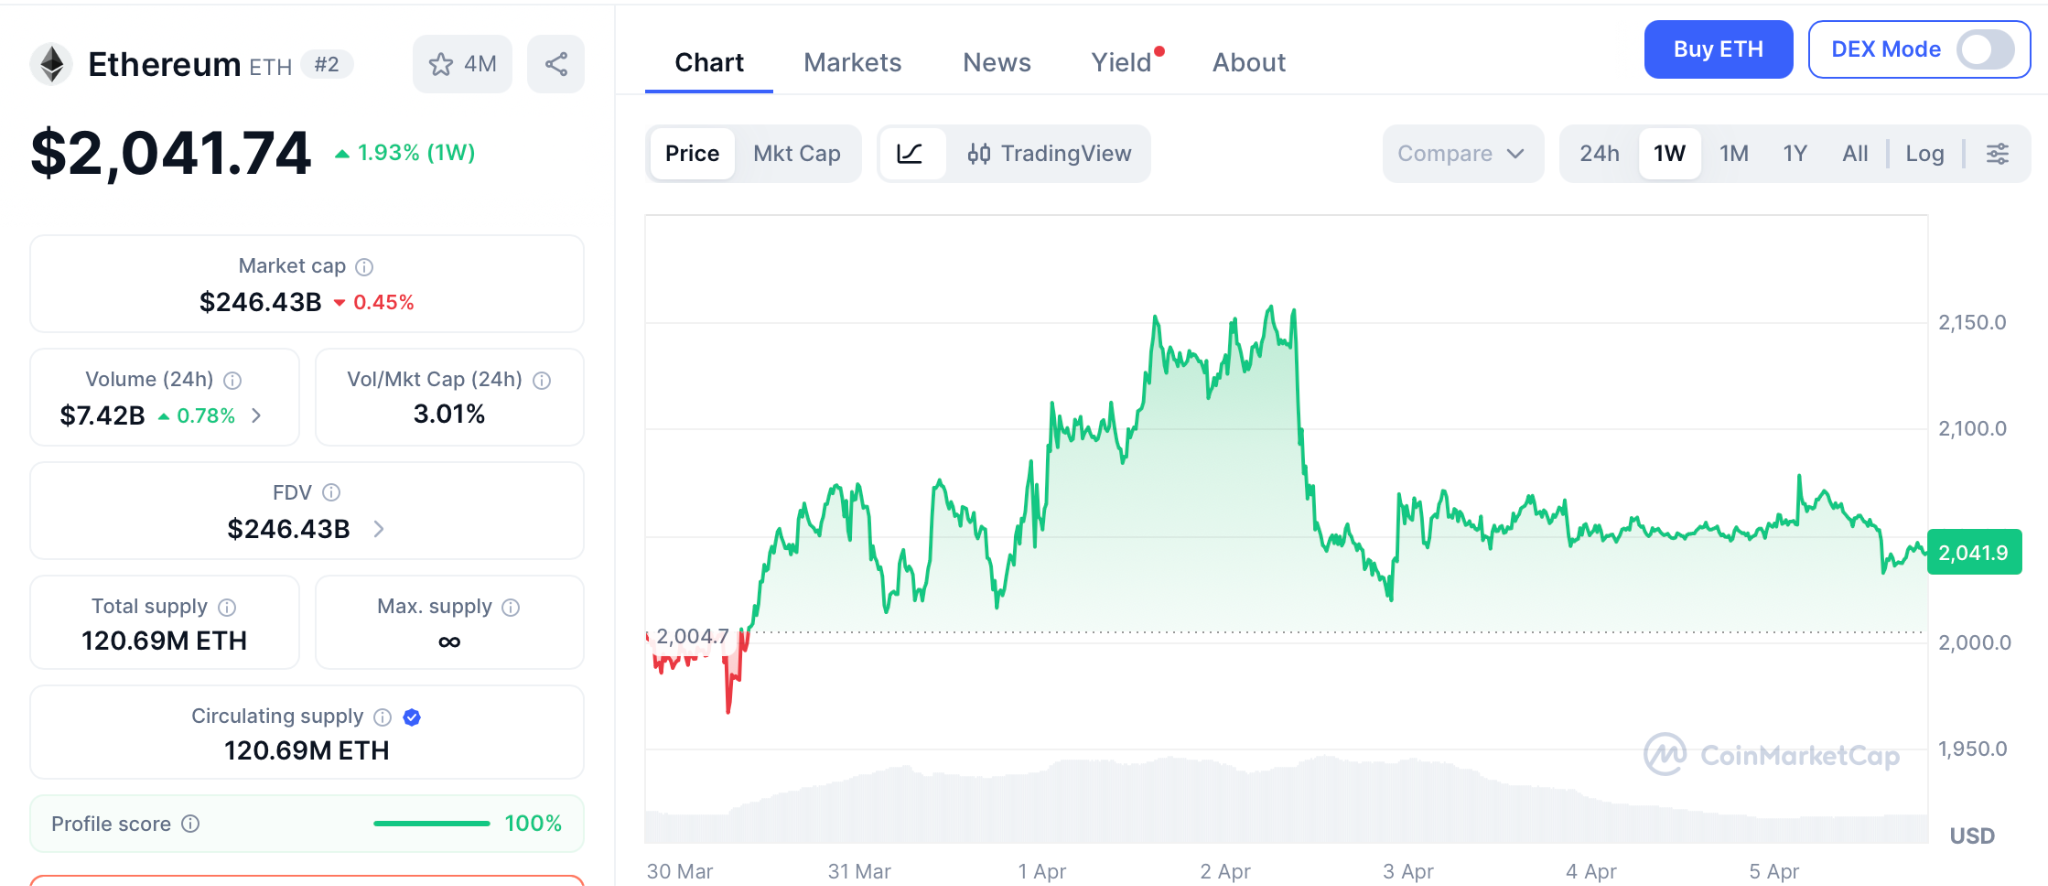
Standard Chartered keeps a $7,500 year-end target, but from here that is a 3.6x over nine months, decent for big portfolios, while Pepeto at presale pricing targets 100x from a single listing event the Binance debut is set to kick off.
XRP
XRP trades at $1.29 per CoinMarketCap, drifting below key moving averages as sellers stay in control.
Standard Chartered recently cut its year-end call to $2.80, roughly a 2x that takes patience, but presale entries grab the multiples that XRP at an $81 billion cap can no longer produce.
Conclusion
The picture is forming fast and the math is simple. The OCC handing a federal bank charter to the largest US exchange means the bitcoin price prediction just got backed by the same system that watches over Wall Street. ETH at $2,041 targets $7,500 over nine months, a 3.6x that pays patience, and the investors who grabbed ETH at $0.30 turned $1,000 into $16,000 because they spotted a working platform at early pricing and moved.
The bitcoin price prediction shows early bull signals building while the presale window gets tighter by the day. Visit the Pepeto official website and secure your spot before this chance turns into a headline you read about instead of a gain you earned, because projects with real products, viral buzz, and a Binance listing on deck do not sit at presale prices for long.
Click To Visit Pepeto Website To Enter The Presale

FAQs
What is the Coinbase OCC charter and how does it change the bitcoin price prediction?
The OCC gave Coinbase a federal trust bank charter, pulling crypto under Wall Street-grade rules. The bitcoin price prediction turns structurally bullish.
What are ETH and XRP targets next to the bitcoin price prediction?
ETH targets $7,500 by year end, XRP targets $2.80, and Pepeto targets 100x from the Binance listing. The Pepeto official website still takes entries.
Why is Pepeto the top pick as the bitcoin price prediction shifts bullish?
Pepeto has a live exchange, a SolidProof audit, $8.68 million raised, and 100x projected from the coming Binance listing.
Disclaimer: This is a Press Release provided by a third party who is responsible for the content. Please conduct your own research before taking any action based on the content.

MicroStrategy, the largest publicly traded corporate holder of Bitcoin, appears set to resume BTC purchases this week. This comes after a brief pause that interrupted one of the longest buying runs in its treasury strategy.
On Sunday, Executive Chairman Michael Saylor resurrected his customary “Orange Dot” tracker on the social media platform X, posting the phrase, “Back to work.”
STRC Rebound Raises Odds of Another MicroStrategy Bitcoin Purchase
Notably, similar phrases have served as a highly reliable leading indicator for multi-million-dollar Bitcoin buy orders over the past several months.
MicroStrategy currently holds 762,099 Bitcoin, valued at more than $50 billion. Another purchase this week would extend that lead and further separate the company from every other listed firm holding the token on its balance sheet.
Meanwhile, the size of any new purchase has not been disclosed.
Still, market watchers following the company’s financing activity say the latest issuance tied to its STRC preferred stock may have restored enough buying capacity. That would be enough to fund the acquisition of at least 1,500 Bitcoin.
That would mark a reversal from the previous week, when STRC traded mostly below par and appeared to curb the company’s ability to raise fresh capital for additional Bitcoin purchases.
Meanwhile, the focus is shifting beyond the next headline purchase to the mechanics supporting it. STRC, one of the instruments used to finance the company’s Bitcoin strategy, pays a variable annualized dividend of 11.5% as of April 2026.
Since launch, STRC alone has financed the purchase of 50,792 Bitcoin. That has made the preferred stock an important part of the company’s broader funding structure as it continues to build what is already the largest corporate Bitcoin treasury in the market.
The strategy, however, continues to divide opinion.
MSTR supporters view the company’s financing model as a high-conviction way to accumulate Bitcoin at scale and tighten its identity as a proxy for the asset in equity markets.
However, critics argue the growing dividend burden tied to its preferred investors leaves the company more exposed if Bitcoin enters a sharp or prolonged downturn.
The post MicroStrategy May Resume Bitcoin Purchases as Saylor Revives ‘Orange Dot’ appeared first on BeInCrypto.
The Solana Foundation has launched a new developer toolkit aimed at bridging artificial intelligence with its blockchain network.
Last week, the Swiss-based non-profit organization introduced “Agent Skills” to allow AI programs to autonomously execute on-chain transactions.
AI Agents Payments Market Still Small
The open-source toolkit allows developers to install pre-built modules with a single line of code. This enables AI agents to handle automated tasks, process payments, and trade assets across the Solana network.
The foundation provided official modules for security and compatibility, alongside more than 60 community-contributed skills from major Solana ecosystem platforms like Jupiter Exchange, Raydium, and Helius.
However, the foundation noted that community-contributed tools are not officially endorsed. Users are warned that integrating autonomous AI agents with unvetted decentralized finance (DeFi) protocols carries inherent security risks, and inclusion in the toolkit does not imply a warranty.
The launch highlights the cryptocurrency industry’s broader push to capture the emerging market of “agentic payments.” These transactions are initiated and completed by AI without human intervention.
Last year, consulting firm McKinsey & Co. pointed out that more businesses will need to adapt to this AI-driven operating environment. According to the firm, this could create a $5 trillion market by 2030, encompassing retail, logistics, and commerce platforms.
Despite the rapid development of blockchain infrastructure tailored for AI integration, current market demand remains negligible, exposing a significant gap between technological capability and real-world adoption.
For example, x402, an existing agentic payment protocol, processed only about $24 million in volume during the last 30 days.
Furthermore, blockchain analytics firm Artemis pointed out that “x402 ‘agent payments’ boom is still mostly a mirage.” It noted that x402-related activities had collapsed from a peak of over 731,000 transactions per day in December to around 57,000 transactions per day in February.
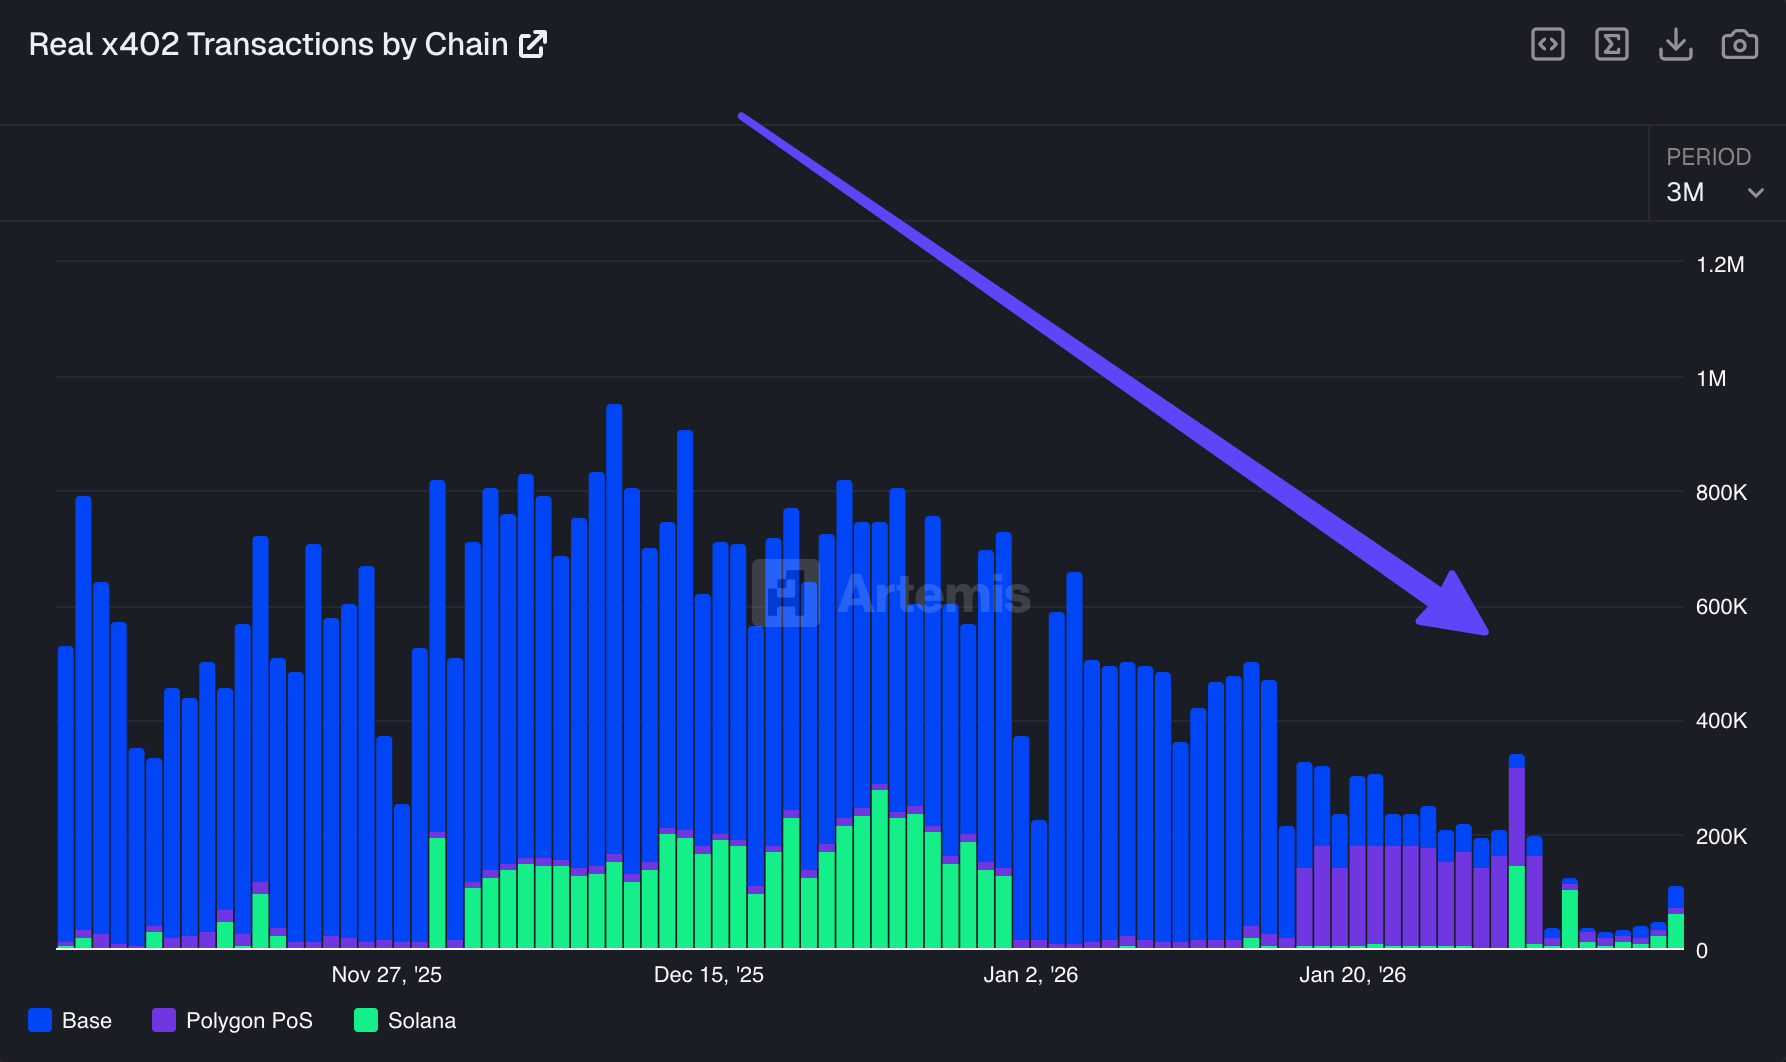
This data underscores that while networks like Solana are building the rails for an AI-driven economy, the merchants and users required to sustain it have not yet arrived.
The post Solana Targets $5 Trillion AI Market With New Developer Toolkit appeared first on BeInCrypto.

Bitcoin is hovering near the $67,000 level as weekend liquidity thins and traders weigh the risk of renewed downside. A Bollinger Bands squeeze on shorter timeframes points to a potential burst of volatility, but direction remains uncertain as sellers re-enter into a quiet end of the week.
In a market snapshot on Sunday, a prominent market observer highlighted how the current cycle differs from past Bitcoin bear markets. Pseudonymous trader LP_NXT noted that bottoms in earlier cycles typically formed after several sweeps of the downside, triggering capitulation before a revival. This time, the pattern has tended to sweep the highs, leaving the lows exposed and liquidity building below price action, complicating entries for bears and bulls alike.
“In contrast, this cycle has been sweeping the highs, making it difficult to enter short positions while leaving the lows exposed and building liquidity below.”
Meanwhile, traders are watching for a potential breakdown below key thresholds. LP_NXT suggested that a sweep of sub-$60,000 levels could be a likely signal once selling pressure intensifies, but the eventual breakdown and the way price behaves around consecutive lows will be crucial for identifying a real bottom.
Key takeaways
- Four-hour Bollinger Bands have contracted, signaling a classic volatility squeeze that could precede a sharp move up or down.
- Bottom formation remains uncertain; historical patterns favored repeated low sweeps to trigger capitulation, but this cycle has shown different dynamics by sweeping highs instead.
- Binance order-book data reveals unusual selling activity by a small investor class using a TWAP bot, with a single hour showing about $18 million in sell pressure—far above their typical daily volume.
- Market participants describe a dichotomy in whale behavior: “buying dips and selling rips” even as BTC remains range-bound, amid macro headwinds from stronger dollar pressures.
- Past coverage flagged added risk to bulls from a recovering U.S. dollar; investors should monitor whether price action can sustain above or below critical thresholds as liquidity shifts.
Technical setup: volatility compression and looming decisions
Price action around Sunday kept Bitcoin mired in a relatively tight band near $67k, with intraday volatility showing signs of re-emerging pressure rather than a firm directional breakout. The Bollinger Bands on the four-hour chart narrowed, a familiar prelude to a burst of activity once buyers or sellers step in decisively. Traders often interpret this as a fork in the road: a break above resistance could rekindle upside momentum, while a breakdown might expose the market to fresh liquidity-driven moves.
Among market observers, this has been a focal point because the prior cycles’ patterns around low-volume weekends can set the stage for the next move. The contrast with recent behavior—where repeated sweeps of local highs have dominated—adds an extra layer of complexity to positioning ahead of any potential move.
Whale dynamics and order-book signals
Beyond the price chart, on-chain and order-book activity has drawn attention. Keith Alan, cofounder of trading analytics firm Material Indicators, highlighted unusual selling density in the Binance BTC/USDT book despite muted price action. A time-weighted average price (TWAP) bot was observed distributing BTC, with the smallest order class executing a roughly $18 million sell program in an hour—significantly larger and more rapid than the class’s typical $3 million to $5 million daily volume.
“That’s exponentially more than their normal $3M-$5M daily volume in 1 hr. That ain’t retail!”
A broader portrait emerges of a market where whales are not uniformly aligned with a single directional narrative. Alan summarized the dynamic as “buying dips and selling rips” within a price range that continues to confound shorter-term traders. This pattern aligns with a market waiting for clearer macro cues and a more definitive breakout or breakdown signal.
Earlier reporting noted additional bulls’ headwinds from a recovering U.S. dollar, which can dampen enthusiasm for risk assets like Bitcoin when fiat strength escalates. The current activity in the order book underscores how much of the near-term price action may be driven by large players rather than retail flow, particularly as weekend liquidity dries up and position risks accumulate.
Macro backdrop and what it could mean next
The interplay between Bitcoin’s price trajectory and dollar strength remains a critical backdrop for traders. If the dollar cools or if liquidity shifts back into risk assets, BTC could attempt a sustained push higher. Conversely, renewed dollar strength or renewed selling pressure from large token holders could push the market toward test levels below the February low near $60,000. As with many chart-based narratives, the outcome will likely hinge on whether price can sustain a breakout beyond key resistance and whether further high-low sweeps occur, testing traders’ willingness to commit to new positions.
With Bitcoin hovering near critical junctures, investors are watching for concrete signals: a decisive break above the recent range, a compassionate test of sub-$60,000 lows, or a different pattern of liquidity formation that could indicate a new phase in the market cycle. The next couple of sessions should offer clearer directional clues as macro catalysts and order-book dynamics converge.
Cointelegraph’s prior coverage of dollar strength and its implications for crypto markets remains a useful context for readers assessing risk and potential routes for Bitcoin in the near term.
As the market enters a decision point, traders should monitor both price action and the evolving composition of order-book activity to gauge whether a bottom is forming or if a fresh leg down could materialize.
What remains uncertain is how quickly order-flow dynamics will normalize once weekends end and institutions re-enter the scene. Investors should stay alert to any break of sub-$60k liquidity traps or indicators that reinforce a shift in the prevailing liquidity regime.


Crypto markets faced a mix of structural, market, and policy-related developments on the day.
Summary
- Michael Ippolito said rising token supply diluted returns as average coin values lagged market cap.
- Michael Saylor said Bitcoin price now follows capital flows, not the old four-year halving cycle.
- Polymarket removed a market on a missing US service member after backlash over integrity standards.
New comments from industry figures focused on token oversupply, Bitcoin’s changing market cycle, and a backlash that led Polymarket to remove a sensitive prediction market.
Michael Ippolito, co-founder of Blockworks, said the crypto sector faces an “existential” problem as token supply grows faster than value creation. In posts on X, he said total crypto market capitalization has stayed relatively firm, but the average value per token has remained weak.
He wrote that “the average coin is only slightly higher than where it was in 2020” and also down about 50% since 2021. He added that median token returns have fallen sharply, with many tokens down about 80% from their peak levels.
Ippolito said this pattern shows gains have stayed concentrated in a small group of large-cap assets. At the same time, much of the wider market has failed to keep pace. His comments pointed to a growing gap between the number of new tokens and the value generated across the sector.
He also said, “We created a TON of new assets and STILL total market cap is flat.” That view framed token issuance as a dilution problem, where capital spreads across more assets without lifting average returns.
Saylor says capital flows now drive Bitcoin
Michael Saylor said Bitcoin no longer follows the traditional four-year cycle linked to halving events. He stated that the old cycle is “dead” and said price action now depends more on capital flows, credit conditions, and institutional demand.
For years, many traders used halvings as a core part of Bitcoin market analysis. Those events reduced miner rewards and often shaped expectations for future rallies. Saylor now argues that Bitcoin has entered a different stage.
He wrote that “price is now driven by capital flows” and said bank credit and digital credit will play a larger role in Bitcoin’s future path. His comments shifted attention away from supply shocks alone and toward access through funds, banks, and large firms.
That position came as more traditional financial platforms continued to expand Bitcoin-related services. The change has led some market participants to track treasury strategies, regulated products, and large-scale adoption more closely than past cycle models.
Polymarket removes market after criticism
Polymarket removed a market tied to the fate of a missing US service member after public criticism. The listing asked whether US authorities would confirm the rescue of a pilot reportedly shot down over Iran, and it drew sharp backlash online.
US Representative Seth Moulton criticized the market and called it “disgusting.” He said people were betting on the fate of a service member who could be injured, missing, or in danger.
Polymarket said the listing violated its “integrity standards” and removed it. The platform also said the market should not have gone live and that it is reviewing how it passed internal checks.
The company did not give more detail on the exact rule involved. Still, the removal added to the wider debate over what types of real-world events prediction markets should allow, especially when the subject involves war, injury, or loss of life.

Helen Flanagan stuns fans in Ann Summers Easter bunny outfit
James Wynn Reveals His Defensive Play Amid Trump’s Fiery Iran Message

Jania Meshell Speaks Out After Photo Spark Pregnancy Rumors


-

 NewsBeat3 days ago
Steven Gerrard disagrees with Gary Neville over ‘shock’ Chelsea and Arsenal claim | Football
-

 Business3 days ago
No Jackpot Winner and $194 Million Prize Rolls Over
-

 Fashion2 days ago
Weekend Open Thread: Spanx – Corporette.com
-
Entertainment6 days ago
Fans slam 'heartbreaking' Barbie Dream Fest convention debacle with 'cardboard cutout' experience
-

 Crypto World4 days ago
Gold Price Prediction: Worst Month in 17 Years fo Save Haven Rock
-

 Tech7 days ago
The Pixel 10a doesn’t have a camera bump, and it’s great
-
Crypto World5 days ago
Dems press CFTC, ethics board on prediction-market insider trades
-

 Tech7 days ago
Avatar Legends: The Fighting Game comes out in July and it looks pretty slick
-

 Sports22 hours ago
India men’s 4x400m and mixed 4x100m relay teams register big progress | Other Sports News
-

 Business4 days ago
Login and Checkout Issues Spark Merchant Frustration
-

 Tech6 days ago
Apple will hide your email address from apps and websites, but not cops
-

 Tech5 days ago
EE TV is using AI to help you find something to watch
-

 Sports5 days ago
Tallest college basketball player ever, standing at 7-foot-9, entering transfer portal
-

 Politics6 days ago
Should Trump Be Scared Strait?
-

 Tech6 days ago
Flipsnack and the shift toward motion-first business content with living visuals
-

 Fashion6 days ago
The Best Spring Trends of 2026
-

 Sports6 days ago
Women’s hockey camp eyes fitness boost, tactics ahead of WC 2026 campaign | Other Sports News
-
Tech6 days ago
Daily Deal: StackSkills Premium Annual Pass
-

 Tech5 days ago
How to back up your iPhone & iPad to your Mac before something goes wrong
-
 Crypto World7 days ago
Bitcoin’s Six-Month Losing Streak: What On-Chain Data Says About the Market’s Next Move
You must be logged in to post a comment Login