

Crypto World
Aave Proposes Principal-Preserving Charitable Giving Layer for Protocol


Aave governance initiates temp-check on a new charitable mechanism that would allow users to generate yield on deposits while maintaining capital control for humanitarian organizations.


Italy-based fintech Conio has received authorization to operate as a crypto-asset service provider under the European Union’s MiCAR framework, becoming one of the firms to secure approval before stricter licensing requirements take full effect across the bloc.
Summary
- Conio has secured MiCAR authorization in Italy, allowing it to provide regulated crypto asset custody, transfer, and placement services across the EU framework.
- The approval arrives ahead of the June 30, 2026 transition deadline, after which unlicensed crypto firms may no longer offer covered services in the European Union.
- Conio said it plans to expand services for retail clients, banks, fintech firms, and institutions pursuing tokenization and digital asset management initiatives.
Conio said the authorization was granted following a regulatory review involving Italy’s market watchdog Consob and the Bank of Italy. The licence permits the company to provide digital asset custody, transfer, and placement services under the EU’s crypto regulatory regime.
The company said it plans to serve retail investors, financial institutions, banks, and fintech firms. Conio also intends to offer white-label services and support organizations pursuing tokenization initiatives and digital asset management projects.
Chief Executive Officer Christian Miccoli said the authorization strengthens Conio’s efforts to act as a partner for institutions that want to incorporate digital assets into regulated investment offerings. He added that the company will continue participating in blockchain and tokenization projects.
“Obtaining MiCAR authorization in Italy is an important milestone that confirms the strength of our approach and our commitment to offering innovative, secure and fully compliant services,” a translated statement from Conio read.
The company added that the licence strengthens its role as a partner for retail clients, banks, and institutions operating in Italy’s regulated digital asset market.
“With the end of the transition period approaching on June 30, 2026, obtaining MiCAR authorization is becoming an essential requirement for operating in Europe.”
Approval arrives before EU licensing deadline
The authorization comes as crypto companies across Europe race to comply with MiCAR before the end of the transition period. Under EU rules, firms that do not obtain the required authorization by July 1, 2026, may no longer provide covered crypto services to customers in the bloc.
The European Securities and Markets Authority has previously stated that firms operating without a MiCAR licence after the deadline would be in breach of EU law. The regulator also said providers that fail to secure authorization should prepare wind-down plans and help customers move assets to authorized providers or self-custody wallets.
Legal firm Hogan Lovells said Europe had more than 3,000 virtual asset service providers in 2024 but only 194 authorized crypto-asset service providers, including credit institutions, by May 2026. The firm estimated that about 75% of the pre-MiCAR provider base could lose registration status as national transition periods expire.
Conio’s approval also positions the company to benefit from MiCAR’s passporting system, which allows licensed firms to expand services across the European Union after completing the required notification procedures.
From retail crypto wallets to institutional services
Conio has previously focused on crypto custody and wallet services for retail users. In July 2024, the company partnered with fintech infrastructure provider Mesh to connect its wallet platform with major cryptocurrency exchanges, including Coinbase and Binance.
At the time, Conio said more than 430,000 customers used its services in Italy. The company, which counts Poste Italiane and Banca Generali among its backers, said the partnership aimed to give users greater control over how they store digital assets outside centralized exchanges.


Kevin Warsh wrapped up his first Federal Reserve press conference on June 17 and made one thing unmistakably clear: price stability comes first. The S&P 500 fell 1.2% on the day, the worst “Fed day” performance for any new chair since 1994.
President Donald Trump nominated Warsh after months of publicly demanding rate cuts from the central bank. The man he appointed just sent the opposite signal, and the Dow Jones Industrial Average fell more than 500 points in response, erasing gains from earlier in the session.
Kevin Warsh’s Message to Markets
The Fed held rates steady on Wednesday, a move markets had fully priced in ahead of the meeting. The shock came from Warsh’s tone. He pared down the closely watched Federal Open Market Committee (FOMC) statement, a document traders and economists parse word by word, and announced task forces aimed at overhauling the central bank’s operations from the ground up.
Bespoke Investment Group, whose data on new-chair first-day performance goes back to 1994, noted that prior chairs Ben Bernanke, Janet Yellen, and Jerome Powell all saw the S&P 500 close lower on their first Fed days, but none by this magnitude.
DoubleLine Capital CEO Jeffrey Gundlach, speaking on CNBC’s Closing Bell, put it plainly: “He is absolutely telling you that he plans on delivering on price stability. That means we’re not going to have such easy money policy as everybody thought maybe Chairman Warsh would do back in the first quarter of this year, when everyone was counting on rate cuts.”
A Fed Rate Hike by October?
Fed funds futures, contracts traders use to bet on the direction of interest rates, now show traders pricing in the possibility of a rate hike as early as October, a scenario few had entertained at the start of 2026. Several FOMC members had already signaled openness to raising rates this year, and Warsh’s press conference confirmed that the new Fed is not steering toward accommodation.
“Investors will ultimately need to stay tuned to see what the task forces deliver, but one thing is clear now,” said Josh Jamner, Director and Senior Investment Strategy Analyst at ClearBridge Investments. “A new chapter at the Fed has begun.”
What This Means for Bitcoin
Tighter monetary policy is a direct headwind for risk assets, and Bitcoin has historically tracked liquidity conditions closely. If the Fed is signaling higher rates rather than lower ones, it removes a tailwind that had supported crypto markets through early 2026.
Bitcoin and gold both fell after Warsh’s press conference. For crypto investors who positioned around expected rate cuts, the calculus has shifted. The question is no longer when the Fed cuts, but whether it raises instead.
The post Trump Picked Warsh for Rate Cuts, US Markets Got the Opposite appeared first on BeInCrypto.


A 56-year-old Florida resident has pleaded guilty in federal court to conspiracy to operate an unlicensed money-transmitting business in connection with a $1.8 billion fraudulent crypto platform.
According to a statement from the United States Attorney’s Office for the District of Maryland, Rodney “Bitcoin Rodney” Burton conspired to provide unlicensed money transmitting services to promote HyperFund, a global wire-fraud scheme.
Kelly O. Hayes, US Attorney for the District of Maryland and agents from the Washington Internal Revenue Service Criminal Investigation unit and Homeland Security Investigations, New York, announced Burton’s guilty plea on Wednesday.
HyperFund is one of the largest crypto fraud schemes, which impacted thousands of investors worldwide. It compares to some of the bigger Ponzi-style collapses in the space, such as OneCoin, which took over $4 billion, and BitConnect, which is estimated to have caused over $2 billion in investor losses.
Prosecutors said HyperFund falsely promised investors daily passive returns of 0.5% to 1%, claiming the payouts came from crypto-mining revenue it didn’t actually have.
According to the plea agreement, from June 2020 to January 2022, Burton promoted HyperFund and used investors’ funds to enrich himself.
Related: Law enforcement freezes $41M connected to $150M crypto Ponzi collapse
Burton also controlled several companies that purported to offer consulting services and personally received at least $7.8 million in proceeds from the operation, according to the announcement.
Burton faces five years
In January 2024, federal prosecutors in Maryland announced charges against two other individuals for orchestrating the scheme. Co-conspirators Sam Lee, a 35-year-old Australian, and Brenda Chunga from Maryland, faced charges of conspiracy to commit securities fraud and wire fraud.
Chunga’s sentencing has been delayed multiple times and is now scheduled for June 29, while Lee, the alleged co-founder of HyperFund, has not been found guilty of anything.
HyperCapital was launched in January 2022 as a DeFi ecosystem, which was relaunched six months later as HyperFund. After several rebrands, the scheme collapsed in November 2022.
Burton faces a maximum sentence of five years in federal prison for conspiracy to operate an unlicensed money transmitting business, and sentencing is scheduled for July 23.
Magazine: The end of anon? AI could unmask crypto’s hidden identities

Dario Amodei sat across from Donald Trump at a G7 working lunch in France on June 17 and urged world leaders to resist fracturing over AI. Trump’s own administration had banned Anthropic’s most powerful models from export just days earlier.
The Anthropic chief executive told leaders gathered in Évian-les-Bains that democratic nations must “resist the temptation to splinter” over AI. Sam Altman of OpenAI and Demis Hassabis of Google DeepMind backed him at the same table, fierce rivals aligned on the same call, according to the Financial Times.
Why Amodei Pushed AI Unity at G7
The US Commerce Department issued an export control directive to Anthropic, barring Fable 5 and Mythos 5 from non-US users and from foreign nationals inside the country. Commerce Secretary Howard Lutnick cited a reported jailbreak of Mythos 5 that would let users bypass safety guardrails to extract software vulnerability data.

Anthropic warned that applying the same standard industry-wide ban would essentially halt all new model deployments. The company sent senior staff to Washington earlier this week to seek a reversal.
The G7 speech landed with extra weight: Trump had already ordered all federal agencies to stop using Anthropic products in February, after the company refused Pentagon contract terms requiring its AI to be available for “any lawful purpose.”
Macron’s Warning on the Switch
French President Emmanuel Macron said the Anthropic dispute had “clarified the stakes.” If the US “from one day to the next can turn off the switch,” he warned, it would damage the multitrillion-dollar US companies leading the global AI race.
Indian Prime Minister Narendra Modi raised the same concern, saying democratic nations must retain access to frontier AI to protect critical infrastructure.
Amodei left France without a resolution, but a call for AI unity. He had made his case to the man whose government created the problem, across the same table.
The post Anthropic’s Dario Amodei Urged AI Unity at G7, Even as US Banned His Models appeared first on BeInCrypto.
Crypto World
The bond market is flashing a clear signal on interest rates. Bitcoin bulls should take note


The move marks a notable reversal from the start of the year, when the curve was steepening, a sign markets were pricing in rate cuts, which were then cited as a tailwind for risk assets including cryptocurrencies. That tailwind now looks like it’s fading.
Here’s why the curve matters
Bonds serve as one of the channels through which monetary and fiscal policies are transmitted into markets and the economy. Hence, shifts in the bond market curve or spreads are often clearer and more reliable signals of impending policy changes than individual analyst commentary.
The two-year yield moves closely with expectations for near-term Fed policy, while the 10-year yield reflects where markets see growth and inflation over the longer haul.
Under normal conditions, the curve (the spread between the two) slopes upward as investors demand extra compensation, or a premium, to lock up their money for longer periods, pushing the 10-year yield above the two-year yield.
When that gap narrows, it usually means one of two things: investors are pricing in higher interest rates for longer, which keeps the two-year yield elevated, or they’re growing more pessimistic about long-term growth, which pulls the 10-year yield down.
Right now, the move looks like the former, especially in the wake of Wednesday’s Fed decision, in which the central bank held interest rates unchanged, but the broader messaging leaned hawkish.


Jack Dorsey’s Block has launched Builderbot, a new AI-native software tool built to support engineering work across the company.
Summary
- Builderbot handles 15% of Block’s production code changes and merges 1,500 pull requests weekly now.
- Block says Builderbot lets engineers ship cross-service fixes without knowing each codebase first at scale.
- The rollout links Dorsey’s AI restructuring to real engineering output, not only cost cuts alone.
In a Block announcement, the company said the tool now handles about 15% of all production code changes.
Builderbot runs more than 200,000 operations per day and merges about 1,500 pull requests each week, according to Block. Brad Axen, Block’s head of AI capabilities, said the tool is “the missing layer between AI coding tools and how engineering actually works at scale.”
AI tool works across Block’s codebase
Block said Builderbot is not a standard coding assistant that works in one repository. It acts as an orchestration layer that coordinates several AI agents across the company’s codebase. It can work with services, APIs, internal rules, and system patterns across Block.
The tool works inside Slack. Engineers can tag Builderbot, describe the task, and let the system create a branch, write code, open a pull request, watch continuous integration, and respond to feedback. Block said the tool only works with source code and system configuration. It does not access customer data, payment data, or personal information.
Dorsey’s AI shift gets clearer
The rollout gives more detail on Block’s wider use of AI across its business. The company said 100% of its engineers now use AI regularly in their work. It also said Builderbot lets engineers make changes in parts of the company’s systems they have not worked on before.
As previously reported by crypto.news, Block’s workforce cuts reduced headcount by more than 4,000 jobs as Dorsey said the company was restructuring around AI and smaller teams. At the time, Dorsey said intelligence tools were helping Block work in a new way.
AI coding moves beyond assistants
Builderbot shows how AI coding tools are moving from suggestions to production work. The system does not just generate code snippets. It follows tickets, edits files, opens pull requests, and helps move software toward release while humans review direction and judgment.
Block said some work that once took months can now take days. Axen said engineers on Square used Builderbot to ship seller-facing features that had been waiting for months. He said Builderbot handled scaffolding and repeated work, while engineers made product decisions.
Crypto and fintech firms test AI agents
Block is not alone in pushing AI deeper into financial technology. According to an earlier crypto.news report, Coinbase’s AI advisor lets users interact with portfolio tools through natural language commands. That report also noted that AI agents can connect to Coinbase and follow user-approved trading rules.
crypto.news previously reported that AI expansion has become part of the strategy for several crypto-linked companies. The Builderbot rollout adds a different example. It shows AI being used inside engineering teams, not only in user-facing products.
The key question is how companies keep quality, review standards, and security in place as AI agents touch more code. Block said humans still guide the process and focus on decisions that shape the product. Builderbot handles the lower-level work that slows development.
Michelle Bond, the wife of former FTX executive Ryan Salame, will face illicit campaign finance charges after a judge rejected her argument that prosecutors promised Salame that she would be cleared if he pleaded guilty.
Manhattan federal judge George Daniels on Wednesday denied Bond’s bid to dismiss an indictment that alleged she illegally took money from the now-bankrupt crypto exchange FTX to help bankroll her unsuccessful run for Congress in 2022.
Daniels wrote there was “no ambiguity” in the terms of Salame’s written plea agreement. “As the evidence made clear, all parties, including the defendants and their counsel, were aware that the Government had not promised Bond’s immunity by the time Salame entered his guilty plea,” he said.
FTX’s high-profile collapse in 2022 shook the cryptocurrency industry. The order could set up the last of the criminal trials tied to FTX, closing a chapter on one of crypto’s biggest blowups in history.

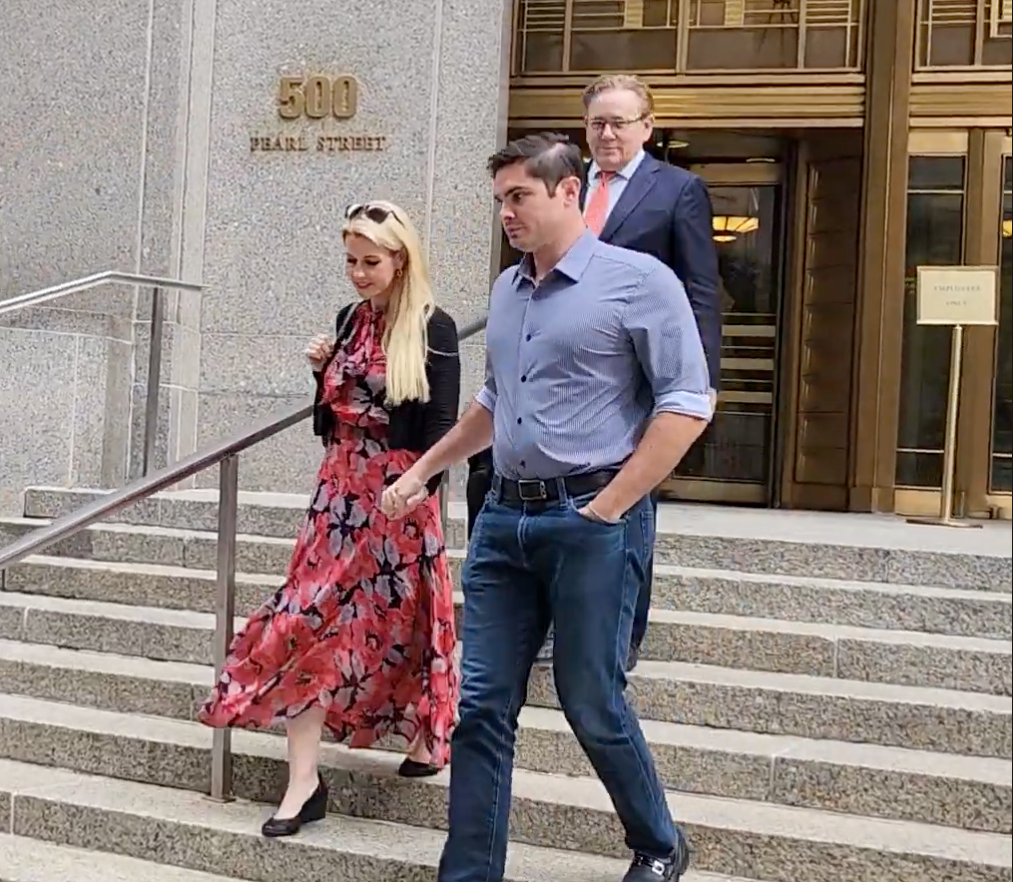
Michelle Bond (left) and Ryan Salame (right) leaving a Manhattan courthouse in August 2024. Source: YouTube
Salame, who was the co-CEO of FTX’s Bahamian subsidiary, FTX Digital Markets, was sentenced to seven and a half years in prison in May 2024 after pleading guilty to conspiring to make illegal political contributions and operating an illegal money transmitter.
Bond claimed that then-Manhattan US Attorney Danielle Sassoon told her and Salame’s lawyer in a 2023 meeting that “without making promises outside the four corners of the plea agreement,” if Salame pleaded guilty, then prosecutors would “conclude the aspects of our investigation that concern RS (Ryan Salame), but not SBF (Sam Bankman-Fried).”
However, Daniels wrote that the evidence “undisputably indicates that the Government did not promise to not prosecute Bond in exchange for Salame’s guilty plea.”
He added that Bond’s former lawyer, Gina Parlovecchio, “admitted as much under oath — testifying that, regardless of what discussions were had, she did not believe Sassoon’s statement was a promise at the time it was made.”
Prosecutors first alleged in August 2024 that after Bond launched a bid for a House seat in 2022, Salame orchestrated a consulting agreement between Bond and FTX, where she was paid $400,000.
Related: US lawmakers warn against presidential pardon for Sam Bankman-Fried
The government alleges Bond then used those funds to illegally finance her congressional campaign, along with hundreds of thousands of dollars in additional funds that Salame wired to her between June and August 2022.
Prosecutors claimed that Bond attempted to conceal the source of the payments and made false statements to a congressional committee and the Federal Election Commission.
Bond is facing charges of conspiring to cause unlawful political contributions, causing and receiving a straw donor contribution, along with causing and accepting excessive campaign contributions and an unlawful corporate contribution.
Each of the four charges Bond is facing carries a maximum of five years in prison.
Magazine: Are DeFi devs liable for the illegal activity of others on their platforms?


The slide also lands on a sensitive instrument. STRC’s dividends prompted Strategy to sell bitcoin for the first time since it began accumulating bitcoin in 2022. The company disclosed on June 1 that it had sold 32 coins for about $2.5 million in late May to fund STRC distributions, a move that rattled a market used to Chairman Michael Saylor’s pledge never to sell.
Last week, Strategy said it had grown a dedicated U.S. dollar reserve to $1.1 billion to cover preferred dividends and debt, while still buying 1,587 bitcoin through separate sales of its common stock.
Strategy holds about 846,842 bitcoin, roughly 4% of the supply that will ever exist, making it the largest corporate holder.
STRC has dipped below par before, however, usually during stretches of bitcoin volatility. Bitcoin has held around $64,000 to $65,000 this week, and Strategy’s common stock, MSTR, fell about 5% on Wednesday to $116.52.

Kentucky has filed lawsuits against five prediction market platforms, escalating an ongoing legal dispute in the United States over whether certain prediction market “event contracts” constitute regulated commodities products or unlicensed sports betting. The complaints target Polymarket and Kalshi, and name Kalshi partners Coinbase, Robinhood, and Webull, alleging the platforms are effectively operating sports wagering in Kentucky without required state authorization.
The move adds to a broader pattern in which multiple states have challenged prediction markets under state gaming and consumer-protection statutes. It also highlights a central regulatory fault line in the US: states view sports-related event contracts as gambling that must be licensed locally, while prediction market operators argue the products are swaps that fall under the federal Commodity Futures Trading Commission’s (CFTC) jurisdiction.
Key takeaways
- Kentucky alleges Polymarket and Kalshi are “operating unlicensed and illegal sports betting and gambling platforms” in the state.
- The complaints also include Kalshi partners Coinbase, Robinhood, and Webull, raising questions about compliance exposure for distribution and brokerage relationships.
- State and federal authorities have taken opposing positions on jurisdiction, with the CFTC supporting the view that prediction markets can be regulated as swaps under commodities law.
- Several states have already issued cease-and-desist actions, and some disputes have reached federal courts with mixed outcomes.
Kentucky’s lawsuit and the jurisdictional dispute over event contracts
According to a statement by Kentucky Attorney General Russell Coleman, the lawsuits were filed in state court against Polymarket and Kalshi, with Kalshi partners Coinbase, Robinhood, and Webull also named. Kentucky’s position is that the platforms are conducting what it characterizes as sports wagering in Kentucky without a gaming license or compliance with state rules.
Kentucky’s filings frame the underlying contracts as “sports event contracts” that “fall squarely within the definition of ‘sports wagering’ under Kentucky law.” The complaint further alleges that the platforms fail to provide adequate support for identifying and assisting users who may have gambling problems, which Kentucky law requires operators to do.
For compliance teams and regulated entities, a key practical implication is that the lawsuits do not focus solely on the core trading interface. By naming partners involved in the broader ecosystem, the action signals that state regulators may treat affiliated distribution, brokerage, or marketplace relationships as part of the alleged unlicensed wagering operation.
Polymarket disputes Kentucky’s characterization. A Polymarket spokesperson told Cointelegraph that the lawsuit “runs counter to the CFTC’s established framework for regulating prediction markets” and that the company will address the claims through “the appropriate legal process.”
Kalshi’s response similarly emphasizes federal oversight. Jacki McGavick told Cointelegraph that Kalshi is “a federally regulated exchange,” asserting that “the CFTC is our regulator, not the states,” and arguing that courts have recognized this approach in prior disputes.
The CFTC did not immediately respond to a request for comment.
Why the CFTC-vs.-states conflict matters for institutional compliance
The Kentucky case sits within an expanding enforcement and litigation landscape. At least 17 other states have taken prediction market operators to court, and the disputes have drawn attention from the CFTC and the White House. The legal contention centers on regulatory classification—whether event contracts tied to sports are gambling products governed by state gaming laws or swaps governed by federal commodities regulation.
Multiple state authorities have argued that sports-oriented prediction products require state-level licenses and oversight. Prediction market operators have argued the contracts are swaps and therefore subject to the federal regime administered by the CFTC.
This position is reflected in the CFTC’s broader enforcement strategy. The CFTC has sued multiple states after they acted against prediction markets, asserting they were stepping into federal authority. The CFTC has also pursued jurisdictional disputes involving operators in response to state interventions.
For financial institutions and technology providers monitoring cross-border regulatory risk, these cases matter because they can influence how products are offered in individual states. Even when operators claim they are under federal regulation, state-level litigation can still translate into operational constraints, partner restrictions, and heightened compliance reviews—particularly around marketing, access controls, user disclosures, and consumer-protection measures such as responsible gaming tooling.
The uncertainty is amplified by the fact that courts have reached differing conclusions on core classification questions. For example, a Michigan federal judge ruled against Polymarket in a lawsuit brought by the operator against Michigan, finding that Polymarket’s sports event contracts were not swaps under the CFTC’s authority. Other courts have sided with prediction market operators in different matters, reinforcing that jurisdiction and classification issues may continue to produce inconsistent outcomes across circuits.
Precedent, ongoing appeals, and prior state actions
Kentucky’s filing follows a sequence of actions by multiple states, including cease-and-desist letters. Operators have responded by suing states—contesting, among other things, whether state actions conflict with federal commodities jurisdiction.
Several of the disputes have advanced through appeals courts. In April, the Third Circuit Court of Appeals ruled that New Jersey regulators could not prevent Kalshi from offering sports event contracts in the state. Meanwhile, the Michigan federal court decision against Polymarket demonstrates that not all litigation tracks in the same direction, and classification analysis can vary depending on the specific contractual structure and the court’s view of federal authority.
Separately, Kalshi and Polymarket have already been involved in litigation with Kentucky over taxes. Kentucky is seeking to collect a 14.25% tax on prediction market transaction fees, and the platforms have argued the state’s tax approach is discriminatory and exceeds federal authority.
The procedural posture of the cases also means the legal question is not confined to enforcement alone. Appeals decisions can reshape how states and federal regulators interact, affecting both licensing expectations at the state level and compliance assumptions at the federal level.
In parallel, political statements have added to the broader policy debate over federal regulatory primacy. In May, President Donald Trump said it was “critically important” that the CFTC’s exclusive authority over prediction markets be maintained, according to reporting by Cointelegraph.
What regulators and firms should watch next
Kentucky’s lawsuits are likely to intensify the recurring legal questions about classification, licensing, and consumer-protection obligations—especially for partners implicated in distribution or access. The key developments to monitor are (1) how Kentucky courts handle the jurisdictional challenge, (2) whether the cases are consolidated into broader appeals or addressed by higher courts, and (3) whether enforcement strategies shift toward requiring state-specific responsible gaming and consumer safeguards.
Until appellate courts provide more uniform guidance, prediction market operators and their institutional partners should anticipate continued state-level litigation risk, even where they rely on federal commodity regulation frameworks.

Kentucky has filed lawsuits against prediction market platforms Polymarket and Kalshi, escalating a dispute that pits state gambling regulators against the U.S. Commodity Futures Trading Commission (CFTC) over how sports-linked event contracts should be classified and regulated.
In court filings announced by Kentucky Attorney General Russell Coleman on Wednesday, the state also named Kalshi partners Coinbase, Robinhood and Webull. Kentucky accuses the platforms of operating unlicensed and illegal sports betting and gambling services, arguing their products fall under state “sports wagering” law rather than federal commodities rules.
Key takeaways
- Kentucky alleges Polymarket and Kalshi are offering sports event contracts that constitute “sports wagering” under Kentucky law.
- The lawsuits also target Kalshi partners Coinbase, Robinhood and Webull, alleging they are involved in providing access to the platforms without proper licensing.
- State enforcement actions have drawn repeated challenges and CFTC involvement, with conflicting outcomes in different courts.
- Prediction market operators argue their contracts are swaps regulated by the CFTC, not state gambling laws.
A state-led push to treat prediction markets as sports betting
Kentucky’s attorney general framed the case as part of a broader pattern among states trying to control sports-related gambling. Coleman said his office filed suits in state court against Polymarket and Kalshi, accusing both of “operating unlicensed and illegal sports betting and gambling platforms.”
Kentucky’s complaint also asserts that the platforms are operating without a Kentucky gaming license and without complying with state regulations. The state further claims that contracts tied to sports outcomes “fall squarely within the definition of ‘sports wagering’ under Kentucky law.”
Beyond licensing and classification, Kentucky also alleges the platforms do not provide adequate resources for problem gambling support, a requirement the state says is mandated by law.
The federal-regulator argument: event contracts as swaps
Polymarket rejected Kentucky’s position. A Polymarket spokesperson told Cointelegraph that the state’s action “runs counter to the CFTC’s established framework for regulating prediction markets,” adding that the company expects to address the allegations through the legal process.
Kalshi, meanwhile, insisted its setup is already within federal oversight. Kalshi spokesperson Jacki McGavick told Cointelegraph that “Kalshi is a federally regulated exchange — the CFTC is our regulator, not the states,” arguing that courts have recognized this and that the same outcome should apply in Kentucky.
The CFTC did not immediately respond to a request for comment, according to the report.
At the heart of the dispute is a jurisdictional split. Multiple state authorities have argued that event contracts connected to sports are functionally sports betting and therefore require state licenses. Prediction markets counter that these event contracts should be treated as swaps regulated under federal commodities law—an argument that is backed by the CFTC.
Why these lawsuits could reshape access to major markets
Kentucky’s move arrives as state actions against prediction platforms have grown into a multi-jurisdiction conflict. According to Token Terminal, Polymarket and Kalshi recorded $25 billion in monthly trading volume in May combined. For platforms seeking to scale, losing access to large state markets can quickly become more than a legal inconvenience—it can affect liquidity, product distribution, and the user base.
The legal and regulatory stakes are also reflected by the breadth of involvement from federal and state actors. As reported, at least 17 other states have brought prediction market operators into court, and the CFTC has pursued its own legal action—suing eight states after state authorities took steps against prediction markets and, in the CFTC’s view, stepped beyond federal authority.
Mixed court outcomes increase uncertainty for the next fights
While prediction markets have not uniformly prevailed, some rulings have favored their argument about federal jurisdiction. In Wednesday’s coverage, a Michigan federal judge ruled against Polymarket in its lawsuit against the state, finding that Polymarket’s sports event contracts are not swaps under the CFTC’s authority.
Other cases have gone the opposite direction. The report notes that the Third Circuit Court of Appeals ruled in April that New Jersey regulators could not prevent Kalshi from offering sports event contracts in the state—supporting, at least in that circuit and context, the view that states cannot simply override federal regulatory authority.
The Kentucky filing also follows an earlier round of litigation involving the same market ecosystem. As reported by Cointelegraph, Kalshi and Polymarket are already in legal action with Kentucky over the state’s tax on prediction market transaction fees. The platforms sued after Kentucky imposed a first-in-the-country 14.25% tax on prediction market transaction fees, arguing it is discriminatory and conflicts with federal law.
Outside Kentucky, cease-and-desist letters and subsequent lawsuits have involved multiple states, including Montana, Nevada, Utah, Iowa, Illinois, Ohio, Tennessee, New York, New Jersey, Connecticut and Maryland—while other states such as Washington, Arizona, New Mexico, Wisconsin, Michigan, Massachusetts and Kentucky have also chosen to sue prediction platforms, including Kalshi.
What to watch next
With Kentucky now adding to a growing enforcement track record—and with courts issuing contrasting decisions on whether sports event contracts qualify as swaps—readers should watch how Kentucky’s claims are argued and whether the case outcome aligns with favorable appellate rulings or the more skeptical reasoning seen in Michigan. The legal answers will likely determine not just Kentucky’s approach, but how much room states have to regulate (or restrict) prediction markets nationwide.

Kane Leads the Way as England Players Shine in Opening Win Over Croatia

Money Pain #sad #trending #emotional #money #family #shorts #responsibility #middleclassfamily
What makes the ideal digital icon? A psychologist explains


-

 Business4 days ago
No Jackpot Winner as $257 Million Prize Rolls Over to $269 Million Monday Draw
-

 Fashion6 days ago
Weekend Open Thread: Tuckernuck – Corporette.com
-

 Crypto World7 days ago
Oppenheimer backs SpaceX as $70 billion retail frenzy builds
-

 Crypto World7 days ago
Markets Rally as SpaceX IPO Looms Amid Iran Tensions and Inflation Surge
-
 Crypto World3 days ago
Zimbabwe Requires Crypto Businesses to Register Annually Under New FIU Regulations
-

 Tech5 days ago
NanoClaw integrates JFrog registries to secure AI agent downloads
-

 Crypto World5 days ago
Bitget enters Argentina’s regulated crypto market through PSAV registration
-

 Tech6 days ago
This Week In Security: Microsoft On Microsoft, Register Your Domains, Linux On ARM, And FreeBSD Joins The File Cache Club
-

 NewsBeat6 days ago
El Nino has formed in the Pacific and could set records, forecasters say
-
 Tech7 days ago
Dutton Ranch star claims they ‘didn’t see any disruption’ on set following Chad Feehan’s exit from Yellowstone spinoff fueled by Taylor Sheridan clash rumors
-

 Politics7 days ago
Politics Home | Healey Resignation Is “Colossal Failure Of Government”, Says Former Labour Defence Secretary
-
 Entertainment7 days ago
Donnie Wahlberg & More Heat Up Las Vegas at Circa’s Barry’s Downtown Prime
-
 Tech7 days ago
Opendoor Ends India Operations, Fueling a Bigger Conversation About AI and Outsourcing
-

 Sports7 days ago
First Time Since 1971: Australia Register Historic Low In ODI Cricket
-

 Politics7 days ago
Belfast burns, while Met chief points finger at Iran and Russia
-

 NewsBeat6 days ago
FBI searches office of Ohio voter registration group
-

 Business7 days ago
AT&T: Verizon's 27% Outperformance Sets Up A Solid Entry Point
-
 Tech6 days ago
Anthropic is spending $150M to embed 1,000 AI fellows inside nonprofits. No degree required.
-

 Politics7 days ago
Modi thanks Trump for wishes as US attacks Indian seafarers
-
 Entertainment6 days ago
‘The Pitt’s Fan-Favorite Doctor Confirms Noah Wyle Gave His Blessing to Return [Exclusive]
You must be logged in to post a comment Login