

Crypto World
ABA, Banking Associations Push Back Against CLARITY Act Yield Provisions

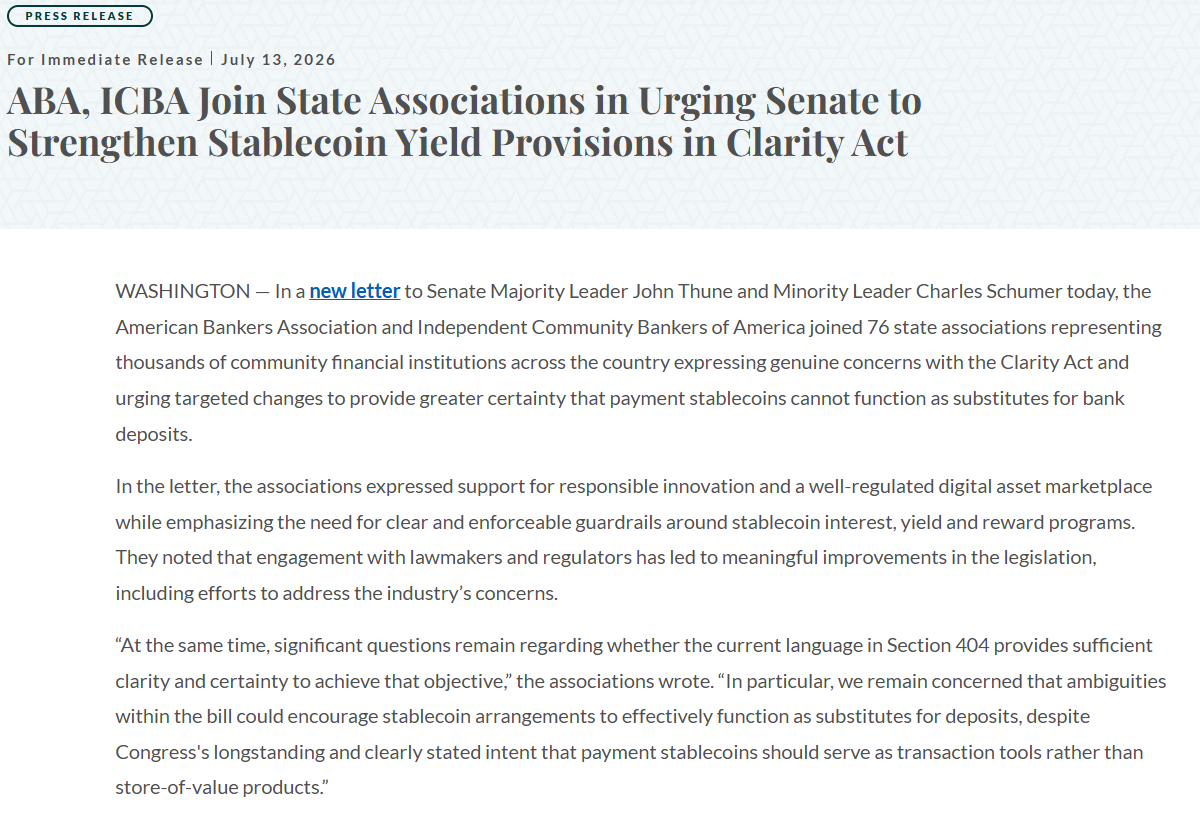
A wide swath of the US banking industry is urging Senate leaders to amend the stablecoin yield provisions of the Digital Asset Market Clarity Act (CLARITY) now under consideration.
The American Bankers Association (ABA), the Independent Community Bankers of America (ICBA) and 76 other state banking associations sent a joint letter to Senate leaders that claimed that the current language on stablecoin interest, yield and rewards is too ambiguous and argued that new amendments need to prevent payment stablecoins from acting as deposit substitutes rather than pure transaction tools.
The joint letter, which showed support for the broader bill, said the ABA is concerned that ambiguities within the bill “could encourage stablecoin arrangements to effectively function as substitutes for deposits, despite Congress’ longstanding and clearly stated intent that payment stablecoins should serve as transaction tools rather than store-of-value products,” according to a press release published on Monday.
This marks the latest pushback from the US banking industry against the act’s stablecoin yield provisions and comes just days ahead of the bill’s scheduled House of Representatives hearing on Friday. The bill aims to establish the first regulatory framework for digital assets in the US.
The banking groups said that the current draft poses the risk of a “deposit flight,” urging lawmakers to revise section 404 to “clarify the prohibition on interest and yield and help ensure that the prohibition cannot be circumvented through alternative incentive structures.”
The pushback reinforces Galaxy Digital’s prediction that the Senate is running out of time to pass the bill before the end of the year, due to a looming Senate recess and other congressional priorities. Galaxy Digital cut its odds of the CLARITY Act becoming law in 2026 to 50% on June 26, citing the lack of a unified Senate Banking-Agriculture text, no firm floor schedule and a narrowing legislative window before lawmakers leave Washington.
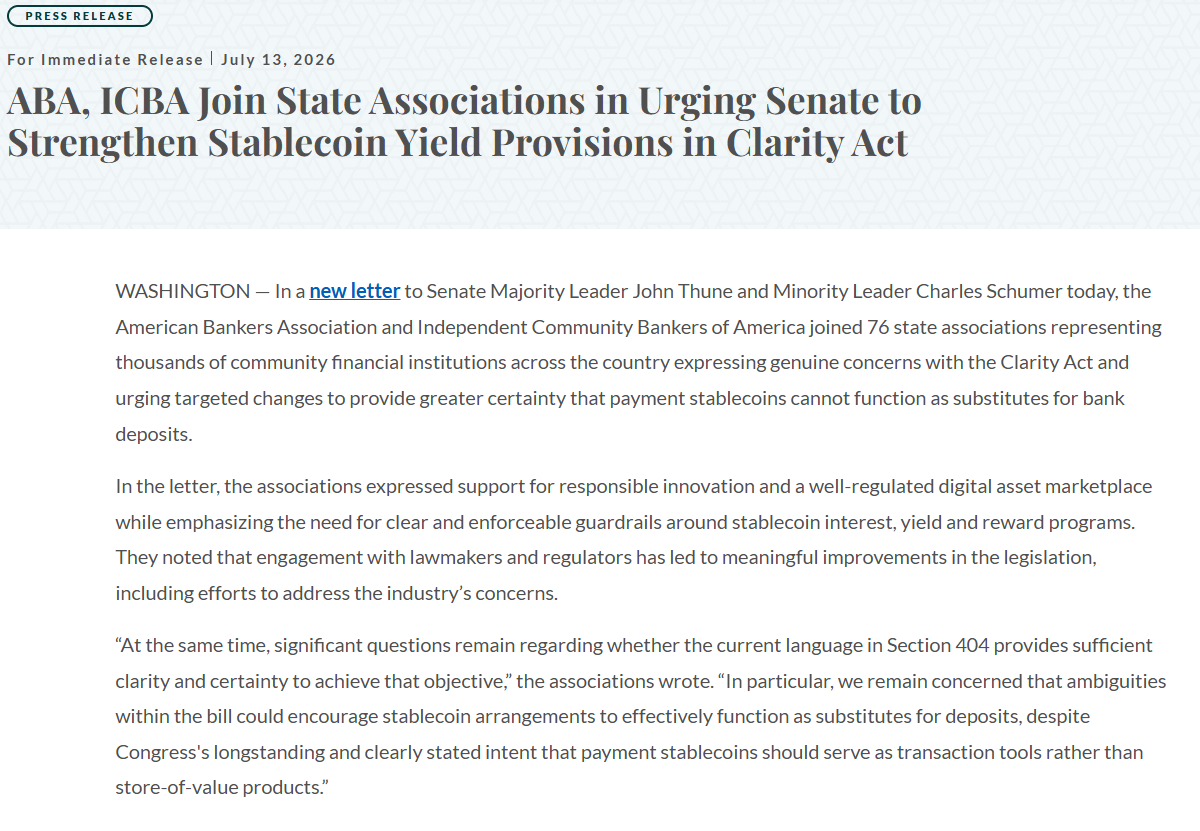
ABA, ICBA join state associations in urging Senate to strengthen stablecoin yield provisions in Clarity Act. Source: ABA.com
Bankers, Dems push back against stablecoin yield elements
The CLARITY Act cleared the Senate Banking Committee in May, but met pushback from Democrats and the banking industry, who argued that it would allow crypto firms to offer yields on stablecoins without facing the same requirements as traditional banks.
In a May interview, JPMorgan CEO Jamie Dimon said that the banking industry would continue to “fight” against the current version of the CLARITY Act and said that crypto companies wanting to pay yield on stablecoins should apply for banking charters.
Related: A16z’s Andreessen lands Federal Reserve role as AI reshapes policy debate
Meanwhile, the CLARITY Act secured its second public endorsement from a major US law enforcement organization on Friday, when the Federal Law Enforcement Officers Association (FLEOA) said it submitted a letter to the US Senate Banking Committee endorsing the CLARITY Act, while calling for strengthening accountability in decentralized finance (DeFi) and for preserving the investigators’ existing powers.
At the beginning of June, more than 200 crypto companies and related organizations urged the US Senate to pass the CLARITY Act in a letter shared by crypto lobby group Stand With Crypto.
Magazine: From Bitcoin critics to blockchain believers: The 5 biggest crypto backflips

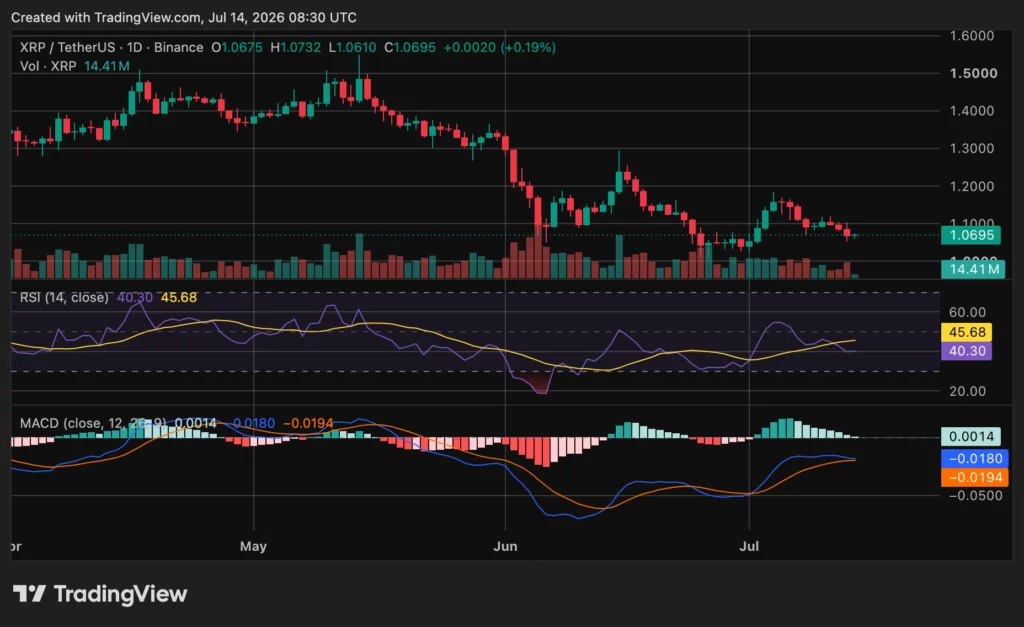
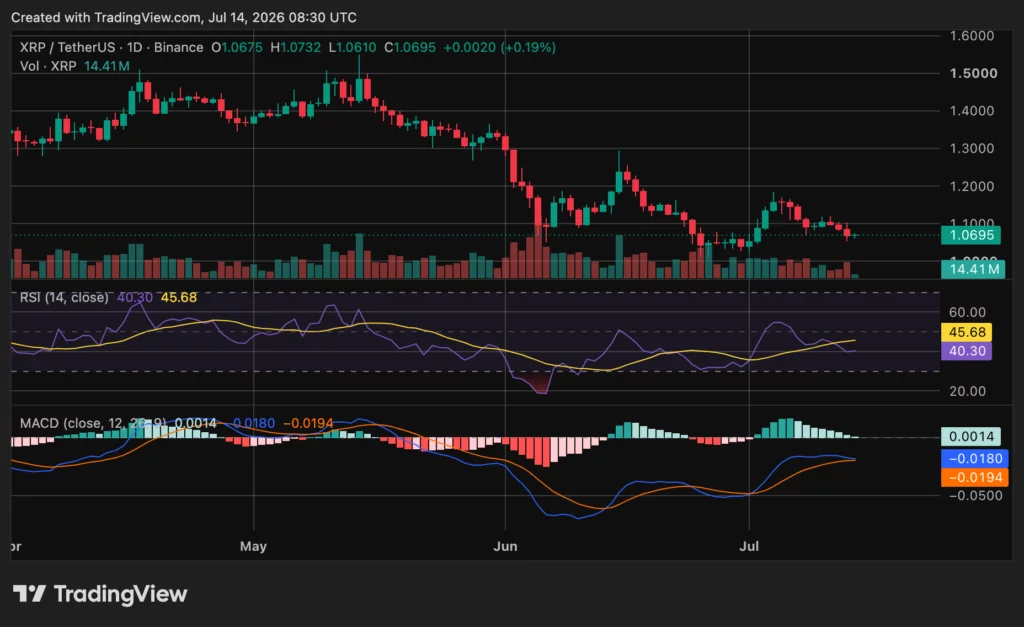
XRP traded near $1.07 on July 14 after losing about 1% over 24 hours.
Summary
- XRP trades near $1.07 as negative Binance CVD data shows sellers still control spot demand.
- The $1.08 resistance level remains crucial, while $1.05 and $1.00 form the nearest downside supports.
- Bullish XRP social sentiment may increase short-term risk because prices often move against crowded expectations.
The token moved between $1.06 and $1.08, with daily volume near $955 million and market capitalization around $66.7 billion. Ripple’s native token remained the sixth-largest cryptocurrency.
The price has fallen nearly 6% over seven days and about 7% over one month. It also sits more than 70% below its July 2025 record of $3.65. The latest data shows weak price action near a support area defended several times since late June, while buyers still lack a clear breakout signal.
XRP price remains below key resistance
The XRP/USDT daily chart shows a broader decline from the $1.40 to $1.50 region. Price has stabilized between $1.05 and $1.10, but buyers have not reclaimed the recent recovery zone near $1.15 to $1.20. Analyst Cryptorphic said lower levels remain possible “as long as $1.08 remains resistance.”
The nearest downside level sits around $1.05. A daily close below that area could expose the psychological $1.00 mark. A recovery above $1.08 would ease immediate pressure, while a move through $1.10 could open another test of $1.14 and $1.18.
The relative strength index stood near 40.30, below its signal average of 45.68. The MACD histogram turned slightly positive, but the MACD and signal lines stayed below zero. That setup points to minor stabilization rather than a confirmed trend change, because both momentum lines remain in negative territory.
Binance order flow continues to favor sellers
A CryptoQuant analysis by Arab Chain found that XRP’s Binance Cumulative Volume Delta remained negative at about 6.93 million. CVD measures the difference between market buy and sell orders. A negative reading means sellers executed more volume than buyers.
The 30-day Price-CVD Confirmation Score held near 0.84. The analyst said the reading confirms that price and order flow continue to move together, but does not show enough buying demand for a reversal. A sustained move in CVD above zero, with a rising score, would offer clearer evidence that buyers have returned.
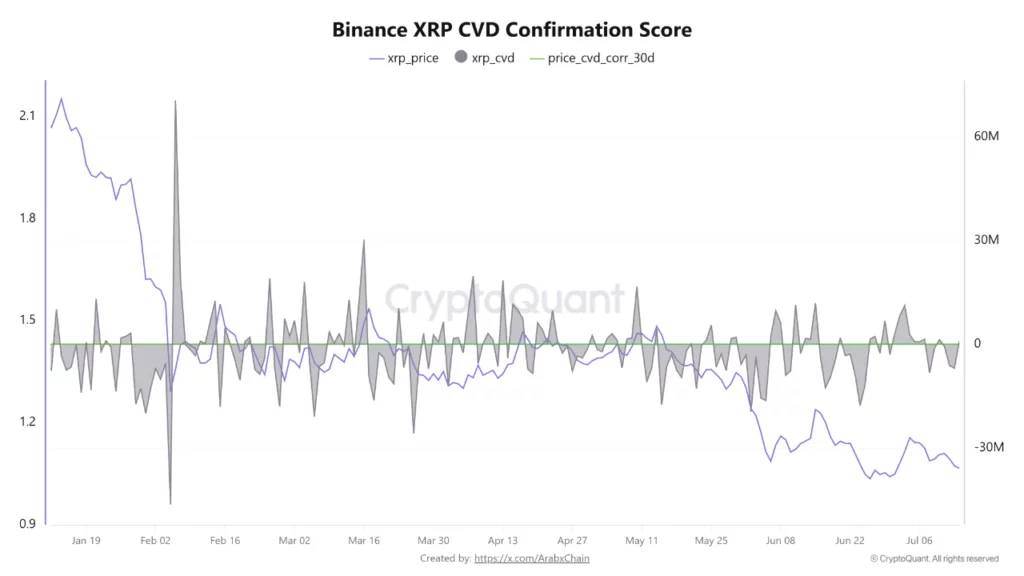
The data supports the short-term chart structure. The token has stayed close to $1.07 while spot sellers limit rebounds. Binance remains one of the largest XRP markets, making its order flow useful for judging whether price moves have support from spot demand.
Bullish social sentiment creates a mixed signal
Santiment said XRP recorded 3.02 bullish comments for every bearish comment on Monday. Ether followed at 2.31, while Bitcoin posted a more balanced ratio of 1.40. XRP therefore carried the strongest level of optimism among the three assets.
Santiment warned that crowded optimism can work against prices when markets already trade lower. “Crypto typically moves opposite to what the crowd is loudly expecting,” the firm wrote. It said strong bullish discussion around XRP and Ether could slow a rebound or create short-term downside risk.
The reading follows an earlier rise in XRP network growth and social interest near the $1 support region. New activity can attract buyers, but sentiment alone does not confirm demand. The split between positive commentary and negative Binance order flow keeps attention on both price and liquidity.
$50 XRP scenario depends on a $100 trillion crypto market
Crypto commentator Moon Lambo calculated that XRP could reach $50.10 if the total cryptocurrency market grew to $100 trillion and XRP retained a 3.13% share. That outcome would assign about $3.13 trillion in value to XRP, based on its circulating supply.
Moon Lambo stated, “I’m not making a prediction.” The calculation only shows price under fixed assumptions. At a 1% share of a $100 trillion market, XRP would trade near $16.01. A 5% share would place it around $80.08, while 10% would imply about $160.15.
Those figures do not describe XRP’s current market setup. The global crypto market would need to expand many times, while XRP would need to retain or increase its share. Supply changes, adoption, regulation and market structure would also affect future valuation.
XRP entered July between support around $1.00 to $1.06 and resistance near $1.18 to $1.20. Spot XRP exchange-traded funds also recorded $7.29 million in net outflows on July 8, their largest daily withdrawal since March.
Disclosure: This article does not represent investment advice. The content and materials featured on this page are for educational purposes only.


A former Los Angeles County Sheriff’s Department deputy has been sentenced to 18 months in federal prison after admitting he lied to federal investigators about threats made by a cryptocurrency businessman during a 2021 extortion incident.
Summary
- A former Los Angeles sheriff’s deputy was sentenced to 18 months in prison for lying to federal investigators in a crypto-related extortion case.
- Prosecutors said the deputy witnessed Adam Iza threaten a victim with live ammunition before demanding a $25,000 payment.
- Iza remains in federal custody after multiple guilty pleas, including his role in a bitcoin-linked kidnapping conspiracy in Connecticut.
The U.S. Attorney’s Office for the Central District of California said U.S. District Judge Percy Anderson also imposed a $10,000 fine on Scott Allen Simpkins, who pleaded guilty on March 17 to one count of obstruction of justice. Simpkins resigned from the Los Angeles County Sheriff’s Department’s Special Enforcement Bureau after entering his felony plea, according to the office.
Federal prosecutors said Simpkins falsely denied witnessing cryptocurrency businessman Adam Iza threaten a victim with live ammunition during an incident at Iza’s Bel Air home in 2021.
Court records cited by the U.S. Attorney’s Office said Simpkins was working private security at the residence with fellow former LASD deputy Christopher Michael Cadman. Both men were employed by Saavedra & Associates, a private security company owned by then-LASD Deputy Eric Chase Saavedra.
According to prosecutors, Iza placed four or five live 9mm rounds on his desk, spun one of the bullets while threatening the victim, and demanded a $25,000 transfer before Simpkins and Cadman escorted the victim off the property.
The U.S. Attorney’s Office said the two deputies received $1,400 each for their work that day. After helping Saavedra & Associates secure a longer-term security contract with Iza, the company paid each of them about 10% of its profits from the contract’s first month, prosecutors added.
Iza still awaits sentencing
Separate federal cases against Iza have continued to move forward.
The U.S. Attorney’s Office said Iza has remained in federal custody since September 2024 after pleading guilty in California in January 2025 to conspiracy against rights, wire fraud, and tax evasion. He has not yet been sentenced in that case.
In a separate prosecution, the U.S. Department of Justice announced in June that Iza also pleaded guilty in federal court in Connecticut to conspiracy to interfere with commerce by robbery. The charge carries a maximum prison sentence of 20 years.
According to the Justice Department, the Connecticut case involved a 2024 kidnapping plot targeting the parents of Veer Chetal, a man accused of participating in the theft of about 4,100 bitcoin. Prosecutors said Iza and his brother, Saif Faiq, organised the scheme in an attempt to extort cryptocurrency.
As pre DOJ records, Faiq pleaded guilty on June 9, when he admitted recruiting six men from Florida, arranging their travel to Connecticut, and coordinating surveillance before the attack in Danbury. Prosecutors said the group allegedly forced Sushil and Radhika Chetal from their vehicle after staging a collision, assaulted them, and briefly held them captive. The six alleged attackers later pleaded guilty to kidnapping and carjacking offences, according to the department.
Federal records cited by the DOJ show Veer Chetal separately pleaded guilty in November 2025 to charges connected to the theft of approximately 4,100 bitcoin and is awaiting sentencing.


You press send on a crypto transaction and nothing happens. The wallet says pending. The block explorer shows your transaction floating in limbo, unconfirmed, with no clear indication of when, or whether, it will land.
Most people meet the mempool for the first time in exactly this moment of mild panic, and most of the advice they find assumes they already know what a mempool is. This guide starts from zero.
The mempool, short for memory pool, is the waiting room where every blockchain transaction sits between the moment you broadcast it and the moment a miner or validator writes it into a block. It is one of the least glamorous components of a public blockchain and one of the most consequential. The mempool decides how much you pay in fees, how long you wait, and, on some networks, whether a trading bot gets to see your order before it executes and profit at your expense. Understanding it turns confirmation delays from a mystery into a readable market signal.
This guide explains what the mempool actually is, why blockchains need a waiting room at all, how transactions move through it step by step, how fee markets decide who gets confirmed first, why there is no single mempool but thousands of slightly different ones, what happens when the queue overflows, how the mempool became the hunting ground for extractive trading bots, why Solana took the radical step of removing the public mempool entirely, and what practical steps you can take when your own transaction gets stuck.
What a mempool actually is
A mempool is a database of unconfirmed transactions that every full node on a blockchain network maintains in its working memory. When you sign a transaction in your wallet and hit send, the transaction does not travel to some central server for processing, because no such server exists. Instead, your wallet hands the signed transaction to a node, and that node begins spreading it to its peers, who spread it to their peers, until most of the network has a copy. Each node that receives the transaction runs a series of checks and, if the transaction passes, places it in its local mempool to wait.
The word itself is a contraction of memory and pool, and the memory part matters. Nodes keep the mempool in RAM instead of writing it to disk, because speed is the point. When a miner assembles a candidate block, it needs to sort thousands of pending transactions by fee and select the most profitable set in a fraction of a second. When a new block arrives from elsewhere on the network, a node can validate it faster if most of the block’s transactions are already sitting in its own mempool, checked and ready.
The mempool is a staging area, a buffer between the chaotic, continuous stream of user activity and the rigid, periodic heartbeat of block production.
Why blockchains need a waiting room
A traditional payment processor confirms transactions the instant they arrive because a single company controls the ledger and can simply write the entry. A public blockchain has no such authority. Thousands of independent nodes must agree on a single history, and they reach that agreement in discrete steps, one block at a time. Between blocks, the network needs a shared, informal picture of what users want to happen next, and the mempool provides it.
The waiting period also does critical security work. Before a node admits a transaction to its mempool, it verifies that the digital signature is valid, that the sender actually controls the funds being spent, that the transaction is correctly formatted, and that the same coins are not being spent twice. This last check matters more than it sounds. It is entirely possible for two conflicting transactions, both spending the same coins, to enter the network at the same time from different points. Some nodes see one first, some see the other. Each node rejects whichever conflicting transaction arrives second, and the conflict is finally settled when a miner includes one of the two in a block. The mempool is where these races are held and resolved.
The mempool also functions as the network’s early warning system. A rapidly filling mempool signals a surge of demand, a panic, an airdrop claim window, or a fee spike before any of it shows up in confirmed blocks. Traders, miners, and wallet fee estimators all read the mempool the way meteorologists read pressure systems.
The life of a transaction, step by step
Following a single transaction through the pipeline makes the mechanics concrete. First comes creation: your wallet constructs the transaction, specifying the amount, the recipient, and the fee you are willing to pay, and signs it with your private key. The signature proves ownership without revealing the key itself.
Second comes broadcast. The wallet sends the signed transaction to one or more nodes, which begin relaying it across the peer to peer network. Propagation to most of the network typically takes a few seconds, and nothing about this step requires trust in the first node, since every subsequent node re-validates the transaction independently before passing it along.
Third comes validation. Every node that receives the transaction independently checks it. Invalid transactions, bad signatures, insufficient funds, malformed data, are dropped on the spot and never reach a mempool.
Fourth comes the wait. The transaction now sits in thousands of mempools across the network, visible to anyone running a node or using a public mempool explorer. How long it waits depends almost entirely on the fee attached relative to everyone else’s fees.
Fifth comes selection. A miner on a proof of work chain, or a validator on a proof of stake chain, assembles a candidate block by picking pending transactions from its mempool, almost always sorting by fee density so the block earns the maximum reward.
Sixth comes confirmation. The block is mined or proposed, propagated, and accepted by the network. Every node removes the block’s transactions from its mempool, and your transaction is now part of the chain. Each additional block built on top adds another confirmation and makes reversal exponentially harder.
How the fee market decides who goes first
Block space is scarce and demand fluctuates, so blockchains ration space by auction. On Bitcoin, fees are measured in satoshis per virtual byte, a unit of transaction data size, so a transaction’s fee rate depends on both what you pay and how much space the transaction occupies. On Ethereum, the fee is gas, with a base fee that the protocol burns and a priority tip that goes to the validator. In both systems the logic is identical: block producers are profit maximizers, so they fill blocks with the highest paying transactions first.
This means your position in the queue is not fixed. A transaction that looked competitively priced at noon can be hopelessly underpriced by evening if demand surges. Wallets estimate fees by reading the current mempool, looking at what pending transactions are offering and how full recent blocks have been, then suggesting a rate likely to confirm within your chosen time window. Those estimates are educated guesses, not guarantees, and they go stale quickly during volatile markets. A fee that clears in the next block during a quiet Sunday can leave you waiting hours during a liquidation cascade, because everyone else’s willingness to pay moved while yours stood still. The auction never closes, and it reprices continuously.
When you underpay, most networks offer escape hatches. Bitcoin supports replace by fee, which lets you rebroadcast the same transaction with a higher fee that supersedes the original. A related trick, child pays for parent, attaches a high fee follow up transaction that spends the stuck one’s output, giving miners an incentive to confirm both together. Ethereum wallets let you resubmit a transaction with the same nonce and a higher gas price, which replaces the pending version. Knowing these tools exist converts a stuck transaction from an emergency into an inconvenience.
There is no single mempool
People say the mempool as if one canonical queue existed somewhere, but the reality is messier and more interesting. Every node maintains its own mempool, and no two are exactly identical. Transactions reach different nodes at different times, nodes apply slightly different acceptance policies, and each node manages its own memory limits. What we call the mempool is really the loose statistical overlap of thousands of private ones.
In practice the overlap is large, because most node operators run default settings. A typical Bitcoin node caps its mempool around 300 megabytes, keeps transactions for up to two weeks, and refuses anything paying less than a minimum relay fee of roughly one satoshi per virtual byte. When the pool exceeds its size cap, the node evicts the lowest fee transactions first and raises its minimum acceptance rate, which is why very cheap transactions can vanish entirely during congestion instead of merely waiting. Once evicted everywhere, a transaction is effectively cancelled, and the funds simply remain unspent in the sender’s wallet.
The distributed nature of the mempool has a subtle consequence: pending status is not a promise. A transaction shown as pending in an explorer exists only as a claim in some nodes’ memory. It can be evicted, replaced, or double spent until it lands in a block. Merchants who accept zero confirmation payments learn this lesson the hard way, and it is exactly the mechanism a 51% attack exploits at chain level, where an attacker rewrites recent blocks and dumps the reversed transactions back into the mempool as if they had never confirmed. The 2025 reorganization attacks on Monero pushed more than one hundred confirmed transactions back into the pending queue in exactly this way.
Policy, standardness, and why nodes reject valid transactions
Consensus rules define what a blockchain will accept in a block. Mempool policy defines what an individual node will hold and relay, and the two are not the same thing. A transaction can be perfectly valid under consensus rules and still be refused by most mempools because it violates what Bitcoin developers call standardness: informal policy rules that filter dust outputs, oversized scripts, absurdly low fees, and exotic transaction shapes that could burden the network. Policy is a node level immune system, a first line of defense that keeps the shared queue usable.
This distinction produces real world confusion. A transaction rejected by public mempools can still be mined if it reaches a miner directly, which is why services exist that accept nonstandard transactions out of band and submit them straight to mining pools. It also means the mempool you observe through an explorer reflects that node’s policy, not some universal truth. Two explorers can disagree about whether your transaction is pending simply because their nodes apply different filters.
Policy also evolves faster than consensus. Nodes have tightened and loosened relay rules around data inscriptions, dust limits, and replacement behavior repeatedly over the years, each change reshaping what the pending queue looks like without touching consensus at all. For users the practical takeaway is simple: if a wallet warns that a transaction is nonstandard, the problem is usually the transaction’s construction, not the funds behind it.
The mempool also has a quieter institutional audience. Exchanges watch pending deposits to credit accounts faster, compliance teams screen incoming transactions before confirmation, and payment processors estimate risk on zero confirmation transfers by checking how well a transaction is propagating and whether any conflicting spend is circulating. A transaction that most of the network’s mempools agree on is far less likely to be double spent than one propagating poorly, and firms price that difference.
Congestion, spam, and what a full mempool feels like
Mempool congestion is the network catching its breath. Demand exceeds block space, the queue grows, and the fee needed for timely confirmation climbs. Users experience it as expensive transactions and long waits. Bitcoin’s late 2017 mania, the DeFi summer of 2020, NFT minting waves, and the ordinals inscription craze of 2023 each produced mempool backlogs measured in days, with hundreds of thousands of transactions queued and fee rates multiplying overnight. During the worst stretches, low fee transactions waited more than a week, and node operators watched their mempools hit size limits and begin shedding the cheapest traffic.
Congestion can also be manufactured. Spam attacks flood the network with masses of low value transactions to clog the queue and degrade service for everyone else, a cheap form of denial of service. Networks defend themselves with the minimum relay fee, with eviction policies, and ultimately with economics, since sustained spam costs the attacker real money in fees. The 2017 spam attack on an Ethereum test network showed how effective flooding could be against a chain with weak fee pressure, and it pushed fee market design higher up the research agenda.
Congestion is also information. A swollen mempool alongside rising fees signals urgent demand, often around exchange runs, liquidation cascades, or major market moves. Sophisticated observers watch mempool depth the way bond traders watch yields, and several analytics firms sell exactly that feed.
The dark forest: MEV and the watchers in the pool
The mempool’s defining feature, total transparency, is also its greatest vulnerability. Every pending transaction is public before it executes, which means anyone can read your intentions and act on them first. On smart contract chains this gave rise to an entire extractive industry built around maximal extractable value, or MEV, the profit available to whoever controls transaction ordering.
The canonical attack is the sandwich. A bot spots your large pending swap on a decentralized exchange, buys the same token first to push the price up, lets your trade execute at the worse price, then immediately sells for a profit carved directly out of your execution. Front running, back running, and liquidation sniping follow the same principle: see the pending transaction, position around it, capture the difference. One researcher famously described the public mempool as a dark forest, a place where anything visible gets hunted. Researchers estimate that MEV extraction on Ethereum alone has run into the billions of dollars since 2020.
The defense industry that grew in response is now substantial. Private transaction relays, such as Flashbots Protect, let users submit transactions directly to block builders, skipping the public mempool entirely so bots never see the order. Batch auction exchanges settle many trades at a single clearing price, removing the ordering advantage. Wallets increasingly route large trades through protected channels by default. None of this eliminates MEV, but it changes who can be hunted. The economics are straightforward: the value of hiding an order grows with its size, so large traders now treat mempool privacy the way traditional funds treat dark pools, as basic operational hygiene. Retail users moving small amounts face far less risk, but a single large swap through the public queue on a thin trading pair can pay a triple digit toll to a sandwich bot in a matter of seconds.
Solana’s answer: delete the mempool
Solana made the most radical design choice of any major network: it has no public mempool at all. Instead of gossiping pending transactions across the whole network, Solana’s Gulf Stream protocol forwards transactions directly to the validator scheduled to produce the next block, called the leader. The leader schedule is known in advance, so wallets and nodes know exactly where to send traffic. Transactions go from user to leader with almost no public waiting period.
The design serves speed above all, and it removes the classic observation window that sandwich bots depend on, since pending transactions are never broadcast for public inspection. It did not eliminate MEV, which instead matured into a private auction economy where searchers pay tips through infrastructure such as Jito to have their transaction bundles placed favorably by leaders. The lesson generalizes: ordering has value on any blockchain, and removing the public queue changes where that value is captured, not whether it exists.
Other networks are converging on middle paths. Encrypted mempools hide transaction contents until ordering is locked. Proposer builder separation on Ethereum splits the job of choosing transactions from the job of proposing blocks, pushing MEV into a more transparent auction. The mempool of 2030 will likely look very different from the open bazaar of 2020. What will not change is the underlying constraint: some component of every blockchain has to hold transactions between creation and confirmation, and whoever can observe or influence that component holds power over everyone who cannot.
Reading the mempool yourself
You do not need to run a node to watch the queue. Public mempool explorers visualize pending transactions, fee distributions, and projected confirmation times in real time, and they are the fastest way to answer the two questions every stuck user asks: how busy is the network, and what fee actually clears right now.
When your own transaction is stuck, the diagnosis is almost always the same: your fee is below the going rate. Your options, in rough order of preference, are to wait for congestion to ease, to bump the fee using replace by fee or a nonce replacement, to use child pays for parent where supported, or, on Bitcoin, simply to wait for eviction if the payment no longer matters. What you should not do is panic. The funds are not lost. An unconfirmed transaction either confirms or effectively ceases to exist, and in the latter case the coins never left your wallet.
It also helps to understand what explorers actually display. The fee histogram shows how much pending volume sits at each fee level, which tells you where the clearing price is right now. The projected blocks view shows which transactions would fill the next several blocks if they were produced immediately, which tells you how deep the queue runs ahead of you. And the purge line, on Bitcoin explorers, shows the fee rate below which nodes are actively evicting transactions, the effective floor of the market. Ten minutes spent learning these three readouts pays for itself the first time fees spike.
One final habit worth adopting: check the mempool before you transact, not after. Thirty seconds of looking at current fee rates saves both overpaying during quiet periods and underpaying during storms. The queue is public. Very few people bother to read it, which is exactly why the ones who do have an edge. It is the same reason a network upgrade that splits the chain, covered in our guide to hard forks and soft forks, always produces a flurry of mempool drama, as wallets and nodes on both sides of the split sort out which pending transactions belong where.
Frequently asked questions
What is a mempool in simple terms?
A mempool is the waiting room for blockchain transactions. After you send a transaction, it sits in the mempool, visible and pending, until a miner or validator includes it in a block. Every full node keeps its own copy of this queue in memory.
Why is my transaction stuck in the mempool?
Almost always because the fee attached is lower than what other pending transactions are offering. Block producers pick the highest paying transactions first, so underpriced ones wait until demand falls or until they are evicted from the queue entirely.
Can a transaction in the mempool be cancelled?
Sometimes. On Bitcoin, replace by fee lets you supersede a pending transaction with a new version, and a stuck transaction that gets evicted from all mempools is effectively cancelled. On Ethereum, you can replace a pending transaction by sending a new one with the same nonce and a higher fee.
Is there one mempool for the whole network?
No. Every node maintains its own mempool, and the contents differ slightly between nodes based on timing, settings, and memory limits. The mempool people refer to is the rough overlap of thousands of independent queues.
How long can a transaction stay in the mempool?
On Bitcoin, default node settings keep transactions for up to two weeks before dropping them, though eviction can happen sooner if the pool fills and the fee is low. Other networks have their own retention and eviction rules.
What is the connection between the mempool and MEV?
Pending transactions in a public mempool are visible before they execute, so bots can read them and trade around them, extracting value through sandwich attacks and front running. This visibility is the raw material of most MEV on chains like Ethereum.
Does Solana have a mempool?
Not a public one. Solana forwards transactions directly to the upcoming block leader instead of broadcasting them across the network, which removes the public waiting room. MEV on Solana instead flows through private bundle auctions run by infrastructure providers.
Are funds lost if a transaction never confirms?
No. A transaction that never confirms is eventually dropped from mempools, and the coins simply remain in the sending wallet as if the transaction had never been made. Nothing is deducted until a transaction is included in a block.
This article is for educational purposes only and does not constitute financial or investment advice. Network rules, fee mechanics, and default node policies change over time. Details are accurate as of July 14, 2026.
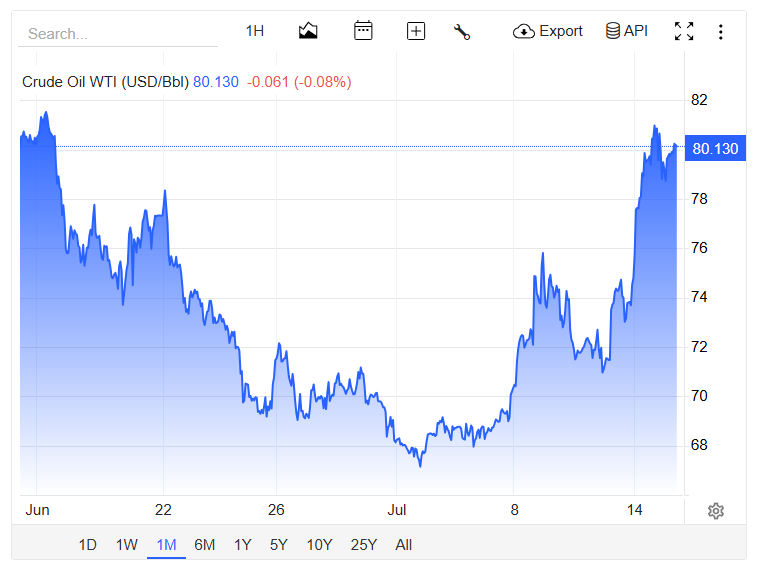
Oil’s safety net is disappearing. Brent crude broke above $85 a barrel Wednesday, and West Texas Intermediate (WTI) cleared $80.
Both benchmarks have risen for three straight days as US and Iranian forces trade strikes near the Strait of Hormuz. Traders say the bigger risk isn’t the daily move, but how much reserve capacity remains to absorb the next shock.
The Reserve Cushion Is Almost Gone
June Goh, a senior oil market analyst at Sparta Commodities, tracks that cushion closely. She told Al Jazeera the reserve buffer that absorbed months of supply shocks is nearly empty.
Washington has drawn down the Strategic Petroleum Reserve (SPR) throughout the conflict. It tapped the reserve each time fighting flared to soften the blow. Goh warns a sharp price jump could follow if Washington and Tehran keep escalating instead of easing tensions.
That warning follows an earlier G7 discussion, where governments weighed releasing up to 400 million barrels during a previous spike. It also echoes a recent alert from an ExxonMobil executive, who warned weeks ago that global inventories were tightening fast.
Trump Ties Strikes to a Blockade Reversal
President Donald Trump has raised the stakes further. He told Fox News that strikes will intensify next week. The targets, he said, are Iranian power plants and bridges, unless Tehran returns to the table.

Iran has not ruled out charging its own tolls on Hormuz shipping in response. Trump, meanwhile, reversed course on a separate plan. He dropped a proposed 20% fee on cargo moving through the strait. Gulf states will offer trade and investment deals instead, he said.
The US reimposed its naval blockade on Iranian ports the same day. That built on Trump’s earlier push to assert control over the waterway.
Shipping traffic has already responded. MarineTraffic recorded 57 transits through Hormuz from Friday through Sunday, a drop of more than 50% from the previous week. Before the war began in February, the strait handled roughly 130 transits a day.
Wall Street Is Pricing In $100 Oil
Bart Melek, global head of commodity strategy at TD Securities, thinks the rally could run further.
“I suspect that a move to $100 is quite possible, should it become apparent that physical shortage risks are real and increasingly likely.”
The US Department of Energy disputes the shortage narrative. It said Monday that 8.5 million barrels crossed the strait the day before with military assistance. That pace, it said, matches typical flows.
Higher crude could complicate the inflation outlook too. Analysts had expected the June CPI report to show cooling prices as fuel costs retreated. Whether that trend survives now depends on Trump’s next move, and on whether Tehran decides to return to the table.
The post Oil Pushes Above $85 as US Reserve Buffer Depletes: Will Crude Hit $100? appeared first on BeInCrypto.
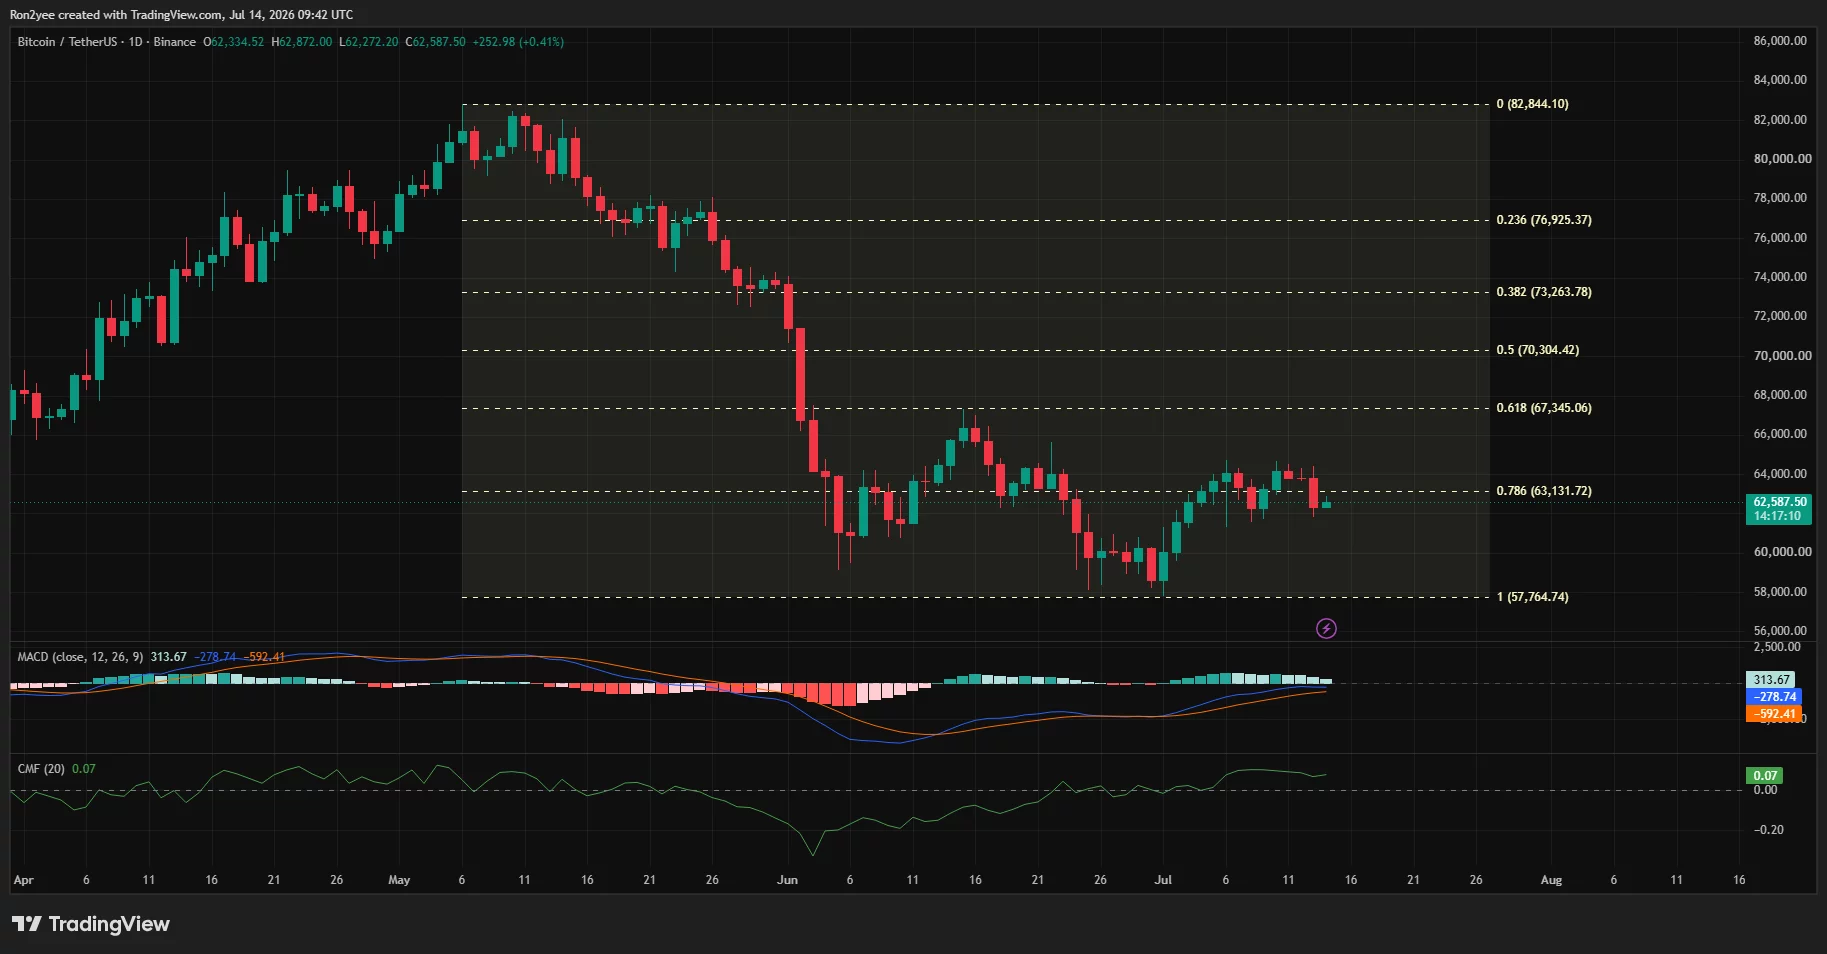
Bitcoin price has stabilized near $62,500 after a weekend plunge below $62,000, while renewed U.S.-Iran hostilities and an oil surge have kept analysts cautious before U.S. inflation data.
Summary
- Bitcoin price held around $62,500 as traders weighed Trump’s Strait of Hormuz blockade ahead of the U.S. CPI report.
- Technical indicators show resistance near $63,100-$64,700, while analysts warn a break below $62,000 could trigger deeper losses.
- Rising oil prices, ETF outflows, and liquidation clusters have left Bitcoin vulnerable to sharp post-CPI volatility.
According to data from crypto.news, Bitcoin (BTC) price traded at about $62,504 on July 14 after moving between an intraday low of $61,794 and a high of $63,063. The recovery has remained limited after sellers rejected the asset above $64,000 and forced a fast retreat toward the lower end of its July range.
Brent crude climbed above $85 per barrel after President Donald Trump announced the return of a U.S. naval blockade on Iran and a 20% charge on cargo shipped through the Strait of Hormuz. Higher fuel costs could complicate the inflation outlook and reduce the case for easier monetary policy.
The June U.S. CPI report is scheduled for 8:30 a.m. Eastern Time, followed by Federal Reserve Chair Kevin Warsh’s testimony before the House Financial Services Committee at 10 a.m. A stronger inflation print or hawkish remarks could lift bond yields and weigh on Bitcoin, while softer data may help buyers challenge resistance.
Farside Investors recorded $424.7 million in net outflows from U.S. spot Bitcoin ETFs on July 13, including $185.5 million from BlackRock’s IBIT and $245.6 million from Fidelity’s FBTC. The withdrawals reversed the previous session’s $90.4 million inflow and reduced a key source of spot demand.
Bitcoin price has failed to reclaim $63,100 resistance
On the daily chart, Bitcoin remains below the 0.786 Fibonacci retracement at $63,131, drawn from the May peak near $82,844 to the June low around $57,765. A daily close above that level would improve the recovery setup and place the $64,000–$64,690 zone back in focus.
The daily MACD line has crossed above its signal line, but both remain below zero, while the positive histogram has narrowed during the latest pullback. Chaikin Money Flow stands at 0.07, slightly above zero, though price has not cleared resistance.
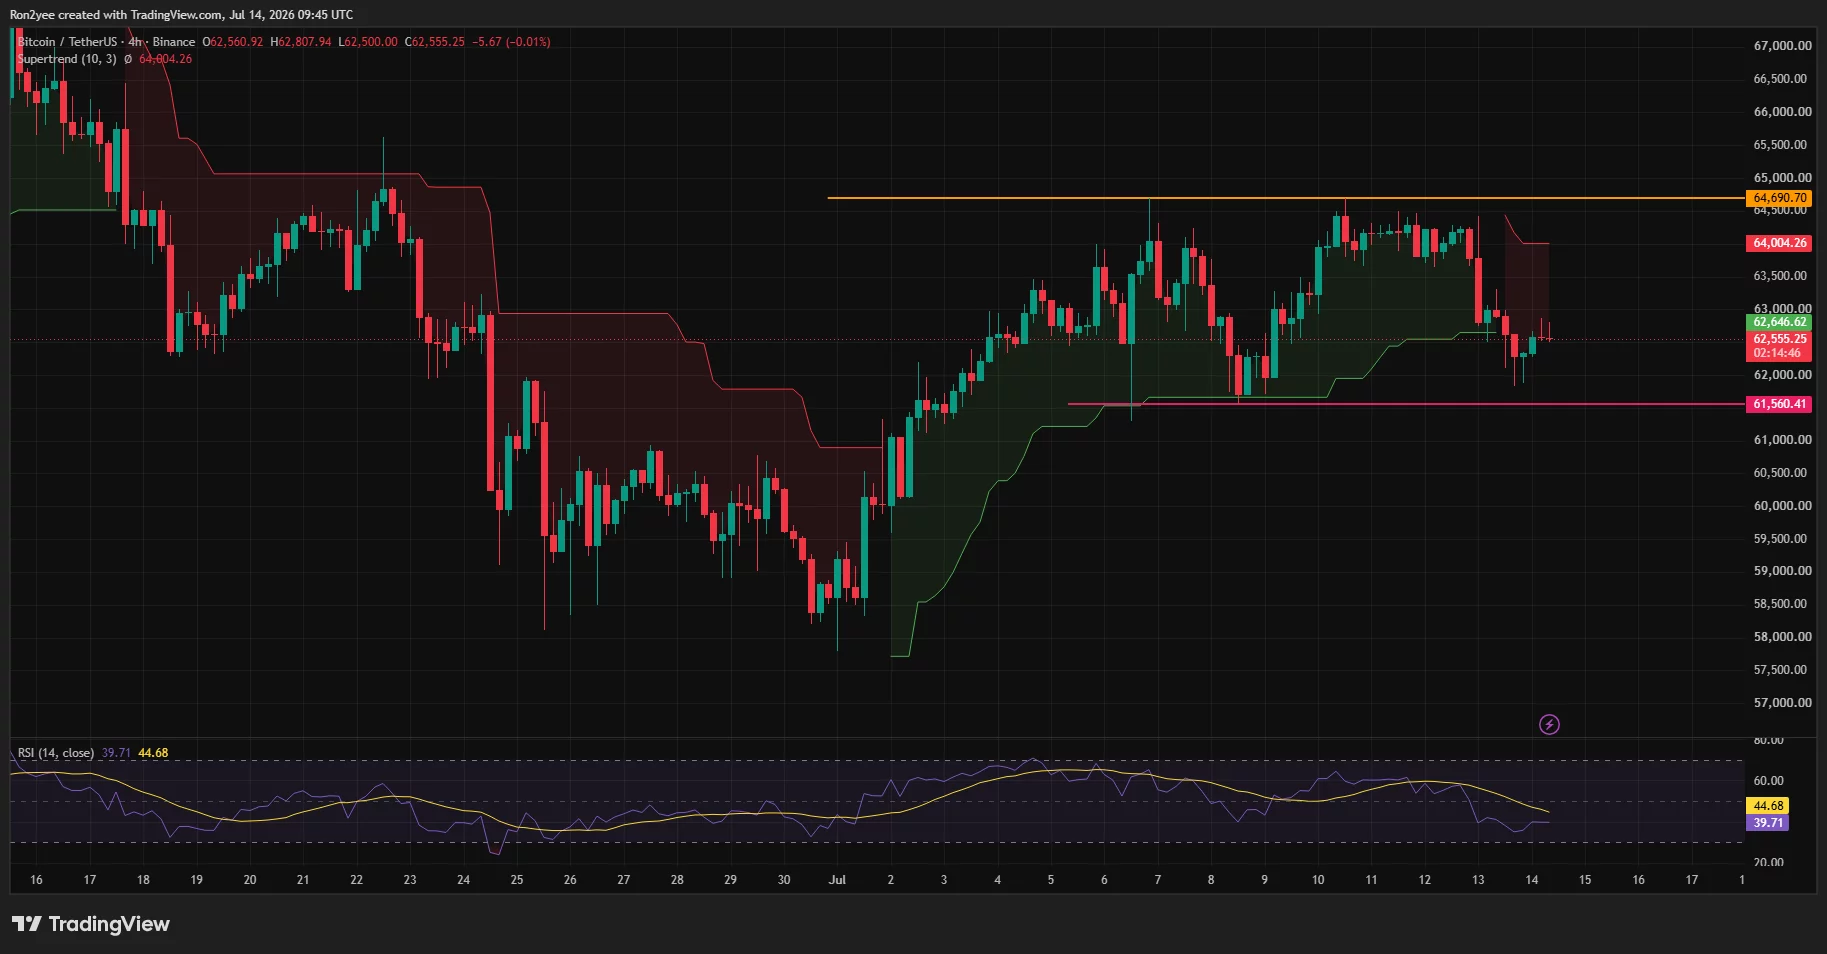
On the 4-hour chart, Bitcoin trades below the Supertrend barrier at $64,004, while the RSI sits at 39.71 and below its 44.68 moving average. Immediate support lies near $61,560, with the main range ceiling at $64,690.
CoinGlass’s one-week liquidation heatmap shows dense leverage around $61,000–$61,500 below price and another large cluster near $64,800–$65,000 above it. According to crypto analyst Lennaert Snyder, open interest rose during the latest drop as spot selling increased and funding stayed positive.
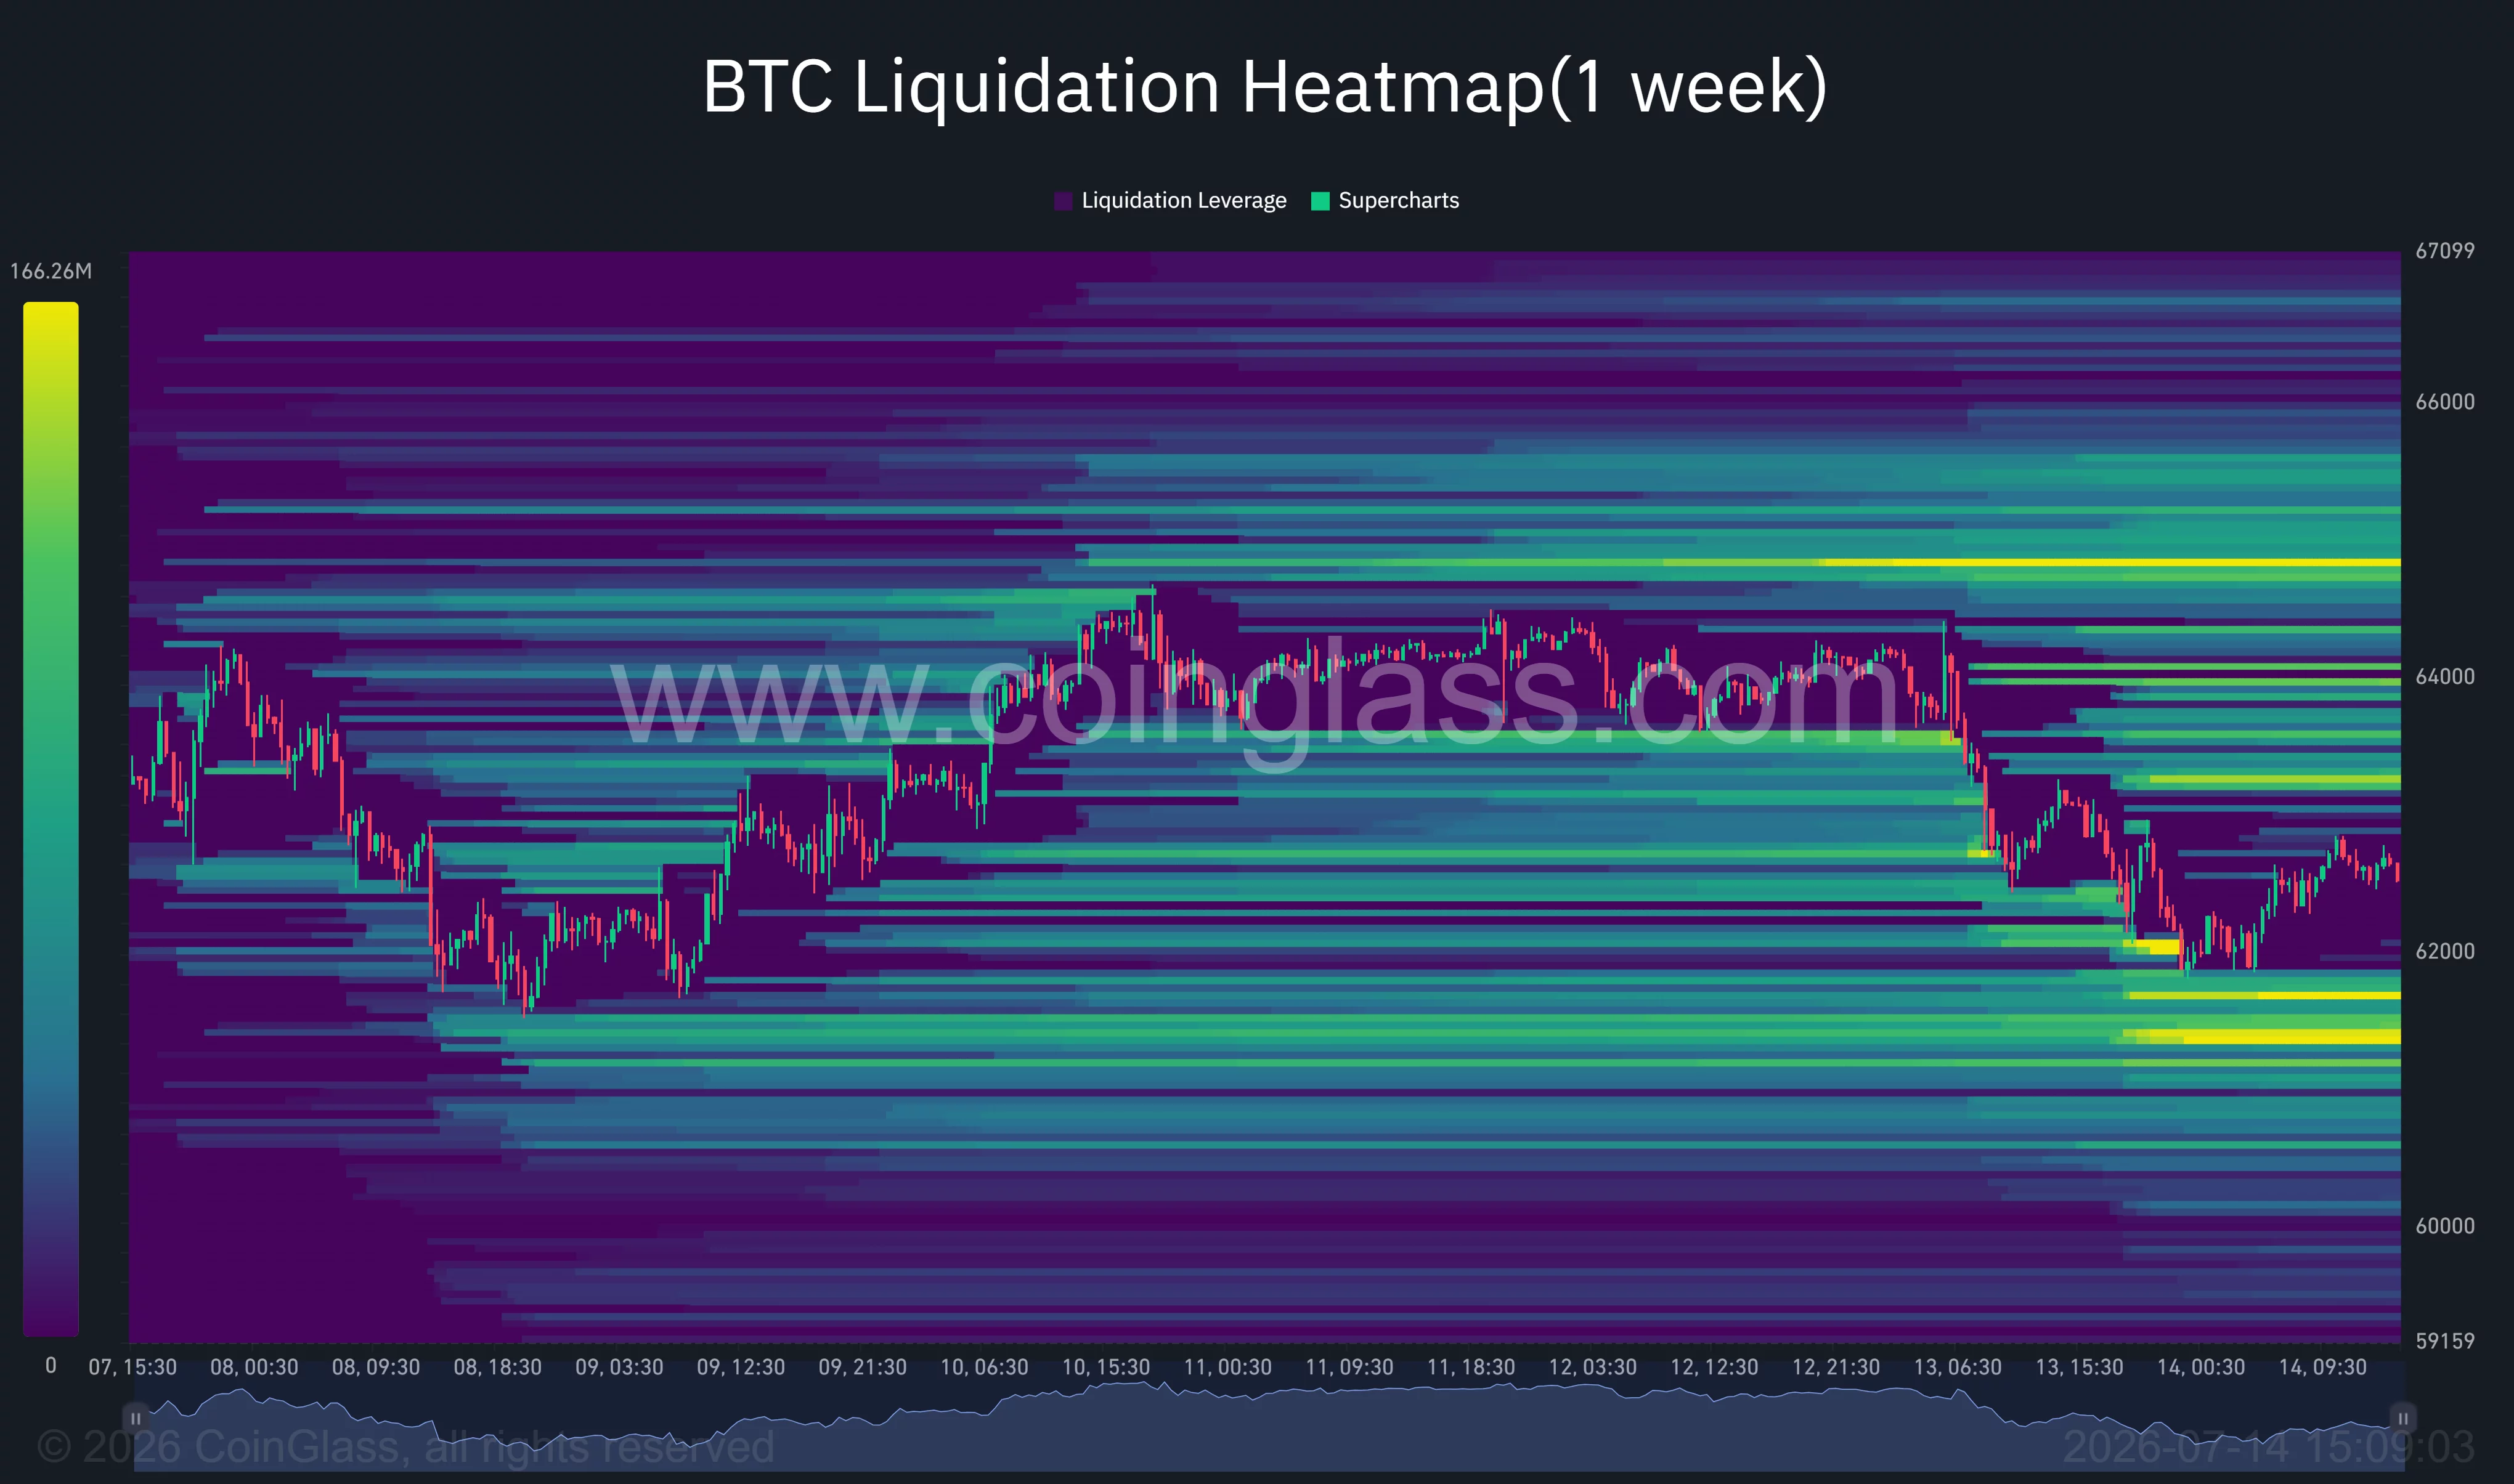
“If CPI triggers enough volatility and pushes price towards the 63.5K zone, I’m shorting the reaction towards 60.4K,” Snyder wrote.
A close below $62,000 would expose $60,400
Commenting on the key invalidation level, crypto analyst Ted Pillows noted that Bitcoin was still holding $62,500 but warned:
“A daily close below $62,000-$62,500 would be bad for Bitcoin.”
A breakdown below $61,560 would expose Snyder’s $60,400 target, followed by the monthly open near $58,700 and the daily swing low at $57,765. Renewed attacks near the Strait of Hormuz, another oil surge, persistent ETF withdrawals, or a hawkish CPI reaction would raise the chance of that move.
Bulls need to recover $63,131 first, then close above the Supertrend at $64,004 and horizontal resistance at $64,690. Until those levels fall, Bitcoin remains trapped between liquidation liquidity on both sides, with macro data likely to decide which cluster is tested first.
Disclosure: This article does not represent investment advice. The content and materials featured on this page are for educational purposes only.

The European Central Bank has moved the digital euro project into its next phase, selecting payment service providers to take part in a pilot designed to stress-test how a potential central bank digital currency could work in real-world payments.
In an announcement published Tuesday, the ECB said it has chosen 36 payment service providers (PSPs) to participate in the digital euro pilot. The project follows the ECB’s earlier work on the concept and comes as European policymakers continue exploring a CBDC while other jurisdictions take markedly different positions.
Key takeaways
- The ECB selected 36 payment service providers for a digital euro pilot after receiving more than 50 applications.
- The 12-month trial is scheduled to begin in the second half of 2027, with testing involving the ECB and central banks across 19 euro-area countries.
- Participants include both major banks and fintechs, such as Deutsche Bank, UniCredit, BPCE, Stripe, and Revolut.
- Italy leads the participant list with seven selected firms, while Germany, Portugal, and Greece have smaller groups.
- The pilot’s focus is on testing user access and merchant payment flows before any potential token issuance.
ECB selects 36 providers for the pilot
According to an official ECB announcement published Tuesday, the central bank has picked 36 PSPs to join the digital euro pilot. The ECB described the process as part of moving from design and planning into hands-on testing with the private sector.
The ECB said it opened a call for interest in March 2026 and received more than 50 applications from payment companies. The selected group spans a range of business types, including traditional banks, payment processors, and non-bank service providers.
Among the names included are fintechs such as Stripe and Revolut, alongside established banks including Deutsche Bank, UniCredit, and BPCE. While the ECB’s selection is specific to pilot participation, Revolut’s broader approach to crypto services has been in flux for EU customers in recent months, including a reported move to phase out support for Tether USDt in some regions.
A euro-area wide test with local and cross-border roles
The pilot is planned to involve the ECB and the central banks of 19 euro-area member states. The ECB noted that the testing will include institutions across countries such as Belgium, Germany, France, Italy, Spain, and the Netherlands—reflecting an effort to examine how a single digital euro framework could operate across different payment environments.
ECB officials said the selected providers are intended to create a “broad testing environment,” including the ability for participants to offer pilot services outside their home markets. That matters because payment rails, customer behavior, and commercial partner ecosystems differ significantly across the euro area. A wider spread of PSPs could therefore help the ECB identify friction points earlier.
The ECB also laid out that participants would carry different responsibilities. Some firms are expected to support user access to beta digital euro services, while others focus on merchant acceptance and payments. Several PSPs will take on both functions during the trial.
Italy leads participation as ECB tallies geography
Geographically, the ECB highlighted that Italy has the largest number of selected participants. Seven Italian firms were chosen to join the pilot: UniCredit, Poste Italiane, Nexi Payments, Banca Sella, Banca Monte dei Paschi di Siena, Isybank, and Numia.
Germany follows with five selected providers. Portugal and Greece each have three firms in the pilot cohort. The ECB said the country mix is designed to support testing across multiple national payment ecosystems, while also allowing selected PSPs to operate beyond their home markets.
Why the ECB is bringing in PSPs now
ECB Executive Board member Piero Cipollone—who chairs the high-level task force on the digital euro—said the level of participation shows strong private-sector interest in helping shape the project. He also suggested the central bank expects increased cooperation with payment providers as testing moves forward.
“We look forward to deeper engagement as we work with and learn alongside European payment service providers in developing a secure, efficient and inclusive digital euro,” Cipollone said.
For investors and builders watching the digital euro track, the selection signals that the ECB is prioritizing operational readiness and distribution-channel testing rather than focusing exclusively on design. By involving PSPs before any potential issuance, the pilot’s immediate goal is to evaluate how a digital euro could be accessed and used—through both customer interfaces and merchant payment systems—under realistic conditions.
That timing also places the digital euro in the middle of an international policy split. While Europe presses ahead with CBDC experimentation, the United States has moved to block the Federal Reserve from issuing a CBDC, according to earlier reporting. The contrast underscores how governance choices can shape the pace of experimentation, even when both sides acknowledge the broader question of what role public money-like digital instruments should play in future payment systems.
Next, the market will likely focus on how the pilot’s structure affects real adoption: which PSPs emphasize consumer onboarding versus merchant enablement, how interoperability is handled across the 19 participating central banks, and what technical or policy issues the ECB identifies during the 12-month run starting in the second half of 2027.
Stephen “Cap” Newnham, who leads the Solana community group Superteam UK, said he will run as an independent candidate in the Aug. 13 parliamentary by-election in Clacton against Reform UK leader Nigel Farage.
On Tuesday, Newnham outlined five campaign pledges, including support for local entrepreneurs, digital and artificial intelligence education, financial literacy in schools and onchain political transparency. He announced his intention to stand as an independent candidate on July 9.
Newnham’s fourth pledge, “You should own your pension,” argues that existing structures like self-invested personal pensions and small self-administered schemes allow savers to choose where their assets are held. He also pledged full transparency, with donations and meetings published in plain English and onchain.
The campaign has not detailed a role for blockchain technology in managing pension assets or proposed changes to pension law. A blockchain could make published records more difficult to alter, but it would not by itself ensure that every donation or meeting had been disclosed.
Cointelegraph contacted Newnham for more information about his proposals but had not received a response by publication.
According to his LinkedIn profile, Newnham studied economics at the University of Edinburgh before joining the Solana ecosystem. He leads Superteam UK and has co-authored a report on blockchain and the future of work with Coinbase’s Stand With Crypto campaign and the DLT Science Foundation.
Superteam UK said the Cap for Clacton community was established to help retain technical talent in Britain by supporting founders and developers building on Solana, arguing that many entrepreneurs leave the country in search of better funding and startup opportunities abroad.
Farage funding scrutiny shapes contest
The candidacy brings an explicit crypto platform into a contest triggered when Farage resigned from Parliament on Wednesday and opted to recontest his Clacton seat amid a parliamentary standards investigation into whether Farage should have declared a 5 million pound ($6.7 million) personal gift from crypto investor Christopher Harborne. Farage has said he was not required to declare the gift because it was received before he entered Parliament.
Farage has faced additional scrutiny over reported financial support from crypto entrepreneur George Cottrell and allegations that his financial relationships intersected with his advocacy on digital asset policy. Farage has denied wrongdoing and said he followed parliamentary rules.
Related: Bank of England governor denies Farage lobbying swayed CBDC policy: Report
National poll favors Count Binface
At the time of writing, Democracy Club lists 11 prospective candidates, including Newnham, Farage and satirical candidate Count Binface, though the council is not expected to confirm the official field until July 17.
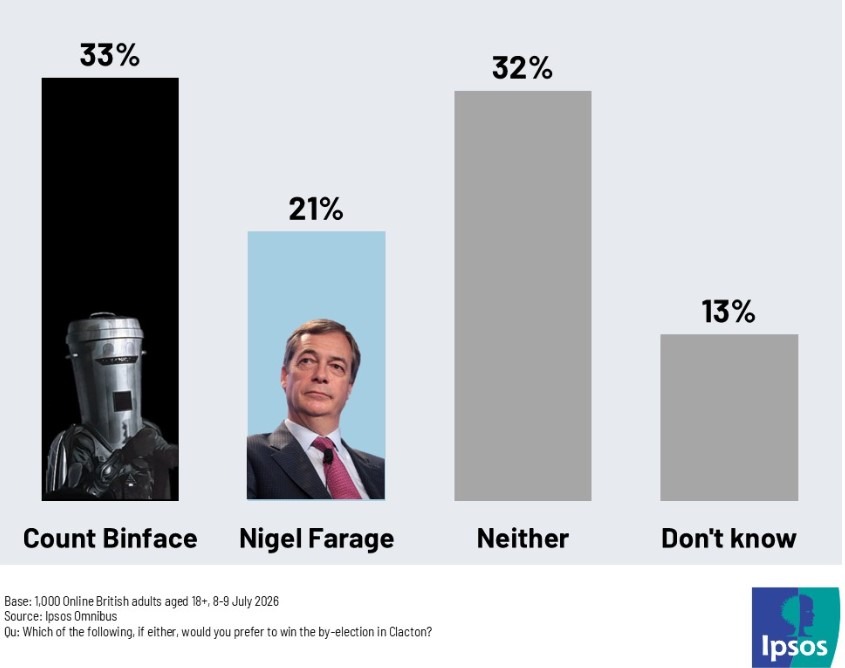
On Friday, an Ipsos survey of 1,000 British adults found 33% would prefer Binface to win, compared with 21% for Farage, but the national poll did not measure voting intentions among Clacton residents.
Early survey results on the upcoming by-election. Source: Ipsos
Despite the unconventional field, the result is being closely watched because of Farage’s involvement and the scrutiny surrounding his decision to force a new vote.
Magazine: Thai scammer’s $122M wallet, Japan embraces crypto credit: Asia Express
Ethereum has remained below $1,800 as traders await U.S. inflation data despite growing expectations of a breakout above $1,850.
Summary
- Ethereum remains below $1,800 as traders await U.S. CPI data and Fed signals.
- A breakout above $1,850 could trigger short liquidations and open a path toward $2,200.
- Analysts continue to back the bullish setup while $1,750 remains Ethereum’s key support.
The second-largest cryptocurrency traded around $1,780 after briefly slipping toward $1,770 following the latest geopolitical flare-up in the Middle East. Oil prices jumped after the weekend strikes, reviving concerns that inflation could remain elevated ahead of the June CPI release and Paul Warsh’s expected congressional testimony.
Any upside surprise could reinforce expectations for a hawkish Federal Reserve, limiting demand for risk assets and making the $1,800 barrier harder to overcome.
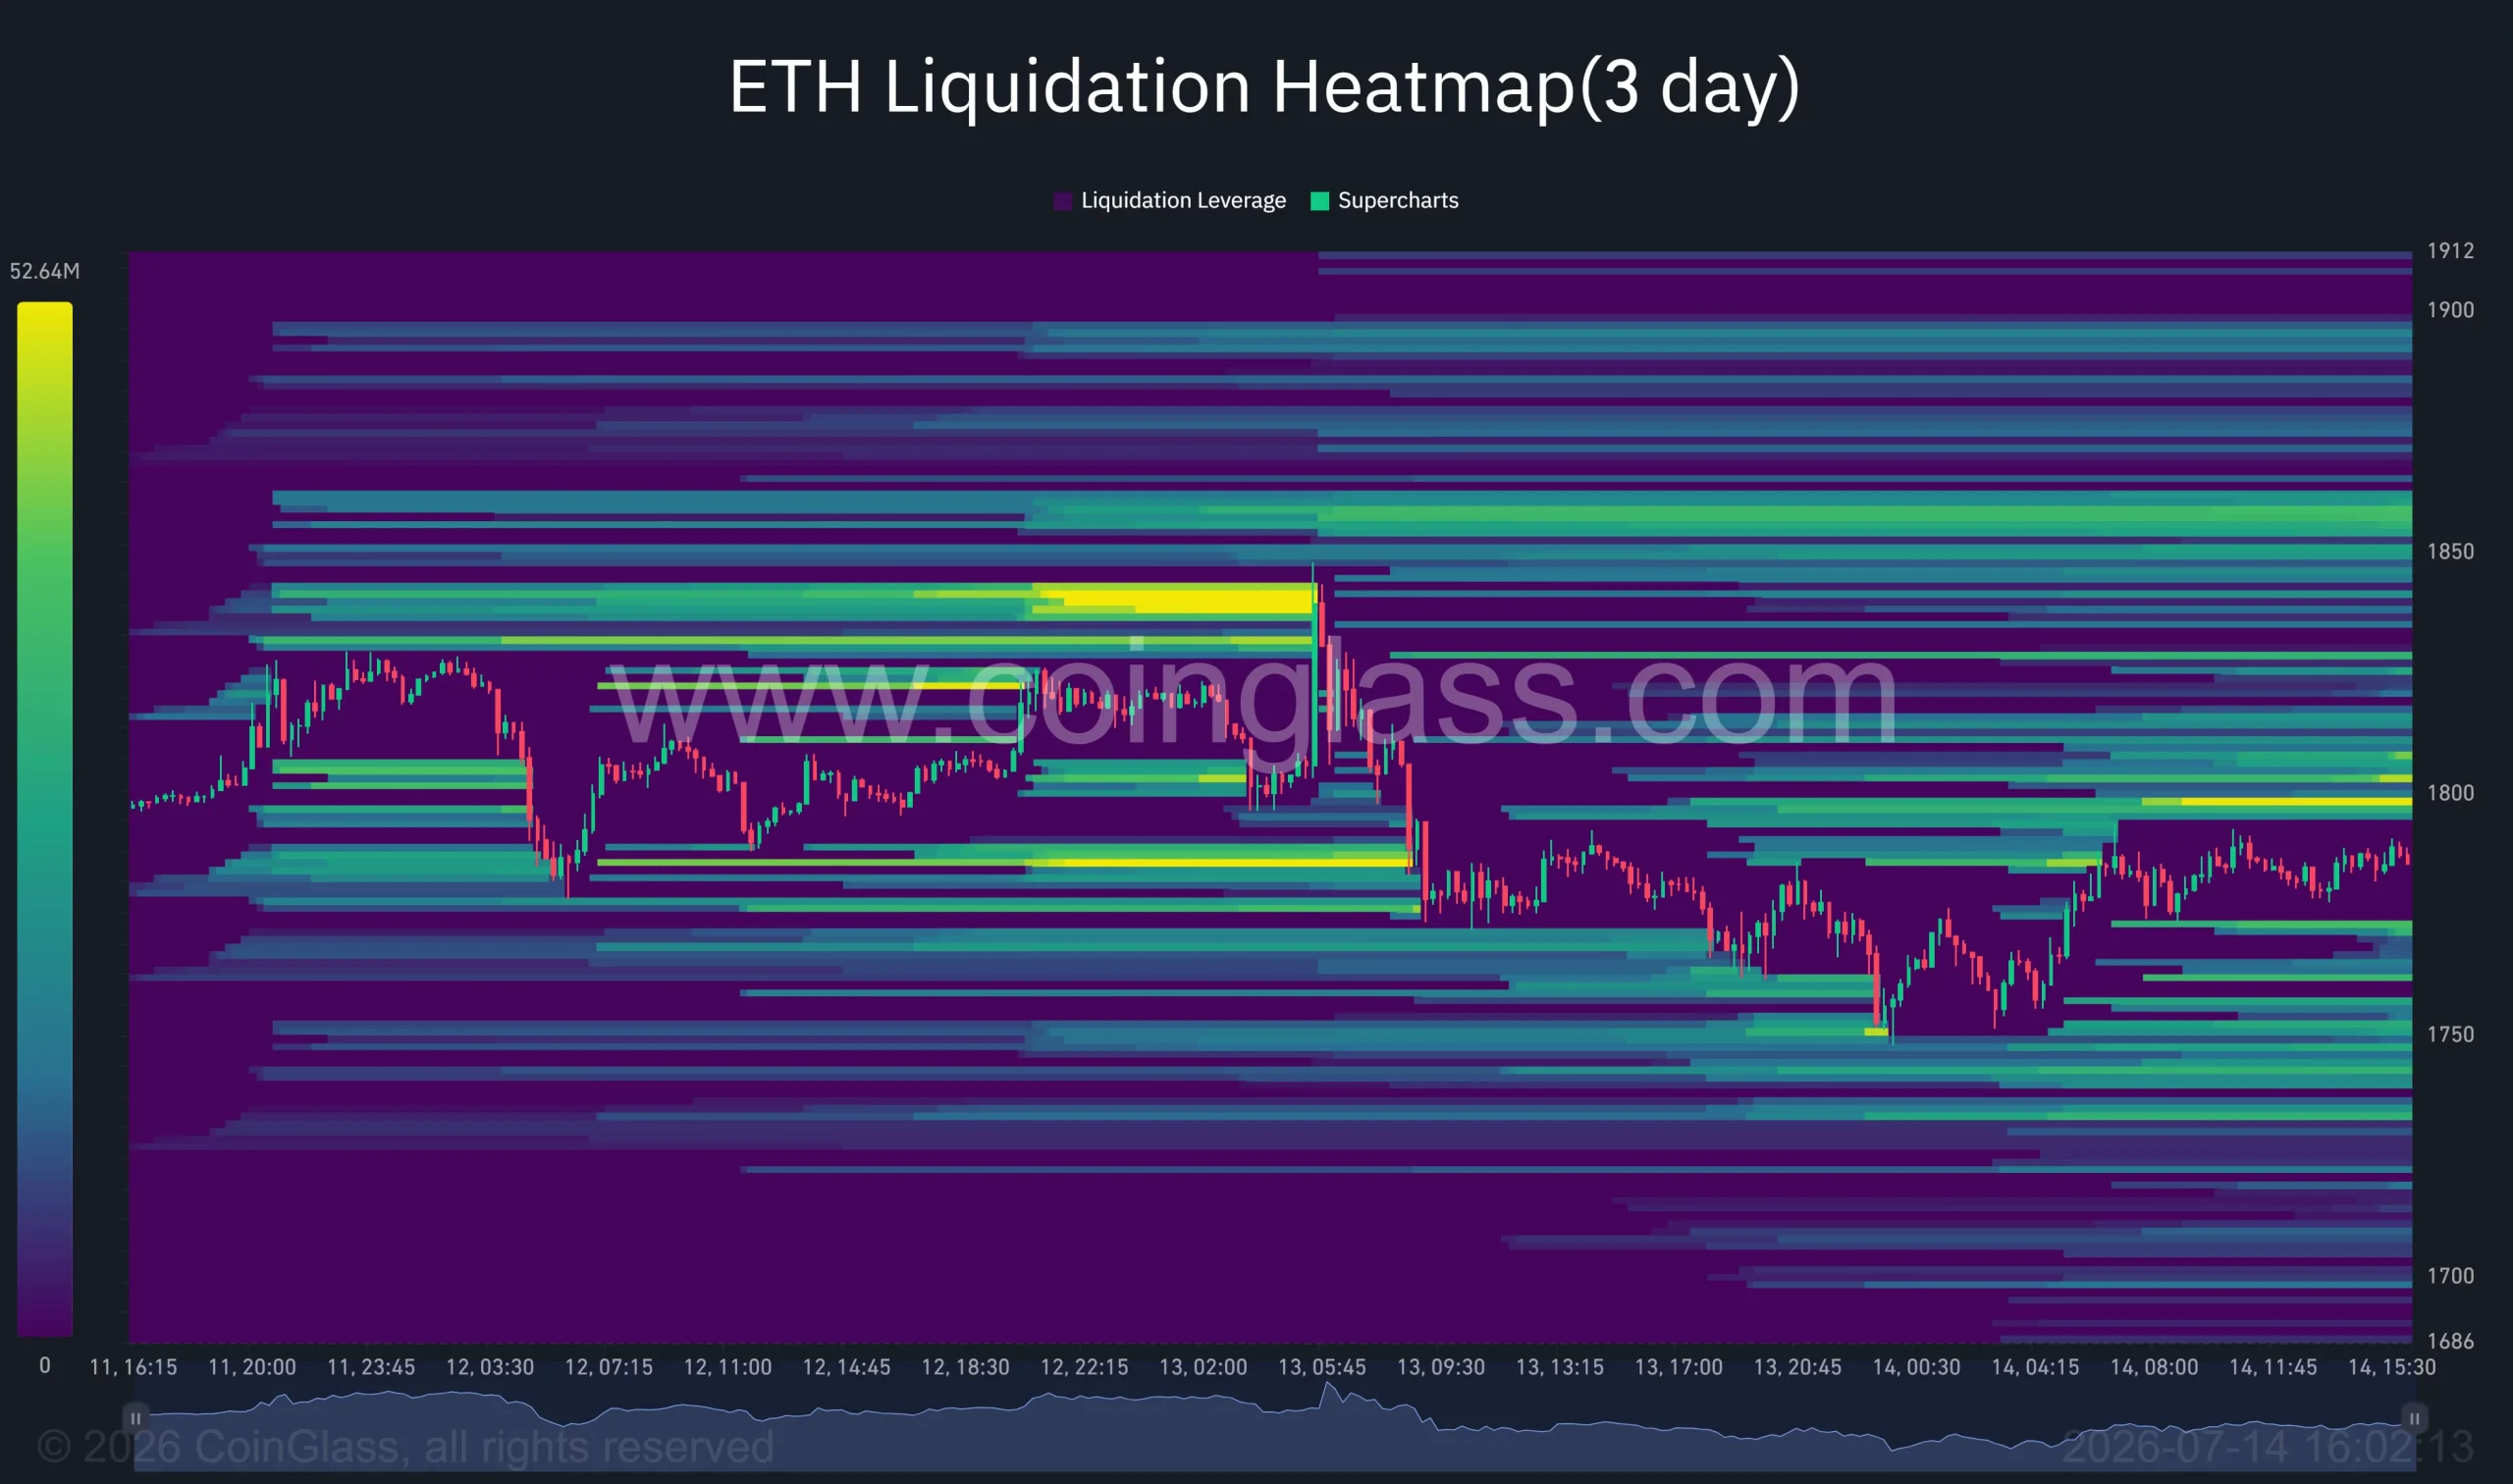
Derivatives positioning, however, presents a more balanced picture than price action alone. CoinGlass liquidation data shows one of the largest short liquidation clusters sitting between roughly $1,800 and $1,850, while additional liquidity rests closer to $1,900.
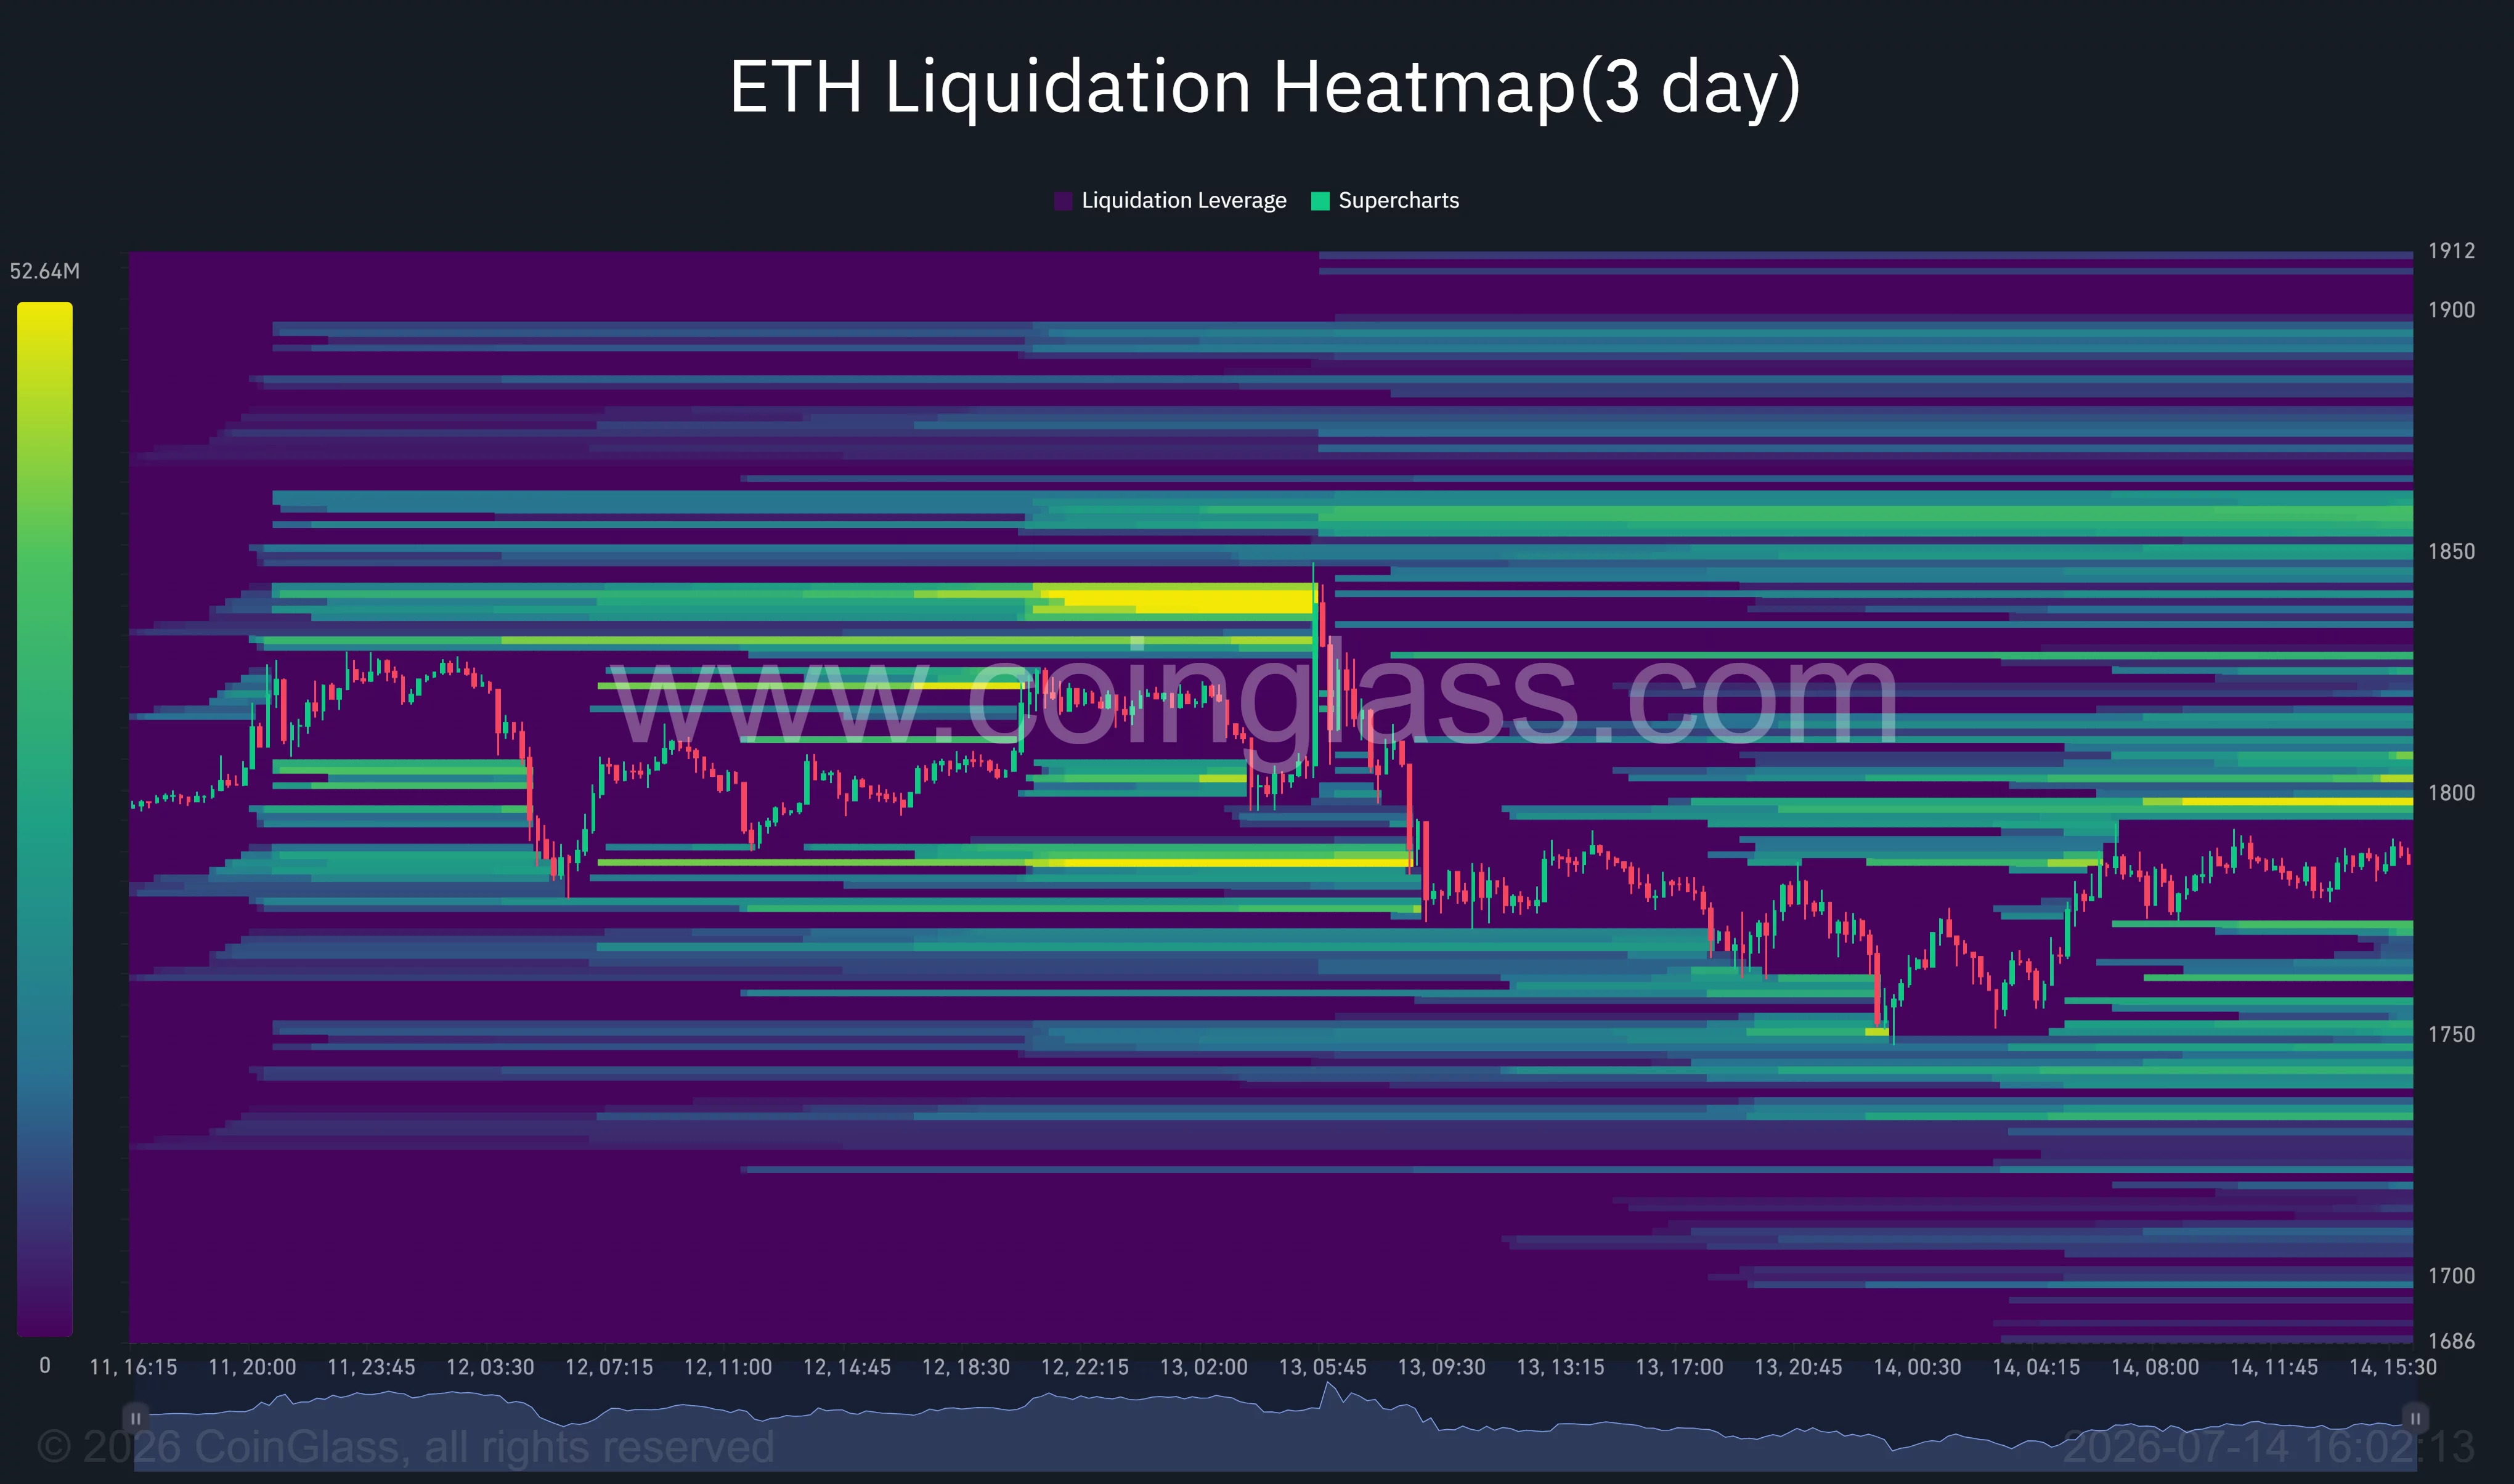
A decisive move through those levels could force short sellers to cover, accelerating momentum toward higher resistance. On the downside, liquidation pockets around $1,750 and below suggest sellers could regain control if support fails.
Ethereum needs a confirmed breakout above $1,850 to unlock higher targets
The daily chart shows Ethereum carving out what resembles a double-bottom formation after rebounding from June lows. Price now sits directly beneath horizontal resistance near $1,846, which coincides with the neckline of the pattern.
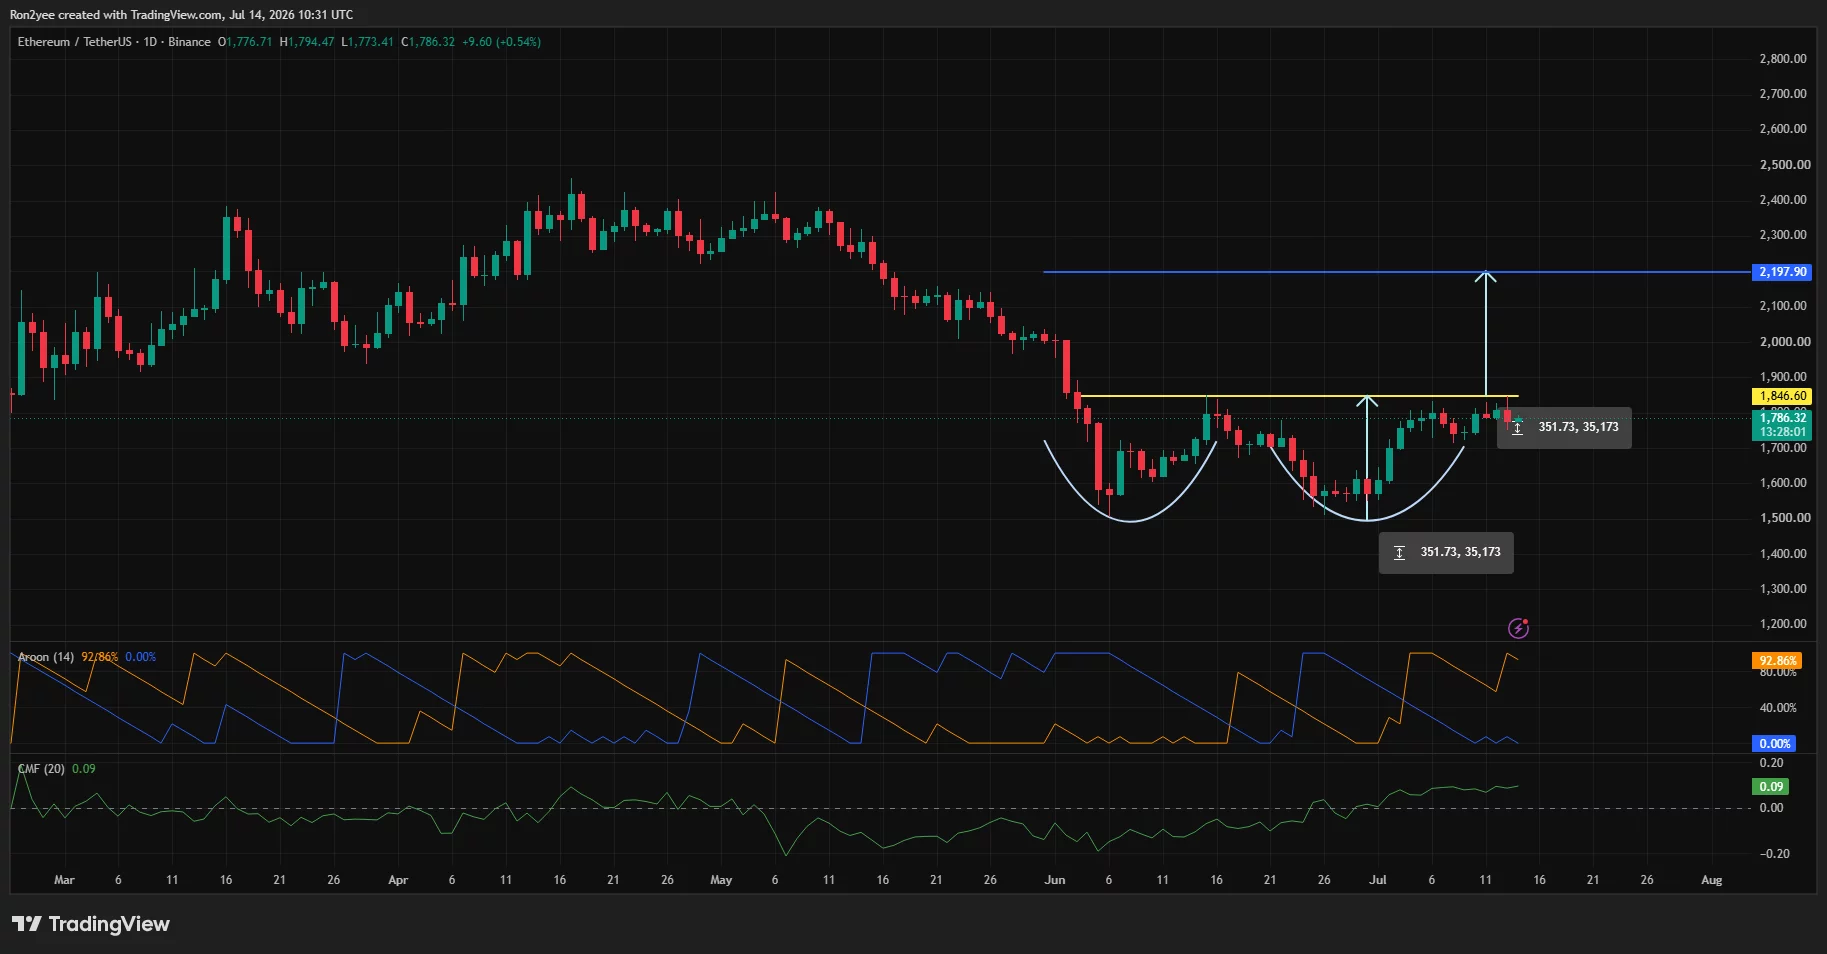
A successful breakout projects a measured move toward approximately $2,198, while the Aroon indicator favors buyers, with the bullish line holding above 90%. Chaikin Money Flow has also moved back into positive territory, suggesting capital has gradually returned after weeks of distribution.
Shorter-term momentum remains constructive but lacks confirmation. On the 4-hour chart, Ethereum continues to trade above the Supertrend support near $1,756, preserving the recent sequence of higher lows.
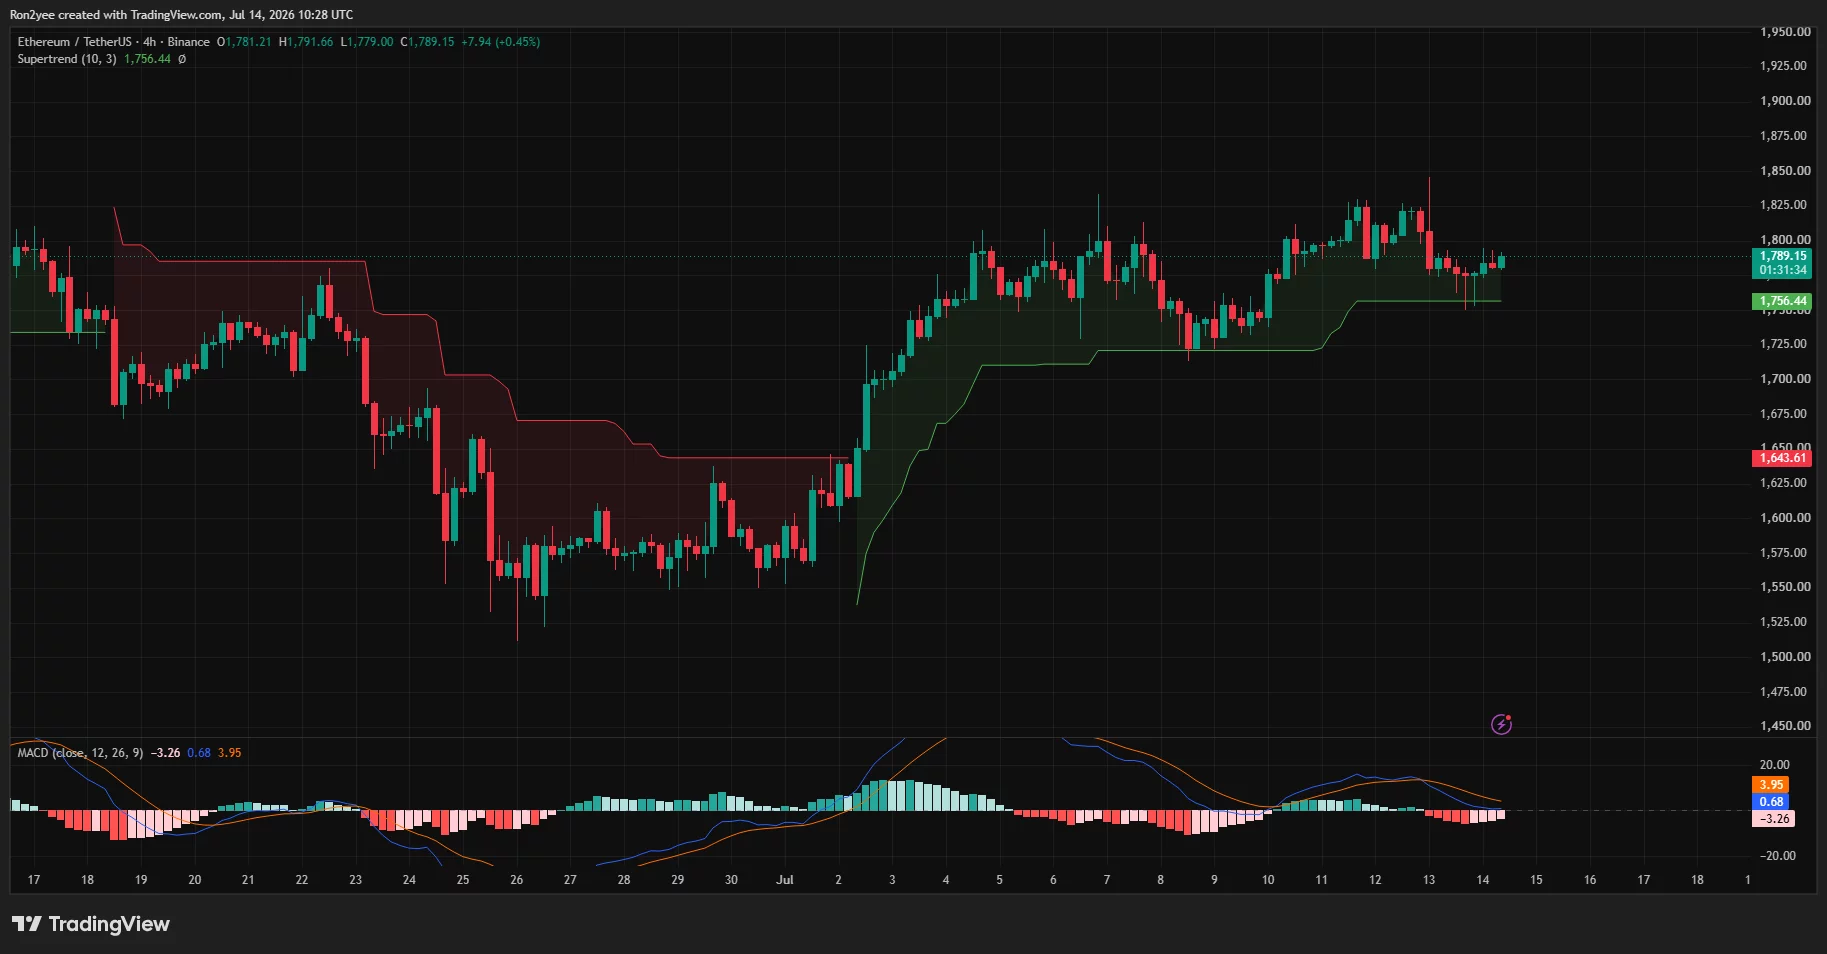
At the same time, the MACD histogram has weakened, and the MACD line has slipped beneath its signal line, showing that upside momentum has slowed as price approaches resistance rather than expanded into a fresh impulse.
Market participants are also watching the same technical level. According to analyst Ali Martinez, “I’m going LONG on Ethereum $ETH if it breaks $1,850.”
His view aligns with the neckline resistance visible on the daily chart, where a close above that level would invalidate the recent consolidation and expose the next objective near $2,200.
Another closely watched level sits slightly lower. Commenting on the latest structure, crypto analyst Ted Pillows argued that “$ETH held above its $1,750 support zone.” He added that buyers have defended the level and believes the next major move could develop to the upside as long as that floor remains intact.
Macro risks could quickly reverse Ethereum’s recovery
Even with the improving chart structure, macro conditions continue to dictate short-term direction. Ethereum has struggled to sustain rallies throughout 2026 as persistent spot ETF outflows, weaker network fee revenue following the Dencun upgrade, and competition from faster Layer-1 networks have weighed on investor demand.
Ethereum’s annual issuance has also returned to positive territory after reduced fee burns weakened the network’s deflationary narrative.
Failure to reclaim $1,800 before the CPI release would leave traders exposed to another round of volatility. A stronger-than-expected inflation print or renewed escalation in the Middle East could strengthen the U.S. dollar and Treasury yields, reducing appetite for crypto assets.
From a technical perspective, losing the $1,750-$1,756 support region would invalidate the current bullish setup and increase the probability of a retreat toward $1,680, with deeper demand waiting near the psychologically important $1,500 level.
Conversely, a confirmed break above $1,850 could trigger liquidations across leveraged short positions and shift attention toward the $1,900 area before the projected move toward $2,198 comes into focus.
Disclosure: This article does not represent investment advice. The content and materials featured on this page are for educational purposes only.
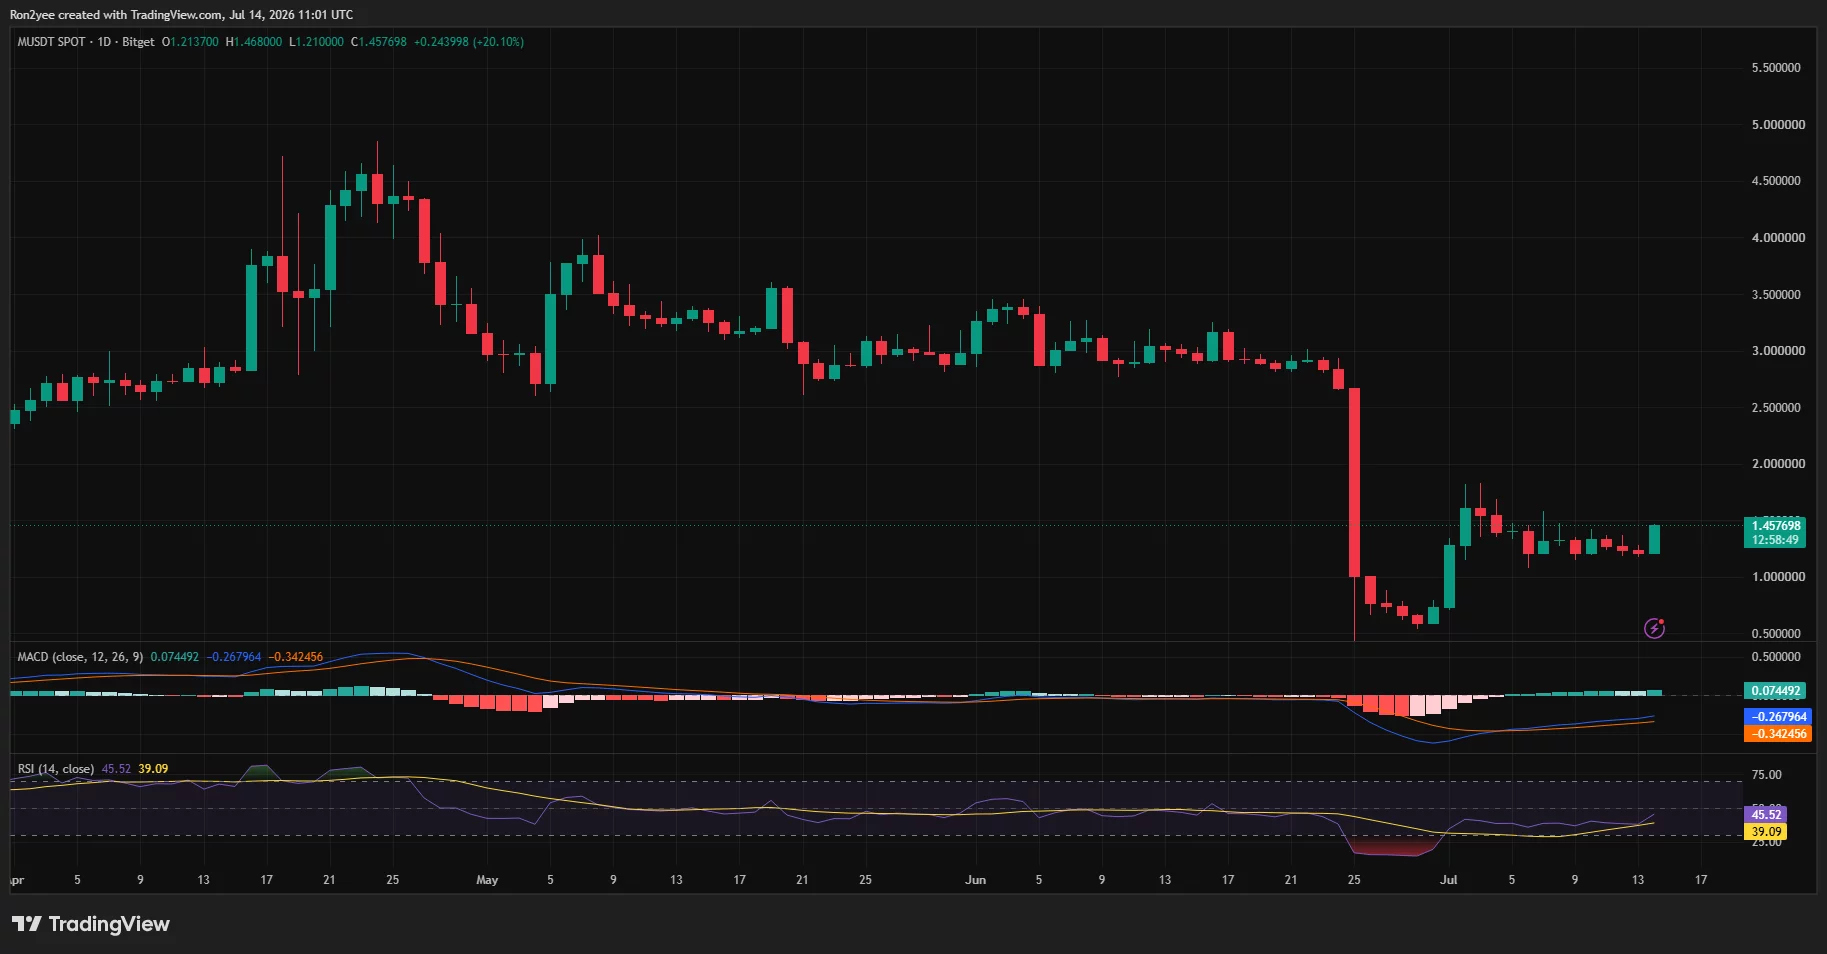
MemeCore price has surged more than 20% to an intraday high of $1.46 on July 14, breaking out of a two-week consolidation range after buyers defended support near $1.20.
Summary
- MemeCore surged over 20% to $1.46 after breaking above a two-week consolidation range.
- Bullish MACD momentum and a recovering RSI supported the move, though resistance remains near $1.50.
- Thin liquidity and concentrated token ownership could amplify both further gains and renewed selling.
As per data from crypto.news, MemeCore (M) opened near $1.21 before climbing to $1.468, placing it among the day’s strongest-performing large-cap crypto assets. The move has occurred despite weakness across Bitcoin and Ethereum, indicating that token-specific trading flows, rather than a market-wide rally, are driving the advance.
Buyers appear to have entered after MemeCore spent much of July trading between approximately $1.15 and $1.45. Repeated failures to push the token below the lower end of that range reduced immediate selling pressure, while the latest move through its recent highs likely triggered momentum orders and forced some bearish traders to reduce their exposure.
Alongside the technical breakout, traders have continued to monitor MemeCore’s ecosystem developments, including its Layer-1 blockchain, MemeX launchpad and planned on-chain project releases. Although no specific catalyst has been identified for Tuesday’s rally, continued attention on the project’s roadmap may have supported sentiment
The timing may have renewed attention around M one day before its breakout, although the update did not identify a specific announcement responsible for the rally.
Technical momentum has improved
On the daily chart, MemeCore’s moving average convergence divergence indicator has produced a bullish crossover, while its histogram has moved into positive territory. The pattern indicates that downside momentum from June’s collapse is fading, even though both MACD lines remain below zero and have not confirmed a complete trend reversal.
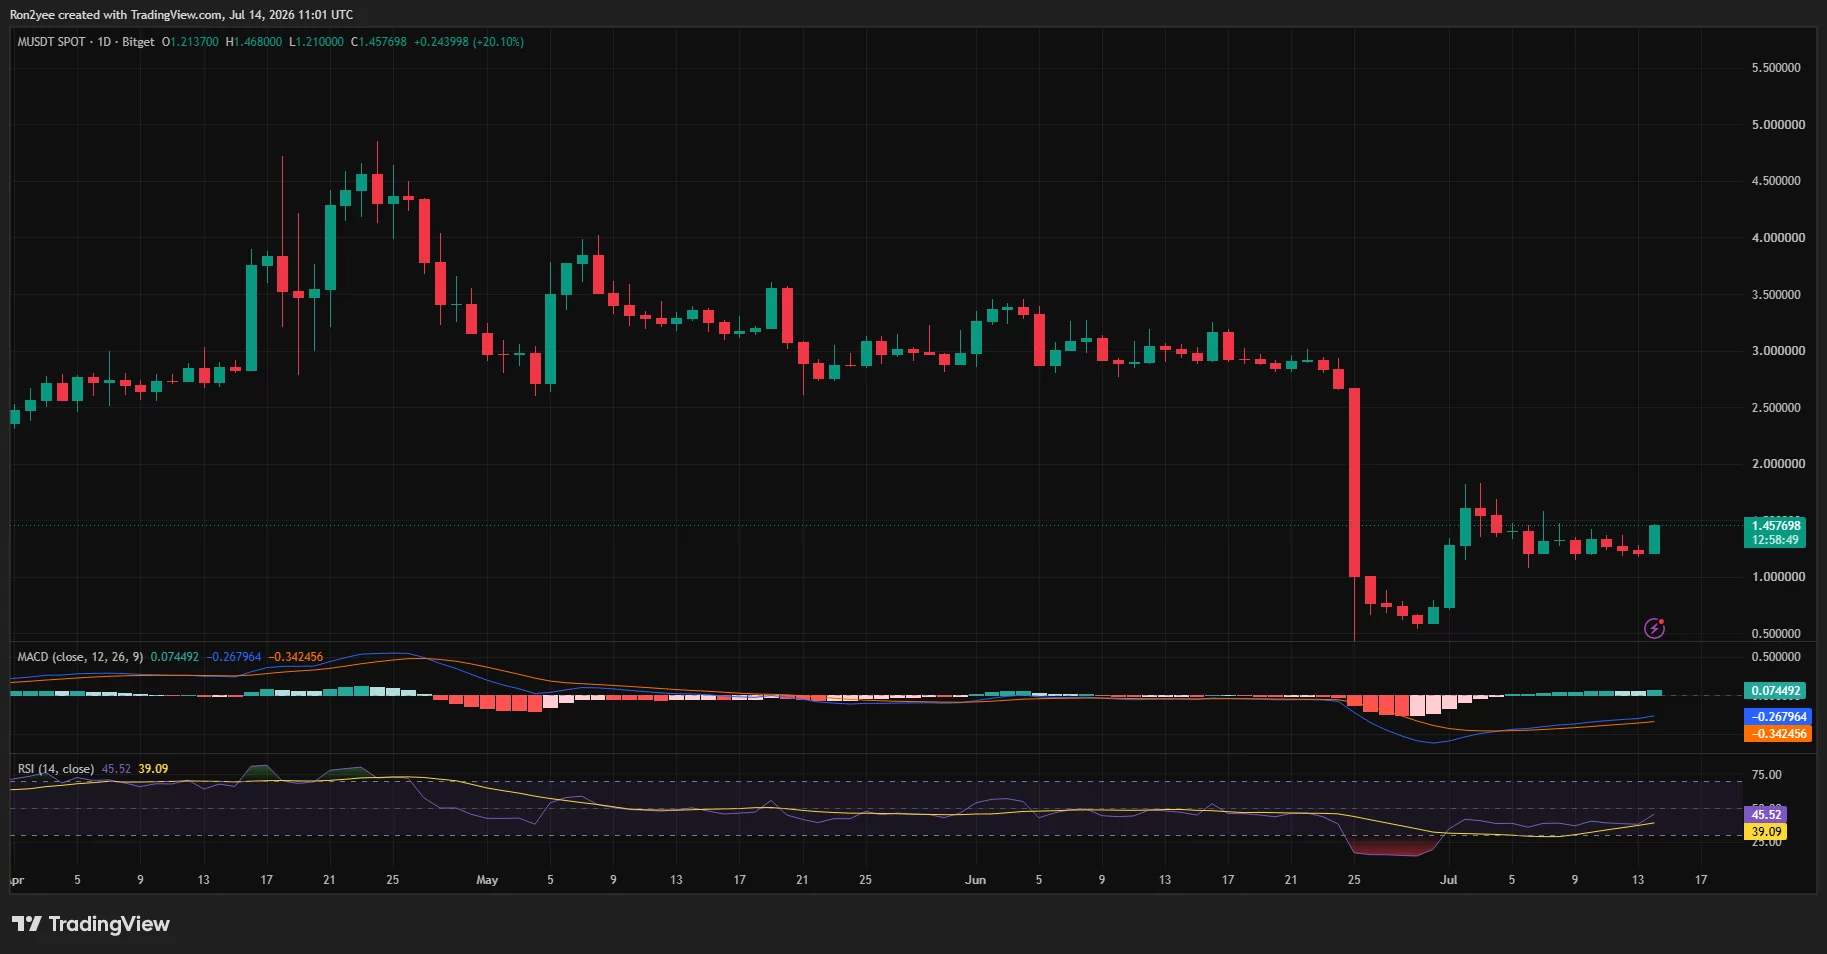
MemeCore’s relative strength index has risen to approximately 45.5 from deeply oversold levels recorded after the June crash. Because the RSI remains below the neutral reading of 50, the chart points to recovering demand rather than an established bullish trend.
Price structure offers a similar signal. M rebounded from a late-June low near $0.50 and reached approximately $1.80 before pulling back. It then formed a base above $1.10, and the July 14 candle has pushed it back toward the upper edge of that structure.
A daily close above $1.45-$1.50 would strengthen the breakout and leave the $1.70-$1.80 region as the next visible resistance zone on the supplied chart. Failure to hold above $1.45, however, could show that the move was another brief liquidity-driven spike, with support remaining around $1.20 and $1.10.
June’s collapse still clouds the recovery
The rally follows an unusually violent correction that erased more than 70% of MemeCore’s value within hours on June 25. MarketWatch reported that M fell from roughly $2.62 to $0.82, cutting its market capitalization below $1 billion and reducing its fully diluted valuation from about $14 billion to $3.8 billion.
During the sell-off, on-chain investigator ZachXBT renewed allegations that MemeCore’s supply was heavily concentrated among insiders and questioned how the token had passed listing reviews at several major exchanges.
In an earlier post, he had challenged the project to explain its multibillion-dollar valuation and his claim that insiders controlled more than 90% of the supply. MemeCore had not publicly answered requests for comment cited by MarketWatch at the time.
Such concentration concerns help explain both sides of M’s price action. Limited freely traded supply can deepen losses when large holders sell, but shallow order books can also magnify rebounds when demand suddenly increases. Research into meme-token markets has similarly found that concentrated ownership and thin liquidity can make prices unusually sensitive to sentiment and relatively small trading flows.
MemeCore’s breakout therefore signals a meaningful improvement in short-term momentum, but confirmation depends on whether buyers can sustain trading above $1.45 and eventually reclaim $1.80. Until then, the rebound remains exposed to the same liquidity, ownership and transparency risks that intensified June’s crash.
Disclosure: This article does not represent investment advice. The content and materials featured on this page are for educational purposes only.


Every few weeks, a token that has done nothing wrong falls ten percent in a day, and the explanation turns out to have been sitting in public view for years. A tranche of supply, promised to early investors back when the project raised money, hit its scheduled release date.
Insiders who bought at a fraction of the market price suddenly held tokens they could sell, and enough of them did. Traders call these events unlocks, and they are among the most predictable forces in crypto markets, which makes it strange how many investors get blindsided by them.
A token unlock is the moment previously locked supply becomes transferable and enters circulation under rules the project set in advance. The rules themselves are called a vesting schedule, and together they answer a question every serious investor should ask before buying any token: who is going to be allowed to sell, how much, and when. This guide explains what unlocks and vesting are, why projects lock tokens in the first place, the difference between cliffs and linear releases, who actually receives unlocked supply and how differently each group behaves, how unlocks move prices, the low float trap that defined the current market cycle, how to read an unlock calendar like a professional, and the honest limits of unlock analysis.
What a token unlock actually is
When a crypto project creates its token, it almost never releases the full supply into the market on day one. Instead, the total supply is divided into allocations: a slice for the founding team, a slice for the venture investors who funded development, a slice for advisors, a slice for the community, a slice for an ecosystem fund or treasury. Most of these allocations start locked, meaning the tokens exist on paper, and often on chain, but cannot be transferred or sold.
An unlock is the scheduled event that releases some of that locked supply. On the appointed date, or continuously according to a formula, tokens move from the locked state to the liquid state, and their owners can finally do what owners do: hold, stake, or sell. Nothing about an unlock is secret. The schedule is typically published in the project’s tokenomics documentation before the token ever trades, and modern vesting is usually enforced by smart contracts that release tokens automatically, with the whole timetable verifiable on chain.
The distinction between vesting and unlocking trips up newcomers. Vesting is the rulebook, the full timetable governing how allocations are earned and released over months or years. An unlock is a single event within that timetable, the moment a specific batch becomes tradable. A project has one vesting schedule and many unlocks. When traders say a token has an unlock next week, they mean one identifiable batch is crossing from locked to liquid, and the size, recipient, and context of that batch are what analysis is about.
Why projects lock tokens at all
Locking is a credibility device. Imagine a project that raised money by selling thirty percent of its supply to venture funds at an early stage price, then listed the token publicly at twenty times that price. If the investors could sell immediately, the rational move would be to dump everything into the listing hype, crush the price, and move on. Everyone who bought at listing would be exit liquidity. Projects that allowed this quickly found that nobody wanted to buy their tokens at all.
Vesting schedules exist to make the promise of long term alignment enforceable. A team whose tokens unlock over four years has four years of reasons to keep building. An investor with a one year cliff cannot flip the token at listing no matter how tempting the price. The lock converts a verbal commitment into a mechanical one, and because the schedule is public, the market can price the commitment instead of guessing at it.
Locking finally serves a signaling function that has nothing to do with mechanics. When a team accepts a four year schedule and investors accept a one year cliff, they are publishing their own confidence interval. Short schedules whisper that insiders want optionality. Long schedules, especially ones the team imposed on itself beyond what any exchange required, tell the market that the people with the most information expect the token to be worth holding. Markets read these signals imperfectly, but they read them.
Locking also manages the physics of supply. A token’s price is set at the margin, by the balance of buying and selling in liquid markets. Releasing supply gradually gives demand time to grow into it. Releasing it all at once is a flood, and floods move prices the way floods move everything else. The entire discipline of tokenomics, the economic design of a token’s supply, distribution, and incentives, treats the release schedule as one of its central levers.
Cliffs, linear vesting, and the shapes of release
Vesting schedules come in a small number of recognizable shapes, and the shape matters as much as the size. A cliff is a period, commonly six to twelve months after the token generation event, during which nothing unlocks at all. When the cliff ends, a large batch releases at once. Cliffs concentrate sell pressure into a single known date, which is why cliff expiries are the unlock events traders circle on calendars.
Linear vesting releases tokens continuously or in small regular steps, daily, weekly, or monthly, over a defined period. The drip is gentler on price because no single day carries a large release, but it creates persistent background pressure, a steady trickle of new supply that demand must absorb month after month.
Most real schedules are hybrids: a cliff followed by linear release. A typical structure for team tokens might be a one year cliff, then monthly unlocks over the following two or three years. Investor allocations often vest faster than team allocations, and community or ecosystem allocations sometimes have no lock at all, or unlock based on milestones instead of dates. Some projects add non linear schedules, with releases that accelerate or step up at intervals, and a few tie unlocks to performance conditions such as product launches. The token generation event, usually shortened to TGE, marks day zero for most schedules, and many tokens release a small percentage at TGE so that a market can exist at all.
Reading a vesting chart is mostly about learning to see these shapes. A wall of supply at a single future date is a cliff. A smooth ramp is linear release. The steeper the ramp and the taller the walls, the more supply the market will be asked to digest, and the more the token’s future depends on demand showing up on schedule.
Who receives unlocked tokens, and why it matters
The same unlock size can produce completely different market outcomes depending on whose tokens are being released, because different holders face different incentives. Venture investors are the most reliable sellers. Funds have limited lifespans and partners to repay, and a position bought at an early stage price that now trades far higher represents a return that fund managers are professionally obligated to realize. When a large investor tranche unlocks, systematic selling is the base case, not the exception.
Team allocations behave less predictably. Founders and employees have reputational reasons to avoid visible dumping, and many hold for belief or for optics, but personal diversification is a powerful force, and team selling after long cliffs is common enough that markets price it in. Ecosystem and treasury unlocks are different again: those tokens usually flow to grants, market making, or incentives instead of directly to exchanges, though grant recipients frequently sell what they receive, so the pressure arrives second hand and on a lag. Advisors sit somewhere in between, small in size but often quick to exit. Community allocations, including airdrops, scatter supply across thousands of small holders whose behavior varies from instant selling to permanent holding.
Sophisticated unlock analysis therefore never stops at the headline number. The question is not how many tokens unlock, but how many unlock into hands that are likely to sell, at what cost basis, and into how much liquidity.
How unlocks actually move prices
The mechanical story is simple: unlocks increase liquid supply, and if demand does not rise to meet it, price falls. But the mechanism deserves one more sentence of precision. Price is set by transactions, not by existence, so an unlock only moves the market to the degree that unlocked tokens are sold or that traders act on the expectation of selling. Supply that unlocks into wallets and stays there changes the risk picture without changing the order book. The market story is more interesting, because unlocks are public information, and public information gets traded in advance.
Ahead of a large unlock, traders who expect selling pressure sell first, or open short positions in perpetual futures to profit from the anticipated decline. This front running spreads the price impact across the weeks before the event, and it occasionally produces the counterintuitive pattern traders call sell the rumor, buy the news, where a token falls into an unlock and bounces after it, because the sellers finished selling early. Empirically, the price damage from major unlocks tends to arrive before and during the event, with the days after determined by how much of the released supply actually hits exchanges.
Context decides magnitude. The ratio of the unlock to average daily trading volume matters more than the ratio to market capitalization, because volume measures the market’s absorption capacity. An unlock worth three days of trading volume is a problem; an unlock worth an hour of volume is noise. Market regime matters just as much. Bull markets swallow unlocks that would crater the same token in a bear market, because absorption is a function of demand, and demand is cyclical. And holder cost basis sets the temptation: supply unlocking at a hundred times its purchase price wants to sell far more than supply unlocking underwater.
The clearest evidence that unlocks bind projects came during the 2024 and 2025 cycle, when several teams paused or restructured their own vesting schedules mid stream after watching unlock pressure grind their tokens down. A project that has to renegotiate its own tokenomics to defend its price is admitting that the original schedule asked the market to absorb more than it could.
From ICO free for all to institutional vesting
Vesting was not always standard. During the initial coin offering boom of 2017 and 2018, projects routinely sold tokens with no lockups at all: a whitepaper, a wallet address, and a promise. Teams and early buyers could sell the moment tokens listed, and many did, with predictable results. The wreckage of that era, thousands of tokens that listed, dumped, and died, is the reason vesting became a market requirement instead of a courtesy. Exchanges began expecting lockup disclosures before listing. Venture funds began accepting, and then demanding, multi year schedules as evidence of seriousness. By the early 2020s a token launching without published vesting for insiders read as a warning label.
The professionalization cut both ways. Structured vesting made token launches more credible, but it also standardized the low float playbook, in which a polished schedule defers the supply problem instead of solving it. A four year lockup does not remove twenty five times the float from the future; it just puts the future on a calendar. The modern unlock calendar industry, with dashboards, alerts, and analytics products tracking every scheduled release across the market, exists precisely because vesting became universal. What was once a question of whether insiders were locked at all became a question of exactly when the locks expire, and an entire analytical discipline grew in the gap.
The next stage of that evolution is already visible: on chain vesting contracts that anyone can audit, third party verification services, and standardized disclosure formats. The direction of travel is toward supply schedules as verifiable public infrastructure, which raises the analytical bar. When everyone can see the calendar, seeing it is no longer an edge. Interpreting it is.
The low float, high FDV trap
The defining supply structure of the recent cycle was the low float, high FDV launch. A project lists with a small fraction of total supply circulating, sometimes under ten percent, while the fully diluted valuation, the price of all tokens that will ever exist, implies a number many multiples higher. The small float makes the price easy to support at listing. The enormous locked overhang means years of scheduled unlocks stand between the listing price and the day the token’s market cap honestly reflects its supply.
The arithmetic is unforgiving. If a token trades at a two billion dollar fully diluted valuation with eight percent circulating, then over the coming years roughly twenty five times the current float will be released. For the price simply to stay flat, new demand must absorb all of it. Buyers of such tokens are, whether they realize it or not, betting that demand will grow faster than a supply schedule designed years earlier by people who bought at a fraction of the current price. The bet occasionally pays. The base rate does not favor it.
Markets learned this lesson expensively. Token after token from the low float era spent months in structural decline as unlocks arrived on schedule and demand did not, and by the middle of the cycle, unlock calendars had become one of the most watched datasets in DeFi and beyond. Aggregate unlock volume across the market now runs into billions of dollars in heavy months, and traders treat clusters of large unlocks as a marketwide supply headwind, particularly for assets far down the liquidity curve.
What big unlocks look like in practice
A few well known episodes show the full range of outcomes. Arbitrum’s ARB, one of the largest airdropped tokens of its generation, spent much of its first two years grinding lower as investor and team tranches unlocked month after month into demand that never matched the schedule, becoming the reference example of structural unlock pressure on a fundamentally serious project. The token’s technology kept shipping; the supply kept arriving; the price reflected the arithmetic.
AltLayer provided the reference example of a project blinking. After its first major unlock in mid 2024 hit the price hard, the team announced a six month vesting pause covering investors, team, advisors, and treasury. The pause relieved the calendar but not the market, and the token’s struggles afterward became a case study in why rescheduling supply does not manufacture demand.
Pump.fun’s PUMP token compressed the entire lifecycle into months. The July 2025 sale raised over a billion dollars at a valuation the open market immediately began stress testing, and every subsequent tranche movement from team and treasury wallets was tracked by thousands of traders in real time, a reminder that for high profile tokens, unlock analysis now happens wallet by wallet, not just date by date.
And Pi Network became the retail era’s unlock story: roughly 1.21 billion tokens scheduled to release across 2026 against thin exchange liquidity, an overhang so large relative to volume that the unlock calendar itself became the primary narrative around the asset. Whatever one thinks of the project, the episode taught millions of retail holders the vocabulary of cliffs, floats, and absorption for the first time.
The pattern across all four is consistent. Unlocks did not decide whether these projects mattered. They decided when the market was forced to render a verdict on how much demand actually existed at the prevailing price.
Reading an unlock calendar like a professional
Several platforms track unlock schedules across the market, including Tokenomist, CryptoRank, DropsTab, and CoinGecko, and they present broadly the same data: upcoming unlock dates, sizes in tokens and dollars, percentages of circulating supply, and the allocation buckets involved. The skill is in the interpretation, and it reduces to five questions.
First, how large is the unlock relative to circulating supply? Below one percent is usually noise; above five percent deserves attention. Second, how large is it relative to daily trading volume? This is the absorption test, and it is the single most predictive ratio. A useful rule of thumb: if the unlocked value exceeds three to five days of average volume, absorption will be slow and the price will likely do the absorbing. Third, who receives the tokens? Investor and team tranches carry the highest sell risk; ecosystem and treasury tranches are slower burning. Fourth, what is the recipients’ cost basis? Deeply profitable supply sells harder. Fifth, what happened at this token’s previous unlocks? Past behavior around identical events is the closest thing unlock analysis has to a controlled experiment.
Two practical refinements separate careful traders from calendar tourists. Cliff events deserve more respect than equivalent linear amounts, because concentration in time is what overwhelms order books. And exchange flow data, where available, tells you whether unlocked tokens are actually moving toward venues where they can be sold, or sitting in the same wallets that received them. Tokens that unlock and do not move are potential supply; tokens that unlock and flow to exchanges are incoming supply. On chain analytics platforms make this distinction observable in near real time, and the gap between the two is often where the actual trade lives.
What unlock analysis cannot tell you
Unlock data describes supply mechanics, and supply is only half of any price. A token with a brutal unlock schedule and explosive demand growth can rise through every release date, which is exactly what the strongest projects of every cycle have done. A token with a clean, fully vested supply and no demand will still go to zero, just without a schedule announcing it. Unlocks set the height of the wall; they say nothing about whether the buyers on the other side can climb it.
The data also cannot capture private arrangements. Locked tokens are routinely hedged through over the counter deals and derivatives, meaning the economic selling may have happened long before the unlock date, with the on chain release a mere formality. Conversely, some unlocked supply is contractually committed to market makers or custody and cannot hit the market as fast as the calendar implies. On chain vesting contracts have also occasionally diverged from published schedules, in both directions, which is why serious analysts verify the contract instead of trusting the documentation.
Treat unlocks the way professionals treat them: as one high quality, freely available input among several. In a market where edges are scarce and expensive, a public calendar of exactly when supply arrives, from Solana majors to the long tail of meme coins, is a gift. It is not a trading system. It is a schedule of when the questions get asked; demand still writes the answers.
Frequently asked questions
What is a token unlock in crypto?
A token unlock is a scheduled event in which previously locked tokens become transferable and enter circulating supply. Unlocks follow a vesting schedule the project defined in advance, and they typically release tokens to teams, early investors, advisors, or ecosystem funds.
What is the difference between vesting and unlocking?
Vesting is the overall timetable that governs how locked allocations are released over time. An unlock is a single event within that timetable. A project has one vesting schedule but many individual unlock events.
What is a cliff in a vesting schedule?
A cliff is an initial period, often six to twelve months, during which no tokens from an allocation are released. When the cliff ends, a large batch unlocks at once, which concentrates potential sell pressure into a single date.
Are token unlocks always bearish?
No. Unlocks add supply, but the price outcome depends on demand, on how much of the released supply actually gets sold, and on how much was priced in beforehand. Some tokens fall into an unlock and recover afterward once the anticipated selling clears.
How do I check when a token unlocks?
Unlock schedules appear in project tokenomics documentation and on tracking platforms such as Tokenomist, CryptoRank, DropsTab, and CoinGecko. These tools show upcoming dates, sizes, percentages of supply, and which allocation groups receive the tokens.
What is a low float, high FDV token?
It is a token that lists with a small share of total supply circulating while its fully diluted valuation implies a much larger market value. The structure supports the listing price but leaves years of scheduled unlocks that future demand must absorb.
Why do venture capital unlocks cause more selling?
Venture funds have finite lifespans and obligations to return capital to their partners, and their tokens were typically bought at prices far below market. Realizing those gains when tokens unlock is standard practice, so investor tranches carry the highest sell risk.
Can a project change its vesting schedule?
Sometimes, if governance or the token contract allows it. Several projects have paused or extended vesting to relieve price pressure. Any change should be publicly disclosed, and unexplained deviations between the published schedule and on chain behavior are a warning sign.
This article is for educational purposes only and does not constitute financial or investment advice. Vesting structures and unlock data vary by project and change over time. Details are accurate as of July 14, 2026.

XRP price risks $1 breakdown as Binance selling pressure persists

Man City legend’s comments on Youri Tielemans are what Manchester United needed to hear

OpenAI’s first hardware device will be a HomePod


-

 Fashion6 days ago
Loro Piana Fall 2026 Enters Houston’s Art Scene
-

 Fashion4 days ago
Weekend Open Thread: Nutriplenish Leave-In Conditioner
-
 Sports5 days ago
2026 Genesis Scottish Open Thursday TV coverage: Round 1
-

 Sports5 days ago
Super Eagles star Moses Simon opens up on Liverpool transfer regret
-

 Tech6 days ago
Character.AI enters the microdrama arena with its own productions, but there’s a twist
-
 News Videos8 hours ago
XRP BOMBSHELL… XRP OMBOARDED FOR TRANSACTIONS!!!
-
 Tech23 hours ago
Get Your ESP32 Sunny Side Up With This Solar Dev Board
-

 Tech7 hours ago
Dark Secrets Emerge When Jailbreaking LLMs
-

 News Videos6 days ago
Crypto Just Entered Its Most Important 6-Month Candle (Could Decide Everything!)
-
 Business7 days ago
ASX 200 Slides Over 0.6% as Rare Earths and Lithium Stocks Tumble Amid Global Semiconductor Sell-Off Today
-
 NewsBeat6 days ago
Major update after Huntingdon train attack as man enters plea
-

 News Videos2 days ago
how to make coin bank box with cardboard #scienceproject #money #diy #shorts
-

 Business7 days ago
SpaceX Shares Slide Nearly 6% Amid Post-IPO Volatility and Starship Test Focus
-

 Sports7 days ago
39-year-old Djokovic wins five-hour thriller to enter Wimbledon semis | Other Sports News
-

 Tech6 days ago
Level Infinite Launches Gangstar Mirage City in India with Pre-Registrations
-
 Tech1 day ago
Cloudflare Precursor Watches Your Mouse and Keyboard To Decide If You Are Human
-

 Tech6 days ago
Entra passkey enrollment vishing targets Microsoft 365 users
-
 Crypto World6 days ago
DeFi Dashboard Zapper to Shut Down After 7 Years
-

 Business7 days ago
Maase Inc Shares Jump 16% as Speculative China-Based AI Pivot Stock Extends Its Volatile 2026 Rally Today
-

 Sports7 days ago
Tough task staring Gilas in the eyes entering second round of Qualifiers
You must be logged in to post a comment Login