
Crypto World
Altcoin Markets Show Recurring 120-Day Downtrend Cycle as Base Formation Begins

TLDR:
- Altcoin markets have experienced two identical 120-day downtrends since January 2024 during peak optimism phases.
- Total3 market cap shows rally-distribution-bleed-reset pattern rather than continuous upward bull cycle movement.
- Price has returned to major support zone while RSI sits at depressed levels after months of declining momentum.
- Historical pattern suggests capitulation windows occur when 120-day cycles repeat within same market structure.
Altcoin markets have consistently followed a 120-day downtrend pattern over the past two years, according to recent market analysis.
The cycle appears during periods of peak optimism and extends into full four-month corrections. Traders holding positions in recent drawdowns may find relief in understanding this recurring timeframe. The pattern suggests markets move in predictable blocks rather than continuous upward momentum.
Recurring Downtrend Structure in Altcoin Markets
Total3 market capitalization data reveals a consistent rhythm since January 2024. Markets experience sharp rallies followed by extended distribution phases.
The first quarter of 2024 saw altcoins surge before entering a 120-day decline. During these periods, bounces get sold, and sentiment turns negative.
Later cycles showed identical behavior. A fourth-quarter rally materialized before another 120-day correction pushed into early 2026. The duration matched previous patterns almost exactly. This repetition indicates structure rather than random volatility.
Market observers from Our Crypto Talk noted how most participants only recognize the rally phases. Successful traders track the reset periods with equal attention.
The current environment sits within another reset zone. These blocks follow a sequence: rally, distribution, slow decline, reset, then another rally.
Understanding this rhythm changes how traders approach positioning. Markets don’t move in straight lines during bull cycles.
Instead, they advance through predictable consolidation periods. Recognition of these phases helps separate short-term noise from longer-term trend development.
Technical Setup Points to Potential Base Formation
Current price action has returned to a major support band that previously acted as a floor. The market has repeatedly reacted around this zone in past cycles.
This area represents significant accumulation levels from earlier timeframes. Price behavior near established support often signals exhaustion of selling pressure.
Momentum indicators show complementary signals. RSI has trended downward for months and now sits at depressed levels.
While no single indicator guarantees reversals, compressed momentum after timed downtrends typically precedes shifts. Selling pressure appears to be reaching exhaustion points.
The convergence of time-based cycles and technical levels creates noteworthy conditions. When 120-day downtrends appear twice within the same cycle, they often mark capitulation windows.
Weak positions exit while value-focused buyers begin accumulating. This phase doesn’t guarantee immediate upside but shifts probability distributions.
Market structure suggests a transition from random downside to base building. Bitcoin’s stability could catalyze altcoin bid activity in coming weeks.
The panic phase appears complete based on historical cycle comparison. Patience becomes valuable during these periods as markets digest previous excesses and establish foundations for subsequent moves.


The US dollar has been firm, but the drivers behind the move may be more complex than they first appear.
While geopolitical tension and shifts in risk sentiment play a role, current price behaviour seems increasingly influenced by inflation expectations and yields. As oil prices move higher, markets reassess the outlook for inflation and interest rates, which continues to support the dollar.
This video explores the underlying macro dynamics and why the current environment may be more conditional than it seems.
Watch it now and stay updated with FXOpen.
💬 Don’t forget to like, comment, and subscribe for more professional market insights every week.
This article represents the opinion of the Companies operating under the FXOpen brand only. It is not to be construed as an offer, solicitation, or recommendation with respect to products and services provided by the Companies operating under the FXOpen brand, nor is it to be considered financial advice.


Social media platform X is preparing a new security measure aimed at shutting down a widespread form of crypto phishing that leverages hijacked accounts to promote scam tokens.
The company will soon auto-lock any account that mentions cryptocurrency for the first time in its history, according to the company’s Head of Product Nikita Bier. Users will need to go through additional verification before being allowed to post again.
Bier said the feature targets the core incentive behind these attacks. “This should kill 99% of the incentive,” he wrote, referring to the current wave of phishing that tricks users into giving up their credentials, then uses their accounts to push crypto scams.
The change was unveiled in response to a detailed firsthand account from an X user who lost control of their account after falling for a phishing email disguised as a copyright violation notice.
The attacker, the user said, used a pixel-perfect fake login page to harvest two-factor codes, then locked the user out and began promoting fraudulent crypto projects from their account.
Crypto scams on X
These types of attacks have been extremely common on X, an inheritance from before it was acquired by Elon Musk and was still called Twitter.
One of the most common tactics is the “double your money” scam, in which users are told to send cryptocurrency in exchange for a promise of more. Others push fake memecoins or fraudulent airdrops, often using hijacked accounts to lend credibility.
Impersonation is one of the most powerful tools. Spoofed accounts impersonating major personalities have repeatedly tricked followers into clicking malicious links that mimic legitimate crypto platforms.
Cryptocurrency transactions are irreversible, so once a user falls for such an attack, their funds are gone.
The most infamous example came in 2020, when hackers accessed Twitter’s internal systems and took control of major accounts, including those of Apple, Barack Obama, and Elon Musk.
They used those accounts to promote a fake bitcoin giveaway, netting over $100,000 before the posts were removed. That breach, carried out through social engineering against Twitter employees, resulted in the hacker receiving a 5-year sentence.
X has made several attempts to bolster security. These have included bot purges, API restrictions, and behavioral detection. The latest move to auto-lock accounts that post about crypto for the first time builds on those efforts, aiming to cut off the tactic at its root: by making hijacked accounts useless for scams.
Bier also called out Google for failing to stop phishing emails at the email level, pointing the finger at the tech giant’s share of the responsibility for failing to protect its users from phishing attacks.
Wallet in Telegram launched native perpetual futures trading on April 2, 2026, powered exclusively by Lighter, bringing leveraged access to 50+ markets inside the chat app.
The feature went live without requiring users to download any external app or connect a third-party wallet, with positions opening directly inside Telegram.
Perpetual Volumes Set the Stage
The timing of the integration follows a period of sharp growth in on-chain derivatives. Perpetual trading volumes surged over 300% in 2025, with monthly activity consistently exceeding $1 trillion.
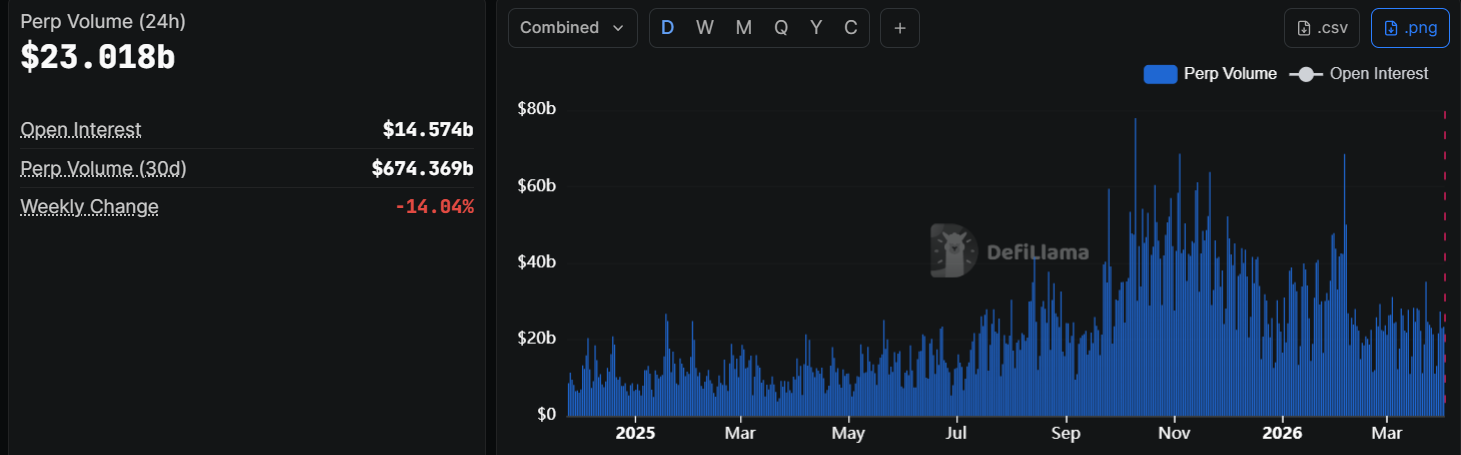
Lighter (LIT) processed $65.47 billion in volume in March 2026, ranking fourth among perpetual decentralized exchanges (DEXs) by monthly volume.
The platform runs on a custom zero-knowledge (ZK) rollup on Ethereum, where every order match and liquidation is verifiably proven on-chain.
Lighter’s 24-hour trading volume reached $2.08 billion on the day of the announcement, with open interest sitting at $663 million, per CoinGecko data.
What the Integration Offers
Users accessing the new Perpetuals tab inside Wallet in Telegram can trade over 50 markets spanning crypto, metals, stocks, and oil. Leverage goes up to 50x, and positions can be opened from as little as $1.
Wallet in Telegram confirmed the launch via its official X (Twitter) account, stating the feature allows users to go long or short in seconds.
Lighter confirmed the partnership was open to outside builders as well.
“…the Partner Attribution program is open to anyone ready to build,” they wrote.
The Partner Attribution program now lets any developer integrate Lighter’s perpetuals and spot infrastructure into their own apps, with credit flowing back to the referring builder.
No further details on revenue-sharing terms were disclosed at launch.
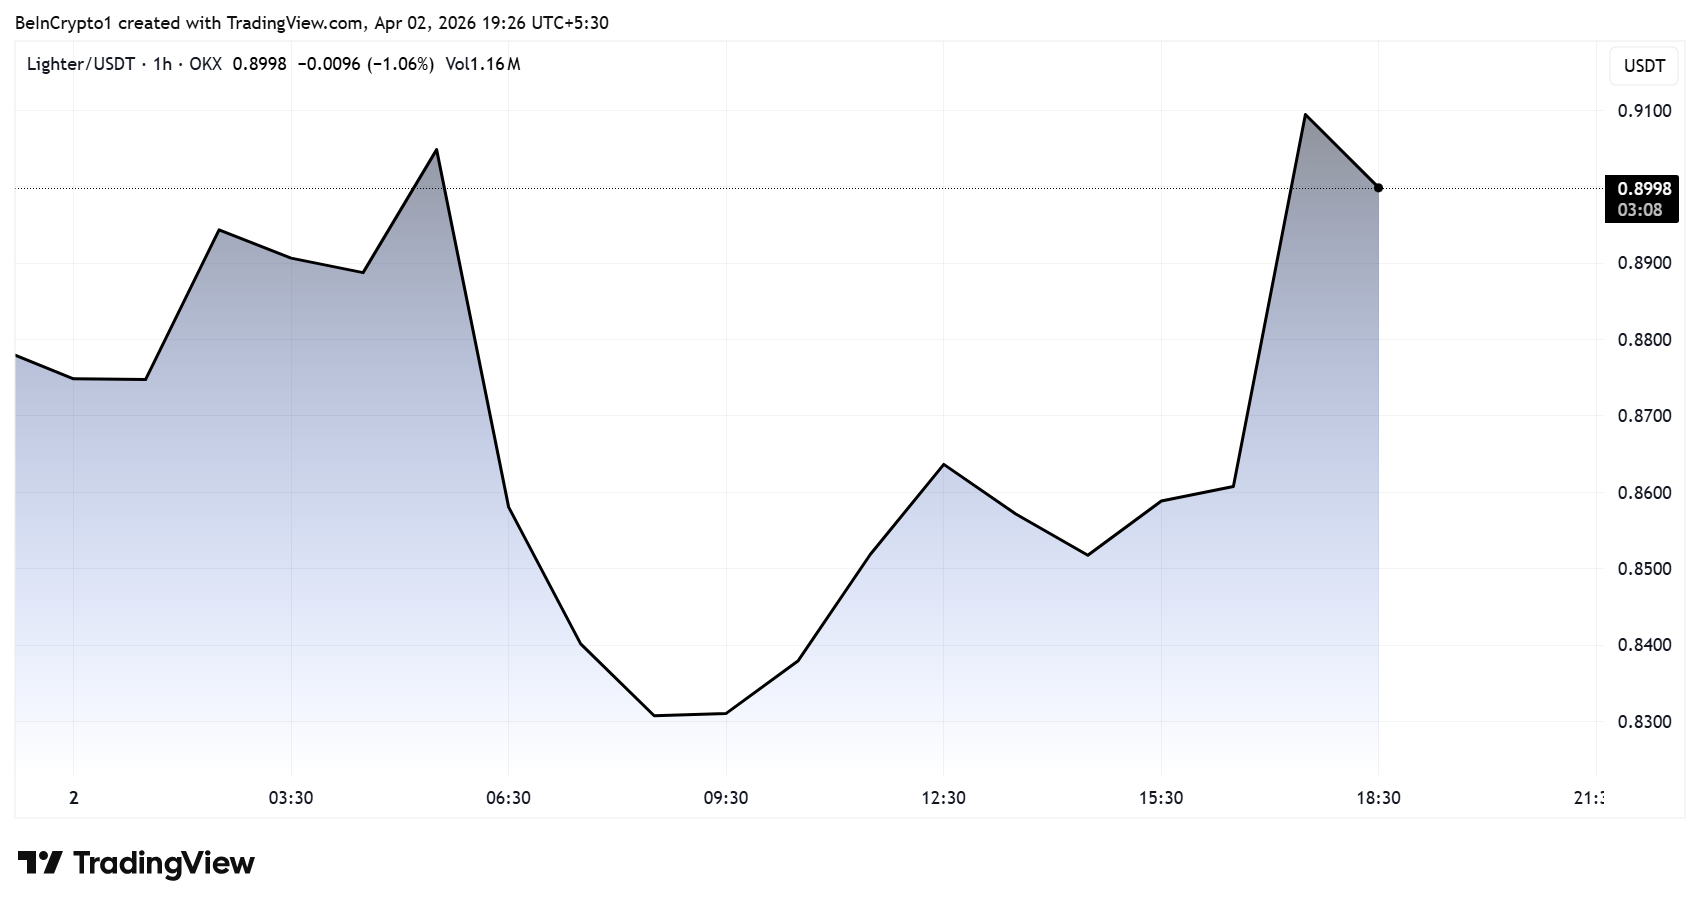
LIT Price Reacts and Competitive Context
The Lighter (LIT) token rose 5% on the announcement. However, Lighter still trails the category leader by a significant margin.
Hyperliquid processed $178.23 billion in volume during March 2026, more than double the combined volume of the next three competitors.
The Telegram distribution could narrow that gap. Wallet in Telegram reaches over 150 million users, a retail audience that neither Hyperliquid nor other DEX competitors currently have direct access to through a native chat-app integration.
Whether the Telegram user base converts into sustained trading volume will determine how much the partnership moves Lighter’s competitive position in the months ahead.
The post Wallet in Telegram Adds Perpetuals via Lighter DEX, Fuels 5% LIT Price Surge appeared first on BeInCrypto.


Solana-based crypto exchange Drift Protocol was hacked for roughly $280 million yesterday as part of a weeks-long operation that likely used social engineering to compromise multiple multisig signers’ approvals.
On April 1, 7 pm UTC+1 time, Drift announced that there was “unusual activity” on the protocol and that users should avoid depositing funds. It stressed, “This is not an April Fools joke.”
This followed from X users raising alarms that Drift was being exploited and that it was going to be a substantial one.
Drift then confirmed that it was under an ongoing attack and that it would need to suspend deposits and withdrawals. Researchers began to speculate that Drift’s private keys were compromised.
Read more: Liquity accused of ‘market manipulation’ after Circle acquisition April Fools’
Drift has since shared a detailed timeline of what took place and how.
It said, “This was a highly sophisticated operation that appears to have involved multi-week preparation and staged execution, including the use of durable nonce accounts to pre-sign transactions that delayed execution.”
It claims the attack was not caused by a bug in Drift’s programs or smart contracts, there was no evidence of compromised seed phrases, and that the attack involved unauthorized transaction approvals before the hack’s execution.
However, it admitted that these approvals were likely facilitated by a social engineering attack against its staff and the manipulation of “durable nonce mechanisms.”
What went down with Drift
Durable nonce mechanisms are a type of blockchain tool that can bypass blockhash signing and facilitate offline translation signing.
Drift claims that on March 23, four durable nonce accounts were created, two of which were associated with Drift Security Council multisig members and two associated with attacker-controlled accounts.
Read more: Circle rarely freezes stolen funds but wants reversible transactions
Then, on March 27, “Drift executed a planned Security Council migration due to a council member change.”
Three days later, another durable nonce account was created for a member of the updated multisig, giving the attackers “effective access to 2/5 signers in the updated multisig.”
Day of execution
Drift claims that on April 1, it executed a test withdrawal from the insurance fund. The attacker then, with access to the multisig approvals, executed “a malicious admin transfer within minutes, gaining control of protocol-level permissions.”
Attackers could then, “Use that control to introduce a malicious asset and remove all pre-set withdrawal limits attacking existing funds.”
Drift hasn’t shared any details about how the likely social engineering attack took place. They can sometimes be the result of an attacker donning a false identity, be it over direct message, email, or phone, and tricking someone into giving them access to key privileges.
Drift’s partner Circle hasn’t frozen funds
The incident has drawn criticism from the crypto investigator ZachXBT, who took issue with the stablecoin firm Circle and its slow efforts to freeze the stolen funds.
Drift integrated Circle’s Cross-Chain Transfer Protocol (CTTP) in 2023. ZachXBT noted that “Circle was asleep while many millions of USDC was swapped via CCTP from Solana to Ethereum for hours from the 9 figure Drift hack during US hours.”
“6 hours is how long Circle had to freeze stolen funds from the $280M+ Drift hack,” he said.
Other users have taken issue with the classification of the protocol as “decentralized,” after the attack appears to have exploited centralised mechanisms.
Other users were annoyed that Drift only required two out of the five multig approvals to action the transaction.
Read more: ‘Bad actor’ Circle slammed for letting stolen $3M USDC sit unfrozen
The platform said that it was working alongside security firms, law enforcement, bridges, and exchanges to figure out what happened and freeze the stolen assets. It added that a more detailed report will arrive in the coming days.
The Chief Technology Officer for Ledger has already speculated that the events of the hack resemble a similar modus operandi “to the Bybit hack last year, widely attributed to DPRK-linked actors.”
Protos has reached out to Drift for comment and will update this piece should we hear anything back.
Got a tip? Send us an email securely via Protos Leaks. For more informed news and investigations, follow us on X, Bluesky, and Google News, or subscribe to our YouTube channel.

Russia has moved to shut down crypto mining operations across 13 regions, targeting an estimated 50,000 miners in what amounts to the most sweeping enforcement action since the country legalized the activity in August 2024.
The bans, extending through 2031 during peak autumn-winter seasons, signal that Moscow’s tolerance for grid-straining mining has hit a structural limit, not just a seasonal one.
The immediate pressure is energy: affected Siberian regions are reporting shortfalls of nearly 3,000 MW on the Unified Energy System grid, driven largely by miners exploiting cheap, heavily subsidized local electricity. That’s not a rounding error – it’s a grid crisis, and Russian officials are treating it as one.
Key Takeaways:
- Ban Scope: Mining restrictions now cover 10 active regions – including Irkutsk Oblast, parts of Buryatia and Zabaikalsky Krai, six North Caucasus republics, and Russian-occupied Ukrainian territories – with seasonal bans running through 2031.
- Affected Miners: An estimated 50,000 operators face enforcement, with major firm BitRiver among the hardest hit due to its reliance on Irkutsk’s low-cost power infrastructure.
- Energy Context: Power shortfalls in Siberian regions have reached nearly 3,000 MW, with miners blamed for exploiting subsidized electricity at grid-destabilizing scale.
- Escalation Path: Year-round bans in southern Buryatia and Zabaikalsky Krai take effect January 1, 2026, moving beyond seasonal restrictions into permanent operational prohibition.
- What to Watch: A government commission on the electric power sector is expected to convene soon to finalize expanded year-round bans; potential amnesty programs in the North Caucasus could redirect illegal miners toward licensed operations.
Discover: Top Crypto Presales to Watch Before They Launch
What the Russia Crypto Mining Ban Actually Does – and Why the Regional Selection Matters
The mechanics are straightforward: registered and unregistered miners in covered regions are prohibited from operating during designated periods, with enforcement escalating to include FSB agents, drones, and surveillance technology in areas like Kabardino-Balkaria, where illegal operations hidden in abandoned buildings caused over 1 billion rubles ($13 million) in utility damages in 2025 alone.
The regional selection isn’t arbitrary. Irkutsk Oblast faces a full-year ban – its southern areas were already restricted earlier in 2025, freeing up 320 MW – because it anchors the cheap-power arbitrage that made Siberia a global mining hub in the first place.
The North Caucasus republics (Dagestan, North Ossetia-Alania, Ingushetia, Chechnya, Kabardino-Balkaria, and Karachay-Cherkessia) are included because illegal mining there has metastasized beyond regulatory reach.

The inclusion of occupied Ukrainian territories – Donetsk, Luhansk, Zaporizhzhia, and Kherson – reflects Moscow’s intent to consolidate energy control in those regions rather than tolerate gray-market extraction.
Power officials in Buryatia welcomed the year-round bans, with TASS and Kommersant reporting officials cited relief from “serious” shortages. The Industrial Mining Association took the opposite view, stating the restrictions “reduce [Southern Siberia’s] attractiveness to investors” and leave miners “vulnerable.” Both reactions are accurate – which is precisely what makes this ban structurally significant rather than cosmetic.
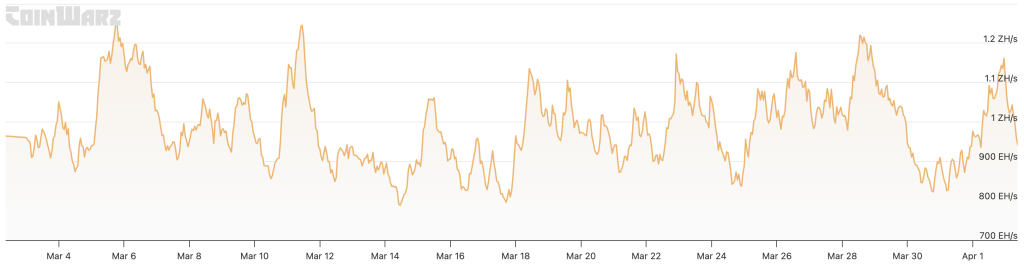
50,000 Miners Offline – What That Means for Global Hash Rate
Russia currently accounts for roughly 5% of global Bitcoin hash rate, according to Cambridge Centre for Alternative Finance data – a share built almost entirely on the cheap, subsidized electricity now being clawed back.
Displacing 50,000 operators from that base doesn’t evaporate hash rate; it redistributes it, and the redistribution logic points toward the United States, Kazakhstan, and parts of Central Asia as the most likely beneficiaries.
That matters because hash rate geography isn’t just a mining industry statistic – it shapes where block rewards flow, which jurisdictions capture mining revenue, and how resilient the network is to coordinated regulatory pressure.
A meaningful contraction in Russian hash rate tightens the global difficulty adjustment modestly in the short term, briefly improving margins for miners elsewhere before difficulty recalibrates. Bitcoin’s broader market performance adds another variable: compressed miner margins in a sideways or declining price environment accelerate the exit of marginal operators, potentially amplifying the hash rate shift beyond what the Russian ban alone would produce.
BitRiver – the largest industrial mining operator in Russia, anchored to Irkutsk’s power infrastructure – faces the most acute operational exposure. Its model was built on energy-cost arbitrage that the Russian state is now explicitly dismantling.
Explore: Best Crypto Projects With High Growth Potential in 2026
The post Russia Targets 50,000 Miners as Crypto Mining Banned in 13 Regions appeared first on Cryptonews.


Summary
- French tokenized exchange Lise plans to list aerospace parts maker ST Group in what is expected to be Europe’s first fully on-chain IPO.
- Lise operates under the EU’s DLT Pilot Regime and is backed by institutions including BNP Paribas, CACEIS and Bpifrance.
- ST Group forecasts about $68 million in potential project revenues over the next decade, targeting aerospace, defense and space programs.
French stock exchange Lise is preparing to list aerospace components supplier ST Group in what is expected to be Europe’s first fully on-chain initial public offering, according to a report from CoinDesk. The listing on the Paris-based venue would mark a milestone for tokenized primary markets in the EU, moving an IPO’s trading and settlement entirely onto distributed ledger infrastructure.finance.
Lise, short for Lightning Stock Exchange, was authorized last year under the EU’s Distributed Ledger Technology Pilot Regime, becoming the first institution in Europe approved to operate a fully tokenized equity exchange that fuses trading and settlement on-chain. Headquartered in Paris, Lise counts French financial heavyweights BNP Paribas, CACEIS — a subsidiary of Crédit Agricole — and public investment bank Bpifrance among its backers, underscoring that this is not a fringe experiment but a regulated market infrastructure project.
ST Group produces composite material components for aerospace, defense and space projects, positioning it squarely in Europe’s strategic industrial base. CoinDesk reported that potential project revenues linked to the company’s pipeline are estimated at around €59 million, roughly $68 million at current rates, over the next ten years, giving investors a sense of the growth opportunity Lise aims to channel into its tokenized venue.
By opting for an on-chain IPO rather than a listing on a traditional exchange, ST Group is effectively stress‑testing whether tokenization can offer small and mid-sized issuers a cheaper and more flexible way to tap public equity markets. Lise’s stated mission is to provide a lower-cost, more efficient listing path for SMEs and mid-caps, replacing the lengthy, document-heavy IPO process with a digital workflow where ownership is recorded, transferred and settled on a single ledger.
Under the DLT Pilot Regime, Lise is allowed to combine the functions of a multilateral trading facility and a central securities depository on one blockchain system, enabling near‑instant, atomic settlement and continuous 24/7 trading. Advocates argue that such architectures cut post‑trade risk and administrative overhead by collapsing what is now a multi‑day, multi‑intermediary chain into a single synchronized platform.
The French initiative lands as other venues experiment with tokenized securities. In one crypto.news story, tokenization specialist Securitize secured EU‑wide approval to run a regulated trading and settlement system on Avalanche under the same DLT Pilot framework, while another story covered 21X’s plans for an EU‑regulated tokenized securities market using Chainlink for cross‑chain data and interoperability. A separate crypto.news story detailed how JPMorgan executed a tokenized treasuries transaction using Ondo Finance and Chainlink, illustrating how major banks are testing on-chain rails for traditional assets.
If Lise successfully floats ST Group fully on-chain, it will provide a live case study for whether tokenized exchanges can genuinely lower issuance costs and broaden investor access, or whether regulatory and operational frictions still blunt the promise of blockchain in public equity markets.
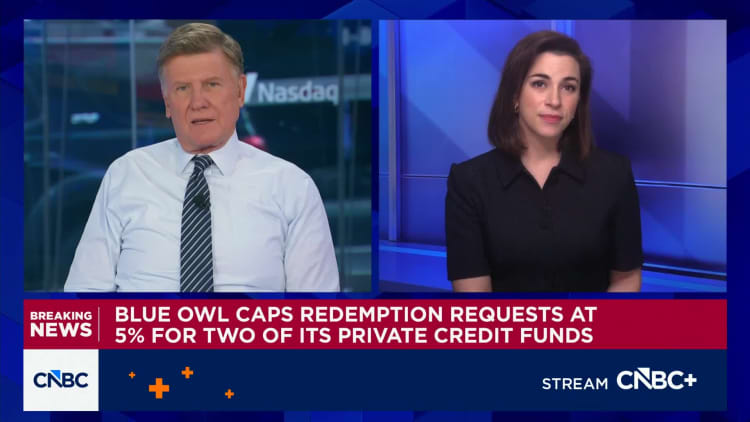

Blue Owl is experiencing elevated redemption requests for two of its private credit funds, according to letters to shareholders issued Thursday.
The firm’s flagship OCIC fund, with about $36 billion in assets under management, received redemption requests of about 21.9% of shares outstanding during the first quarter, the firm said. Blue Owl’s smaller, tech-oriented fund, OTIC, received redemption requests of 40.7% during the same period, it said.
In both of the funds, Blue Owl opted to cap requests at 5%. Blue Owl attributed the higher-than-usual requests to “heightened market concerns around AI-related disruption to software companies.”
“We continue to observe a meaningful disconnect between the public dialogue on private credit and the underlying trends in our portfolio,” Blue Owl said in the shareholder letters.
Shares of Blue Owl were down 1% in mid-morning trading Thursday after paring earlier losses.
The private credit industry has been roiled in recent months by concerns that it is overexposed to the software industry – an area that’s been under pressure over fears of disintermediation from artificial intelligence.
Software represents about 20% of portfolio exposure among business development companies, known as BDCs (a publicly traded proxy for private credit), according to Jefferies. Headline fears about default risk in the sector have driven a small but wealthy group of institutional investors to seek the exits from many of these funds.
“As public market dislocations and AI-related uncertainty reshape sentiment, dispersion is increasing across the sector, creating opportunities for experienced lenders to deploy capital selectively at improved terms,” the technology-focused letter reads.
Blue Owl, which is unique in having two of these nontraded private credit funds, is also among the last to report redemptions. The firm’s percentage of redemptions is multiples higher than its peers.
Most firms have opted to use the 5% cap, but some, including Cliffwater and Blackstone allowed slightly more redemptions.
Blue Owl’s OTIC technology fund saw redemption requests of 17% in the fourth quarter, which it fulfilled. OCIC’s requests were 5% in the fourth quarter.
The two funds previously drew interest from hedge funds Saba and Cox, which extended tender offers to locked-up holders at a steep discount.
Blue Owl said in the most recent quarter, its tech fund’s redemption requests were amplified by a more concentrated shareholder base, particularly within certain wealth channels and regions. For its flagship fund, the firm said the activity was driven by a “small minority of the investor base,” with 90% of shareholders electing not to tender.
Both funds saw gross inflows, which combined with the 5% gates resulted in modest net outflows.


Crypto markets are stuck in a holding pattern as geopolitical tensions in the Middle East cloud an otherwise improving macro backdrop, according to crypto asset manager Grayscale.
“The war in Iran overshadowed virtually all other market developments in March,” the Grayscale research team said in a Wednesday report.
Before the conflict escalated, global growth appeared to be strengthening and central banks were leaning toward rate cuts. That outlook has been disrupted by a sharp rise in oil prices, which has fueled inflation concerns and pushed interest rate expectations higher, weighing on risk assets and keeping investors on the sidelines, the report said.
Since the outbreak of the Middle East conflict, crypto markets have been volatile but broadly rangebound, with sharp headline-driven swings tied to oil prices and shifting risk sentiment. Bitcoin initially dropped into the mid-$60,000s on the first escalation, then rebounded toward the low-$70,000s before slipping back again as the conflict dragged on and macro conditions tightened.
More recently, renewed escalation has pushed bitcoin down roughly 10% from March highs, alongside declines in ether (ETH) and other tokens, as investors pulled back from risk assets. Despite the turbulence, performance has held up better than some traditional markets, with bitcoin roughly flat since the start of the war and even outperforming equities at times, underscoring both its sensitivity to macro shocks and its relative resilience.
For now, Grayscale expects many market participants to wait for greater clarity. If the conflict eases and energy prices retreat, markets could quickly reprice toward a more supportive macro environment. If not, persistently high oil prices may continue to pressure growth and delay a broader recovery.
Even so, crypto has shown notable resilience. Prices have held relatively steady through the volatility, suggesting a more durable bottom may be forming. The research team also pointed to continued inflows into spot crypto investment products and a pickup in futures positioning as signs that risk appetite is stabilizing beneath the surface.
Looking ahead, the report argued that the key catalyst for a sustained rebound will be a reduction in macro uncertainty. But it maintains that the long-term drivers of the asset class, including growing adoption of stablecoins and tokenized assets, remain intact.
The stablecoin market has expanded rapidly in recent years, with total supply rising from about $20 billion in 2020 to more than $300 billion by 2025, and sitting around $315 billion, according to industry data.
The sector added roughly $100 billion in 2025 alone, reflecting renewed growth after a brief contraction, as demand for dollar-pegged digital assets surged across trading, payments and onchain finance.
Periods of heightened uncertainty like the current one have historically presented attractive opportunities for long-term investors positioning for the next phase of growth, the report added.
Read more: Bitcoin holds ground as gold, silver slide on ETF outflows and liquidity strains: JPMorgan
Arkham flagged a 500 Bitcoin outflow from a wallet it attributes to Riot Platforms on Wednesday, in a possible sale the company had not publicly commented on by publication time.
The Bitcoin (BTC) wallet outflow sale comes shortly after Riot posted record 2025 revenue of around $647 million, driven by an increase in Bitcoin mining revenue, and amid other recent Bitcoin disposals by large listed miners.
Last week, MARA Holdings disclosed that it sold about $1.1 billion worth of Bitcoin in March to repurchase convertible debt at a discount, reflecting similar moves by other public miners that have collectively sold over 15,000 BTC in recent months as they balance operational needs and investment plans against a more volatile price and cost backdrop.
The pattern is not uniform. Bitcoin treasury companies, including Metaplanet, are still aggressively adding to their holdings. Nakamoto, meanwhile, disclosed in a recent filing that it sold about 284 Bitcoin for $20 million in March.
On the other hand, onchain tracker Lookonchain, citing Arkham data, reported that wallets it links to Empery Digital, one of the largest listed BTC treasuries, transferred out what it described as “the remaining 1,795 BTC” (about $122.5 million) to Gemini after a series of smaller BTC sales throughout March.
Delisting risk grows for miners
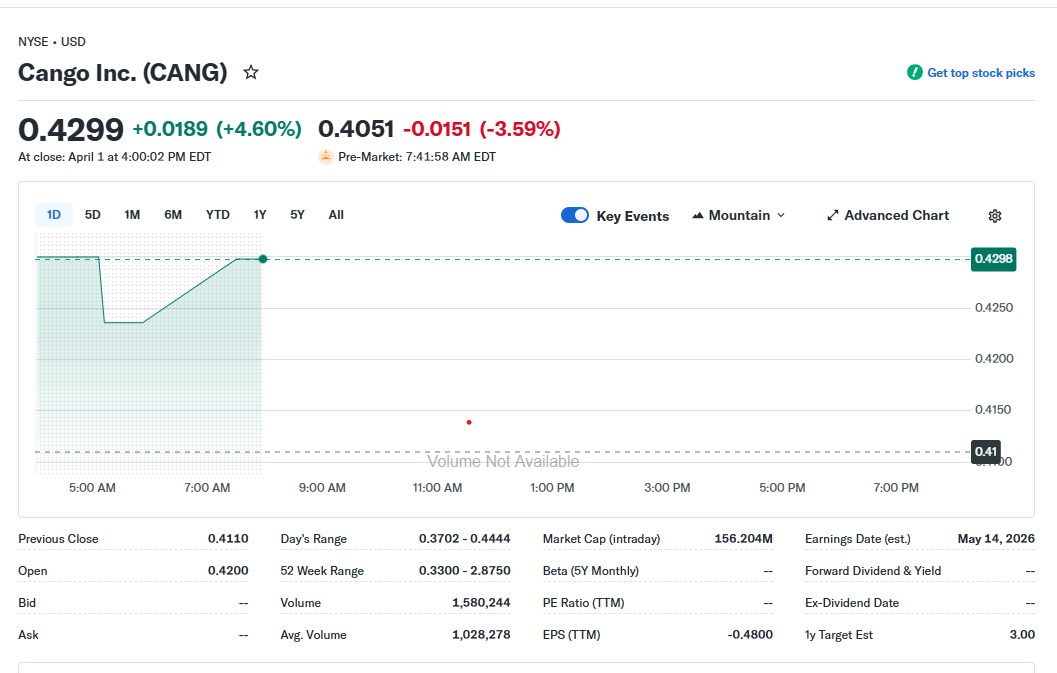
Listing pressures are also in focus for some mining-linked stocks. Cango, which has built out its Bitcoin mining operations, announced Wednesday it received a notice from the New York Stock Exchange after its shares traded below $1 for 30 consecutive trading days, triggering a six-month period to regain compliance with continued-listing standards.
On the same day, Cango also announced a new $65 million capital raising transaction and $10 million convertible note financing. Its share price rose on the news, closing the day at $0.42, 4.6% higher, but was trading at $0.41, 3.59% lower, in premarket Thursday, according to data from Yahoo! Finance, well below NYSE requirements.

Juliet Ye, head of investor relations and communications at Cango, told Cointelegraph that the company would maintain its strategic roadmap despite the notice, and that it had been “proactively implementing cost optimization and efficiency enhancement measures over the past several months,” including divesting obsolete capacity and migrating to lower electricity cost regions.
She added that the recent completion of the two financing transactions, alongside “the adjustment of our treasury strategy,” served as concrete examples of measures to help address both the listing requirements and current market conditions.
Related: Bitcoin mining difficulty falls 7.7% as miner pressure persists
In January, crypto mining hardware maker Canaan Inc. disclosed a similar minimum-bid deficiency notice from Nasdaq after its American depositary shares stayed under the $1 threshold for 30 straight sessions, and it likewise had 180 days to cure the issue.
Despite share price pressure, Canaan has continued expanding operations. The company’s Bitcoin reserves increased in Q1 2026, despite many peers offloading their holdings. Earlier in March, it also acquired a 49% stake in two Texas-based mining sites, part of its broader strategy to diversify geographically and strengthen US market exposure.
Magazine: Bitcoin may take 7 years to upgrade to post-quantum — BIP-360 co-author

Wallet in Telegram, a third-party wallet integrated directly into the Telegram app, is rolling out perpetual futures support with Lighter, a perpetuals decentralized exchange.
Launching Thursday, perpetual futures are available to Telegram users through an integrated custodial solution, Crypto Wallet, the platform said in an announcement seen by Cointelegraph.
The integration allows users to open long and short positions with up to 50× leverage across more than 50 assets, including crypto assets such as Bitcoin (BTC) and Toncoin (TON), as well as tokenized commodities and stocks.
“Perpetual trading has traditionally been intimidating for retail users,” said Andrew Rogozov, CEO of The Open Platform, which develops Telegram-based protocols and apps on The Open Network (TON).
The launch pushes leveraged derivatives into one of crypto’s largest consumer distribution channels, extending a trend in which perpetual futures are moving from specialist exchanges into everyday app environments, even as the products remain complex and high risk.
Lighter brings leverage inside chat
Wallet in Telegram rolled out access to tokenized stocks via xStocks partnership with the US crypto exchange Kraken in October 2025.

Lighter founder and CEO Vladimir Novakovski said the integration enables near-instant perpetual trading within the app:
“By integrating perpetual trading into Wallet, users can move from chat to market in seconds, making taking a position as simple as sending a message.”
Perpetual futures, or perps, are derivatives contracts that allow traders to speculate on price movements without owning the underlying asset.
Retail derivatives push accelerates further
Lighter’s perpetual futures rollout on Telegram comes amid massive growth in the sector, with perps almost tripling volume in 2025. According to CryptoQuant, perps accounted for up to 90% of derivatives volumes on major crypto exchanges in 2025.
Related: Coinbase launches 24/7 stock perps for non-US traders
Wallet in Telegram’s integration with Lighter is not the first time perps have reached Telegram.
In October 2025, a similar feature was launched by Blum, a hybrid crypto exchange designed as a Telegram Mini App. As part of the offering, Blum initially enabled traders to go long or short on 20 assets with up to 100x leverage.

Josh Allen, Hailee Steinfeld announce birth of first child
BBC Race Across the World 2026 start time, line-up and how to watch

Jordan, Magic, Bird, Duncan, Kareem


-

 Business7 days ago
Instagram, YouTube Found Responsible for Teen’s Mental Health Struggle in Historic Ruling
-

 NewsBeat6 days ago
The Story hosts event on Durham’s historic registers
-
 Tech7 days ago
Intercom’s new post-trained Fin Apex 1.0 beats GPT-5.4 and Claude Sonnet 4.6 at customer service resolutions
-

 Sports6 days ago
Sweet Sixteen Game Thread: Tide vs Michigan
-
Entertainment3 days ago
Fans slam 'heartbreaking' Barbie Dream Fest convention debacle with 'cardboard cutout' experience
-
 Entertainment5 days ago
Lana Del Rey Celebrates Her Husband’s 51st Birthday In New Post
-
Crypto World2 days ago
Dems press CFTC, ethics board on prediction-market insider trades
-

 Crypto World19 hours ago
Gold Price Prediction: Worst Month in 17 Years fo Save Haven Rock
-

 Tech4 days ago
The Pixel 10a doesn’t have a camera bump, and it’s great
-

 Sports2 days ago
Tallest college basketball player ever, standing at 7-foot-9, entering transfer portal
-

 Tech2 days ago
EE TV is using AI to help you find something to watch
-

 Fashion4 days ago
Amazon Sundays: Soft Spring Layers
-

 Tech3 days ago
Apple will hide your email address from apps and websites, but not cops
-

 Tech3 days ago
Flipsnack and the shift toward motion-first business content with living visuals
-

 Tech2 days ago
How to back up your iPhone & iPad to your Mac before something goes wrong
-

 Politics3 days ago
Should Trump Be Scared Strait?
-

 Crypto World3 days ago
U.S. rule change may open trillions in 401(k) funds to crypto
-

 Fashion7 days ago
En Vogue in Brown Leather and Tailored Neutrals by Atelier Savoir, Styled by J Bolin
-

 Fashion7 days ago
What Are Your Favorite T-Shirts for the Weekend?
-

 Business6 days ago
Chinese universities with military links bought Super Micro servers with restricted AI chips
You must be logged in to post a comment Login