
Crypto World
Altria Group (MO) Stock: Valuation Models Signal Upside Despite Mixed Analyst Sentiment

Key Takeaways
- MO shares finished trading at $66.80, delivering 26.9% returns over 12 months and an impressive 91.9% gain across five years
- Intrinsic valuation via DCF methodology reaches $99.44 per share, suggesting the stock trades at a 32.8% discount
- Current P/E multiple of 16.12x falls short of the calculated Fair Ratio at 23.27x, indicating potential undervaluation
- Company declared $1.06 quarterly dividend, translating to a 6.3% annual yield, with April 30 payment date
- Wall Street maintains “Hold” rating with average price objective at $65.75
Altria Group (MO) has delivered impressive returns to shareholders recently. The tobacco giant’s shares settled at $66.80, representing year-to-date appreciation of 16.6% and a robust 26.9% advance over twelve months. Looking further back, the five-year return reaches 91.9%.
Such robust performance inevitably leads investors to wonder: is there more upside ahead, or has the rally exhausted itself?
MO shares began Friday’s session at $67.52. The 50-day moving average currently stands at $66.41, while the 200-day average tracks at $62.59. Over the past year, the trading range has extended from a low of $54.70 to a peak of $70.51.
The company’s fourth-quarter results showed earnings per share of $1.30, falling marginally short of analyst expectations at $1.32. Top-line performance fared better, with revenue reaching $5.08 billion versus the $5.02 billion consensus forecast.
Wall Street projects full-year earnings of $5.32 per share for the ongoing fiscal period.
Fundamental Analysis Indicates Discount to Fair Value
Utilizing a 2-Stage Free Cash Flow to Equity discounted cash flow framework, Altria’s fair value calculates to $99.44 per share. This assessment incorporates trailing twelve-month free cash flow of $9.11 billion, with projections reaching $9.31 billion by 2028.
Measured against the prevailing market price of $66.80, this methodology points to a meaningful 32.8% discount — flagging the stock as potentially undervalued.
Price-to-earnings analysis reinforces this conclusion. MO currently commands a 16.12x earnings multiple. While this exceeds the tobacco sector average of 12.27x, it trails the peer group average of 18.63x. Simply Wall St’s calculated Fair Ratio for Altria sits at 23.27x, further supporting the undervaluation thesis.
The company maintains a market capitalization of $112.85 billion, with a PEG ratio of 2.85 and beta of 0.41 — indicating lower volatility relative to broader equity markets.
Distribution Policy and Ownership Patterns
Management declared a $1.06 per share quarterly distribution, scheduled for April 30 payment. The ex-dividend date occurred on March 25. This translates to $4.24 annually and generates a 6.3% yield.
The current payout ratio registers at 103.16%.
Recent institutional activity shows Westbourne Investments establishing a fresh position valued at approximately $995,000 during Q4, acquiring 17,261 shares. Multiple other institutional players expanded holdings, including V Square Quantitative Management, Yarger Wealth Strategies, and Powers Advisory Group. MH & Associates Securities Management initiated a position worth roughly $2.72 million.
Institutional ownership currently represents 57.41% of outstanding shares.
Street Sentiment and Corporate Transactions
Wall Street opinion remains divided. UBS maintains a buy recommendation with a $74 price objective. Citigroup holds a neutral stance at $65. Barclays carries an underweight rating at $63. Jefferies assigns an underperform rating with a $50 target.
The aggregate consensus lands at “Hold” with a mean price target of $65.75 — marginally below current trading levels.
Regarding insider transactions, SVP Charles N. Whitaker disposed of 27,908 shares on March 5 at an average price of $67.57, generating proceeds of approximately $1.89 million. This sale reduced his holdings by 13.37%. His remaining position totals 180,869 shares.
Company insiders collectively control 0.08% of outstanding equity.


TLDR:
- JasmyCoin shows repeated falling wedge patterns, often linked with weakening bearish momentum.
- Multi-year consolidation reflects a balance between buyers and sellers before a possible trend shift.
- Current price compression near wedge support suggests a potential buildup toward a breakout move.
- A projected move toward $0.2785 depends on confirmed resistance breakout and sustained momentum.
JasmyCoin is drawing renewed attention after a technical analysis projected a potential long-term breakout toward higher price levels.
The outlook is based on multi-year chart structures that show extended consolidation, repeated falling wedge formations, and a possible transition from a prolonged downtrend into a bullish phase.
Multi-Year Structure Signals Gradual Market Shift
A recent tweet by Javon Marks outlined a macro view of JasmyCoin’s price action across several years. The analysis describes a clear transition from a sharp post-2021 decline into a more structured consolidation phase.
During the earlier cycle, the asset recorded consistent lower highs and lower lows, forming descending channels that reflected sustained selling pressure.
As time progressed, the chart began to show signs of stabilization. A falling wedge pattern emerged during the mid-cycle phase, where price action tightened within converging trendlines.
This structure often reflects weakening bearish momentum. A breakout attempt followed, leading to a short-lived upward move, which suggested early accumulation behavior.
After that move, JasmyCoin entered a broader consolidation range marked by sideways price action. The chart indicates multiple swings within this zone, showing a balance between buyers and sellers.
This range also reflects improved structural stability compared to the earlier downtrend phase. Such conditions often precede larger directional moves once market pressure resolves.
Current Compression Points to Potential Breakout Setup
More recently, the chart shows another falling wedge formation developing on the right side. Price action continues to compress toward the apex of this pattern, indicating reduced volatility and tightening market conditions. This setup often attracts attention due to its association with breakout scenarios.
The current price position remains near the lower boundary of the wedge. This area is commonly viewed as a demand zone where buyers may step in.
At the same time, the upper trendline serves as a resistance level that traders monitor for confirmation of a breakout.
Javon Marks’ tweet also pointed to a projected move toward the $0.2785 level. This target represents a large percentage increase from current prices, contingent on a confirmed breakout and sustained market support.
The projection is illustrated by a curved upward path on the chart, suggesting a gradual expansion rather than an immediate surge.
The broader structure suggests a transition from accumulation into a potential markup phase. However, this depends on whether price action can move above resistance levels with consistent momentum. If the asset fails to break out, the chart suggests continued consolidation or further compression within the wedge.
Overall, the analysis presents a technical setup where JasmyCoin approaches a key decision point. The combination of repeated wedge formations and long-term consolidation continues to shape expectations around a possible trend reversal, depending on future price behavior and market conditions.
Crypto World
XRP Tightens Near $1.33 as Market Builds Pressure Between Key Support and Resistance Levels
TLDR:
- XRP remains in a tight consolidation range near $1.33 with reduced volatility and declining trading volume in sessions.
- MACD shows a bullish crossover with the histogram turning positive, though the overall trend remains below the zero line.
- RSI stays below 50 at mid-40 levels, signaling weak momentum and a continued market indecision phase.
- Price action stays between $1.30 support and $1.50 resistance as traders wait for breakout confirmation signals.
XRP continues to trade within a tight range after months of decline, with recent data showing early signs of stabilization.
Market participants are closely watching resistance and support levels, as technical indicators signal a potential directional move.
XRP Consolidates After Downtrend as Key Levels Come Into Focus
XRP price action shows a clear shift from a prolonged decline into a consolidation phase. From November through early February, the asset recorded consistently lower highs and lower lows. A sharp drop in early February pushed prices toward the $1.20–$1.25 range.
Since that move, XRP has stabilized and now trades between defined levels. Immediate support sits near $1.30–$1.32, while resistance is seen between $1.45 and $1.50. At the time of analysis, XRP trades at $1.33168, reflecting a daily decline of 1.74%.
The narrowing price range suggests reduced volatility. Candles have become tighter, indicating a pause in aggressive selling.
Volume has also declined during this phase, pointing to reduced market participation. Traders often associate such conditions with a buildup before a larger move.
A recent post by analyst Ali Charts adds a broader perspective. The analyst notes that XRP has remained within a nine-year ascending triangle on the monthly chart. According to the post, repeated rejections at resistance have followed a consistent pattern since 2017.
The same analysis points to a potential retest of macro support between $0.75 and $0.80. This zone is described as a key level to watch if broader weakness returns. The long-term structure remains intact unless that rising trendline is broken.
Momentum Indicators Show Early Recovery but No Clear Trend Yet
Momentum indicators present a mixed picture, reflecting the ongoing consolidation. The Moving Average Convergence Divergence (MACD) shows early signs of recovery. The MACD line has crossed above the signal line, with a reading of -0.01580 against -0.01996.
The histogram has turned slightly positive at 0.00416. This shift indicates a mild increase in bullish momentum. However, both lines remain below the zero mark, which keeps the broader trend in a neutral to bearish zone.
At the same time, the Relative Strength Index (RSI) remains below the midpoint. Current readings show RSI at 43.98, with its moving average at 43.26. This level reflects weak momentum and no clear dominance by buyers or sellers.
The RSI has recovered from oversold conditions seen during February’s decline. Still, it remains below 50, suggesting that bullish strength has not fully developed. The indicator is flattening, which aligns with the ongoing sideways movement.
Market structure now depends on a breakout from the current range. A move above $1.45–$1.50 could open the path toward $1.60 and $1.70. Such a move would likely require stronger volume and confirmation from momentum indicators.
On the downside, a break below $1.30 could lead to a retest of $1.20–$1.25. If that level fails, attention may shift to lower support zones. For now, XRP continues to trade within a defined range as the market waits for clearer direction.
TLDR:
- Gold now accounts for 24% of global central bank reserves, overtaking US Treasuries at just 21%.
- Gold’s reserve share has nearly tripled since 2015, driven by central bank buying and rising prices.
- The US seizure of Russia’s reserves in 2022 triggered a global shift away from dollar-denominated assets.
- China and BRICS nations have led steady US Treasury sell-offs since 2022, accelerating de-dollarisation.
Gold surpasses US Treasuries in global central bank reserves for the first time since the mid-1990s, with gold now commanding 24% of reserves against Treasuries’ 21%, Bloomberg data confirms.
The shift, years in the making, reflects sustained central bank buying, soaring gold prices, and a deliberate move away from dollar dependency. geopolitical shocks, from the seizure of Russia’s reserves to escalating US tariffs.
All have accelerated a de-dollarisation trend that is now reshaping the foundation of the international monetary system.
Gold Overtakes US Treasuries in Reserve Composition
Gold now accounts for 24% of global central bank reserves, while US government debt sits at 21%, according to Bloomberg data.
This marks a sharp reversal from the final quarter of 2015, when Treasuries made up 33% of reserves and gold just 9%.
Gold’s share has nearly tripled over the last decade, driven by aggressive central bank purchases and a sustained rise in gold prices.
Emerging market central banks have led this accumulation. These institutions have steadily diversified away from dollar-denominated assets, accelerating purchases as part of broader reserve management strategies.
The trend gained momentum from around 2017, when USD reserve growth began to plateau, while gold continued rising in both price and share.
Gold now makes up 24% of global central bank reserves, surpassing US Treasuries at 21% for the first time since the mid-1990s.
The reallocation reflects a growing preference for assets that carry no counterparty risk. Unlike US Treasuries, gold cannot be frozen or devalued through a foreign government’s policy decisions, making it attractive to reserve managers navigating a more uncertain geopolitical environment.
Geopolitical Shocks Deepen the De-Dollarisation Trend
The pace of change accelerated sharply in 2022 when the US seized Russia’s central bank reserves following the conflict in Ukraine. The move alarmed reserve managers globally and prompted many to reassess their exposure to dollar-denominated assets.
China and the leading BRICS nations began selling US Treasury bills in earnest from that year. Selling intensified further in April 2024 after the Trump administration launched the Liberation Day tariff scheme.
Additional pressure came from Operation Epic Fury, which further undermined confidence in the US as a reliable financial partner. These events together have driven a sustained shift in reserve composition.
While the US dollar remains dominant in global trade and finance, central banks are now actively reducing its share in their reserve baskets. Gold is no longer viewed as a supplementary reserve asset.
It has moved to the center of reserve strategy, holding more weight in global central bank portfolios than US government debt for the first time in nearly three decades.
Bitcoin (BTC) fell 3% to trade below $71,000 into Sunday’s weekly close after negotiations to end the US-Iran war broke down.
Key points:
-
Bitcoin shed its gains as negotiations between the US and Iran broke down.
-
The Strait of Hormuz becomes a flashpoint again as US President Donald Trump demanded that it be reopened.
-
BTC price downside punishes late long positions.
BTC price drops on US-Iran war fears
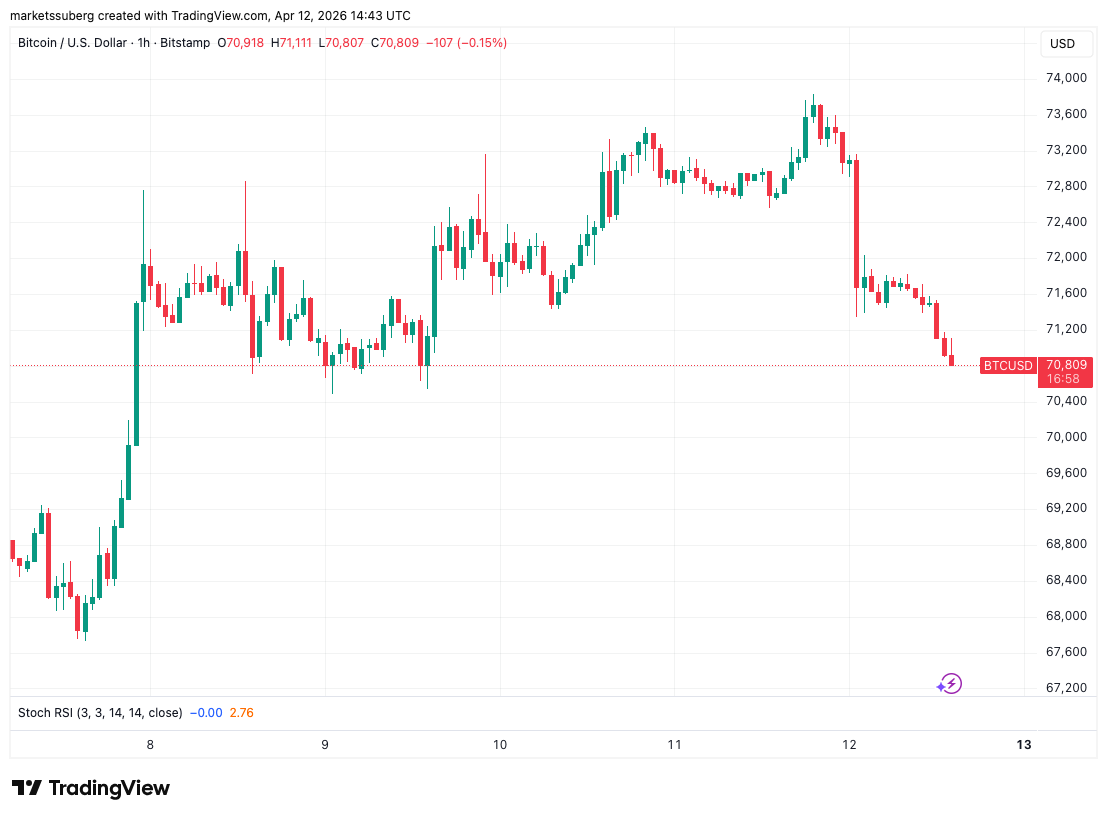
Data from TradingView showed BTC price action dipping below $71,000 after news of a sudden breakdown in negotiations between the US and Iran in Islamabad, Pakistan.

A failure to reach an agreement on the issue of nuclear weapons resulted in both delegations leaving talks unfinished. Later, US President Donald Trump said that the US would blockade the Strait of Hormuz and “interdict” vessels paying Iran for safe passage.
“No one who pays an illegal toll will have safe passage on the high seas,” he wrote in a post on Truth Social.
A follow-up post repeated demands that Iran make Hormuz, a major oil transit route, fully operational.

Ahead of futures markets opening, reactions to the latest events spelled out the risks for the wider economy.
“If the path forward is continued war, escalation, and a prolonged closure of the Strait of Hormuz, then the Iran War has just entered a new era,” The Kobeissi Letter wrote in its latest analysis on X.
“US CPI inflation just jumped from 2.4% to 3.3% and further escalation of the Iran War would lead to 4.0%+ inflation, according to our models.”

Kobeissi referred to the US Consumer Price Index (CPI) inflation, a gauge particularly sensitive to oil prices. Earlier this week, the March CPI print came in slightly below expectations, despite the highest jump in its oil-price component in 60 years.
“There are currently no plans for additional talks, according to Iranian media,” Kobeissi added.
“So, will Trump choose to push harder for diplomacy or double down on military action? Today, we find out.”
Bitcoin liquidations mount as longs suffer
As the only 24-hour-traded asset class, Bitcoin and crypto were the only ones reacting to the chaos in real time.
Related: Bitcoin analysis sees $55K BTC price ‘iron bottom’ by December 2026
Data from CoinGlass showed BTC/USD slicing through long liquidations, with the liquidation total for the past 24 hours nearing $350 million.

“Volatility remains high and it’s clear that there won’t be a path forward where risk-on assets will do well if this continues to be the consensus,” trader Michaël Van de Poppe wrote in an X response.
Van de Poppe suggested that the economic weakness as a result of the returning war could force the Federal Reserve to inject liquidity despite rising inflation.
“On a larger scale, I think that we’re currently in a sufficiently weak economy and the FED has no other option than to start printing again to positively influence the economy,” he argued.
Earlier, Cointelegraph reported on rising odds of the US entering a recession in 2026.
Next week will bring more inflation cues from the March Producer Price Index (PPI) print, while multiple senior Fed officials will speak on the economy.
This article is produced in accordance with Cointelegraph’s Editorial Policy and is intended for informational purposes only. It does not constitute investment advice or recommendations. All investments and trades carry risk; readers are encouraged to conduct independent research before making any decisions. Cointelegraph makes no guarantees regarding the accuracy or completeness of the information presented, including forward-looking statements, and will not be liable for any loss or damage arising from reliance on this content.
Bitcoin is currently trading at one of the most pivotal levels of this cycle, caught between long-term on-chain support and a wall of overhead resistance created by millions of underwater short-term holders.
Spot price $70,925
Weekly change +2.74%
Weekly RSI (14) 33.59
ATH drawdown -43%
Using Glassnode’s latest on-chain indicators alongside weekly and daily technical charts, this analysis breaks down exactly where Bitcoin stands today and what needs to happen next. Two clear scenarios emerge.
How Bearish is Bitcoin Right Now? Four Cost-Basis Levels are Critical
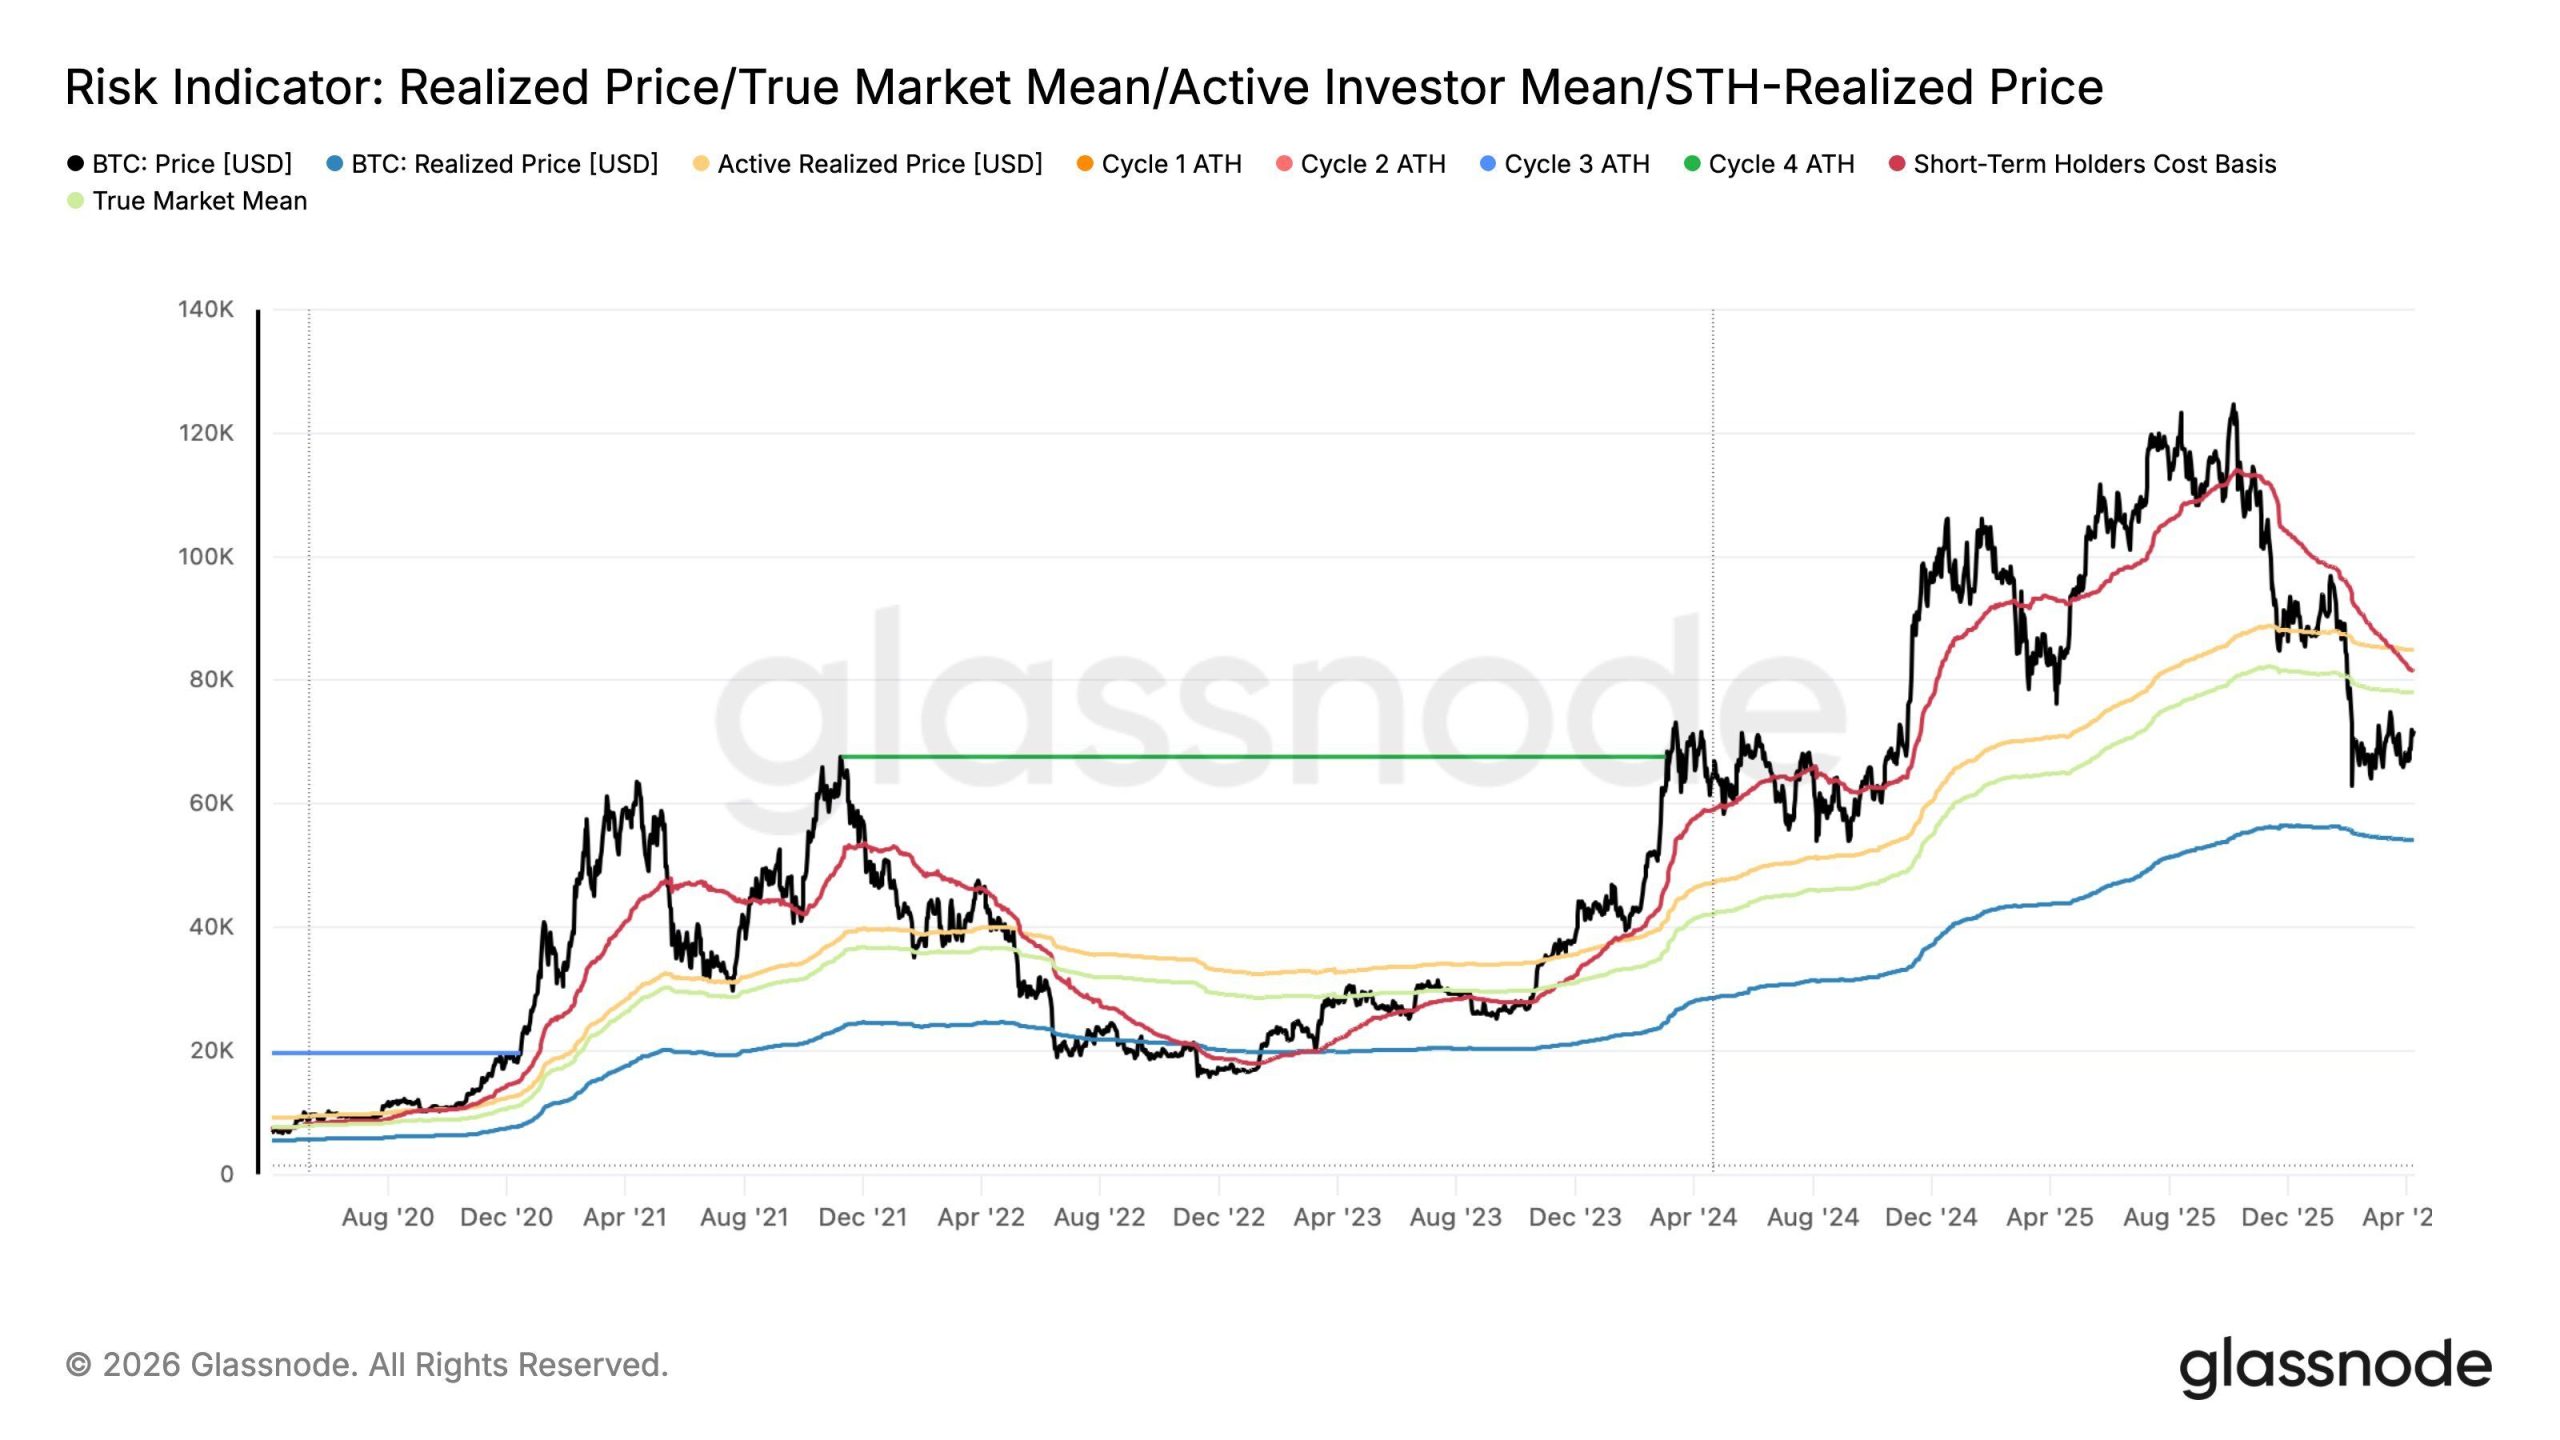
Glassnode’s latest Risk Indicator chart overlays four key on-chain price models against the Bitcoin spot price. Together, these models reveal where the market stands relative to the cost basis of different investor cohorts.
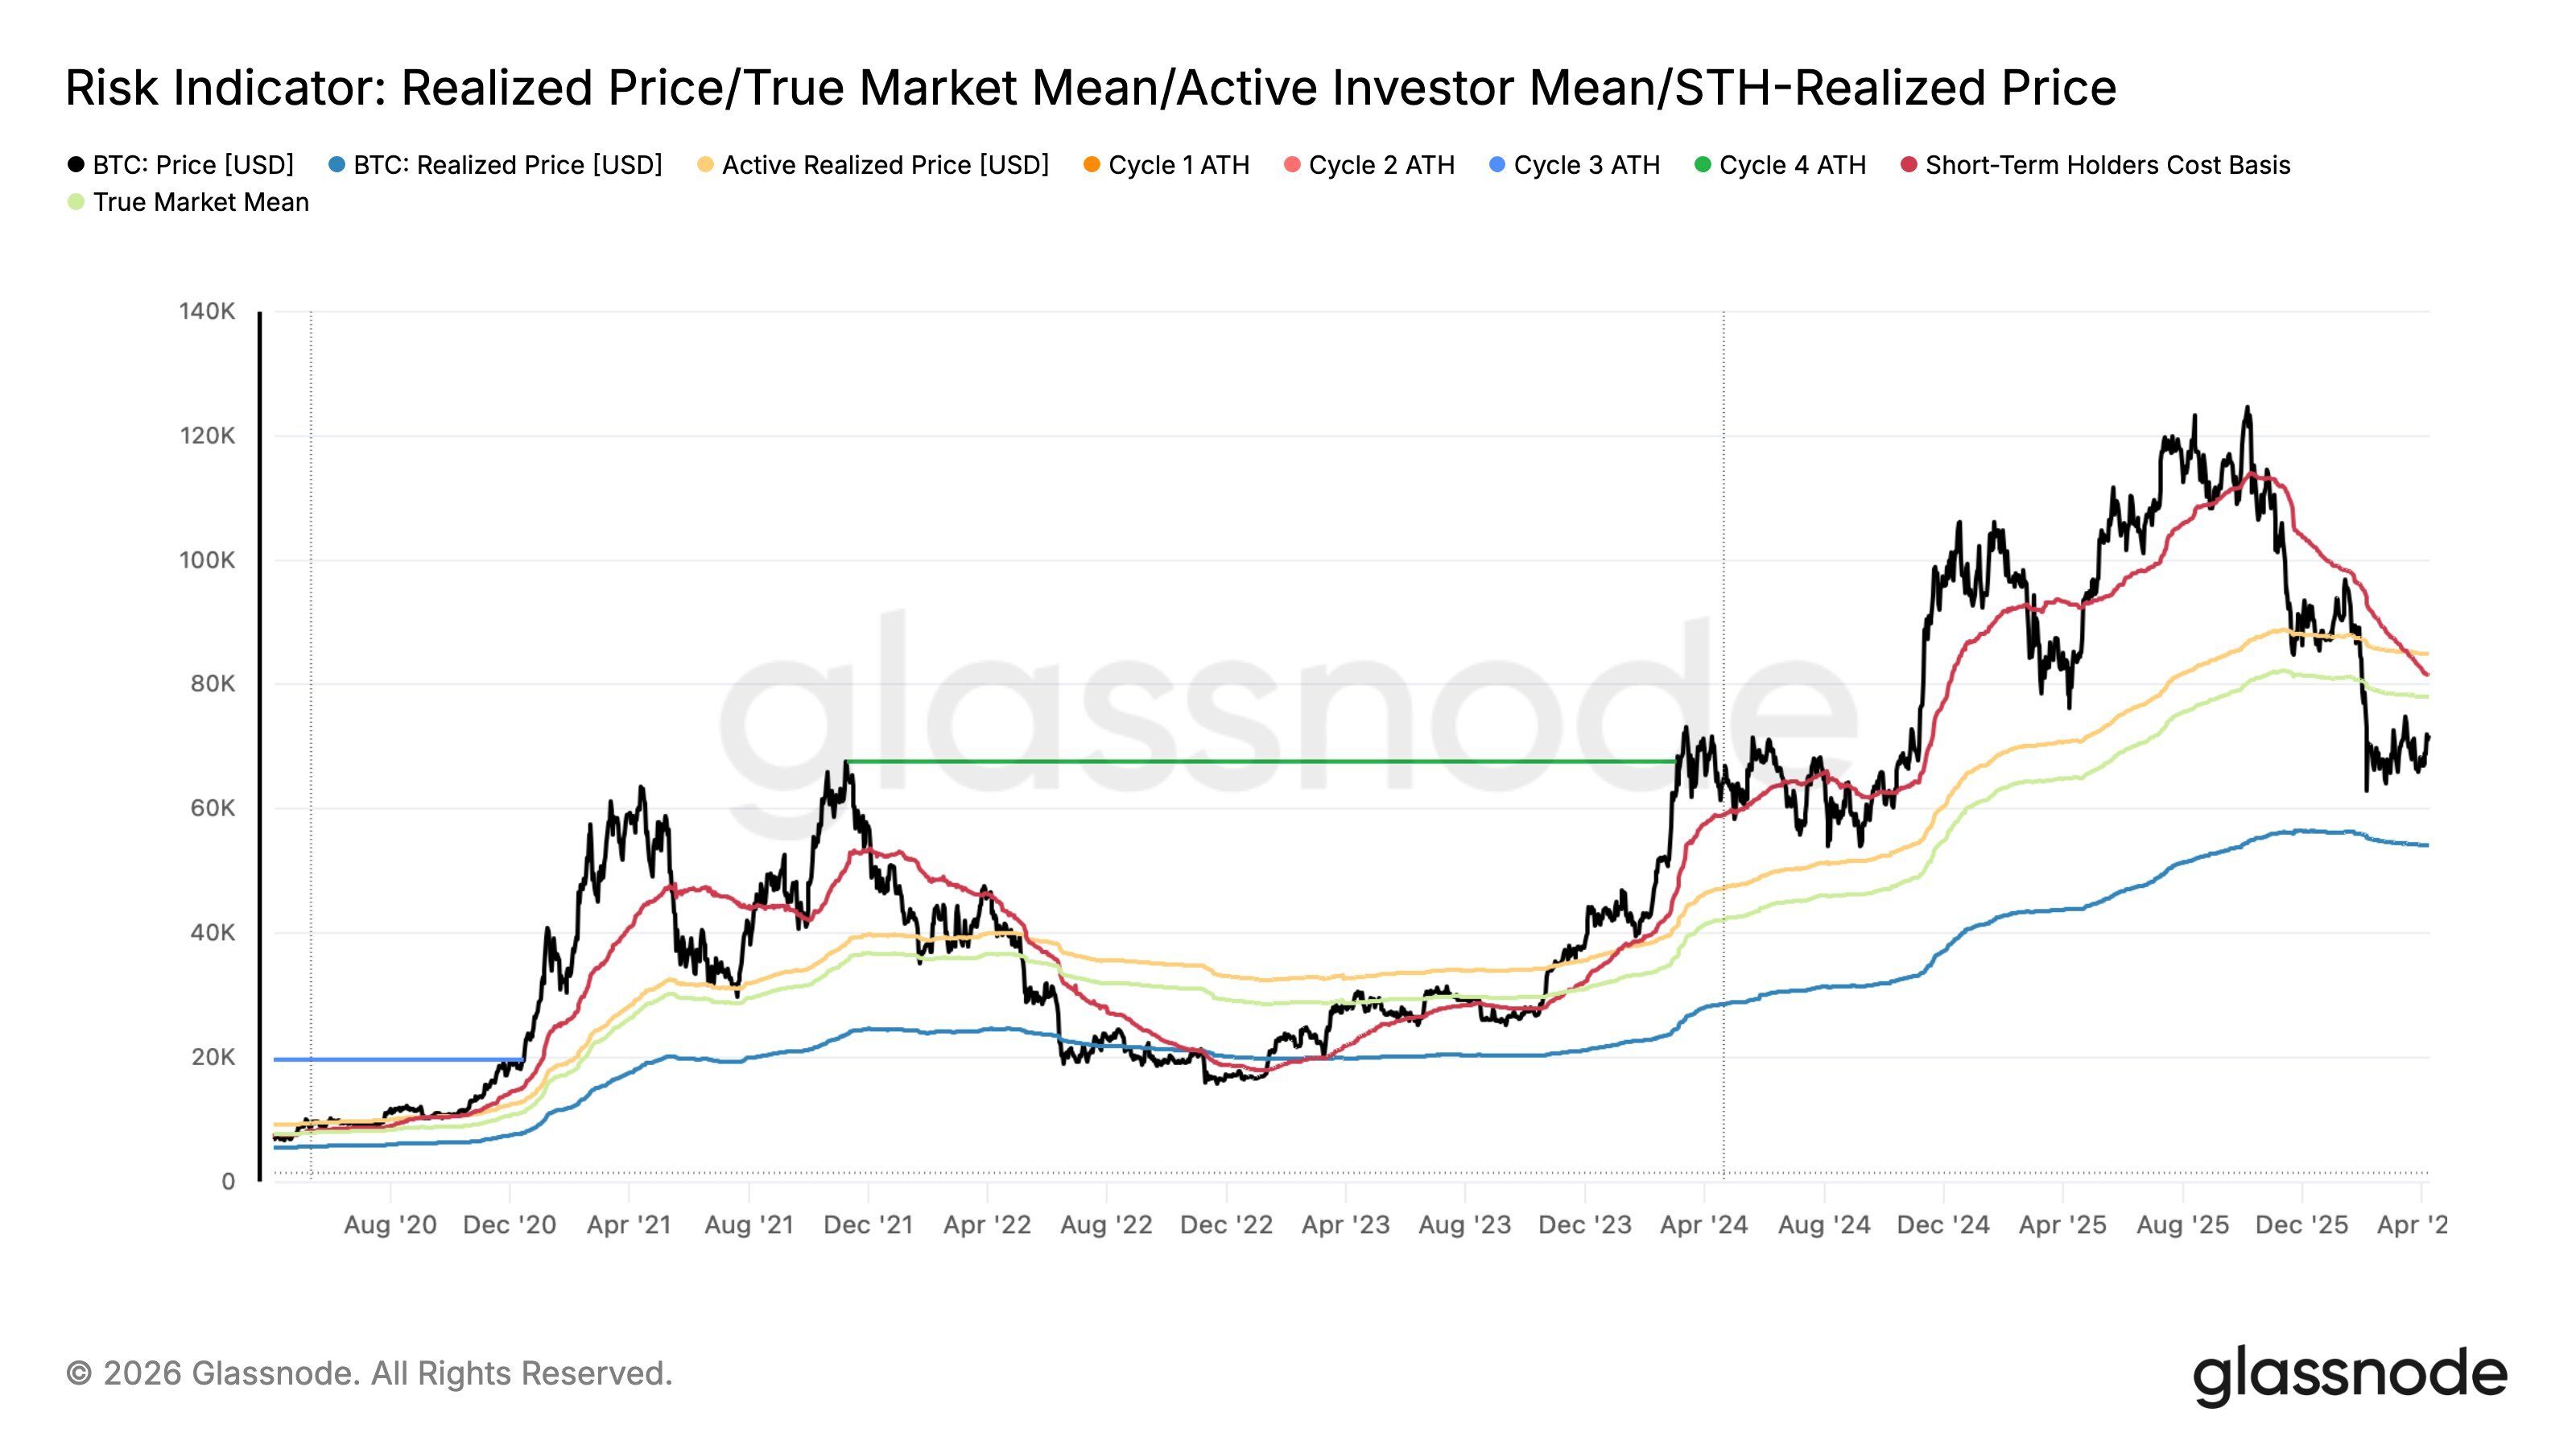
- Realized price — $54,000
The average cost basis of every coin on the network. Bitcoin trading above this level means the average holder is in profit. This is the most fundamental long-term support and is currently well below spot, which is a structurally positive signal.
- True market mean — $82,000
A more refined cost basis weighted by actual economic activity, filtering out dormant coins. Spot is currently below this level, meaning a meaningful portion of active participants are underwater.
- Active investor mean — $88,000
The average cost basis of active market participants. Price trading significantly below this level signals stress among engaged investors and acts as overhead resistance.
- Short-term holder cost basis — ($83–$84,000)
The average entry price for recent buyers (coins held for less than 155 days). With spot well below this level, short-term holders are sitting on unrealised losses — historically a source of continued selling pressure, but also a precondition for a capitulation bottom.
The key takeaway: spot at $70,925 sits above only the realized price and below the three other indicators.
This places Bitcoin in a historically recognized stress zone. Not the deep bear market territory of 2022 (when price fell below even the realized price), but a mid-cycle correction where short-term holders are underwater and overhead supply is significant.
Bitcoin’s Macro Structure In a Key Position
The weekly chart (August 2020 to present) provides the macro technical backdrop.
Bitcoin peaked at approximately $126,000 in October 2025 and has since corrected roughly 43% to current levels.
The current price is retesting the previous cycle’s all-time high from 2021 (~$69,000, yellow line), a level that historically transitions from major resistance into long-term support. This week’s green candle suggests early signs of a defense of that zone.
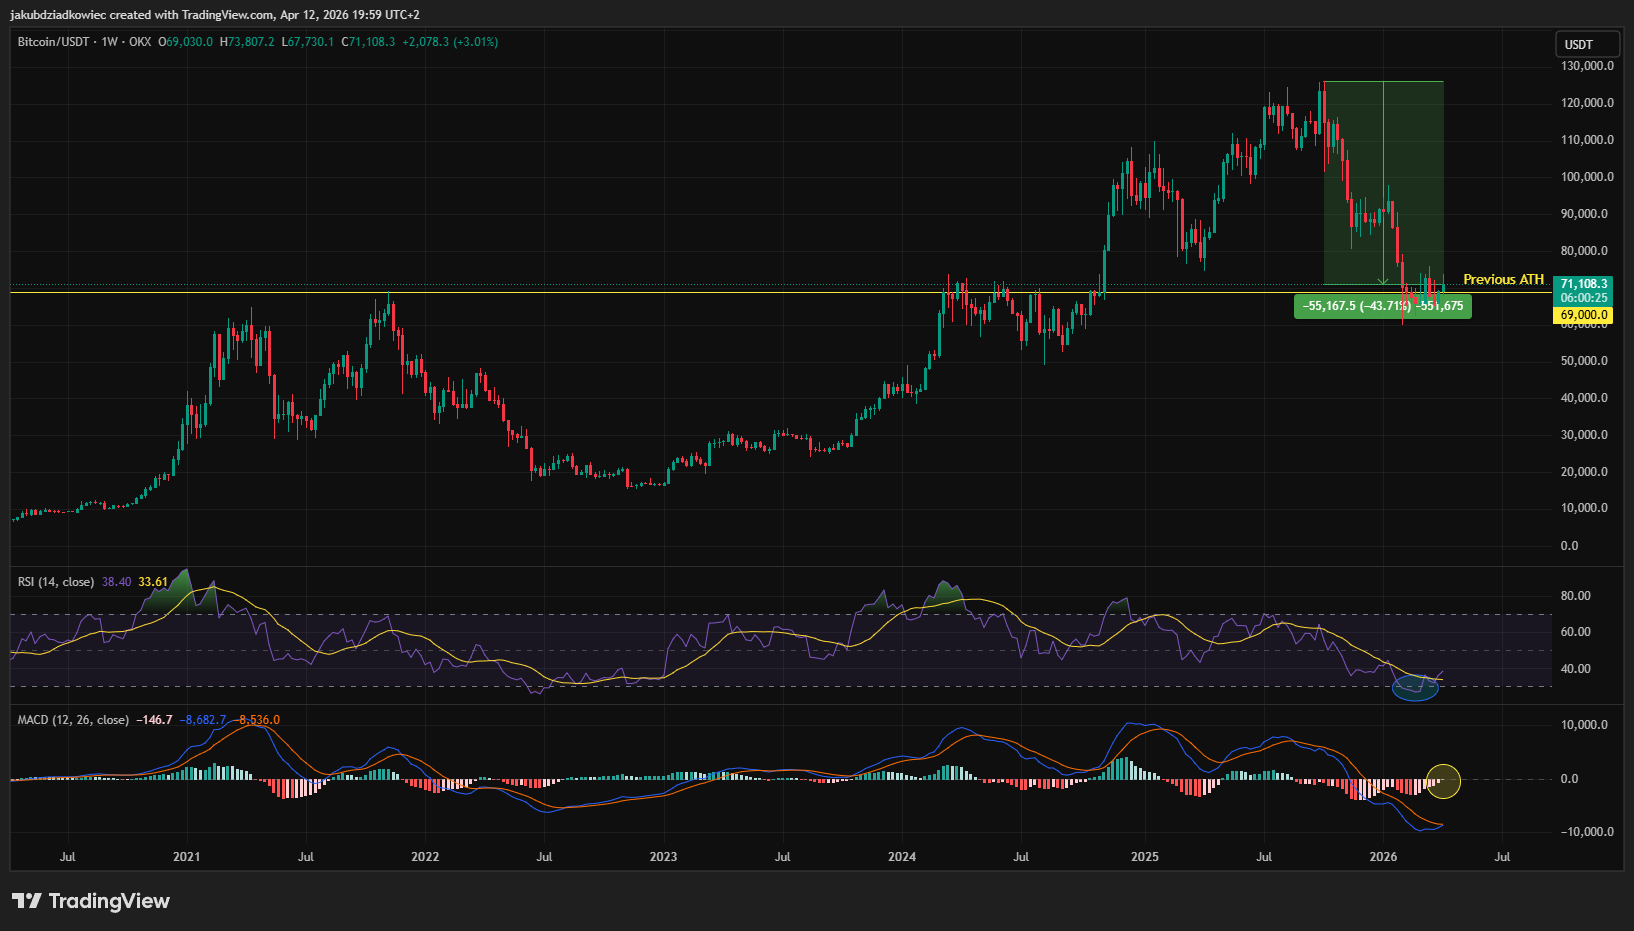
The RSI is right above the oversold territory (below 30) after visiting it for a few weeks in February 2026 (blue ellipse). Historically, the 2022 bear market saw RSI remain deeply oversold for many weeks.
The current reading is approaching those levels, which either signals further downside ahead or that a significant bounce is near. A bullish divergence — price making a lower low while RSI holds higher — would be a meaningful signal to watch.
The MACD is approaching its first bullish crossover (yellow circle) on the weekly chart since May 2025. This is a clear positive signal that has historically led to sharp rallies.
However, during the 2022 bear market, even a bullish MACD crossover failed to trigger a price rebound.
A bullish MACD crossover on the weekly chart would be a high-conviction reversal signal, but it has not yet occurred.
Broken Support, Fragile Crossovers, and a Key Demand Zone
The daily chart (January 2025 to present) provides the shorter-term picture and is where the most actionable signals currently reside.
The green-dotted box on the daily chart, at approximately $73-74,000, represents the March 2024 all-time high. It was a previously important resistance level that briefly became support, and has now been broken to the downside.
This breakdown is technically significant: price is now trading below that structural level, which has flipped into overhead resistance. The February 2026 low around $65,000 remains the key support level below current prices.
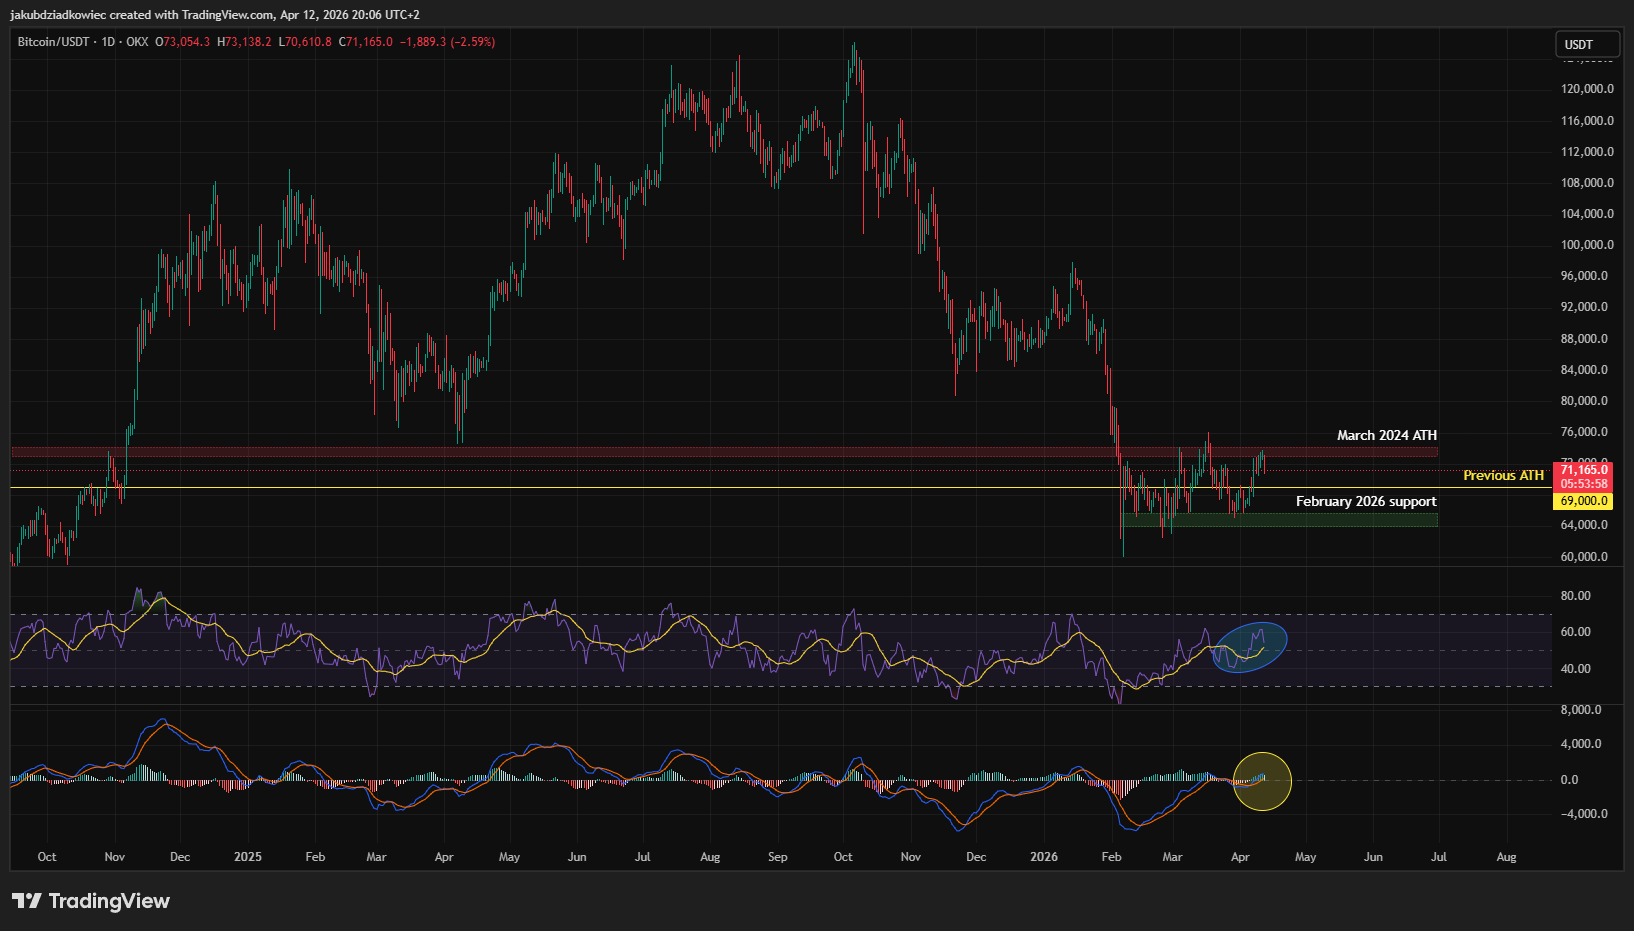
After reaching deeply oversold levels in December 2025 and again in February 2026, the daily RSI has recovered to a neutral mid-40s to low-50s range (blue ellipse).
This suggests panic selling has subsided, but bullish momentum has not yet been confirmed. A move above 60 on the daily RSI would indicate a genuine trend shift.
The daily MACD lines have crossed bullish and are hovering just above zero — a tentative positive signal (yellow circle). The histogram bars are small and mixed, reflecting consolidation rather than directional conviction.
This crossover needs to hold, and the histogram needs to expand into green territory to confirm follow-through buying.
Putting It All Together: Two Scenarios, One Line in The Sand
Combining Glassnode on-chain data with both timeframes of technical analysis yields two scenarios. The levels that confirm or invalidate each scenario are clearly defined.
Bullish Scenario: Mid-Cycle Correction, Continuation Higher
In a bullish scenario, the $69,000 level (previous cycle ATH) holds as support, short-term holders capitulate, and the market resets for a new leg higher:
- Price defends the $69,000 weekly support zone and forms a higher low on the daily chart
- Daily RSI breaks above 60, confirming bullish momentum restoration
- Daily MACD histogram expands into green territory with increasing bar size
- Price reclaims the $73-74,000 level (former support, now resistance) — this is the first key confirmation
- Price then targets the $80-84,000 cluster (True Market Mean + STH Cost Basis) — reclaiming this zone would confirm a bullish trend reversal
- On-chain: STH cost basis reclaimed would mean short-term holders return to profit, removing a key source of selling pressure
Bearish scenario — deeper correction, structural breakdown
In a bearish scenariu overhead supply from underwater short-term holders is too heavy, the $69,000 support fails, and Bitcoin seeks deeper value:
- Price breaks below $69,000 on a weekly close. This is the primary bearish confirmation signal
- Weekly RSI drops below 30 and stays there, mirroring 2022 bear market conditions
- Daily MACD bullish crossover fails, and lines roll back below zero
- Next downside target: $65,000 (February 2026 demand zone) — a break here accelerates selling
- Deeper target: $54,000 (realized price). Historically the zone where bear markets find their ultimate floor
- On-chain: price approaching realized price would represent maximum fear, and historically, the highest-probability long-term entry zone
Overall Assessment: $69,000 is the Line in the Sand
The weight of evidence currently leans cautiously bearish on the short-term but constructive on the medium-to-long term. Bitcoin is in a historically recognized stress zone — below the STH cost basis and the True Market Mean, but well above the realized price floor.
The weekly RSI is approaching oversold territory, and the daily MACD is poised for a bullish crossover, suggesting the worst of the selling may be near, but confirmation has not yet arrived.
The $69,000 level is the line in the sand: hold it, and the bull case builds; lose it on a weekly close, and significantly lower prices become the base case.
The post The Hidden On-Chain Signal That Shows Bitcoin Is Closer to a Bottom Than Most Think appeared first on BeInCrypto.
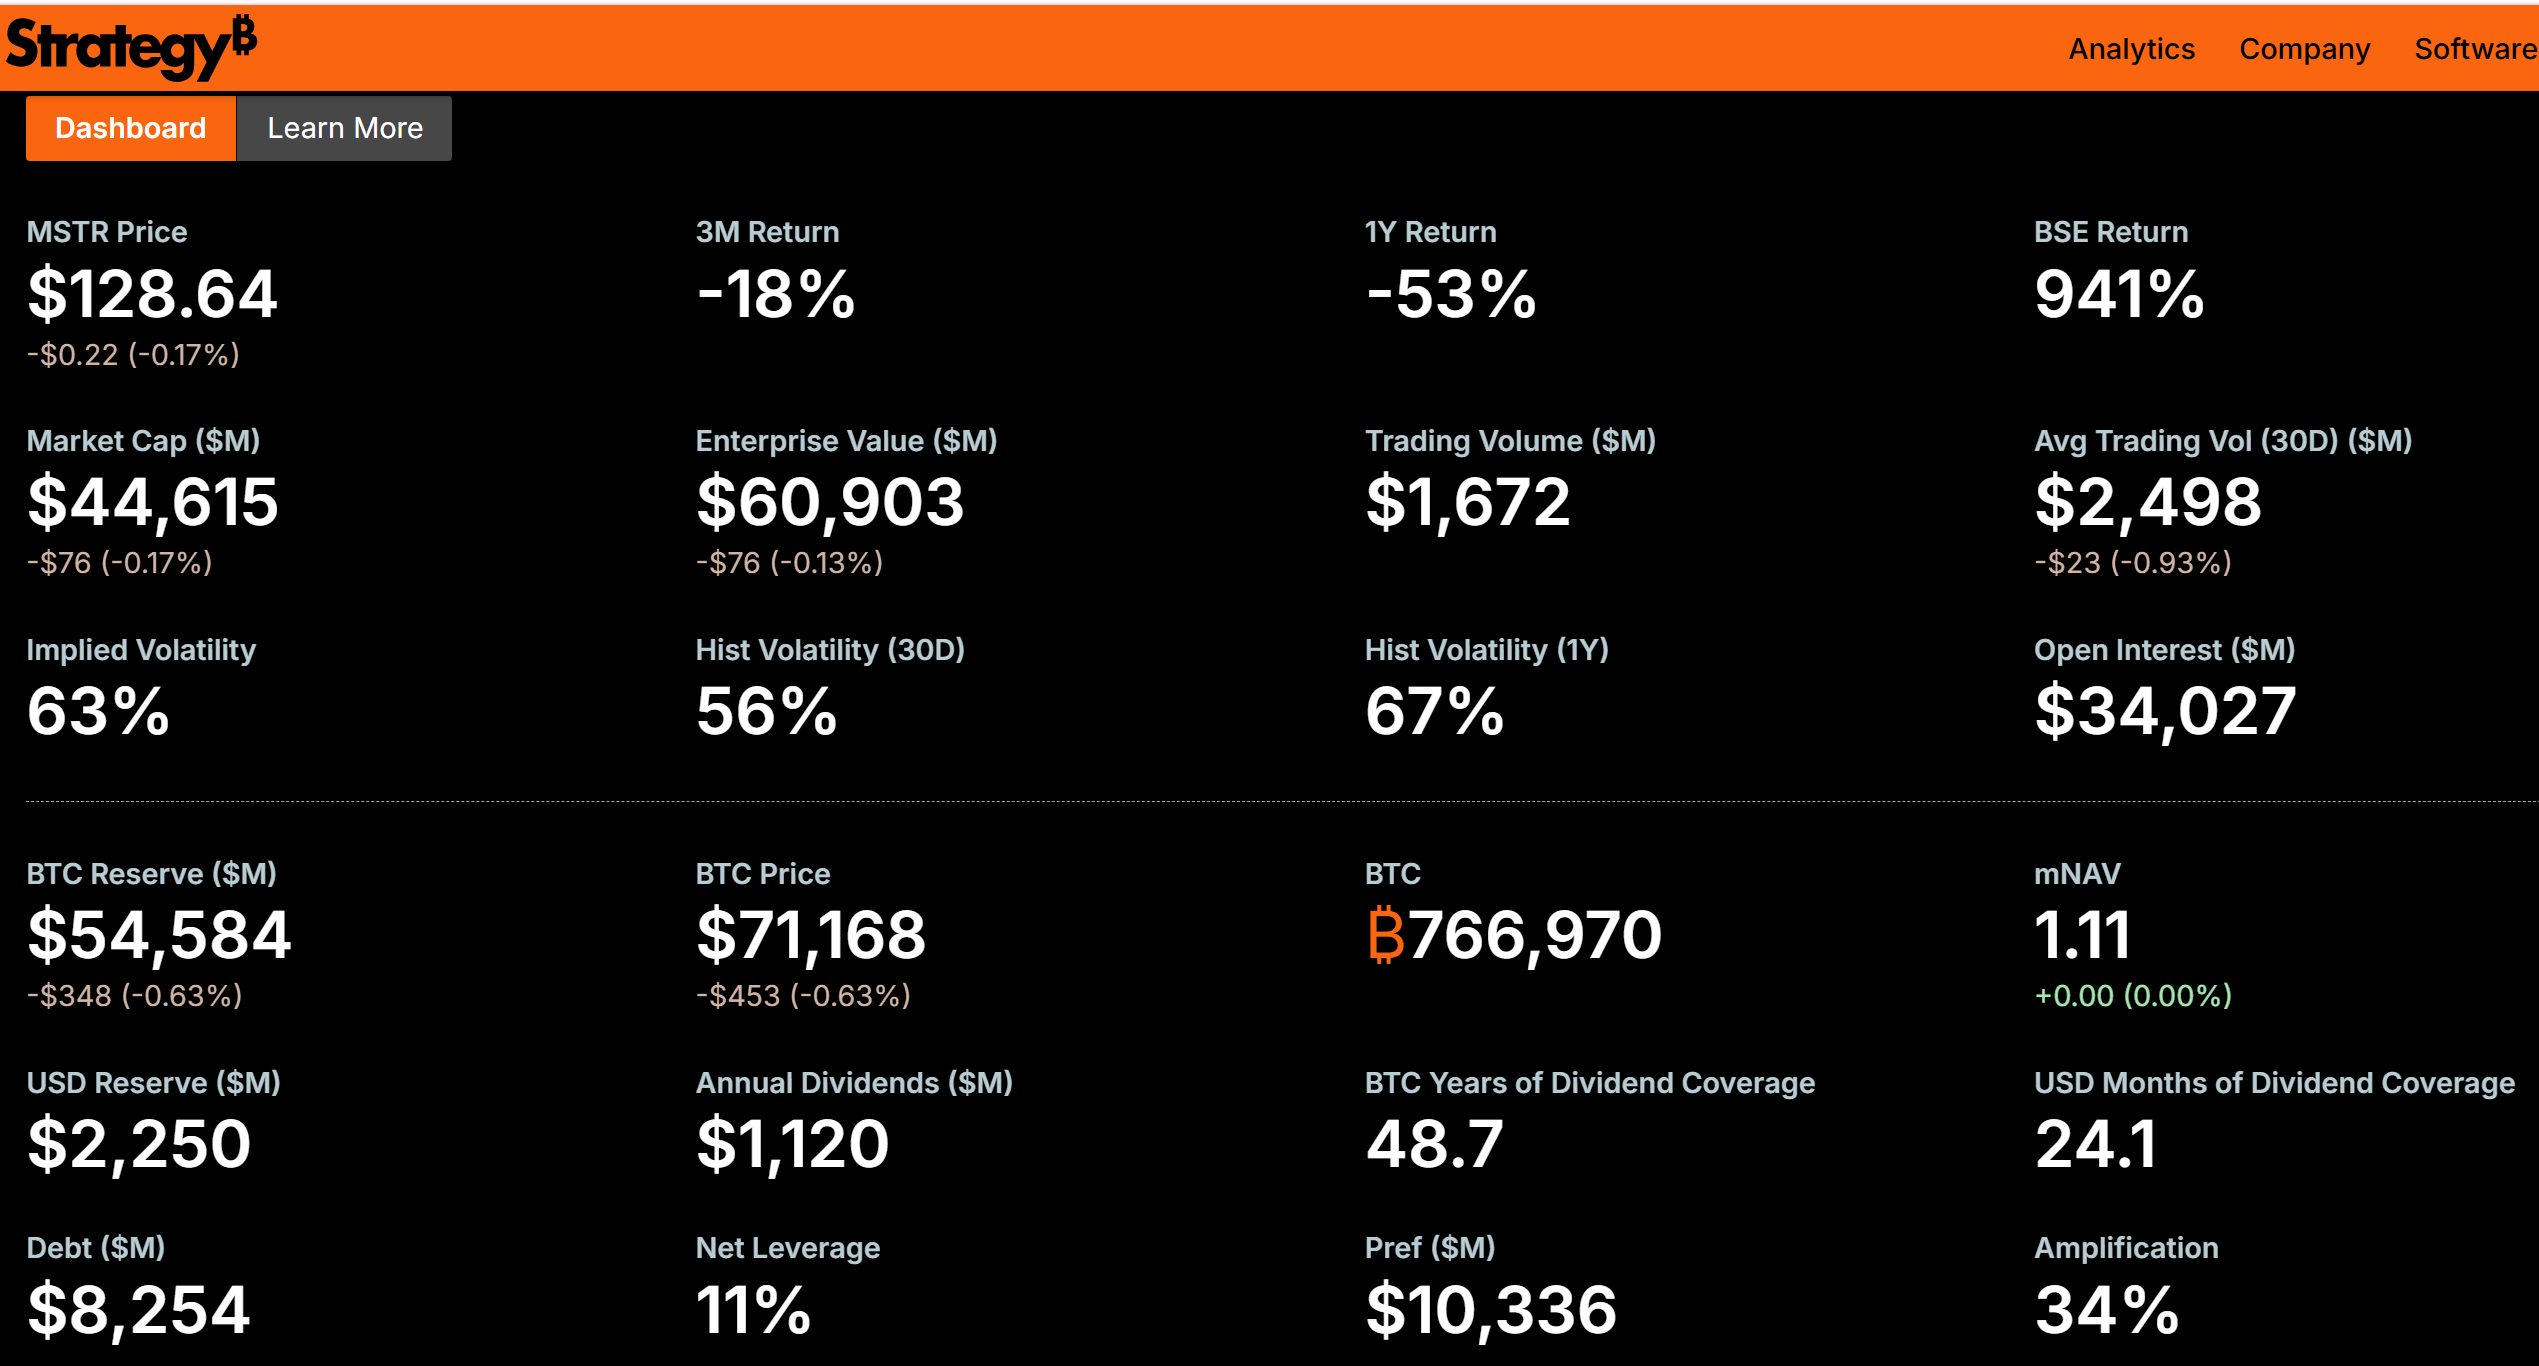
MicroStrategy revealed that its Bitcoin (BTC) holdings need just 2.05% annual growth to cover all preferred stock dividends indefinitely, without issuing new common shares.
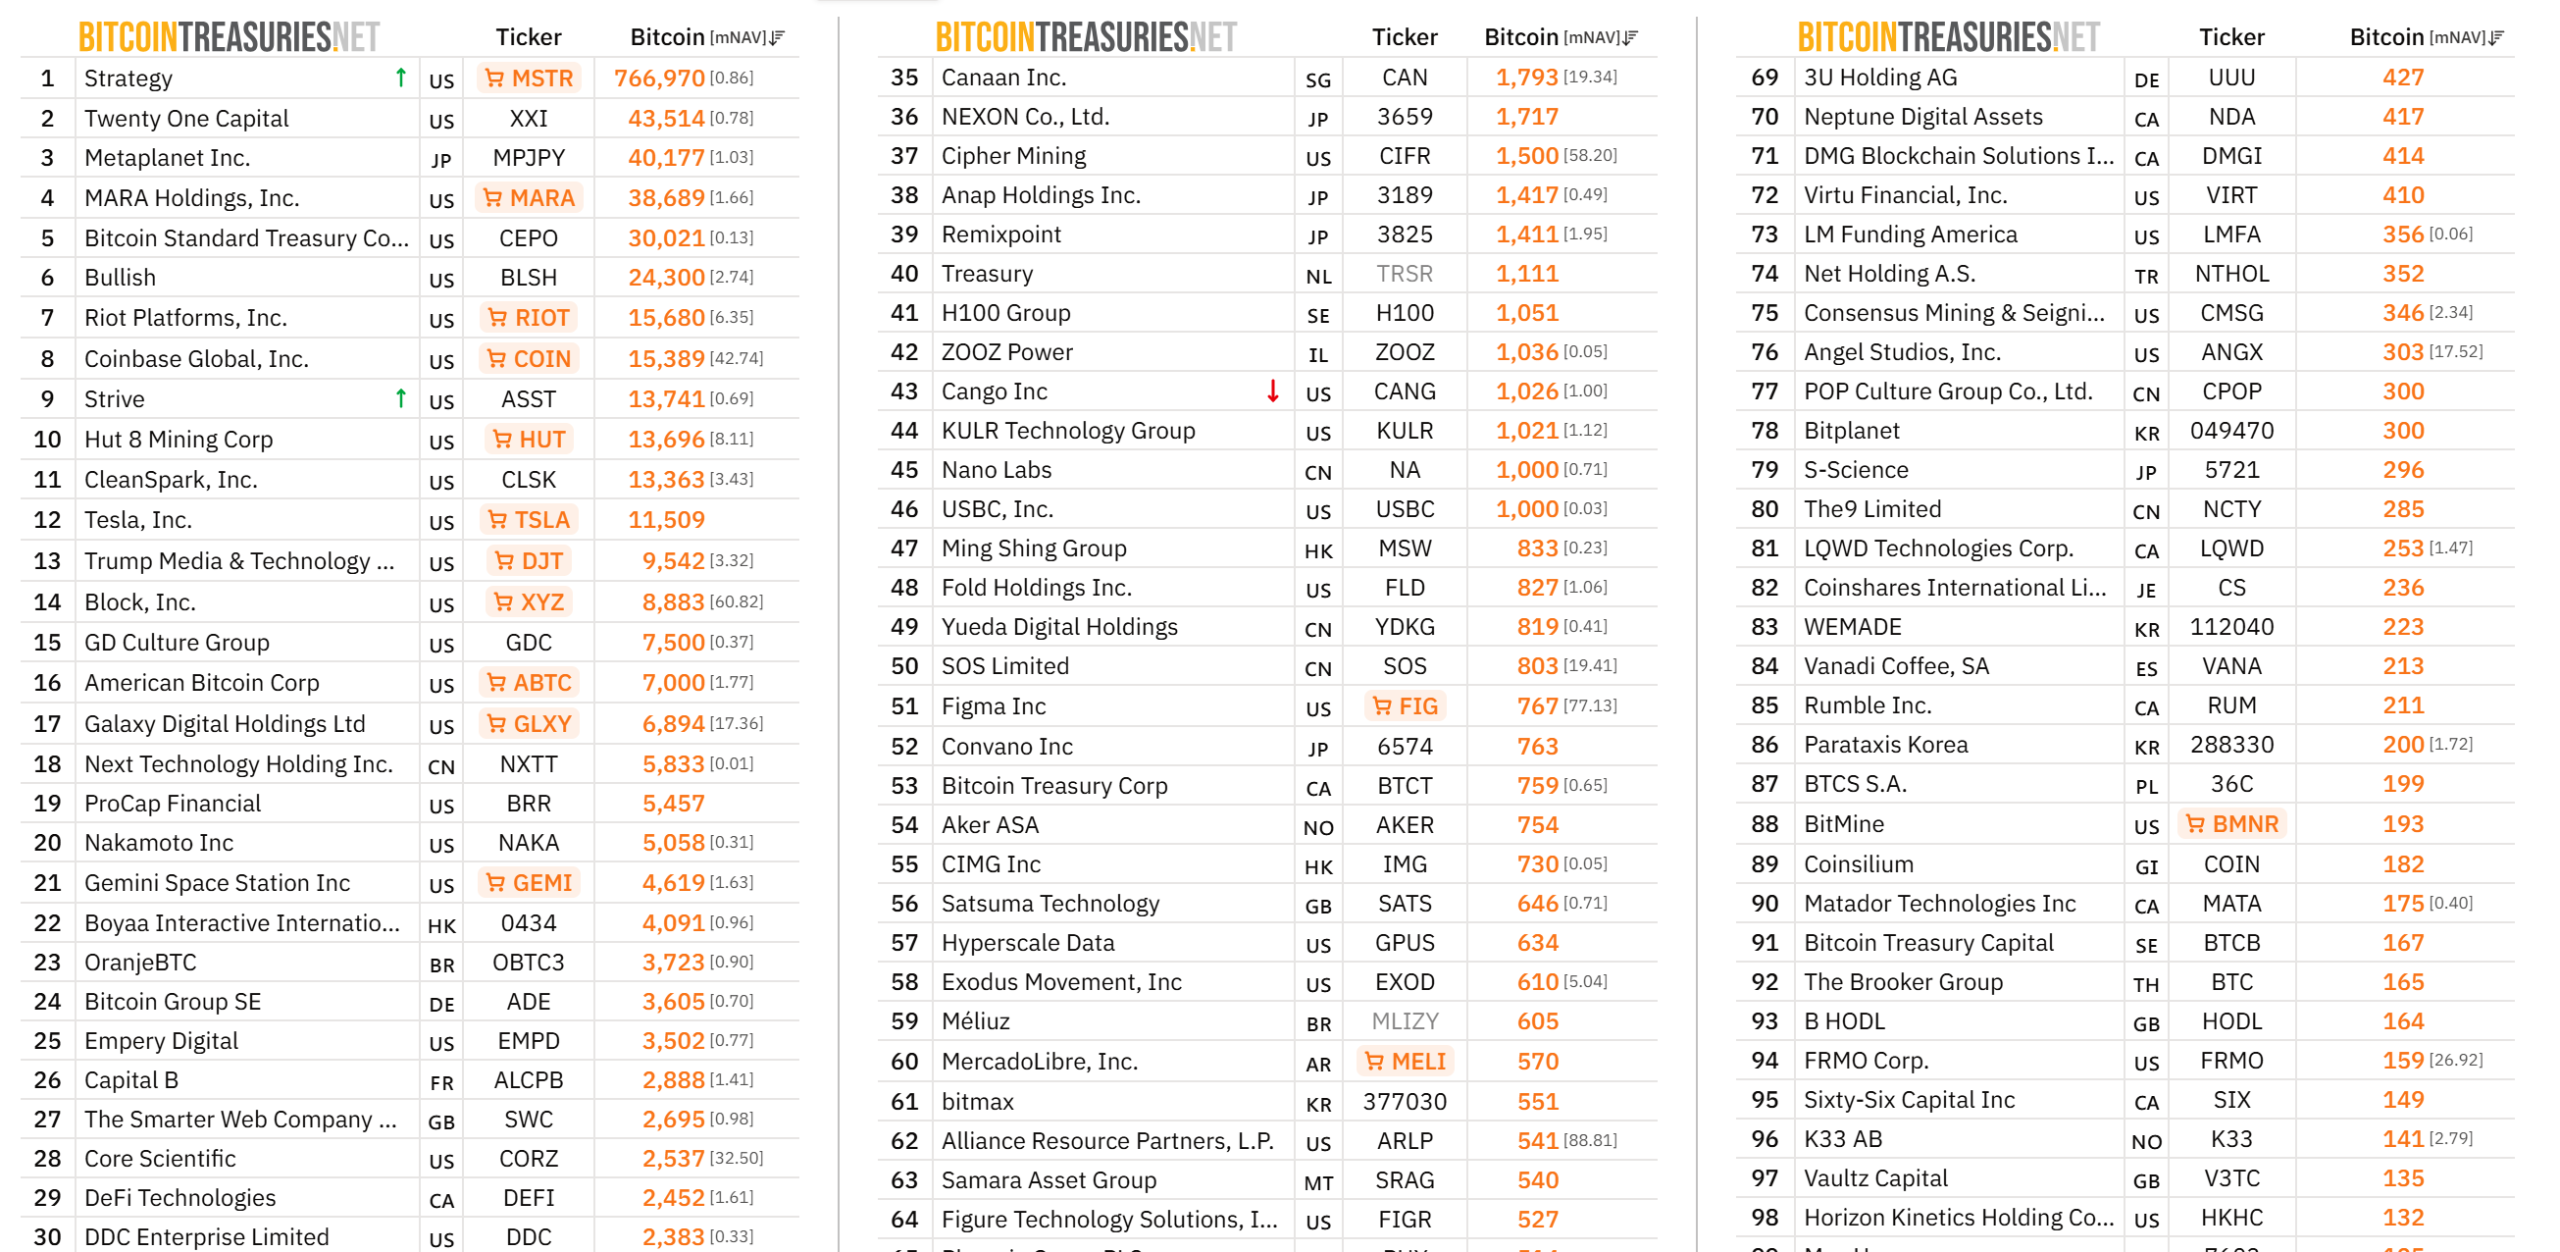
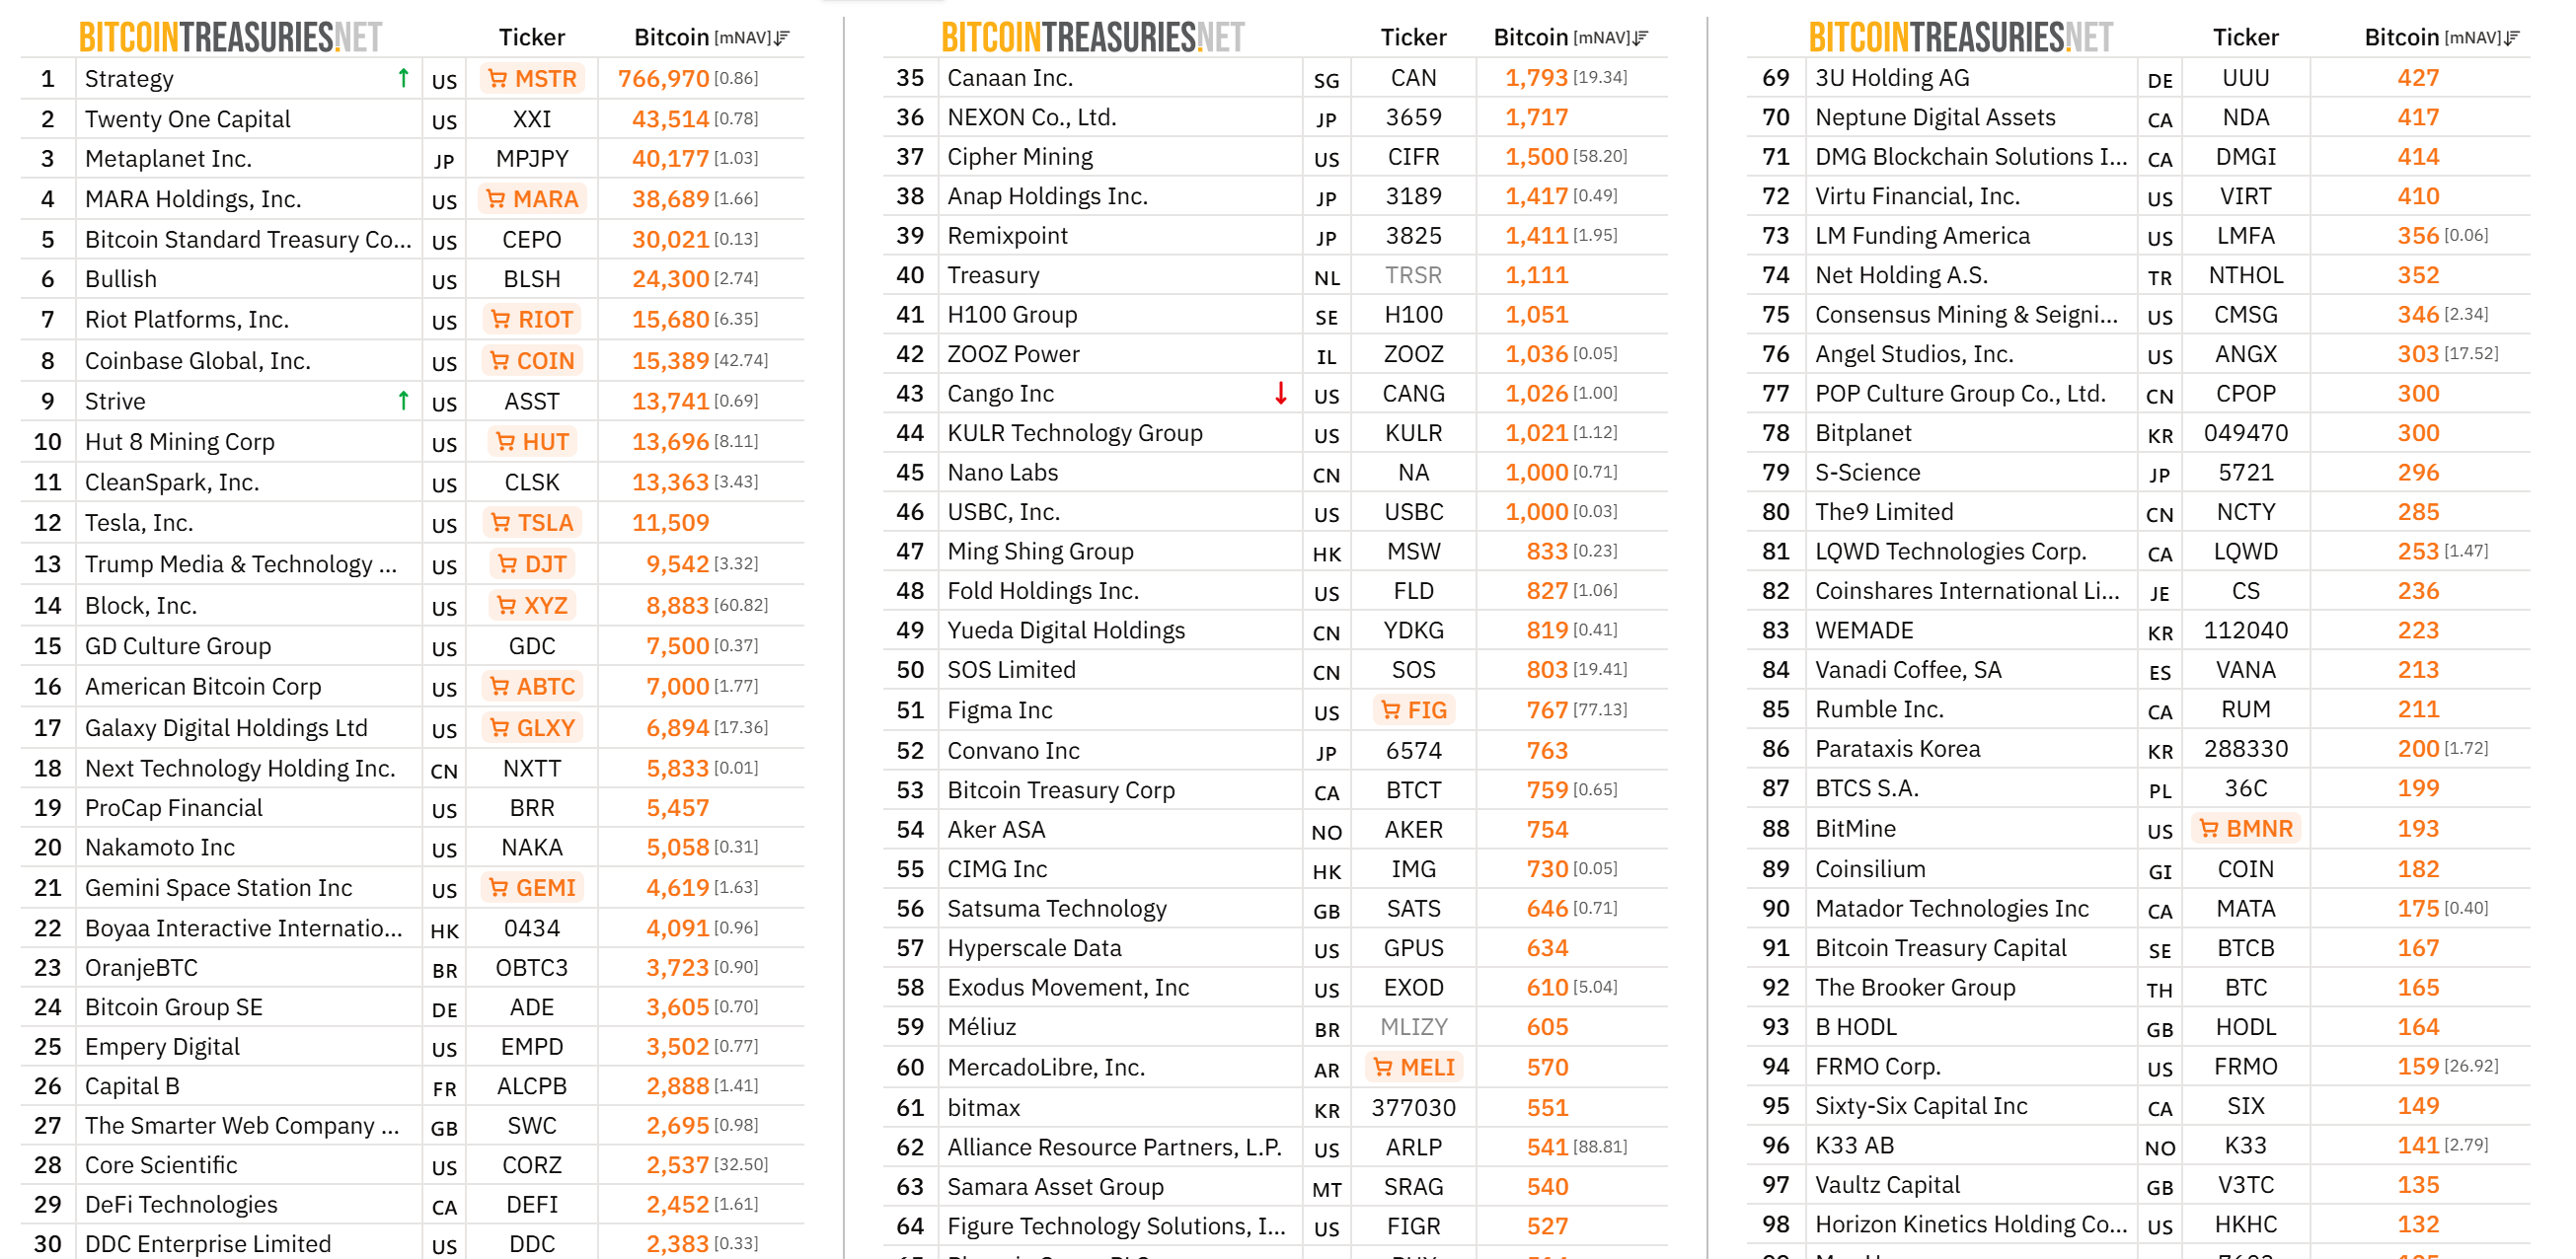
Chairman Michael Saylor shared the metric in a post, alongside a chart showing the firm’s 766,970 BTC reserve valued near $58 billion.
How 2% BTC Growth Funds Billions in Dividends
MicroStrategy’s BTC Breakeven Annual Rate of Return measures the minimum bitcoin appreciation needed to service dividend payments on its preferred stock, including STRC.
“Our BTC Breakeven ARR is ~2.05%. If Bitcoin grows faster than that over time, we can cover our dividends indefinitely without issuing new $MSTR shares,” wrote Saylor.
At 2.05%, that threshold sits far below Bitcoin’s historical annualized returns.
The company’s dashboard shows roughly 48.7 years of dividend coverage at current reserve levels. Strategy holds 766,970 BTC acquired at an average price of $75,648 per coin, with total holdings valued near $54.58 billion.

STRC, Strategy’s Variable Rate Series A Perpetual Preferred Stock, currently yields 11.5% annually.
The instrument trades near its $100 par value and pays monthly cash dividends. Proceeds from STRC issuances fund additional Bitcoin purchases.
Saylor posted the breakeven data alongside a separate “Think ₿igger” message featuring Strategy’s cumulative purchase chart. His Sunday posts have historically preceded Monday 8-K filings disclosing new large BTC acquisitions.
The low breakeven suggests that even modest long-term Bitcoin appreciation generates enough value from MicroStrategy’s reserve to service high-yield preferred dividends while supporting continued accumulation.
The post Michael Saylor Says Just 2% Bitcoin Growth Covers MicroStrategy’s Dividends Forever appeared first on BeInCrypto.


Saudi Arabia’s energy ministry confirmed on April 12 that it had restored full pumping capacity on its East-West pipeline, returning throughput to approximately 7 million barrels per day after attacks earlier this month cut output.
The recovery comes as US-Iran peace talks in Islamabad collapsed without an agreement, leaving energy markets facing renewed uncertainty ahead of Monday’s open.
What Happened to Saudi Oil Infrastructure
Recent attacks during the US-Iran war disrupted an estimated 600,000 barrels per day of Saudi production. The Manifa field lost approximately 300,000 bpd, and the Khurais field saw a similar reduction. Moreover, it also cut East-West pipeline throughput by 700,000 bpd.
“An official source at the Ministry of Energy stated that important energy facilities in the Kingdom have recently been subjected to multiple attacks, including oil and gas production, transportation, and refining facilities, as well as petrochemical facilities and the electricity sector in Riyadh, the Eastern Province, and Yanbu Industrial City,” the officials wrote.
Follow us on X to get the latest news as it happens
The energy ministry stopped short of naming the attacker directly, though Riyadh has been intercepting waves of Iranian drones and missiles throughout the war. JPMorgan analysts estimated the combined damage at roughly 10% of Saudi Arabia’s pre-conflict crude exports, noting it represented a “measurable supply shock.”
In a recent update, the energy ministry said the East–West pipeline and Manifa output have been restored. However, work on the Khurais field is still underway and will be announced upon completion.
“Ministry of Energy announced the success of operational and technical efforts in restoring the full pumping capacity through the East–West pipeline, amounting to approximately seven million barrels per day, and recovering the affected volumes from the Manifa field production of around 300,000 barrels per day, all within a short period of time,” the press release read. “With regard to the Khurais field, work is still ongoing to restore full production capacity, and this will be announced upon completion.”
The ministry added that Aramco’s rapid restoration demonstrated its “high operational resilience and crisis management efficiency.”
US Iran Failed Talks Add Pressure to Monday’s Open
The pipeline fix landed hours after Vice President JD Vance confirmed that 21 hours of negotiations with Iran in Islamabad produced no deal. The two sides are still divided on key issues, including the Strait of Hormuz and Iran’s nuclear program.
The strait normally carries approximately 20% of global seaborne oil. The International Energy Agency has called the disruption the largest supply shock in the history of the global oil market.
Oil prices have surged since the conflict began in late February. The conflict has also rattled food, aluminum, and liquefied natural gas markets.
Saudi Arabia’s partial recovery helps, but it cannot replace the full volume lost from the Hormuz disruption. Monday’s market opening will test whether the pipeline restoration can offset the diplomatic failure in Islamabad.
Subscribe to our YouTube channel to watch leaders and journalists provide expert insights
The post Saudi Arabia Restores Major Oil Pipeline After Recent Attacks, Will Prices Drop? appeared first on BeInCrypto.

Justin Sun, the founder of the Tron ecosystem, has publicly criticized World Liberty Financial (WLFI), a decentralized finance project co-founded by Donald Trump’s sons, over what he describes as opaque and rushed governance processes tied to WLFI’s governance token lock-up. Sun, who says he invested “significant capital” in WLFI as an early backer, pointed to a March governance proposal that would determine how long token holders must stake their voting power, arguing that the move was not conducted with transparency.
“The governance votes cited to justify the above actions were not conducted through fair or transparent procedures. Key information was withheld from voters, meaningful participation was restricted, and outcomes were predetermined.”
In a Sunday post on X, Sun criticized the process and argued that it failed to deliver fair governance for the WLFI community. World Liberty Financial (WLFI) countered by accusing Sun of playing the victim and making baseless claims, saying it would pursue legal action if necessary to defend its position.
The dispute comes as WLFI faces broader community pushback and scrutiny after confirming that its own governance tokens were used as loan collateral. The move coincided with a rapid decline in WLFI’s token price and renewed attention on Trump-linked crypto ventures amid concerns about governance, transparency, and risk management.
Cointelegraph reached out to World Liberty Financial for comment but did not receive a response by publication time.
Related: World Liberty signals phased WLFI unlock vote after early holder backlash
Key takeaways
- Governance under scrutiny: A March WLFI proposal to set token lock-up periods drew questions after more than 76% of voting tokens were found to originate from 10 wallets, raising transparency concerns about how governance outcomes are determined.
- Token as collateral, price pressure: WLFI disclosed that its token was used as collateral on Dolomite, a DeFi platform, to borrow stablecoins, a move that contributed to the token’s decline to an all-time low near $0.07 and heightened scrutiny of token-backed lending practices.
- Anchor role and ecosystem dynamics: WLFI described itself as an anchor borrower and lender within its own ecosystem, a stance that critics say could create incentive misalignment between token holders and platform governance.
- Public confrontation and risk of legal action: Sun’s criticism hinges on governance transparency, while WLFI has denied the allegations and signaled potential legal action against Sun to defend its position.
- Broader implications for governance in Trump-linked crypto ventures: The episode adds to ongoing debates about governance fairness, disclosure, and risk in projects tied to prominent political figures.
Sun’s critique highlights governance transparency questions
Sun’s public critique centers on a March WLFI governance proposal that intended to set the parameters for lock-up durations of WLFI’s voting tokens. He argues that the voting process did not meet basic standards of transparency or fairness. In his post on X, Sun asserted that the votes cited to justify the action were made under conditions where critical information was withheld, voter participation was constrained, and outcomes appeared predetermined before ballots were cast.
The concern, as Sun framed it, is not merely a procedural quibble but a signal about the broader governance integrity of WLFI. If true, such practices could undermine investor confidence, especially in a project intertwined with high-profile political figures and rapid token-driven voting mechanics. The episode dovetails with prior discussions in the ecosystem about how token-based governance should operate when decision rights directly affect token holders and the value of the treasury or collateral pools.
WLFI’s response to Sun’s comments, however, framed the dispute as a political attack rather than a governance critique. The project’s team described Sun’s allegations as an attempt to deflect attention from his own conduct and declined to engage on the specifics beyond asserting their stance. The exchange underscores a broader risk: when governance is tied to popular personalities or high-visibility founders, accountability mechanisms must be transparent, verifiable, and resilient to reputational cycles that can influence investor behavior.
Token-backed lending, collateral use, and market reaction
The controversy intensified after WLFI confirmed that it used WLFI tokens as collateral in DeFi lending arrangements to generate yields for the platform and its holders. Dolomite, the DeFi protocol involved, has been associated with WLFI’s operational team, including its chief technology officer, Corey Caplan. The arrangement, described by WLFI as part of its broader lending and earning strategy, contributed to a sharp sell-off as market participants weighed the implications of token-backed collateral in a mixed risk environment.
The practical consequence for investors was immediate: the WLFI token slid to an all-time low, with prices hovering around $0.07 at one point amid concerns about token-backed loans and the stability of the underlying collateral framework. The dynamic illustrates a broader tension in crypto markets where token utility and collateralizing power can influence both liquidity and price discipline, particularly when governance overlays are perceived as opaque or compromised.
WLFI has positioned itself as a major supplier and borrower within its own ecosystem, suggesting that its token serves multiple roles — including providing yield, enabling liquidity, and supporting the platform’s financial equilibrium. Critics caution that such centrality could create conflicts of interest between governance priorities and the financial incentives of the token’s largest holders.
The episode also fuels broader public and media scrutiny around Trump-linked crypto ventures, reinforcing existing debates about regulatory exposure and the alignment of incentives in politically connected blockchain projects. While supporters argue that these projects push innovation and capital formation, detractors warn of misaligned incentives, potential conflicts of interest, and governance fragility in high-profile launches.
Cointelegraph has documented prior coverage of WLFI and related backlash, including discussions about token unlocks and investor backlash from early holders. Readers can explore those pieces for context on how community sentiment has evolved as governance-related decisions intersect with market dynamics.
What this means for investors and builders
From an investment perspective, the WLFI episode underscores the importance of governance transparency, robust disclosure, and clear stake-lock mechanisms that are not easily gamed by coordinated groups of token holders. For builders and protocols, the incident highlights the need for open auditability of governance proposal sources, independent verification of vote origins, and explicit, auditable procedures for how voting outcomes are determined. In a field where leverage and collateral practices can directly affect token value, ensuring that governance can withstand scrutiny is essential to sustaining long-term trust.
For observers tracking Trump-linked crypto ventures, the WLFI case adds a concrete data point about governance fragility and reputational risk. It suggests that while political association can attract attention and capital, it also places a premium on transparent governance practices and risk controls that stand up to public debate.
Looking ahead, market watchers will want to monitor whether WLFI clarifies its governance process, offers third-party verification of token-holder participation, and demonstrates that its use of token-backed collateral adheres to transparent risk management standards. The trajectory of WLFI’s token price will likely reflect not only the platform’s technical decisions but the perceived legitimacy of its governance framework and the broader willingness of the market to engage with politically connected crypto projects.
Readers should watch for any formal governance updates, new disclosures from WLFI, and potential regulatory statements that might address governance and collateral practices in tokenized ecosystems. The next moves will reveal whether WLFI can restore trust and stabilize its token, or if the episode marks a turning point in how investors evaluate governance risk in high-profile crypto ventures.
In the near term, the key question remains: will WLFI provide verifiable transparency around its governance voting and token-locked mechanisms, or will the controversy linger as a systemic cautionary tale about governance complexity in tokenized finance?
TLDR:
- SUI broke above the $0.89–$0.90 consolidation range on the one-hour chart, signaling a bullish trend shift.
- Price pulled back to the $0.91–$0.905 demand zone, where analysts expect buyers to defend key support.
- Wyckoff accumulation patterns and bullish order blocks on the weekly chart point to targets of $10–$20.
- SUI’s market cap stabilized above $3.6B after spiking to $3.85B, reflecting long-term holder conviction.
SUI price prediction is flashing signals that seasoned traders rarely ignore. A textbook breakout above a weeks-long consolidation range, a controlled pullback into fresh demand, and a weekly chart carrying the fingerprints of prior 1,000% rallies, the setup is building quietly but deliberately.
Whether the next move targets $0.97 or something far more ambitious, the chart is making its case without apology.
SUI Breaks Out, Pulls Back, and Sets Up a Second Shot
SUI flashed a textbook breakout on the one-hour chart this week, clearing the $0.89–$0.90 consolidation range that had capped price for an extended period. The move was sharp and deliberate.
Bullish candles stacked above prior resistance, volume followed, and the chart shifted from a downtrend structure to a clear bullish bias in a matter of hours.
The rally did not hold its highs. SUI pulled back toward the $0.91–$0.905 area shortly after, a move that initially spooked short-term traders. However, analysts tracking the asset noted the correction lacked the hallmarks of a genuine reversal.
No heavy sell volume. No breakdown of structure. Just a measured retreat into what is now a recognized demand zone, where previous resistance has flipped into support.
That flip is the crux of the current setup. Traders are now watching for bullish confirmation at the $0.91–$0.905 zone before positioning for another push toward the $0.96–$0.97 resistance band.
Until that confirmation arrives, the market remains in a wait-and-see posture at a level that could determine SUI’s next directional move.
Weekly Structure Points to Targets Far Beyond Current Levels
Step back to the weekly chart and the short-term noise gives way to a much larger technical picture. SUI has printed this pattern before.
In mid-2024 and again in mid-2025, the price dipped toward a key trendline support, gathered liquidity at those lows, and then staged parabolic advances.
Those rallies registered gains north of 500% and, in one instance, crossed 1,000% within a matter of months. Analysts point out that SUI is currently sitting at a structurally similar position.
Bullish order blocks are visible at the current support zone, consistent with what Wyckoff analysis describes as smart money accumulation — a phase where institutional-level buying absorbs retail selling before a major directional move develops.
Resistance between $3 and $5 is flagged as a potential speed bump on any extended advance. Even though historical precedent suggests momentum tends to build rather than stall once that band is cleared.
Market cap data from the past seven days adds a layer of confirmation to the broader thesis. SUI’s market cap spiked toward $3.85 billion on April 7 before pulling back and stabilizing above $3.6 billion through several corrective sessions.
The base is holding. Long-term participants appear to be absorbing the dips rather than exiting, a dynamic that analysts say keeps the structural case for $10–$20 price targets firmly on the table.
Adam Back, the Blockstream CEO named by the New York Times as the most likely candidate behind Satoshi Nakamoto, may have had a more practical reason for cooperating with the investigation.
Several industry figures now suggest Back used the global media attention as free publicity for Bitcoin Standard Treasury Company (BSTR), his Bitcoin (BTC) treasury firm approaching a public listing.
Did Adam Back Use NYT Satoshi Story as Free BSTR Publicity?
John Carreyrou, the investigative reporter behind the explosive expose revealed that Back agreed to pose for a NYT photographer in Miami weeks before the story ran.
“If you’re IPO’ing a company — it’s pretty damn good PR. Particularly when the cost is roughly zero,” commented ETF analyst James Seyffart.
The timing matters because BSTR is completing a SPAC merger with Cantor Equity Partners I. The deal includes a $1.5 billion PIPE, the largest ever announced for a Bitcoin treasury vehicle.
BSTR plans to launch with over 30,000 BTC on its balance sheet, which would catapult its ranks among the largest public Bitcoin treasury.
The merger was originally expected to close in Q1 2026, subject to SEC review and shareholder approval.
Whether Back intended the headlines or simply welcomed them, the Satoshi spotlight landed at the most commercially convenient moment possible.
The post Free PR or Confession? Expert Thinks Adam Back Played the NYT Like a Prospectus appeared first on BeInCrypto.
Canelo Alvarez offered fast track to another potential world title shot

Sunday Reboot: MacBook Neo upgrades, masses of Mac minis, and iPhone re-entry

XRP JIM RICKARDS DROPS XRP NUKE !!!!!


-

 Business7 days ago
Three Gulf funds agree to back Paramount’s $81 billion takeover of Warner, WSJ reports
-

 Politics2 days ago
US brings back mandatory military draft registration
-

 Fashion2 days ago
Weekend Open Thread: Veronica Beard
-

 Tech5 days ago
How Long Can You Drive With Expired Registration? What Florida Law Says
-

 Politics6 hours ago
World Cup exit makes Italy enter crisis mode
-
 Sports2 days ago
Man United discover Nico Schlotterbeck transfer fee as defender reaches Dortmund agreement
-

 Fashion6 days ago
Massimo Dutti Offers Inspiration for Your Summer Mood Board
-

 Crypto World3 days ago
Canary Capital Files SEC Registration for PEPE ETF
-

 Fashion5 days ago
Let’s Discuss: DEI in 2026
-

 Business2 days ago
Tesla Model Y Tops China Auto Sales in March 2026 With 39,827 Registrations, Beating Cheaper EVs and Gas Cars
-

 Crypto World4 days ago
Bitcoin recovers as US and Iran Agree a Ceasefire Deal
-

 Politics3 days ago
Malcolm In The Middle OG Turned Down ‘Buckets Of Money’ To Appear In Reboot
-

 Business2 days ago
OpenAI Halts Stargate UK Data Centre Project Over Energy Costs and Copyright Row
-

 Business1 day ago
Ireland Fuel Protests Enter Day 5 as Blockades Spark Shortages and Government Prepares Support Package
-

 Tech7 days ago
Italian court says Netflix must refund customers up to $576 over price hikes
-

 Tech7 days ago
Haier is betting big that your next TV purchase will be one of these
-

 Tech6 days ago
Gamer Restores the Original PlayStation Portal From Two Decades Ago
-

 Tech7 days ago
The Xiaomi 17 Ultra has some impressive add-ons that make snapping photos really fun
-

 Tech7 days ago
Samsung just gave up on its own Messages app
-

 Politics3 days ago
LBC Presenter Mocks Trump Over Iran War Failures
You must be logged in to post a comment Login