

Crypto World
BeInCrypto Institutional Research: 15 Firms Setting the Standard for Crypto Corporate Governance


Best Crypto Corporate Governance is a category within the BeInCrypto Institutional 100, covering firms whose public-market discipline, banking charters, board structure, audit maturity, and crisis-response record set governance standards for digital assets.
This category sits under Pillar 5: Regulation & Governance. The 15 firms below are listed alphabetically and are not ranked. A shortlist will be named in May 2026, with the winner announced at Proof of Talk in Paris on June 2–3, 2026.
Key Facts
- Long list: 15 firms across public crypto companies, federal crypto banks, regulated custody firms, TradFi banks, and digital asset infrastructure providers
- Order: Listed alphabetically, not ranked
- Initial pool: More than 30 firms screened; 15 advanced to the long list
- Scoring: 20% quantitative data · 80% Expert Council
- Criteria assessed: Public-market discipline, banking charter strength, board independence, audit maturity, incident response, disclosure quality, leadership credibility
- Data sources: OCC, SEC EDGAR, NYDFS, FCA, FINMA, BaFin, MAS, MiCA-CASP registers, audited reports, company disclosures, PitchBook, Tracxn, and Crunchbase
| Firm | Governance Sub-Segment | HQ | Reach | Top Listing / Charter | Representative Work |
|---|---|---|---|---|---|
| Anchorage Digital | Federally chartered crypto bank | SF / NY / Sioux Falls / Singapore / Porto | $4.2B valuation Backed by a16z, GIC, Goldman Sachs, KKR, Visa, Tether |
OCC national trust bank charter since Jan 2021 Longest-tenured federally chartered crypto bank |
Subject to ongoing OCC examination Resolved 2022 OCC AML consent order after remediation |
| BitGo | Public and federally chartered custody | Sioux Falls / Palo Alto | $104B+ AUC $2.08B valuation at IPO |
NYSE: BTGO since Jan 22, 2026 OCC final national trust bank charter |
NYSE IPO raised $212.8M in Jan 2026 First publicly traded federally chartered digital asset infrastructure company |
| Block | Long-tenured public fintech | San Francisco, USA | Cash App and Square ecosystem 57M Cash App monthly actives in Q4 2025 |
NYSE: XYZ, formerly SQ Public since Nov 2015 |
Decade-plus public-company governance record Spiral continues Bitcoin core development support |
| BNY | Global bank with crypto custody surface | New York, USA | $55.8T total AUC/A Founded in 1784 as the oldest US bank |
NYSE: BK OCC-regulated bank |
Co-custodian on Morgan Stanley Bitcoin Trust Live BTC and ETH custody operational since 2022 |
| Bullish | Public institutional exchange | George Town, Cayman Islands | Institutional spot and derivatives trading platform Public-market exchange governance |
NYSE: BLSH Listed via SPAC merger in Aug 2025 |
NYSE listing brought public-market governance to the venue Led by Tom Farley, former NYSE President |
| Circle Internet Group | Public stablecoin issuer | Boston / NYC, USA | USDC $73B market cap Monthly Deloitte reserve attestations |
NYSE: CRCL since Jun 2025 OCC conditional national trust bank charter |
First publicly traded stablecoin issuer OCC conditional charter granted Dec 12, 2025 |
| Coinbase | Public crypto-native company | Wilmington / SF, USA | S&P 500 inclusion in 2024 Full SOX compliance; Deloitte auditor |
NASDAQ: COIN since Apr 2021 First US-listed crypto-native firm |
SEC enforcement action dismissed in Feb 2025 Board includes Marc Andreessen, Fred Wilson, Tobias Lütke, and Gokul Rajaram |
| Fidelity Digital Assets, NA | Asset-manager operated federal trust | Boston, USA | Backed by Fidelity’s $15T+ AUA platform Custody for FBTC and FETH ETFs |
OCC conditional national trust bank charter Approved Dec 12, 2025 |
FDAS LLC converting from NY state trust to federal trust bank Inherits Fidelity’s institutional governance framework |
| Galaxy Digital | Public multi-product crypto investment firm | New York / Delaware | Trading, asset management, investment banking, and mining US public-market governance framework |
NASDAQ: GLXY since May 16, 2025 Re-domiciled from Toronto to Delaware |
Completed re-domiciliation and Nasdaq uplisting in May 2025 Moved into full US-listed SOX governance regime |
| Kraken (Payward) | Multi-charter crypto bank and IPO-track firm | San Francisco, USA | Krak app reached 450K+ downloads across 130 countries Profitable with positive EBITDA per Co-CEO disclosure |
Wyoming SPDI charter OCC trust application filed May 8, 2026 |
Filed OCC national trust charter application Deutsche Börse made $200M secondary share purchase in Apr 2026 |
| Robinhood Markets | Public retail broker with crypto stack | Menlo Park, USA | 26M+ funded customers in Q1 2026 Expanded crypto licence base via Bitstamp |
NASDAQ: HOOD since Jul 2021 MiCAR-CASP operational |
Closed Bitstamp acquisition in Jun 2025 WonderFi acquisition expanded Canadian footprint in Q1 2026 |
| Securitize | SEC-regulated tokenization infrastructure | Miami, USA | $4B+ AUM in tokenized assets Partners include BlackRock, Apollo, Hamilton Lane, KKR, VanEck, BNY |
SPAC merger to NASDAQ at $1.25B valuation SEC-registered broker-dealer, ATS, transfer agent, ERA |
SPAC merger announced via Cantor Equity Partners NYSE selected Securitize for tokenized securities platform |
| Standard Chartered | TradFi global bank with digital asset stack | London, UK | $900B assets 170+ year emerging-markets bank |
LSE: STAN and HKEX: 2888 Multi-jurisdiction CIB governance |
Naveen Mallela joined as payments head in May 2026 Zodia Custody remains majority-owned via SC Ventures |
| Strategy (MicroStrategy) | Public Bitcoin treasury corporation | Tysons Corner, Virginia | World’s largest corporate BTC holder Public company since 1998 |
NASDAQ: MSTR Rebranded from MicroStrategy in Feb 2025 |
Maintains long-running public-company disclosure regime Bitcoin treasury model governed through Nasdaq filings |
| Sygnum | Swiss-licensed crypto bank | Zurich, Switzerland | 2,000+ institutional clients across 70+ countries $5B+ AUM; $1B+ post-money valuation |
FINMA banking licence since 2019 MAS CMS, Liechtenstein bank licence, ADGM |
Reached unicorn status in Jan 2025 Sygnum Connect and Sygnum Protect are live products |
About This List
The BeInCrypto Institutional 100 — Best Crypto Corporate Governance (2026 Long List) identifies firms whose governance structures support institutional confidence in digital assets. Firms are listed alphabetically by name and are not ranked at this stage.
The category covers US-listed crypto-native companies, federally chartered crypto banks, traditional financial institutions with material digital asset operations, and privately held but heavily regulated crypto infrastructure providers. Firms with material unresolved governance concerns were not advanced to the long list, regardless of operational scale.
Methodology
This category is evaluated under Track C of the BeInCrypto Institutional 100 methodology: 20% based on quantitative metrics and 80% based on Expert Council scoring.
Assessment spans seven weighted criteria: public-market discipline and SOX-equivalent disclosure, banking charter or regulatory framework strength, board composition and independence, audit and compliance maturity, response to regulatory or security incidents, transparency and disclosure quality, and leadership credibility.
A negative signal scan operates as a precondition. Firms with material unresolved governance failures are excluded from primary consideration before scoring.
Data was verified using OCC national trust bank charter records, SEC EDGAR filings, NYDFS BitLicense and Limited Purpose Trust Charter registers, FCA, FINMA, BaFin, MAS, and MiCA-CASP records, audited annual reports, firm disclosures, partnership announcements, and private-market sources, including PitchBook, Tracxn, and Crunchbase.
The post BeInCrypto Institutional Research: 15 Firms Setting the Standard for Crypto Corporate Governance appeared first on BeInCrypto.


NYLIM was the latest entrant to the list of asset management giants making moves in tokenization, teaming up with Centrifuge (CFG) to bring one of its high-yield corporate bond strategies onchain.
For NYLIM, tokenization is less about launching blockchain versions of existing funds than improving how portfolios are assembled.
Sy said customized investment strategies often combine ETFs, bonds, private credit and other assets, creating operational complexity that makes personalization difficult to scale.
“The end goal is to embed the customization within the asset itself, rather than the customization sitting around the operations around the different assets,” he said.
Tokenization could also streamline transfer agency, settlement and other back-office processes, reducing costs that ultimately benefit investors.
“If you can bring that down by 10% or 20%, that’s a better outcome for our clients,” Sy said.
DeFi awaits
Sy said stablecoins have become the first practical bridge bringing traditional financial institutions onchain.
The stablecoin market has grown to over $300 billion, and its increasingly used for cross-brder payments
As banks, payment firms and fintech companies adopt stablecoins for cross-border payments and treasury management, many will eventually look for institutional-grade tokenized assets where those balances can earn yield instead of remaining in cash.
“Stablecoins were probably one of the biggest unlocks in the past two years,” Sy said. “Adopting stablecoins was the gateway to get them onchain.”
Crypto exchange Kraken has begun accepting select tokenized stocks and exchange-traded funds (ETFs) as collateral for futures and margin trading, allowing eligible users to open leveraged positions without selling their holdings.
The feature initially supports 10 tokenized stocks and ETFs, including Apple, Nvidia, Tesla, Strategy, the SPDR S&P 500 ETF and Invesco QQQ Trust. Eligible users can post those holdings as collateral without selling them first.
Each eligible asset is assigned a collateral haircut that reduces its lending value based on risk. Broad-market ETFs receive the lowest haircut at 10%, while more volatile stocks such as Strategy and Robinhood are discounted by 30%.
Kraken also imposed collateral limits on each asset, with broad-market ETFs capped at up to $1 million in collateral value, most individual stocks at $250,000 and tokenized gold and Circle shares at $100,000. The exchange said both collateral limits and haircuts will be reviewed periodically and remain subject to change.
The feature is available only to eligible clients outside the United States. The exchange said tokenized stocks can be used as collateral for futures trading in the European Economic Area, while margin collateral support is available in other eligible jurisdictions outside the bloc.
Related: STS Digital launches structured crypto platform with Kraken as first partner
The launch comes about a week after Kraken partnered with Maple to launch an onchain warehouse financing facility for institutional crypto lending, allowing the exchange to expand its lending business through blockchain-based structured credit.
Tokenized assets gain broader financial utility
Kraken’s move adds to a series of efforts aimed at expanding the role of tokenized real-world assets in financial markets. Recent launches have focused on using blockchain-based securities as collateral, settlement assets and components of institutional lending infrastructure.
In February, Franklin Templeton and Binance launched a program allowing institutions to use tokenized money market fund shares as trading collateral while the underlying assets remained in regulated off-exchange custody. BlackRock’s tokenized US Treasury fund, BUIDL, is also accepted as trading collateral on Binance, as well as Crypto.com and Deribit.
Earlier this week, Tradeweb executed what it said was the first real-time purchase and sale of a tokenized US Treasury settled against tokenized cash on the Canton Network.
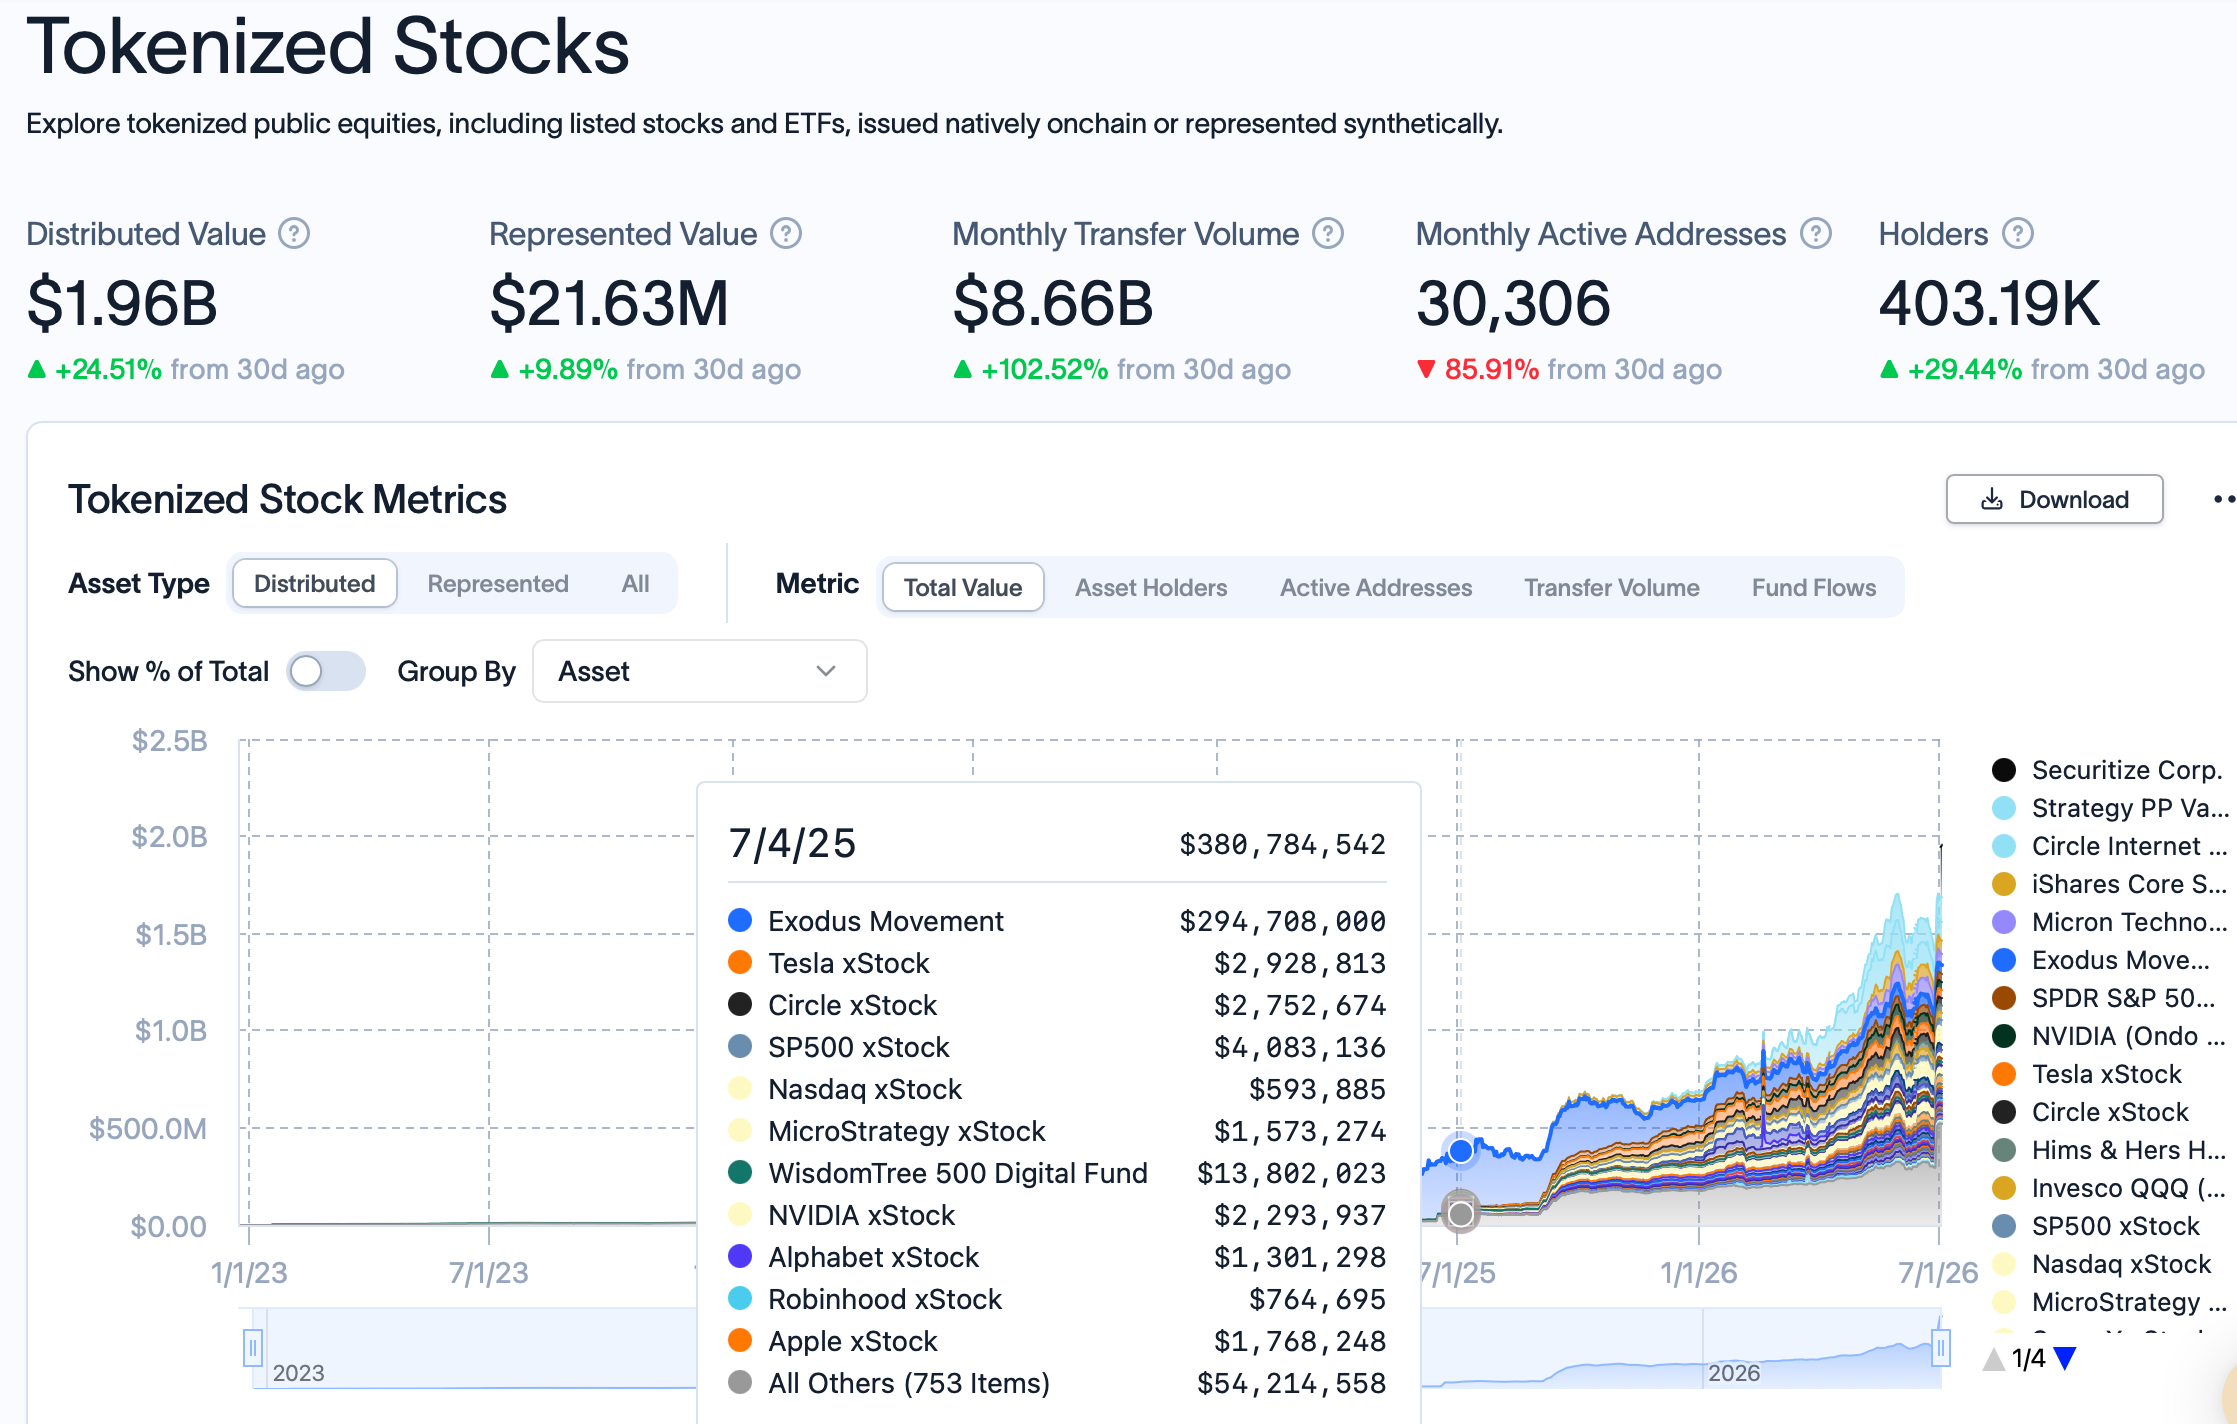
According to RWA.xyz, tokenized real-world assets have grown to roughly $32.6 billion in distributed value, while tokenized stocks have climbed to about $2 billion from roughly $381 million a year earlier.
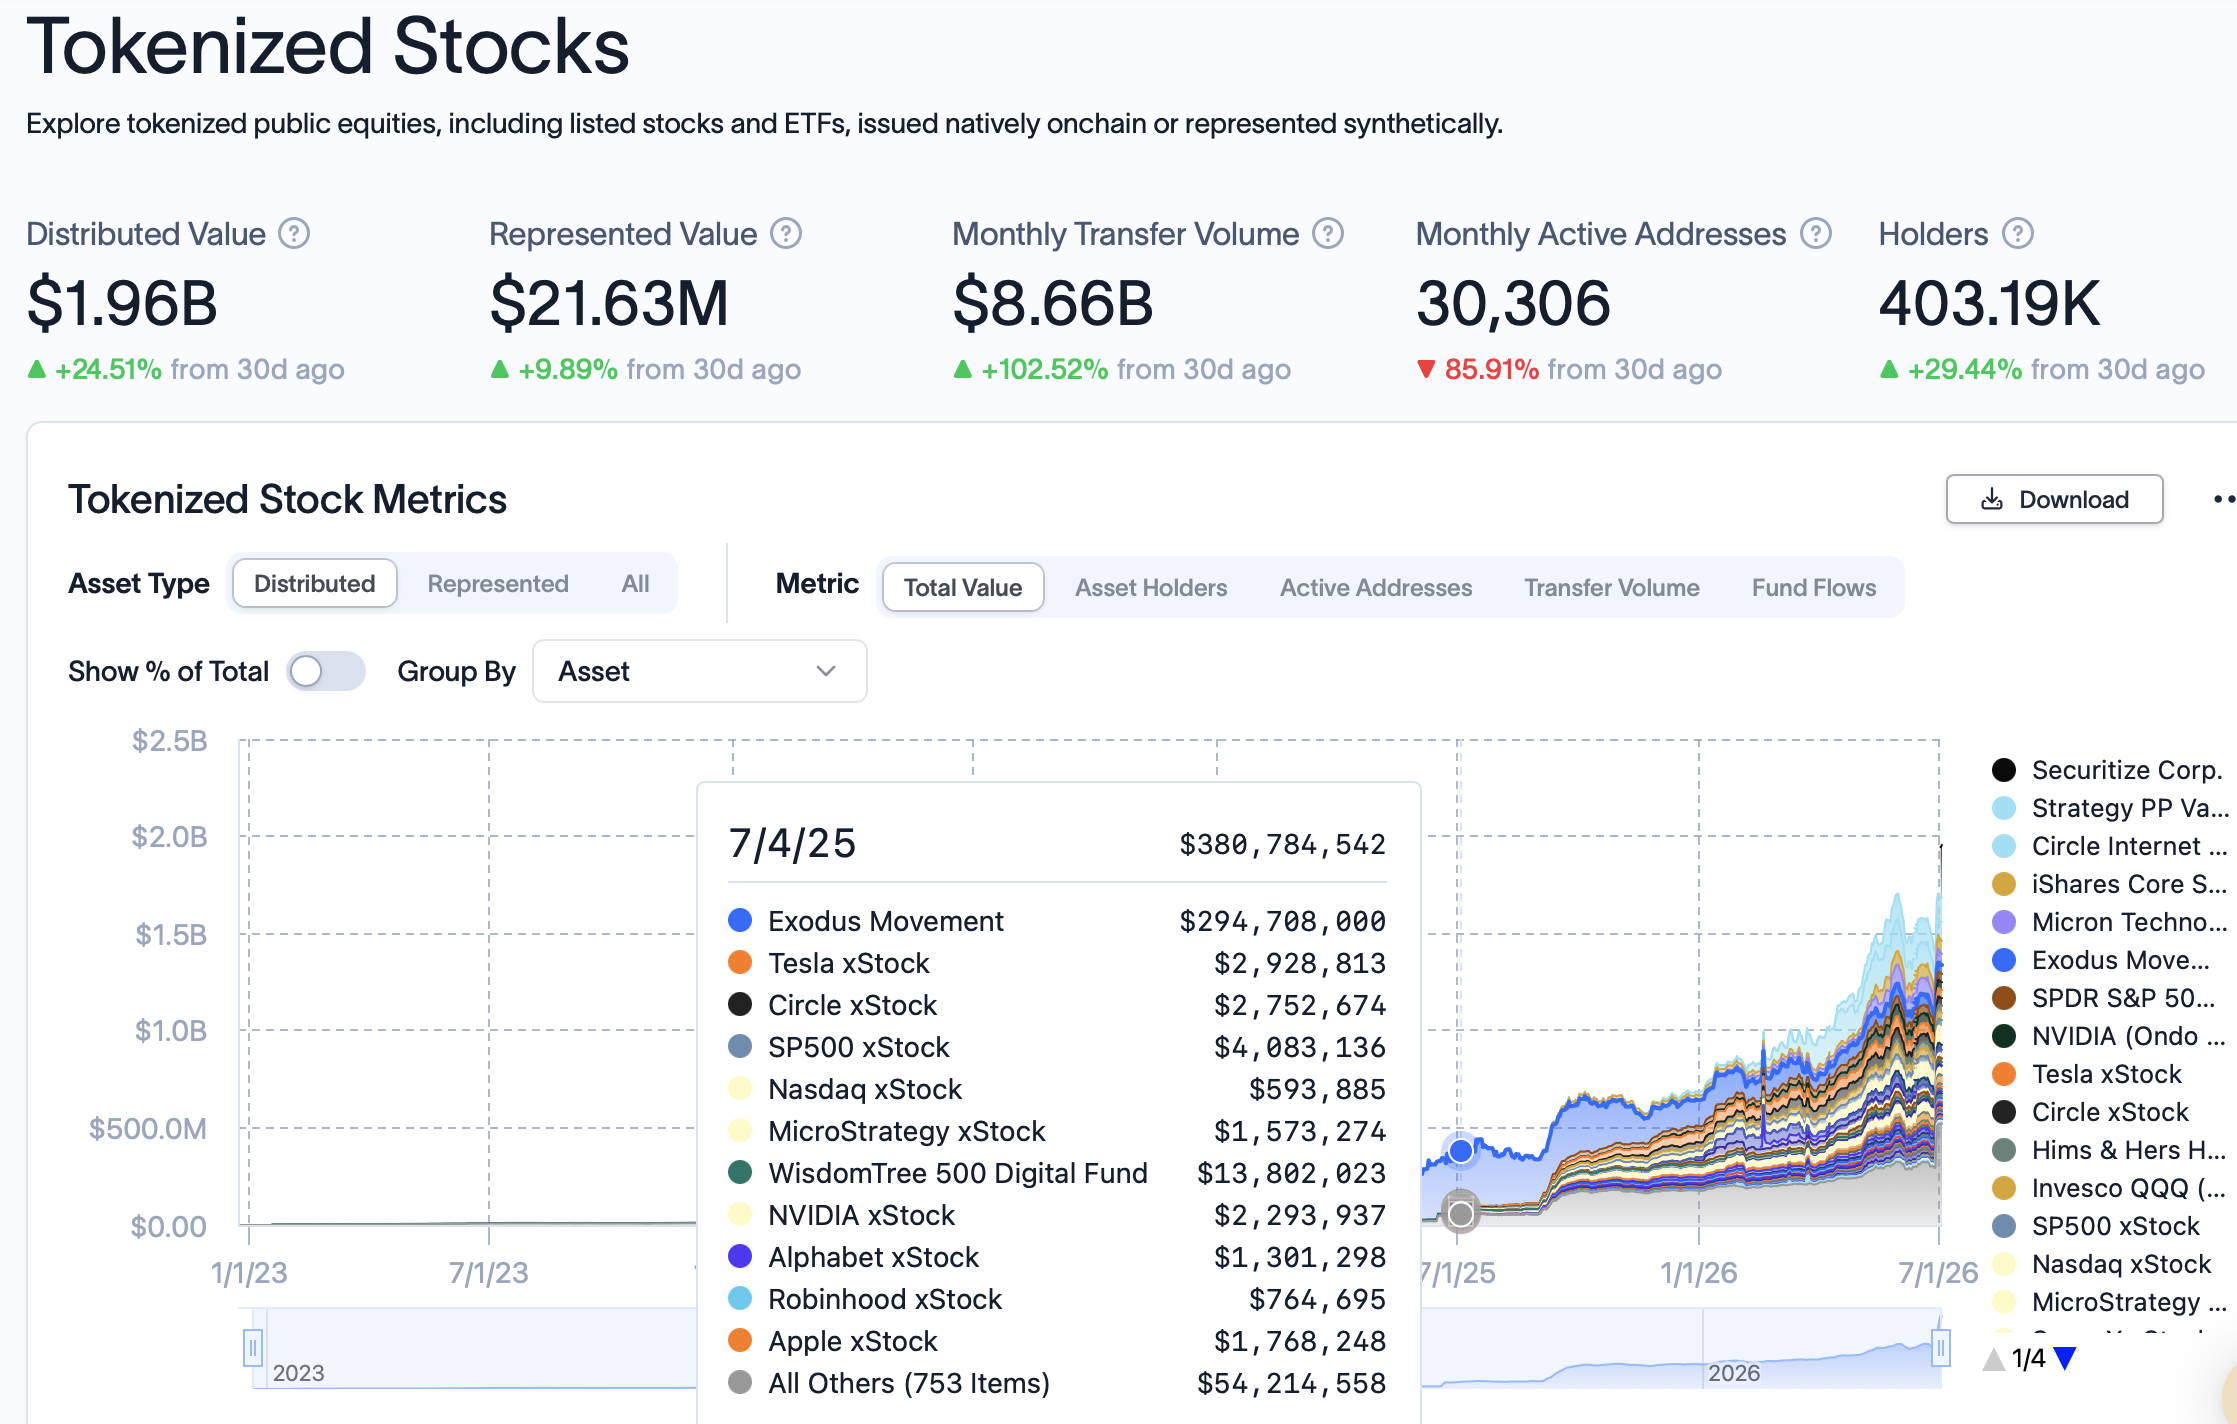
Source: RWA.xyz
Magazine: Japanese pension fund tips 1% in crypto, G7 urges action on NK hackers: Asia Express
The last trading day of the previous business week finally brought some more net inflows rather than consistent outflows for the spot Bitcoin ETFs in the United States.
The products tracking the world’s largest altcoin had even more to celebrate at the end of the week, but still closed in the red.
The Good and the Bad: BTC ETF Edition
There’s no need to sugarcoat the end result – the week was still dominated by the bears. Investors pulling out funds from the spot Bitcoin ETFs withdrew $526.64 million throughout the four-day trading week. This means that the overall negative streak continues as the products have not seen a single green week in almost two months.
Within this timeframe, the total cumulative flows have dumped from $59.34 billion to $51.08 billion. July 1 saw the most daily withdrawals, with $294.62 million leaving the funds, according to SoSoValue data. Another $222.64 million went out on June 30 and $231.10 million on June 29. That’s all on the negative side.
The bright side was July 2. After 10 consecutive days of only net inflows, the streak was broken as investors poured in $221.72 million. Moreover, this was the highest single-day inflow recorded since May 5. Friday was a non-trading day due to the July 4 holiday, meaning that the week ended on a more positive note.

Ethereum ETF Edition
The daily performance of the financial vehicles tracking ETH was even more promising. The Ethereum ETFs saw more modest $30.04 million withdrawals on June 29 and $27.60 million on June 30. However, the tides turned during the next two business days.
Investors poured in $14.89 million on Wednesday and $29.08 million on Thursday, marking a near-monthly high. Nevertheless, the week still ended in the red, with total net outflows of $13.67 million. As such, the negative streak of the Ethereum ETFs continues, with eight straight weeks in the red. The total cumulative flows are down from $12.09 billion in early May to $10.89 billion on Thursday.
On the more positive side, though, it was a lot less harmful than the $273.34 million taken out during the previous business week.
The post Bitcoin ETF Recap: Another Tough Week Despite a Few Bright Spots appeared first on CryptoPotato.


June delivered the worst month in the history of United States spot Bitcoin ETFs, with more than $4 billion pulled and 2026 flows turning negative for the first time. Over the same 2 weeks, the largest wallets on the network absorbed 270,000 BTC. One of these cohorts is going to be wrong, and the last 3 cycles say which one it usually is.
Summary
- U.S. spot Bitcoin ETFs saw record June outflows, with more than $4 billion leaving as institutional risk appetite weakened.
- Whale wallets accumulated about 270,000 BTC worth $16.7 billion during the same period, signaling strong on-chain buying.
- The split suggests Bitcoin’s next move depends on whether ETF flows recover or macro pressure forces another leg lower.
Two things happened in the Bitcoin market in the second half of June, and they cannot both be right.
The first happened in brokerage accounts. United States spot Bitcoin ETFs bled $4.06 billion in June, the worst calendar month since the products launched in January 2024, surpassing the previous record of $3.56 billion set in February 2025.
Depending on where the cutoff lands, some counts put the figure closer to $4.5 billion. The bleeding was not a single bad week: it followed a record 13-day outflow streak from mid-May that had already drained $4.37 billion, and by month-end the funds were net negative for 2026 as a whole, the first time cumulative yearly flows have gone red since the ETFs existed. The largest fund did most of the draining, shedding roughly $3.55 billion on its own.
The second happened on-chain. Over the final 2 weeks of that same stretch, wallets classified as whales accumulated more than 270,000 BTC, roughly $16.7 billion at prevailing prices, according to Bitfinex analysts. The buying happened while the spot premium, a gauge of how aggressively United States buyers are bidding, stayed negative, meaning the demand was not coming from American spot desks. Glassnode’s cohort data confirmed the shift from a second angle: long-term holders flipped back to net accumulation across wallet sizes at the start of July, even as the ETF prints stayed red.
$4 billion walked out one door while $16 billion walked in another. That is not noise. That is the two most-watched capital cohorts in this market taking opposite sides of the same trade at the same prices, and the resolution of that disagreement is the Bitcoin story for the rest of the year.
The month that broke the ETF narrative
The scale of June’s institutional retreat deserves its own accounting, because the spot ETFs were supposed to be the structural bid that made this cycle different.
The pitch, repeated across 2 years of allocator decks, was that regulated wrappers would convert Bitcoin from a sentiment asset into an allocation, with sticky advisory money arriving in measured percentages and staying through drawdowns the way it stays in equity funds.
For most of 2024 and 2025, the pitch held: inflows compounded, the products swallowed multiples of new mined supply, and every dip met a wrapper-shaped bid. June was the first month that tested the sticky part of the story at scale, and the answer was unambiguous. Faced with a real macro shock, the allocation behaved exactly like every other risk allocation in the book, which is to say it left, on schedule, through the most liquid exit, without ceremony.
Price told the top-line story: Bitcoin fell from around $74,000 to near $58,000 across the month, touched 21-month lows, and closed a week below its 200-week moving average for the first time since 2023, a line that has historically marked deep cycle lows and long accumulation zones. Sentiment followed price into the basement, with the Fear and Greed Index pinned between 11 and 15, deep in extreme fear, through the back half of the month. Retail’s search behavior matched the mood: queries for Bitcoin going to 0 hit record highs earlier this year, and broader crypto search interest has only recently begun recovering from 1-year lows.
The flow mechanics beneath the price were the real damage. As crypto.news reported when the record was confirmed, the Coinbase Premium stayed negative through June, apparent demand stayed deeply negative, and ETF redemptions became the dominant driver of daily price action, averaging out to roughly $180 million to $200 million in net selling per trading day. When the products finally printed a green day on July 2, a $221 million inflow that ended a 10-day losing streak, the breadth told its own story: One fund took in $166 million while the largest fund was still bleeding $40 million on the day flows supposedly turned.
Three forces stacked up to produce the exodus. Macro did the heavy lifting: May inflation printed a hot 4.2%, the Federal Reserve spent June sounding restrictive, and institutional risk mandates de-allocate mechanically when real-rate expectations rise, without any view on Bitcoin specifically. Regulatory whiplash added a second layer, with the market structure fight in the Senate stalling and starting through the month, leaving custody and licensing frameworks unresolved for exactly the institutions the ETFs serve. And a third force was more mundane: competition for risk capital.
The SpaceX listing raised $75 billion in the middle of the drawdown, the largest liquidity event in market history, and some of the money that would otherwise have sat in crypto risk simply had somewhere more exciting to be, a dynamic that carried straight into the tokenized trading frenzy around the stock.
Whatever the weights on those three, the conclusion the flows describe is uniform: the marginal institutional holder of wrapped Bitcoin spent June getting out.
Inside the machine that sold
The phrase ETF outflows compresses a mechanical process worth uncompressing, because the mechanics explain why the selling was so relentless and why it can reverse just as mechanically.
Spot Bitcoin ETFs do not hold sentiment; they hold coins against shares. When holders sell more shares than buyers absorb, authorized participants redeem the excess, the fund sheds Bitcoin, and the coins hit the market as programmatic supply. Through June, that redemption machine ran nearly every session, and the composition mattered as much as the total.
The largest fund was the epicenter, accounting for roughly $3.55 billion of the month’s bleed on its own, which reads less as 1,000 small investors leaving and more as a handful of very large allocators de-risking through the deepest door available. Smaller funds bled proportionally less, and when the streak finally broke on July 2, the breadth stayed poor: the $221 million net inflow decomposed into one rival fund absorbing $166 million while the flagship still lost $40 million.
A genuine flow regime change looks like several consecutive green days across the complex, led by the largest fund; one day of one fund catching a falling knife does not qualify, and desks that trade these flows professionally treat anything less than 3-5 confirming sessions as noise.
The forced-seller identity question has a partial answer in the parallel stress that ran through the corporate treasury complex during the same weeks. Strategy’s preferred shares sold off hard enough that Bitwise published a note framing the episode as a late-cycle leverage unwind, with over-extended structures deleveraging while institutions positioned to replace them as the marginal buyer. Miners added their own supply, with MARA’s reported $1.5 billion Bitcoin sale putting the biggest corporate mining treasury on the sell side just as ETF redemptions peaked.
Add the SpaceX raise vacuuming $75 billion of risk appetite out of the same investor base, and June’s selling resolves into something more specific than fear: a synchronized deleveraging across every wrapped, leveraged, and mandated form of Bitcoin exposure at once, while the unwrapped form of the asset quietly changed hands underneath.
That specificity matters for what comes next. Deleveraging events are finite by construction: forced sellers run out of the thing they are forced to sell.
Sentiment-driven bear markets can grind for years, but a leverage unwind ends when the leverage is gone, and several of June’s selling engines, the redemption streak, the preferred-share stress, the miner treasury sales, have visibly decelerated into July.
The buyers who showed up anyway
Now the other side of the ledger, because it is bigger.
The 270,000 BTC that whale wallets absorbed in 2 weeks is not a normal accumulation print. It is more than the entire ETF complex sold in the month, absorbed in half the time, at prices between roughly $58,000 and $62,000. The negative spot premium during the buying window is the detail that locates the buyers: this demand was not United States spot desks and not the ETF creation mechanism. It was large holders, a category that spans exchanges, custodians, early-cycle capital, and entities that never touch a regulated wrapper, taking delivery while the wrapper crowd distributed.
Glassnode’s supply data adds the pain context that makes the accumulation more notable, not less. At the start of July, roughly 10.8 million BTC sat at an unrealized loss against 9.2 million in profit, a ratio that historically appears near capitulation zones, not near tops. Long-term holders turning to net accumulation into that kind of tape is the specific pattern that marked the depths of 2022 and the pre-ETF trough of 2023: the coins move from stressed hands to patient ones before any recovery shows up in price, and the transfer is only visible in hindsight to anyone watching price alone.
The whale cohort’s composition is admittedly opaque, and honest analysis says so. Wallets above 1,000 BTC are a crude proxy that includes exchange consolidation, custodial reshuffling, and over-the-counter settlement alongside genuine conviction buying. But the 2-week scale, the direction, and the corroboration from long-term holder metrics make the benign explanations hard to stretch across the whole print. Someone with size decided that sub-$60,000 Bitcoin was a purchase, at the exact moment the most regulated distribution channel in the asset’s history was running in reverse.
There is also a rotation story inside the accumulation. The buying coincided with capital moving toward on-chain yield and infrastructure rather than away from crypto entirely: tokenized real-world assets crossed $20 billion in on-chain value, and Solana, the strongest major through the drawdown, rose about 15% since early June with tokenized asset transfers on the network up 120% to $8.53 billion, extending the performance gap that has defined the L1 race all year. The pattern suggests large investors were not abandoning the asset class. They were leaving the most liquid, most scrutinized wrapper and taking positions closer to the metal.
That rotation reframes what the ETF outflows even measure. The funds were sold to the world as the institutionalization of Bitcoin, and their flows became the market’s favorite proxy for smart money. June exposed the proxy’s limits: the wrapper tracks one specific investor type, the benchmark-constrained allocator, whose behavior is the most macro-sensitive and least conviction-driven in the entire holder base.
The actual institutional spectrum now runs from those allocators through corporate treasuries, miners, sovereign-adjacent funds, and on-chain natives, and in June those groups pointed in three different directions at once. Reading Bitcoin through ETF flows alone in this market is like reading equities through one mutual fund complex: informative, loud, and structurally incomplete.
What the divergence has meant before
Splits between institutional flows and on-chain accumulation are rare enough to have a track record, and the track record leans one way.
The clearest precedent predates the ETFs: through late 2022 and 2023, while the Grayscale trust traded at a discount that made institutional sentiment look terminal, and every regulated access story was going backward, large wallets accumulated through the low $20,000s and teens. The buyers who tracked institutional sentiment missed the bottom; the ones who tracked coins on the move caught it.
February 2025 offered a smaller rehearsal of the current setup, with the then-record $3.56 billion ETF outflow month arriving alongside stubborn on-chain absorption, followed by recovery once the macro trigger faded. Bitfinex analysts framed June’s version explicitly in those terms: simultaneous institutional selling and whale accumulation is the pattern that has appeared near past cycle lows, where long-term holders take supply off sellers before the recovery reaches price.
The pattern’s logic is structural, not mystical. ETF flows are downstream of mandates, benchmarks, and quarterly reviews, which makes them systematically late in both directions: the wrapper crowd bought the top of the euphoria and is now selling the bottom of the fear, because that is what risk-managed allocation does. On-chain whales answer to no committee. When the two disagree, the disagreement itself is the signal, because it marks the moment coins transfer from mandate-driven hands to conviction-driven ones.
Retail sentiment data rounds out the historical picture from the contrarian side. Record-high searches for Bitcoin going to 0, extreme-fear readings pinned for weeks, and supply majority-underwater have each individually marked accumulation zones in prior cycles; their simultaneous appearance alongside documented whale absorption is the full bingo card. The caveat that keeps the pattern honest is that sentiment extremes date bottoms only in retrospect, and the same indicators flashed for months through late 2022 while price kept sliding. Fear confirms opportunity for buyers with time horizons measured in years. It punishes everyone else.
None of that makes the signal infallible, and the bear case deserves its full weight. A divergence is not a timing tool: whales were also early in 2022, absorbing supply months before the actual low, and anyone who leveraged the accumulation thesis got carried out before being proven right.
The macro trigger has not disarmed, either. The next inflation print is the live variable, and a hot number would reload the exact mechanism that drained $4 billion in June, since nothing about whale accumulation prevents mandate-driven funds from selling more. Bitwise’s read of the parallel stress in Strategy’s preferred shares, that the market is working through a late-cycle leverage unwind, cuts both ways: unwinds end at bottoms, but they end violently, and the last leg is usually the worst one.
Reading the whale cohort honestly
The 1,000 BTC threshold that defines a whale wallet captures several very different animals, and the interpretation of the accumulation depends on which ones did the buying.
The most bullish reading assigns the coins to conviction capital: family offices, early holders reloading, sovereign-adjacent vehicles, and the class of buyer that accumulates through over-the-counter desks precisely to avoid moving the price. The negative spot premium through the buying window supports this reading, since it rules out the visible United States bid, and OTC accumulation into weakness is the classic signature of patient size.
The most boring reading assigns some of the movement to plumbing: exchanges consolidating cold storage, custodians migrating wallets, and settlement flows that inflate cohort statistics without expressing any view. The truth is a blend, and serious on-chain analysts hold the number loosely for exactly that reason.
Two cross-checks tilt the blend toward conviction. The first is the long-term holder metric, which is behavior-based instead of size-based: coins that have not moved in months turning into net accumulation is hard to generate with custodial reshuffling, and Glassnode flagged that shift across cohorts at the start of July. The second is the duration of the pattern. Wallet consolidation is lumpy and episodic; the June accumulation ran daily, through a 2-week window, against a falling price, which is the shape of a program, not a migration. Whoever was executing wanted more Bitcoin every day the price stayed under $62,000, and got it.
It is also worth noting who the whales are buying from, because supply has a face too. The ETF redemptions put a regulated, auditable seller on the tape every session. Miners under margin pressure added inventory. Short-term holders who bought the $70,000s capitulated at 21-month lows, the behavior that pushed over half the supply underwater. The full picture is a wealth transfer with unusually clean bookkeeping: from leveraged, mandated, and exhausted hands into large, unhurried ones, at prices the buyers evidently considered a discount.
The scenario map from $62,000
Divergences resolve, and this one has three plausible endings with watchable triggers.
The repair scenario is the historical base case. Macro softens, the July inflation print cooperates, ETF flows string together green sessions with breadth, and the price reclaims the 200-week average, converting June into another entry in the ledger of cycle lows that on-chain accumulation called early. The whales’ entry zone between $58,000 and $62,000 becomes the level the market defends, because the buyers who own it have shown they defend it. Confirmation looks like the flagship fund flipping to inflows and $62,500 breaking on volume.
The chop scenario is the underpriced one. Inflation stays sticky without spiking, the Fed stays parked, and the market grinds sideways for a quarter while ETF flows oscillate around 0. Whale accumulation in this world is early rather than wrong, the 2022 pattern, where large wallets absorbed supply for months before price agreed with them. The tell is time: patient capital does not mind, leveraged capital dies, and funding rates across the perpetuals complex show which cohort is being tested week by week.
The break scenario is the one the bears own. A hot CPI reloads the redemption machine, the 200-week average rejects the recovery, and $58,000 fails, opening the trapdoor toward the low $50,000s that technicians have flagged since the June breakdown. Even then, the divergence data offers the bears only half a victory: it would mean the whales were early again, not that the transfer did not happen, and every prior cycle says the coins that moved in June do not come back out at these levels regardless of what the next quarter’s candles look like.
There is one more asymmetry the bulls gloss over: the two cohorts do not experience being wrong the same way. If the whales are early, they wait, unleveraged and unbothered, the way they waited through 2022. If the ETF sellers are wrong, they will buy back in at higher prices, book the round trip as risk management, and their investors will barely notice. The divergence is a strong signal about where coins are going and a weak one about when price follows, and conflating those two claims is how retail traders turn a sound accumulation thesis into a liquidation.
The tape since the split
The first days of July have started scoring the disagreement, gently, in the whales’ favor. Fed chair Kevin Warsh acknowledged at the Sintra forum that inflation expectations had come down, and Bitcoin jumped more than 4% through $61,000 on the repricing of rate-hike risk. Two days later, a soft jobs report, 57,000 payrolls against expectations near 100,000 with 74,000 in downward revisions, extended the move, and Bitcoin printed $62,310 on Friday, its strongest level in 10 days, while equities set records and the ETF complex managed its first inflow in 2 weeks.
The checkpoints from here are unusually clean. Flows first: One $221 million day against a month of $4 billion proves nothing, and systematic desks want several consecutive green sessions with breadth across funds, including the largest one, before treating the reversal as a regime change rather than a bounce. Price second: $62,500 is the resistance the whole market is watching, and the 200-week average overhead is the structural line that separates a reclaimed cycle from a broken one. Macro third: the next CPI print either confirms Warsh’s softening or reloads the outflow machine.
And underneath all three sits the quieter metric that started this story: whether the coins keep moving to hands that do not sell on committee schedules. The divergence will close one way or the other, because it always does. Either the ETF sellers return as buyers at higher prices, which is how every prior version of this split resolved, or the whales have mistimed a macro regime that mandate money saw first, which would be a first. $16 billion in 2 weeks says the largest holders in the market have already placed their answer. The exit Wall Street used in June is still open. It is just worth noticing who was standing on the other side of it, catching everything that came through.
Disclaimer: This article is for informational purposes only and does not constitute investment advice. Digital asset markets are volatile, and you can lose your entire investment. Always do your own research. Information current as of July 4, 2026.
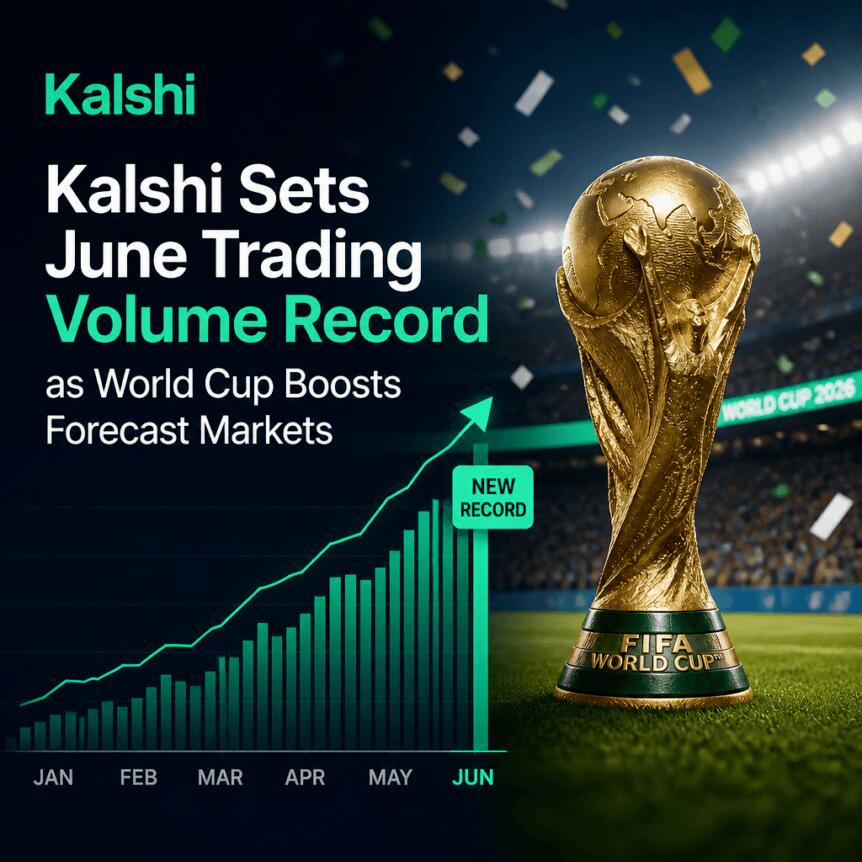
Prediction markets logged a striking surge in June, and the catalyst was unmistakable: the 2026 FIFA World Cup. According to DefiLlama, Kalshi processed nearly $9.4 billion in trading volume during the month, compared with about $5.3 billion in May. Polymarket International also rose to roughly $4.3 billion from approximately $3.5 billion the previous month.
The tournament began on June 11 and is the first FIFA World Cup to expand to 48 teams. Earlier coverage from CNBC reported that the competition became the biggest driver of prediction market activity in June, citing Dune Analytics data showing record notional volumes on both Kalshi and Polymarket.
Key takeaways
- Kalshi’s June trading volume nearly reached $9.4B, up from about $5.3B in May, with the World Cup serving as the primary driver.
- Polymarket International climbed to about $4.3B in June from roughly $3.5B in May, mirroring broader interest in football-related contracts.
- World Cup Round-of-16 matchups showed especially heavy participation, with some markets generating tens of millions in volume.
- The growth in trading volume is occurring alongside intensifying U.S. legal and regulatory pressure on prediction markets.
World Cup expansion meets prediction market demand
Football has long been a natural fit for markets where participants want to express views on outcomes. But this year’s tournament offers a larger menu of games and implications. With the World Cup expanding to 48 teams—up from 32 in previous editions—the number of match results, advancement scenarios, and related questions naturally multiplies, giving traders more opportunities to place event-linked bets.
CNBC’s reporting, referenced in the source, framed the World Cup as the dominant driver of June activity. It tied the surge to Dune Analytics figures indicating record notional trading volumes on both platforms, aligning with the month-over-month jump visible in DefiLlama’s protocol-level data.
Round-of-16 matchups pull in the highest volume
As the tournament moved into the knockout stage, trading activity concentrated further around high-stakes fixtures. One example highlighted in the source was Canada’s Round of 16 match against Morocco, scheduled for Saturday. At the time of writing, the match had generated over $48 million in trading volume on Kalshi and over $26.8 million on Polymarket.
Other advancement markets also attracted notable attention in the U.S. Round of 16 matchup. The source states that on Kalshi, a market on which team would advance generated more than $2.1 million in volume as of Saturday. On Polymarket, a comparable market had pulled in around $1.6 million by the same time.
For market participants, these figures underline a practical point: the World Cup doesn’t just bring overall volume—it can also concentrate liquidity into specific, time-sensitive contracts where traders rush to price developments and adjust their expectations as lineups, tactical decisions, and match conditions become clearer.
Trading growth collides with expanding legal pressure in the U.S.
Even as competition-linked volumes climb, prediction markets in the United States remain mired in a rapidly evolving legal debate. The source notes that by March, nearly a dozen U.S. states had taken action against companies including Kalshi and Polymarket. Some states aimed to halt prediction markets, while others sought to bring them under existing gambling laws and state tax frameworks.
Federal regulators have pushed back. The source points to a statement from CFTC Chair Michael Selig, referenced via a CFTC press release, who accused states of pursuing “illegal enforcement actions” against federally regulated exchanges. Selig argued that Congress gave the CFTC sole authority over commodity derivatives markets, which would include prediction markets, warning: “To any state that seeks to nullify federal law and seize authority over these markets, we will see you in court.”
The disagreement has also moved beyond agencies and into the broader legislative arena. In June, casino operators, tribal organizations, and labor groups urged Congress to carve sports-event contracts out of the CFTC’s authority through an amendment to the Digital Asset Market Clarity (CLARITY) Act—arguing those contracts should remain governed by state gambling laws and existing gaming oversight.
Regulators overseas: product substance, not labels
While the U.S. fight has centered on regulatory jurisdiction and enforcement, Europe has emphasized how products are categorized. The source cites an ESMA reminder issued on Friday that many event contracts may already fall under existing restrictions tied to binary options.
Crucially, ESMA’s position—as presented in the source—is that whether a product is regulated depends on its characteristics rather than the presence of an “event contract” label. That means platforms and market operators face a compliance challenge that is less about terminology and more about how specific contract mechanics are structured.
For traders and builders, the key question now is whether the World Cup-driven volume spike will translate into sustained engagement once the tournament ends—or whether liquidity fades as the legal and regulatory backdrop remains unresolved. Readers should watch for further court activity and potential legislative movement around CLARITY, since those outcomes could materially shape what kinds of contracts are allowed, where, and under what rules.
The Department of Government Efficiency (DOGE) officially ended on July 4, the sunset date written into President Donald Trump’s January 2025 executive order. Posts from Elon Musk and Michael Saylor quickly fueled speculation that Bitcoin (BTC) inherits the reform story.
Musk, DOGE’s former co-leader, marked Independence Day with a patriotic video montage instead of a farewell to the program. Meanwhile, MicroStrategy’s executive chairman answered him with one loaded line.
DOGE Ends With No Report and No Farewell
Trump’s January 2025 executive order created DOGE as a temporary organization. It set termination for July 4, 2026, America’s 250th birthday.
The program barely made it that far. DOGE had already collapsed as a centralized body last November, months ahead of schedule. Its public savings tracker went silent after January 1.
The commission claimed $215 billion in savings, about $1,335 per taxpayer by its own math. That equals roughly 3% of one year’s $7 trillion federal budget, and a fraction of the $2 trillion Musk pitched in October 2024.
Office of Management and Budget Director Russ Vought told lawmakers this week that no closing report is planned, Politico reported.
Musk, who left Washington in May 2025 after 130 days as a special government employee, always framed the ending as intentional.
Follow us on X to get the latest news as it happens
The efficiency concept has meanwhile traveled beyond Washington. New York City Mayor Zohran Mamdani recently launched a municipal efficiency version of the playbook.
Michael Saylor Answers Musk With a Bitcoin Pitch
Marc Andreessen opened July 4 with a five-minute montage of American history and the caption “God bless America.” Musk shared the same video hours later.
Saylor then replied to Musk directly, swapping a letter for the Bitcoin symbol.
Saylor has run this play before. In December 2020, he publicly urged Musk to shift Tesla’s balance sheet into Bitcoin. Tesla bought $1.5 billion worth two months later, then suspended BTC payments in May 2021 over energy concerns.
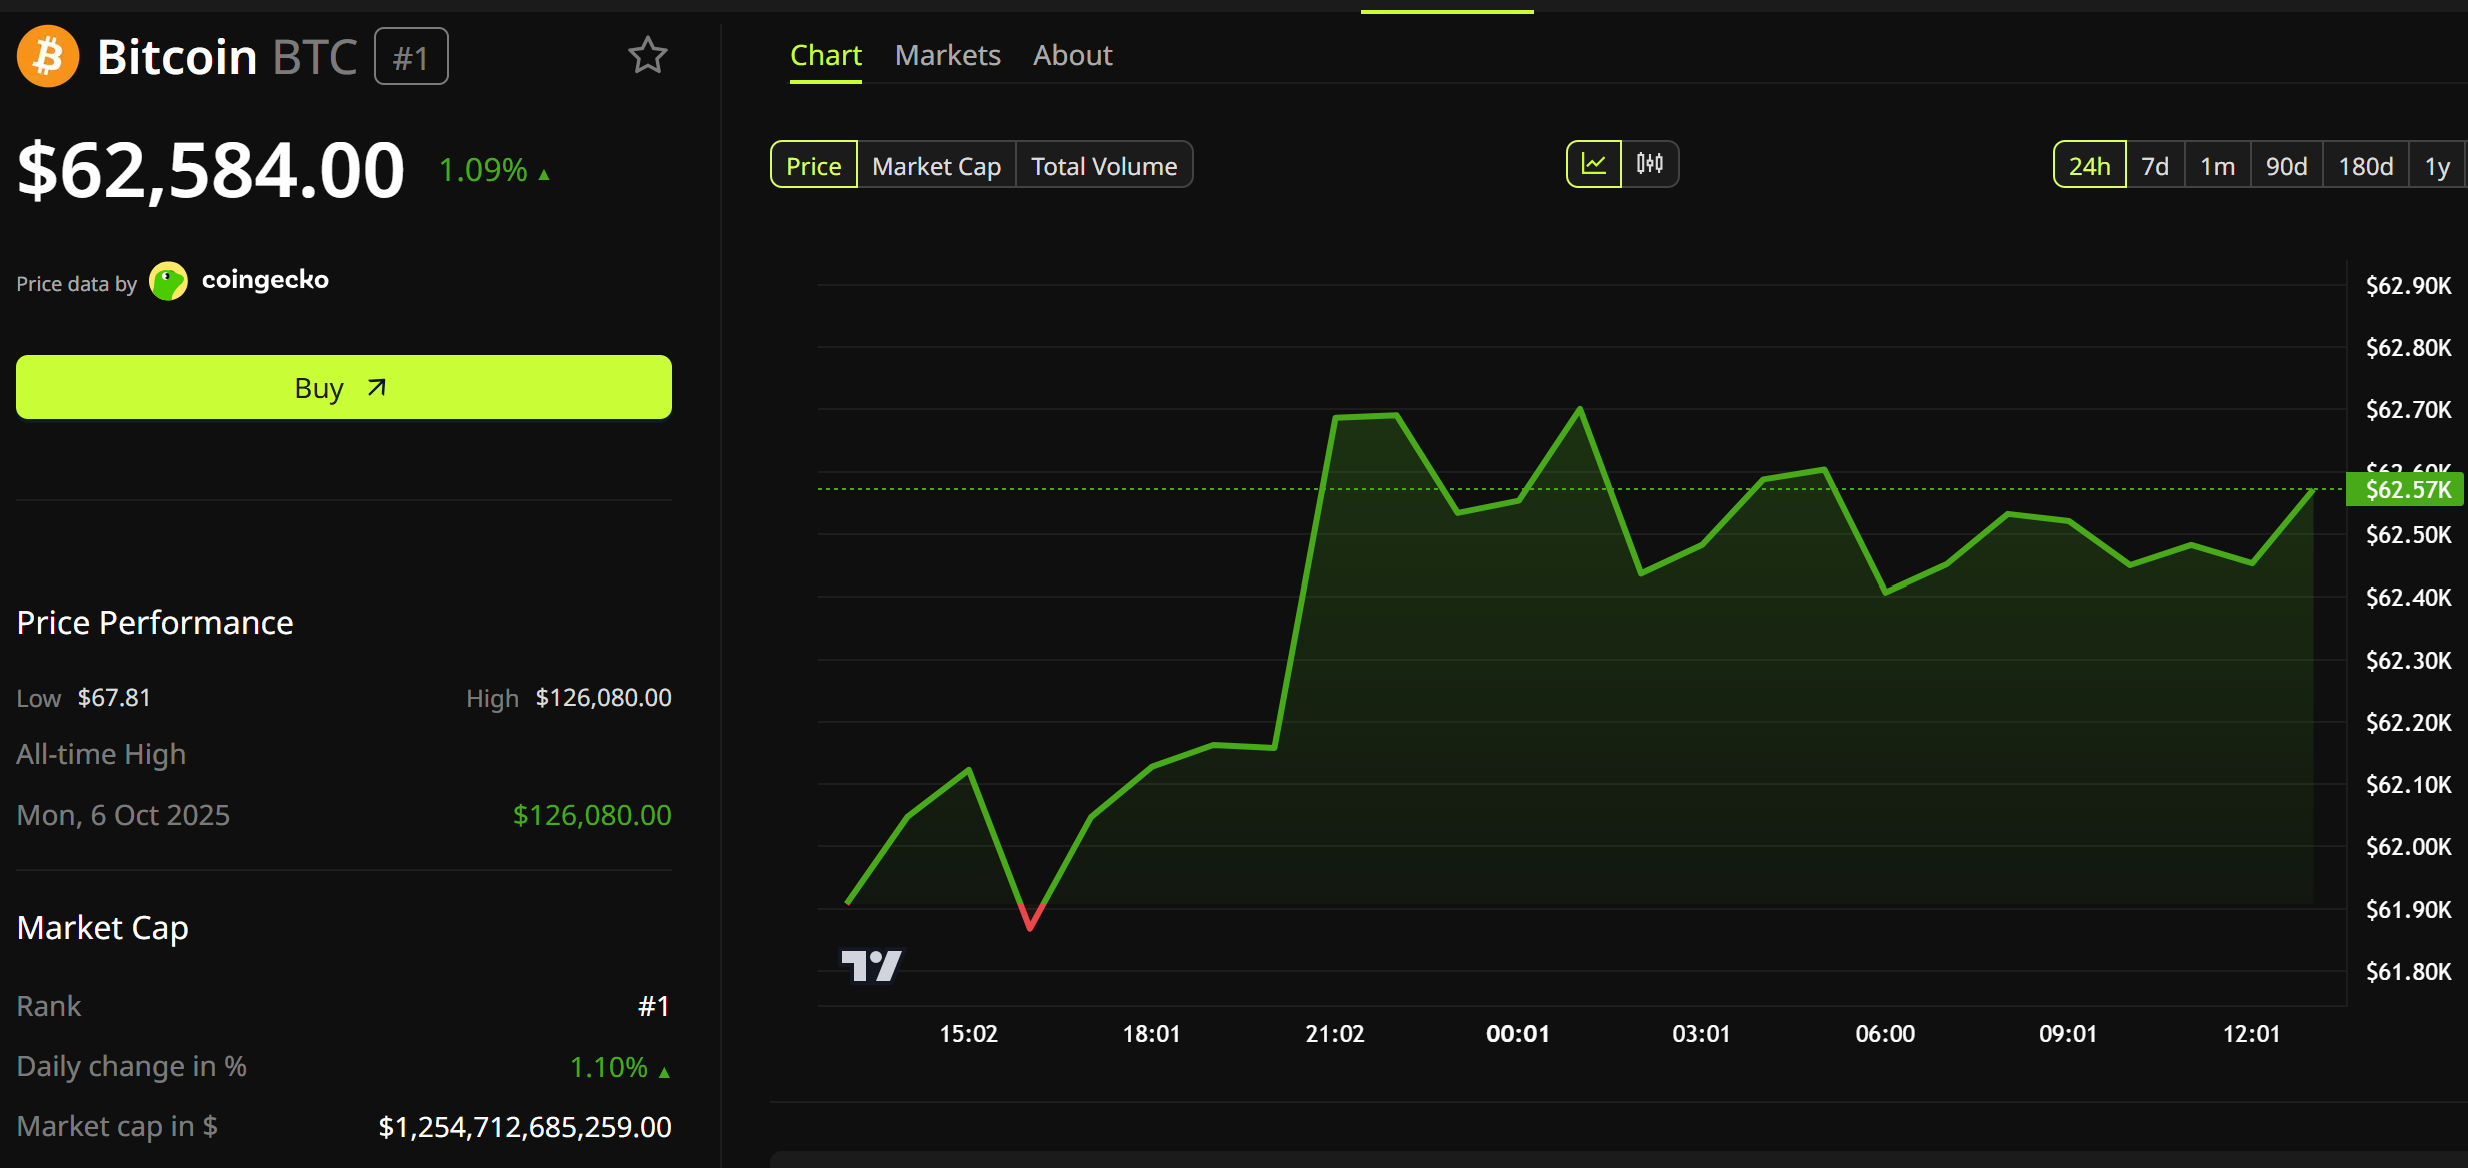
That history shaped the reaction. Traders read the exchange as a handoff from government reform to sound money, and some replies urged Tesla to resume Bitcoin payments. BTC trades near $62,584, up about 1% in 24 hours.

The timing carries irony for Saylor. Strategy faces questions over a reported 491 BTC sale and a dividend policy JPMorgan called risky. Meanwhile, Saylor pits MSTR against the Magnificent 7.
Neither Musk nor Saylor mentioned DOGE by name. The debate now turns on whether innovation and Bitcoin truly replace the reform push, or whether the ₿etter reply stays a holiday flourish.
The post DOGE Ends, Bitcoin Begins? Musk and Saylor’s July 4 Posts Fuel Speculation appeared first on BeInCrypto.
Ethereum has extended its recovery over the past several sessions, breaking above its recent consolidation range and approaching a major confluence resistance area. The rally has improved short-term sentiment, but the market is now testing a zone that could determine whether this move develops into a broader trend reversal or remains a relief rally within the prevailing downtrend.
Ethereum Price Analysis: The Daily Chart
Ethereum continues to recover from the $1.46K-$1.53K demand zone, where buyers once again stepped in after defending the June lows. The rebound has now carried price toward the descending trendline that has capped every major rally since the May peak.
The recent advance has also reclaimed the $1.70K area, placing ETH just below the next key resistance cluster around $1.82K-$1.86K. This region is particularly important because it aligns with the long-term descending trendline, creating a significant technical confluence.
Momentum has improved considerably. The previously discussed bullish RSI divergence has continued to play out, with the indicator making higher highs while price has recovered sharply from support. This suggests bearish momentum has weakened substantially compared to previous sell-offs.
Nevertheless, the broader trend cannot be considered bullish until Ethereum breaks above the descending trendline and reclaims the higher resistance band. A rejection from this area would preserve the sequence of lower highs that has defined the market for the past several months.
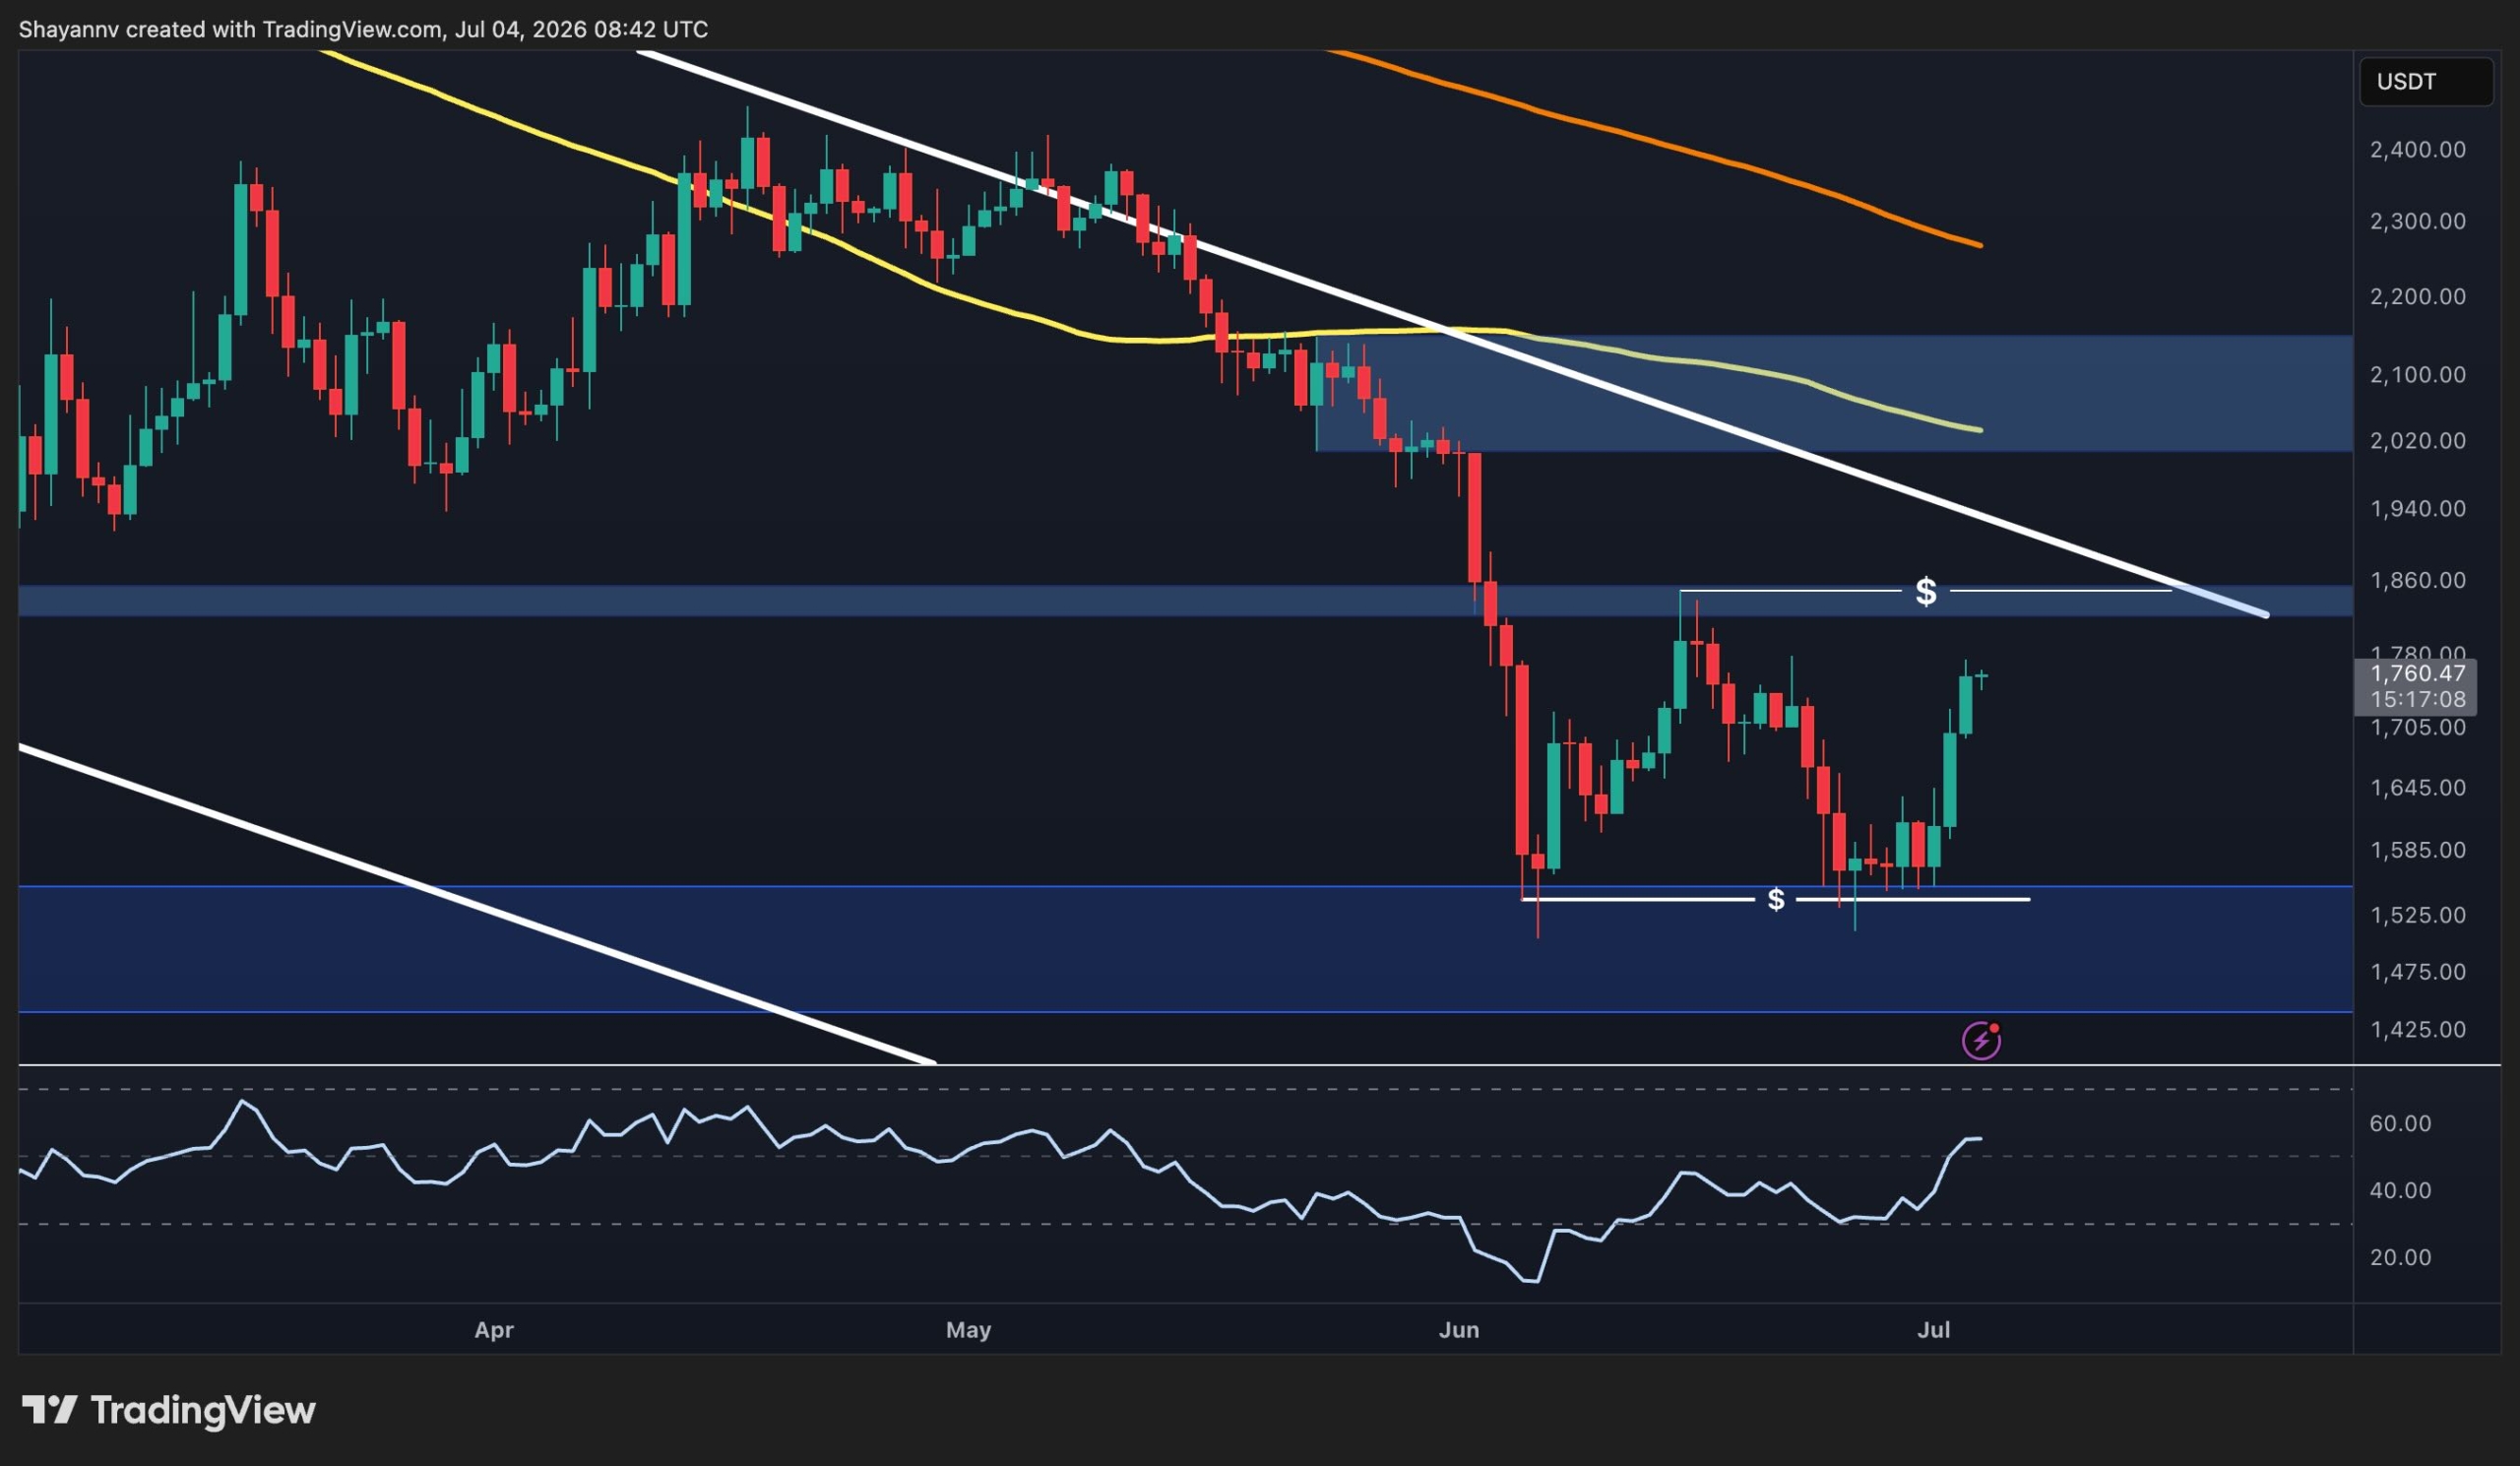
ETH/USDT 4-Hour Chart
The 4-hour chart shows that Ethereum has successfully broken above its short-term consolidation and reached the first resistance zone around $1.70K-$1.74K. Buyers have maintained strong momentum following the breakout from the lower range, allowing the price to approach the upper boundary of the descending structure.
Price is now trading just beneath the falling trendline that has repeatedly rejected previous recovery attempts. A decisive breakout above this trendline would represent the first meaningful structural improvement since the broader decline began and could open the door for a move toward the $1.82K-$1.86K resistance area.
As long as Ethereum remains above the recently reclaimed $1.70K region, buyers retain short-term control. However, failure to overcome the descending trendline could trigger another rejection, sending price back toward lower support levels and extending the broader corrective structure.

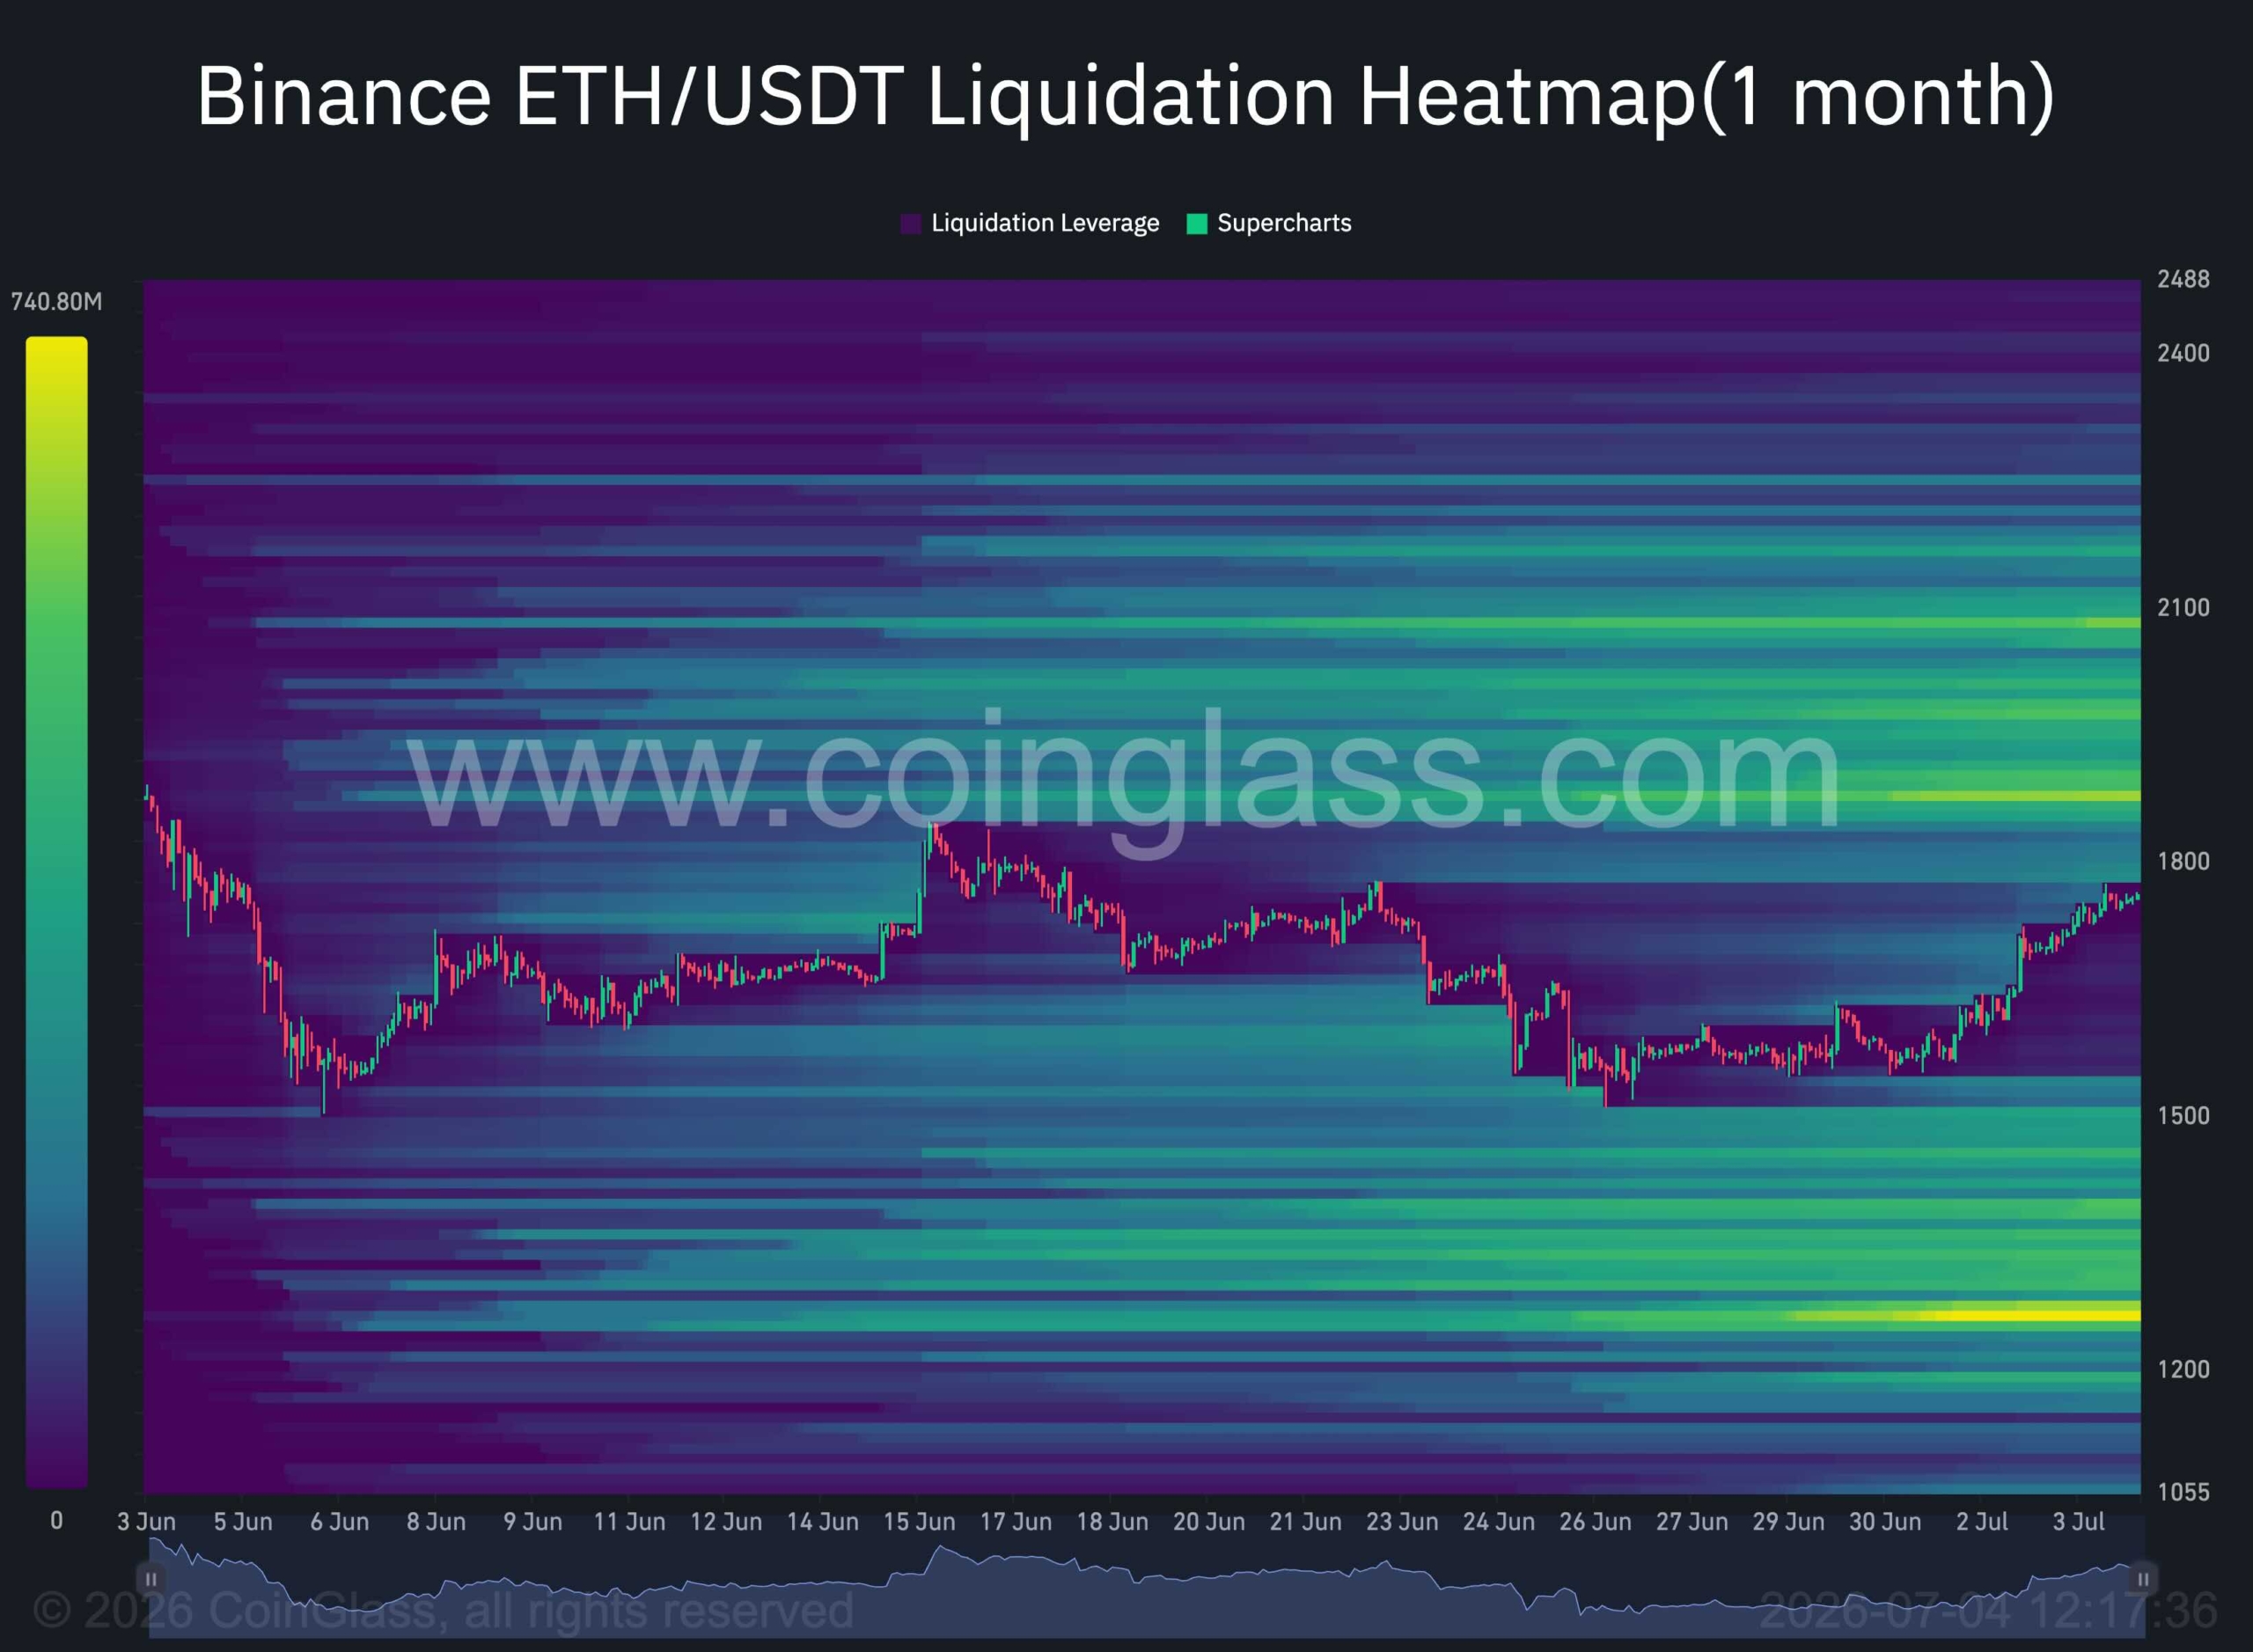
Sentiment Analysis
The one-month liquidation heatmap highlights a significant concentration of leveraged positions above the current market price, particularly within the $2K-$2.2K region.
These overhead liquidity clusters could act as a magnet for price in the coming sessions. If Ethereum successfully clears the descending trendline and continues its recovery, the market may accelerate toward this area as short liquidations fuel additional upside momentum.
However, the reaction after such a liquidity sweep may prove even more important than the rally itself. Once the $2K-$2.2K liquidity has been absorbed, the market will likely reveal whether buyers have accumulated enough strength to establish a sustainable bullish trend or whether the move was primarily a liquidity-driven squeeze.
If bullish momentum remains strong after clearing the overhead liquidity, Ethereum could enter a broader recovery phase. Conversely, failure to hold above that region would increase the probability of another significant decline, with price potentially rotating lower to target the sizeable liquidity clusters that remain beneath the current market. Such a sequence would fit the market’s tendency to move between major pools of leveraged liquidity before establishing its next directional trend.
The post Ethereum Price Prediction: Can ETH Break Its Downtrend and Target $2.2K? appeared first on CryptoPotato.


On July 7, 3 weeks after the largest IPO in history, SPCX enters the Nasdaq-100 with billions in passive index buying behind it. The more interesting market is the one Wall Street does not run: tokenized shares on Solana, perpetual futures that priced the listing before bankers did, a $557 million subscription campaign that had to refund almost everyone, and 18,712 Bitcoin sitting on the rocket company’s balance sheet.
Summary
- SpaceX’s Nasdaq-100 entry will bring estimated passive buying while crypto markets already trade its exposure around the clock.
- Tokenized shares, tracker products, and perpetual futures turned SPCX into a live test of equity trading on crypto rails.
- The SpaceX cycle exposed both the promise and risks of tokenized markets, from global access to failed allocations and liquidations.
Index inclusions are usually the sleepiest events in finance. A committee updates a list, passive funds rebalance, and the market moves on. SpaceX joining the Nasdaq-100 before the open on Tuesday, July 7, is not sleepy, partly because the company only went public on June 12 and partly because the estimated $4.3 billion in passive buying tied to the inclusion is arriving into one of the strangest market structures any stock has ever had.
SpaceX, ticker SPCX, is the first mega-cap whose entire public life has run in parallel on crypto rails. Its valuation was traded around the clock for weeks before the IPO priced. Its shares exist simultaneously as Nasdaq stock, as redeemable tokens on Solana, as tracker certificates on half a dozen exchanges, and as cash-settled perpetual futures that liquidated more than $50 million in positions during one bad 48-hour stretch. Its balance sheet holds 18,712 Bitcoin. And when the index funds start buying on Tuesday morning, a meaningful part of the price discovery will already have happened overnight, on-chain, while the exchange was closed.
This is what it looks like when the market structure conversation stops being theoretical. Here is the full map of the SpaceX trade, and what Tuesday tests.
The listing that broke records and brokers
The numbers behind the underlying event deserve a restatement, because everything else sits on top of them. SpaceX sold 555.6 million Class A shares at $135 on June 12, raising $75 billion, the largest initial public offering in United States history, at a valuation near $1.75 trillion. Goldman Sachs led the syndicate alongside Morgan Stanley, Bank of America Securities, Citigroup, and JPMorgan. The company dual-listed on Nasdaq’s Texas exchange under the same ticker, and in a sharp break from mega-cap convention, allocated 30% of the offering to retail investors instead of the usual sliver near 10%.
The stock opened at $150, traded as high as the mid-$160s, and then did what heavily hyped listings often do: it came back down, slipping below its opening price in late June during the broader market drawdown, leaving buyers above the $135 offer price with a live lesson in post-IPO volatility. The first public earnings report lands in September, and the first quarterly disclosure period, ending June 30, has just closed.
One filing detail turned the listing into a crypto story on its own. SpaceX’s registration statement disclosed 18,712 BTC on the balance sheet, acquired back in 2021 at a cost basis of roughly $661 million and worth around $1.2 billion at recent prices. As a public company, SpaceX now reports that position, its cost basis, and its fair-value changes every quarter, joining the small club of corporates whose earnings calls double as Bitcoin disclosures. The June market slide made that holding a talking point immediately, with analysts noting that the $75 billion raise itself competed for the same pool of risk capital that had been holding up crypto prices.
The perpetuals that front-ran the bankers
The most consequential crypto layer of the SpaceX trade started weeks before the stock existed. On May 18, the builder TradeXYZ deployed a pre-IPO perpetual futures market for SpaceX on Hyperliquid under the ticker xyz:SPCX, using the HIP-3 framework that lets outside builders launch perpetual markets on the chain.
Centralized exchanges followed with their own contracts, and by listing day the pre-IPO complex had processed $3.2 billion in volume across 8 venues with open interest peaking above $390 million, including more than $190 million on Hyperliquid alone before the Nasdaq open.
What makes those markets more than a curiosity is how well they priced the event. Aggregated pre-IPO contracts traded at a volume-weighted average near $155 in the final stretch against the $135 offer price, and closed the pre-listing period at an average of $157, within 4.7% of the $150 opening print. The precedent held from the Cerebras listing months earlier, where the equivalent contract landed within 1.3% of the opening price. Synthetic, around-the-clock markets built on crypto infrastructure produced a credible forecast of where one of the most oversubscribed offerings in history would open, while the traditional book-building process kept that information inside the syndicate.
The same markets also delivered the cautionary chapter. Once Nasdaq trading began, the contracts converted into standard equity-linked perpetuals using the live stock price as an oracle, and when SPCX slid below its $150 opening level in late June, leveraged longs paid for the enthusiasm: more than $50 million in SPCX perpetual liquidations in 48 hours, a total that briefly ranked the contract behind only Bitcoin and Ethereum among crypto derivatives. A perpetual future on a stock inherits crypto’s speed in both directions, and the liquidation engine does not wait for an opening bell.
Four things called SpaceX exposure, one of them actual stock
The tokenized layer is where the SpaceX trade turned into a market structure exam that much of the industry failed. By late June, a retail buyer reaching for SpaceX exposure through crypto could end up holding four legally distinct instruments, and the differences only became obvious under stress.
The first is the real thing: a Nasdaq share, whether through a traditional broker or through exchange offerings that route whole-share orders to an introducing broker with standard clearing. Real equity, real shareholder claim, real trading halts.
The second is the redeemable token. Backpack Securities issued a Solana-native SpaceX token backed 1:1 by actual shares in regulated custody, redeemable into the underlying equity and transferable to a conventional brokerage. Ondo launched its own 1:1 tracker on Ethereum and Solana with daily custody attestations. These are the instruments the tokenization thesis has been promising: the stock, wrapped, portable, and trading around the clock.
The third is the tracker certificate. The xStocks product, launched by Kraken parent Payward and distributed across exchanges including Bybit, delivers price exposure through bearer debt instruments with no shareholder rights, no voting, and no legal claim on the underlying shares, and its own terms allow the collateral behind them to be assets other than the stock itself. It is exposure, not ownership, and the paperwork says so for anyone who reads it. Payward has spent 2026 planting flags across mainstream finance, from tokenized equities to its FIFA World Cup sponsorship, and xStocks is the ambitious middle of that portfolio.
The fourth is the perpetual, which owns nothing at all and tracks the price purely through funding mechanics.
The stress test arrived before the stock did. Binance Wallet ran a tokenized subscription campaign for SpaceX exposure through xStocks that raised $557 million from 27,689 wallet addresses, one of the largest tokenized offering campaigns ever, with Bybit running a parallel program. Then the supply failed to show up: the xStocks provider received a smaller pre-IPO share allocation than expected, and Binance, Bybit, and Bitget canceled customer allocations and refunded in full, with Binance distributing a consolation $1 million in shares through its newer bStocks platform. The fine print had warned that allocations were not guaranteed, and the fine print won. Tokenization can wrap a share, but it cannot conjure one, and the biggest tokenized IPO campaign in history ended as a refund notice.
None of that stopped the sector’s growth. Tokenized stock volumes hit a record $20 billion during the SpaceX cycle, pre-IPO tokenized trading volume surged over 1,000%, and tokenized equities as a category kept compounding, with Citi projecting tokenized real-world assets to grow from around $17 billion today to $5.5 trillion by 2030. SpaceX was simultaneously the category’s best advertisement and its most public quality-control failure.
How a market for a private company actually works
Since pre-IPO perpetuals are about to become a fixture of every major listing, the mechanics deserve a proper walkthrough, because the instrument is stranger than its chart suggests.
A perpetual future normally needs a reference price to anchor its funding mechanism: longs pay shorts when the contract trades above the index, shorts pay longs below it, and the payments tether the derivative to the underlying. A private company has no underlying. The pre-IPO contracts solved this by letting the funding mechanism anchor to itself, with the contract price representing the market’s continuously updated estimate of the eventual listing value, disciplined by traders willing to take the other side of any drift. It is price discovery with no ground truth until listing day, which sounds like astrology and behaved like arbitrage.
The Cerebras listing was the controlled experiment. The chipmaker’s pre-IPO perpetual traded for weeks before its Nasdaq debut, and when the stock opened, the contract’s final pre-listing price sat within 1.3% of the $350 opening print. Spreads on the contract compressed to a 0.07% median once the live stock price became the oracle, and open interest rolled off in an orderly unwind as positions reconciled against reality. The experiment answered the core objection to synthetic pre-IPO markets, that with no underlying to arbitrage they would drift into fantasy, with a data point: they did not.
SpaceX ran the experiment at 40 times the size. The Hyperliquid contract launched on May 18 with the IPO reference at $135, and the market immediately priced the company richer, clustering between $180 and $200 in the first weeks, an implied valuation near $2.5 trillion that said more about scarcity hunger than fundamentals. Then something instructive happened: as the roadshow progressed and allocation details leaked, the contracts converged, sliding into the $160 to $170 range by June 8 and settling near $155 aggregate VWAP into listing week. The synthetic market did not just guess; it updated, absorbing information through the exact process equity analysts describe as price discovery, running around the clock on rails the syndicate did not control.
At listing, the contracts flipped their oracle to the live Nasdaq price and became ordinary equity-linked perpetuals, which is where the second lesson arrived. An around-the-clock leveraged derivative on a stock means the stock effectively trades around the clock too, with all of crypto’s liquidation mechanics attached. When SPCX broke below $150, the cascade cleared more than $50 million in 48 hours, forcing exits firing at 3 a.m. against a reference asset whose actual venue was closed. Equity investors got their first taste of a dynamic crypto traders know in their bones: in a leveraged 24-hour market, the price you are liquidated at and the price the asset deserves are frequently different numbers, and only one of them empties your account.
The regulatory seam running through everything
Every layer of the SpaceX crypto complex operates around a single inconvenient fact: most of it is unavailable to Americans, on purpose.
The tokenized products draw the sharpest lines. xStocks excludes users from the United States, the United Kingdom, Canada, and Australia outright. Ondo’s tracker is for non-United States users. Backpack’s redeemable token operates through securities registrations that carefully fence its distribution. The pattern is uniform because the legal exposure is: a tokenized share offered to a United States retail investor is a securities offering, and nobody in the stack wants to run that experiment ahead of legislation. The result is an inverted access map, where a trader in Lagos or Manila can hold around-the-clock SpaceX exposure through a phone wallet while a trader in Ohio needs a brokerage account and market hours, for a company whose rockets launch from Texas and Florida.
The perpetuals live in the same seam. The offshore exchanges listing SPCX contracts exclude United States persons as a matter of stated policy, with all the enforcement rigor that phrase historically implies, and the domestic regulated path for equity perpetuals is still being fought over between the CFTC and the exchanges. Meanwhile, the pending market structure legislation grinding through the Senate would redraw several of these lines at once, which is why every player in the tokenized stock complex is building now and lobbying simultaneously: the rails that exist when the rules finalize tend to get grandfathered into legitimacy, and the ones that do not get built never do.
The seam also explains the industry’s strange incentive alignment around Tuesday. A clean, liquid, boring index inclusion, with the tokenized layer tracking faithfully and no structural embarrassments, is a lobbying exhibit for the entire sector. A blowup is an exhibit for the other side. Rarely has a passive rebalancing event carried this much narrative weight for people who do not own the stock.
What Tuesday actually tests
The Nasdaq-100 inclusion, effective before the market opens on July 7, is mechanically simple: index-tracking funds led by the QQQ complex must hold SPCX, and the estimated $4.3 billion in passive demand tied to that rebalancing arrives on a schedule everyone can see. The flow is not new money deciding it likes rockets; it is rule-following capital buying whatever the index says, funded by trimming whichever component fell out of the top 100, which is why inclusion effects are usually front-run, faded, and forgotten within a week. The wrinkle this time is that the front-running venues never close. The same June liquidity squeeze that drained a record $4 billion from Bitcoin ETFs while whales accumulated on-chain showed how sharply passive flows and conviction flows can diverge; Tuesday runs that experiment inside a single ticker. For a normal stock, the interesting question is how much of the flow is already priced in. For this stock, there are three better questions.
First, where does the price discovery happen? The inclusion takes effect at the open, but the tokenized shares and the perpetuals trade through the weekend and overnight. Whatever the market decides about the inclusion will be visible on-chain hours before the first Nasdaq print on Tuesday, the same way the pre-IPO perps front-ran the offer price. Index events used to be a bell-to-bell affair. This one has a 24-hour shadow market attached, and the arbitrage between the two is now a professional trade.
Second, does the passive bid meet the leveraged crowd? SPCX perpetual open interest rebuilt after the June flush, and a scheduled, well-telegraphed buying event is exactly the setup that attracts leverage on both sides. The last time the stock moved sharply, the liquidation cascade outpaced anything the equity market itself did. A calm inclusion would be a small landmark for the tokenized complex; a violent one would be a reminder that bolting crypto market structure onto a stock imports crypto’s failure modes along with its hours.
Third, does the index bid revalue the Bitcoin on the books? Passive funds buying SPCX are, at one remove, buying 18,712 BTC without an opinion about it, the same way index investors have been buying corporate Bitcoin treasuries through other tickers for years. It is a small position against a $1.7 trillion company, but the symbolism runs the other direction: Bitcoin exposure is now something the Nasdaq-100 carries by default, embedded in a rocket company, disclosed quarterly, and owned by every retirement account tracking the index.
The precedent being set in real time
Step back from the ticker and the SpaceX cycle reads like a preview of how every major listing will eventually work. A company’s valuation now starts trading the moment the market cares, not the moment a syndicate allows it. The pre-IPO perps priced SpaceX within a few percent while the roadshow was still running. The tokenized wrappers extended the stock into jurisdictions and hours the exchange cannot reach, the same premise Robinhood just built an entire blockchain around. The failures were real, from the xStocks allocation collapse to the liquidation cascade, but they were failures of capacity and leverage, not of the premise.
The IPO pipeline behind SpaceX makes the preview matter. OpenAI and Anthropic perpetuals already trade the same way SPCX did in May, meaning the market is currently pricing companies that have not filed anything, continuously, with open interest in the hundreds of millions. Whenever those listings arrive, the crypto layer will not be an afterthought bolted on for retail access. It will have been the market of record for months, with the exchange listing arriving as the settlement event that reconciles everyone’s positions.
The retail geography of the trade is the part traditional finance keeps underestimating. SpaceX allocated 30% of its offering to retail, an unprecedented share for a listing this size, and the tokenized layer extended that populism to jurisdictions the allocation never reached: on-chain SPCX products let buyers in more than 100 countries take positions from a phone, in fractions, at any hour, with no brokerage relationship. The demand was not hypothetical. The pre-IPO tokenized trading complex grew over 1,000% in volume during the SpaceX cycle, the Binance Wallet campaign alone pulled in $557 million of subscription demand from under 28,000 wallets, and the perpetuals cleared billions from traders who could never have participated in the actual book. Whether regulators read that as democratized access or as an unlicensed parallel offering is precisely the fight the next 2 years of market structure policy will settle, and SpaceX supplied both sides with their best evidence.
There is also a quieter institutional lesson in how the instruments behaved relative to each other. Through the June volatility, the redeemable tokens tracked the stock tightly because arbitrageurs could actually redeem them, the tracker certificates drifted on their own supply and demand because nobody could, and the perpetuals overshot in both directions because leverage always does. The dispersion between four instruments referencing one asset is a live measurement of how much each layer of trust costs, updated every minute, and desks have started trading the basis between the wrappers the way they trade the futures basis in any mature market. Market structure people call this the instrument stack finding its pricing; everyone else calls it confusing, and both are right.
That inversion, crypto markets first and the stock exchange as confirmation, would have sounded absurd during the last cycle. On Tuesday morning, when the index funds show up to buy a stock whose weekend price action already happened on Solana and Hyperliquid, it will just be how the SpaceX trade works. The rocket company did not set out to become the test case for the merger of equity and crypto market structure. It became one anyway, because it was the biggest thing on the launchpad when the rails were finally ready, and markets, like rockets, use the heaviest available payload to prove the vehicle.
The score going into the open
The scoreboard so far: the perpetuals called the IPO price better than the commentary did, the redeemable tokens worked exactly as designed, the tracker certificates exposed the difference between exposure and ownership, the subscription campaigns found the hard limit of tokenized supply, and the leverage got punished on schedule. That is a remarkably complete stress test for a market structure that barely existed 2 years ago, administered by a single stock in 3 weeks.
Tuesday adds the last missing scenario, a scheduled institutional flow event, to the record. Whichever way SPCX trades, the more durable result is already in: the parallel market did not blink, did not halt, and did not wait for anyone’s opening bell. The index committee added a company to a list. The market around that company had already added itself to something bigger.
Disclaimer: This article is for informational purposes only and does not constitute investment advice. Digital asset markets are volatile, and you can lose your entire investment. Always do your own research. Information current as of July 4, 2026.
Disclosure: This article does not represent investment advice. The content and materials featured on this page are for educational purposes only.
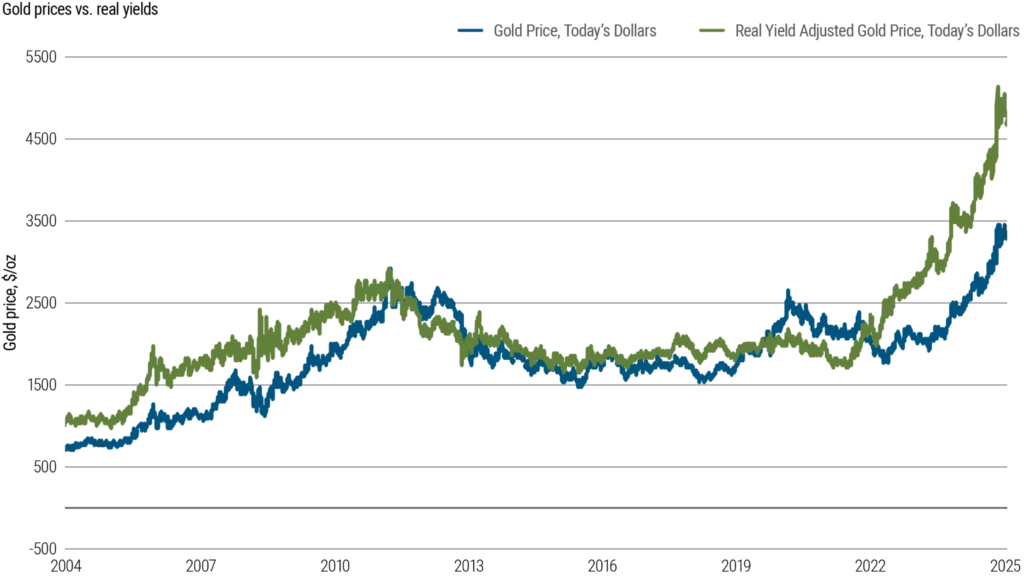
Gold’s modern market history reflects decades of price swings shaped by inflation, interest rates, central bank actions, and geopolitical events.
Summary
- Gold’s post-1971 history reflects decades of inflation, monetary policy, crises, and shifting investor sentiment.
- Gold prices have been shaped by inflation, central bank policies, and geopolitical events since leaving the gold standard.
- From Bretton Woods to the 2008 crisis, gold’s market history highlights the impact of macroeconomic and policy shifts.
In open markets, gold has only been on the free market for the last 50-some years. Until the month of August 1971, its value had been pegged at $35 per ounce under the Bretton Woods monetary system.
However, the Nixon administration gave up on dollar convertibility to gold, which put the metal into a market that it had not known in living memory. The history that ensued is one of the more instructive in the history of prices in modern finance, driven by oil shocks, conscious rate policy, concerted institutional action, and periodic crises not foreseen by most of the actors until they actually happened.
The 1970s: Gold’s first decade without a fixed price
There were no fireworks following the move to a market-determined price. However, inflation rates in the Western world rose dramatically during the 1973 Arab oil embargo, and the gold chart started to move in a decade-defining manner. The metal was up to nearly $195 per ounce by the end of 1974, a nearly fivefold increase in three years. In 1975, the U.S. government legalized private gold ownership for American citizens, which brought some profit-taking and halted the upward trend for a short while. But structural factors – weak dollar, high inflation and growing geopolitical tension – held strong.
In January 1980, gold hit $850.00 an ounce due to the Iranian Revolution, the Soviet invasion of Afghanistan, and a series of inflationary pressure events during the Carter administration. That would be the first time the level is not matched in real, inflation-adjusted dollars in more than 30 years, something that is often overlooked when people talk about the bull market of the 2000s just in nominal terms.
The 1980s and 1990s: Two decades of consistent decline
The period since gold peaked in 1980 has been one of the most instructive in recent gold history, not for any one event, but rather because of the persistent conditions that held gold prices down for 20 years.
The Volcker rate environment
Under Paul Volcker, the Federal Reserve hiked rates hard to squelch “embedded inflation”. This did work, but the environment, with real rates quite positive and a strengthening dollar bringing in capital to U.S. assets, was fundamentally not good for a commodity that did not yield. From 1980, gold dropped consistently and found a range of $300-$500 during most of the decade. This was not caused by any one factor but by a combination of macro factors that were unfavorable to the metal.
Institutional selling in the 1990s
Another big negative wind was the coordinated central bank selling in the 1990s. A number of European governments decided to cut their gold stocks because they were unproductive and produced no return. Known publicly in advance, the UK’s auction of 415 tonnes between 1999 and 2002 took place close to what proved to be multi-decade low prices and became a benchmark in reserve management debates, which still exist today. The larger picture of Europe’s institutional sell added to the pressures on prices.
The 1999 low and the Washington agreement
In 1999, gold was almost $252 an ounce at the bottom. The Washington Agreement on gold, negotiated by European central banks in September this year, contained annual limits on the volume of sales and assisted in stabilizing the cycle low. By this time, the sentiment on gold was universally negative, and as the next decade proved, this was a good contrarian indicator.
The pattern that defined this era
The 1980s and 1990s form a pattern that can be seen numerous times on the longer time frame. Gold was found to underperform when the following occurred at the same time:
- Interest rates were meaningfully positive for a considerable amount of time.
- General trust in the financial system and in equity markets was largely not affected.
- The U.S. dollar was structurally strong on a trade-weighted basis
- Institutional reserve holders were net sellers
This combination is not a mechanical rule, but it did occur with uncanny uniformity during two successive decades. It also shows why the lows of gold in the latter part of the 1990s (now appearing to be extraordinary) seemed to be reasonable for the times.
The 2000s: A new bull market, then a crisis that surprised both ways
Gold’s bounce from the 1999 low was subdued initially. The metal started to rise from about $270 per ounce in 2001. The dot-com bubble burst, bringing into doubt the valuation of equities; the events of 9/11 drove up geopolitical risk premiums in all markets, and the U.S. fiscal budget increased dramatically to pay for military operations outside the country. The general trend of a falling dollar was an underlying theme.
In 2007, gold reached $800 an ounce for the first time since 1980. Then the financial crisis of 2008 had a chain reaction, surprising many observers. gold was hit hard in the last few months of 2008 as institutions began to dump assets in all asset classes to recoup losses and satisfy redemptions, and gold was no different. But with monetary easing having begun globally and with several major central banks applying near-zero rates as well as large-scale asset purchases, real interest rates went deeply negative, and gold began to rise again with a vengeance. It was at about $1,920 per ounce by September 2011, more than seven times higher than the 1999 low.
The following table outlines the general price ranges and main factors for each decade:
Decade
Approx. Low
Approx. High
Key Driver
1970s
$35 (fixed, 1971)
$850 (Jan 1980)
Inflation, oil shocks, USD weakness
1980s
~$280
~$500
Positive real rates, disinflation
1990s
~$252 (1999)
~$415
Central bank selling, equity boom
2000s
~$270 (2001)
~$1,000 (2008)
Dollar weakness, financial instability
2010s
~$1,050 (2015)
~$1,920 (2011)
QE, then rate normalization
2020s
~$1,700 (2022)
$3,000+ (2025)
Pandemic, geopolitics, central bank buying
The 2010s: A steep correction and a gradual return
When it peaked in 2011, not many expected gold to fall so much and so far. The metal’s annual decline was its worst since 1981 after the Fed indicated it would begin to slow asset purchases, which sent real yields higher and took one of gold’s primary props out from under the market. As of December 2015, prices had dropped to approximately $1,050 per ounce. The mining industry balance sheets were seriously strained, and analysts were generally negative.
An adjustment from that trough was slow and took place due to a number of factors — partly the weaker geopolitical demand from Brexit uncertainty, the U.S.-China trade tensions, and the uncertainty surrounding some of the world’s larger economies, and partly due to a structural change in how central banks manage their reserves. Emerging market institutions also started to add gold to their holdings in amounts never again witnessed in the modern history of gold demand: gold purchases in the countries of the modern data series exceeded 1,000 tonnes per year for the first time in more than 55 years. By mid-2019, gold had made a comeback, trading well over $1,500 per ounce and reclaiming the ground lost over the years.
The 2020s: New records and more nuanced drivers
COVID-19 has changed the global monetary landscape quickly and dramatically and gold prices have reacted as such. The metal’s historical record indicated that conditions in the form of near-zero interest rates and large-scale fiscal stimulus programs and significant monetary expansion would be favorable for the metal. Gold’s intraday price in August 2020 breached the $2,000-an-ounce threshold for the first time in history, topping out at about $2,075.
The inflation surge and why gold’s response was muted
The price reaction to the surge in inflation in 2021 and its following years has been weaker than many observers expected and there’s a reason why. The link between gold and inflation is often misunderstood and misinterpreted in the media. The message of the longer history is that the metal has been a better indicator of real interest rates, that is, it tends to do best when the inflation is higher than the nominal yield and real interest rates are negative. The nominal rate environment in many markets changed when central banks responded aggressively in 2022-2023, lifting nominal rates above the rate of price increases. That offset also weighed on gold’s ability to rally despite the high levels of headline inflation, as the metal spent much of 2022 trading between $1,700 and $2,000.

From $2,500 to $3,000 and the current environment
Gold ventured into fresh nominal highs in late 2023 as rate expectations eased, geopolitical fragmentation continued, and the structural central bank buying by reserve holders wanting to unwind dollar-denominated holdings continued. It crossed $2,500 in 2024 and breached $3,000 per ounce in early 2025. Today, prices are still at historically high levels as of mid-2026. The share of gold in global foreign exchange reserves has been gradually improving in recent years and has turned the tide in the long-term structural deterioration of the precious metal’s share, as several major countries are actively diversifying their reserves away from dollar-dominated portfolios.
What the full 50-year chart actually reveals
There are 50 years of price data to provide context but not certainty. This chart doesn’t show a consistent cycle or a reliable formula to follow in the future, but it does show which conditions have been reliable indicators of a significant price move and which areas confident stories have consistently missed.
Historical factors that historically signal bull markets in gold are:
- When the real interest rate is very negative, that is when the nominal interest rate is less than the rate of meaningful inflation
- Widespread loss of trust in key financial institutions or money systems
- Structural, persistent dollar weakness (trade-weighted basis)
- Near-term crises with no immediate resolution prospects (geopolitical crises)
- A significant continuous net purchase from institutional reserve buyers
- Monetary expansion that brings up issues of long-term purchasing power of currency
- Increased uncertainty about statements of sovereign debt paths in key economies
Factors that have been a drag on the price:
- With positive real interest rates, yield-bearing assets have a clear competitive edge.
- Favorable and sustainable financial position and widespread trust in equities.
- A structurally strong dollar combined with contained and declining inflation
Important turning points in the 50-year history:
1971: Fixed pricing ends, market discovery of gold begins, $35
1980: $850 peak as a result of compounding crises and entrenched inflation
1999: Price bottoms near $252, and the bearish consensus is at its lowest ebb.
2011: $1920 – end of the second major bull run with monetary conditions returning to normal levels.
2020: the first year to cross $2,000 in a pandemic environment
2025: Gold breaks through $3,000 and heads into new nominal space on structural and macro forces.
2026: Institutional demand for safe haven reaches an all-time high of $5,600.
History also reveals the challenges that have historically befallen overarching narratives. During the first stages of the crisis in 2008, gold gave back, just as it is usually considered a safe haven, and then rose when policy took action. Despite a strong inflation period in 2022, it still underperformed for much of the year. It fell over ten years for two decades, and recovery was called for each and every one, but the calls always proved to be premature.
Being honest about reading the 50-year chart means taking into account the periods when gold acted out of the ordinary and when it did what it was supposed to do. The price is a combination of financial policy, institutional flows, currency dynamics, and investor positions — all of which are interdependent and all of which are complex and cannot be summarized by a one-size-fits-all explanatory variable that is consistent through every time period.
Disclosure: This content is provided by a third party. Neither crypto.news nor the author of this article endorses any product mentioned on this page. Users should conduct their own research before taking any action related to the company.

Prediction markets have found an unexpected new liquidity magnet: the 2026 FIFA World Cup. According to DefiLlama data cited by CNBC, trading volume surged across major US prediction platforms after the tournament began on June 11—at a time when the sector is simultaneously facing intensified regulatory pressure.
DefiLlama shows Kalshi handled nearly $9.4 billion in trading volume in June, up from about $5.3 billion in May. Polymarket International also rose to roughly $4.3 billion in June, compared with about $3.5 billion the month prior. CNBC reported that the World Cup became the biggest driver of prediction market volumes in June, with Dune Analytics highlighting record notional trading activity on both Kalshi and Polymarket.
Key takeaways
- Kalshi’s June trading volume nearly hit $9.4 billion, rising from about $5.3 billion in May, as World Cup activity accelerated.
- Polymarket climbed to about $4.3 billion in June from roughly $3.5 billion in May, also pointing to the tournament as a major catalyst.
- High-stakes World Cup knockout matchups are generating tens of millions in daily volume on both exchanges, with some fixtures surpassing $48 million on Kalshi.
- The growth is unfolding alongside escalating US legal and regulatory disputes over whether prediction markets should fall under federal derivatives authority or state gambling frameworks.
World Cup liquidity floods prediction platforms
The jump in activity aligns with the tournament’s expanded format. The 2026 World Cup is the first FIFA edition featuring 48 teams, up from 32 previously. That increase has effectively created more matches, more outcomes, and more trading opportunities—especially around qualification and match advancement markets.
Knockout-stage matchups appear to be particularly attractive to traders. For example, Canada’s Round of 16 match against Morocco—scheduled for Saturday—had generated more than $48 million in trading volume on Kalshi and over $26.8 million on Polymarket at the time of reporting.
The pattern extends to the US Round of 16. Kalshi’s market on which team advances recorded more than $2.1 million in volume, while a comparable Polymarket market attracted around $1.6 million as of Saturday. While these figures are smaller than the Canada–Morocco matchup, they show how quickly attention can shift between fixtures as brackets lock in.
What matters for market participants is not just overall volume, but where it concentrates. World Cup-related contracts create repeatable, time-bound narratives that traders can model—often with clear deadlines and an intense news cycle. That combination helps explain why notional activity can spike even for markets that are narrower than broad political or macro event themes.
Regulatory pressure rises as trading expands
The World Cup-driven surge is occurring against a backdrop of growing controversy over prediction markets in the United States. Earlier this year, Cointelegraph noted that by March nearly a dozen US states had moved against companies including Kalshi and Polymarket. Some states sought to halt such markets, while others argued they should be brought under existing gambling laws and related tax regimes.
At the federal level, regulators have pushed back. In the following month, CFTC Chair Michael Selig accused states of pursuing what he called “illegal enforcement actions” against federally regulated exchanges. In remarks reported via a CFTC press release, Selig argued that Congress granted the agency sole authority over commodity derivatives markets, which can include prediction markets, warning that any state effort to nullify federal law could lead to court challenges.
This is not merely an abstract legal dispute. For platforms, regulatory uncertainty can influence which contracts can be offered to different users, how product structures are shaped, and what compliance costs may look like in practice. For traders, the risk is that market access could change rapidly depending on court outcomes or agency interpretations.
Congress and Europe weigh in with different approaches
The debate is also expanding beyond regulators and into Congress. In June, casino operators, tribal organizations, and labor groups urged lawmakers to amend the Digital Asset Market Clarity (CLARITY) Act by removing sports-event contracts from the CFTC’s authority. Their argument, as described in Cointelegraph reporting, is that sports contracts should instead remain under state gambling laws and existing gaming oversight.
Europe’s approach is different. In a recent reminder, the European Securities and Markets Authority (ESMA) told firms that many event contracts may already fall under existing restrictions tied to binary options. ESMA’s stance emphasized that whether a product is regulated depends on its characteristics rather than merely the label “event contract.” For market operators contemplating cross-border expansion, that distinction is crucial: product design details, not marketing terminology, can determine regulatory treatment.
Taken together, the picture is uneven. The US environment appears to hinge on jurisdiction—whether prediction markets are treated as commodity derivatives under federal authority or as gambling under state law. In Europe, the focus shifts more toward how the contract functions under binary-options-like rules. These differences can shape where liquidity travels, which venues can scale fastest, and how quickly new market formats can be launched.
What to watch next
With the World Cup supplying an immediate, high-volume catalyst, the key question for investors and builders is whether these trading surges translate into longer-term user growth or just prove how concentrated liquidity becomes during major events. Just as importantly, readers should track how ongoing legal challenges—and potential congressional or European regulatory clarifications—affect market access, contract structures, and the durability of platform volume beyond the tournament.

Serena Williams – live: Wimbledon 2026 latest scores, results and order of play as comeback with Venus Williams cancelled at last minute

NetNut cracked as Google and FBI target 2 million-device botnet
Leaked footage shows astonishing first look INSIDE Taylor Swift and Travis Kelce’s wedding: See the bride’s aisle, altar and couple’s personal touches as A-listers vanish through MSG castle’s ‘magic doors’


-

 Fashion1 day ago
Weekend Open Thread: High Hopes
-

 Tech7 days ago
Bluekit phishing kit adopts browser-in-the-middle for login theft
-

 Tech7 days ago
Claude Code turned every engineer into three. Now companies need more product thinkers
-

 Crypto World5 days ago
Strategy authorizes up to $1.25B in Bitcoin sales under new capital plan
-

 Politics1 day ago
The House | “Reframing the debate from a binary discussion of winners and losers”: Yuan Yang reviews ‘We Are Not Machines’
-

 News Videos6 days ago
MAJOR BITCOIN & MARKET UPDATE!!!! (MUST WATCH ASAP!!!)
-

 Tech5 days ago
Anonymous researcher drops 0-day ‘exploitarium’ repo
-

 Business5 days ago
Australia treasurer says alleged access of prime minister’s bank data ’incredibly concerning’
-
 Business5 days ago
The AI boom won’t burst all at once. It will pop in ‘rolling bubbles’: Macquarie
-

 Sports3 days ago
Broncos roster: OL Ben Powers (No. 74) entering final year of contract
-

 NewsBeat4 days ago
Presenter Caroline Flack’s brother Paul Flack dies aged 55
-

 Crypto World3 days ago
Binance stock trading tops $1B in first month after launch
-
 NewsBeat2 days ago
New exhibition reflects five decades of movement between island of Ireland and GB
-

 Crypto World3 days ago
Alibaba-affiliate Ant Group enters the humanoid robot market with 12 deals
-

 News Videos4 days ago
How to Build INSANE Live Financial Dashboards With Claude
-

 Business3 days ago
Meta Platforms Stock Jumps 7% Today as Bloomberg Reports Company Plans to Enter the Cloud Business
-

 Business2 days ago
What a 10 Percent Drop Means for Buyers, Sellers and Renters
-

 Crypto World2 days ago
Binance Re-Enters Philippines As EU MiCA Rules Restrict Access
-

 Tech5 days ago
The attack that hijacked Claude Code came through Sentry. Datadog, PagerDuty, and Jira have the same exposure.
-
 Business5 days ago
PRISM’s IPO filing mentions Zostel case, CCI investigation
You must be logged in to post a comment Login