

Crypto World
Bitcoin and several major altcoins are at a crucial juncture
Key points:
- Bitcoin has reached a crucial support, as a break below the $79,000 level may deepen the pullback.
- Several major altcoins are facing selling pressure, indicating that the bears remain in the game.
Bitcoin (BTC) extended its pullback on Wednesday and slipped below the $80,000 level. However, analysts remain optimistic about BTC’s prospects in the near term.
Analyst CRG said in a post on X that BTC did not break above the Ichimoku cloud even once during the previous bear market, and when it did, a new bull market started. Interestingly, BTC has risen comfortably above the Ichimoku cloud, weakening the comparison with the previous bear market cycle.
Another bullish projection came from Maelstrom chief investment officer Arthur Hayes, who said in a Substack post that BTC “retaking the $126,000 is a foregone conclusion.” He expects BTC to pick up momentum after breaking above $90,000, where “many call over-writers will rush to cover as their strike gets taken out.”
Hayes expects the AI sector race with China and the ongoing war with Iran to result in money printing, benefitting the crypto ecosystem.
BTC’s bullish view is not shared by everyone. A BTC whale, known by the moniker ‘pension-usdt.eth,’ is short 1,000 BTC, worth roughly $81 million, with 3x leverage. The trade, which was opened when BTC was at $67,990, is down about $13 million, but the trader confirmed on X that he was still short as “the trade makes sense.”
Could BTC and the major altcoins rebound off their support levels? Let’s analyze the charts of the top-10 cryptocurrencies to find out.
Bitcoin price prediction
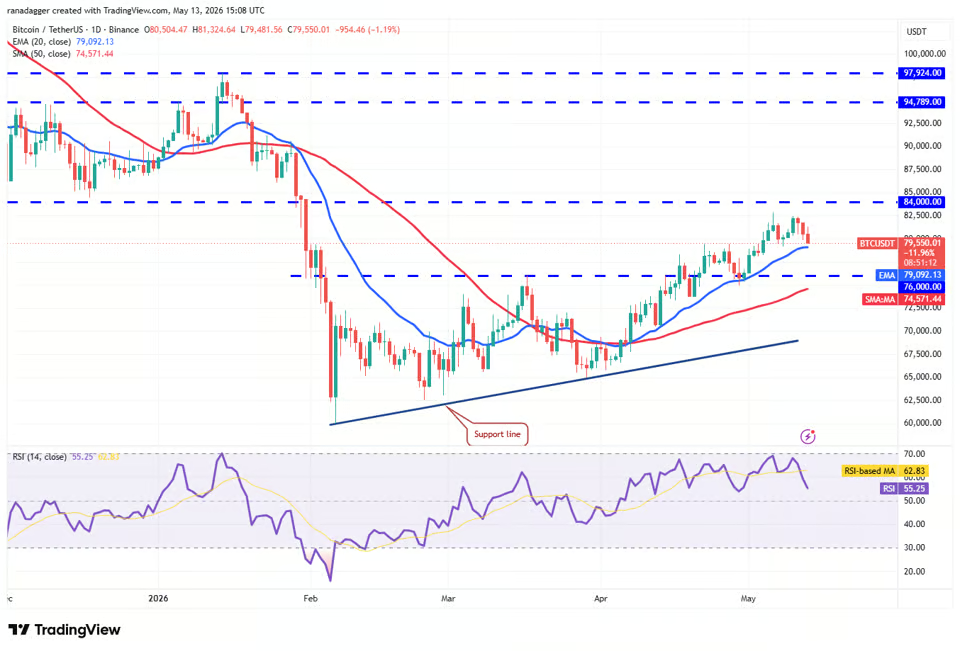
BTC has dipped to the 20-day exponential moving average ($79,092), which is a critical near-term support to watch.

BTC/USDT daily chart. Source: Cointelegraph/TradingView
If the price rebounds off the 20-day EMA with strength, the bulls will try to push the BTC/USDT pair above the $84,000 resistance. If they succeed, the BTC price is expected to pick up momentum and skyrocket toward $92,000 and subsequently to $97,924.
This bullish view will be invalidated in the near term if the price continues lower and breaks below the 20-day EMA. That suggests traders are booking profits. That may start a deeper pullback toward the 50-day simple moving average ($74,571) and later to the support line.
Ether price prediction
Ether (ETH) attempted to start a recovery from the 50-day SMA ($2,245), but the long wick on the candlestick shows selling at higher levels.

ETH/USDT daily chart. Source: Cointelegraph/TradingView
A break and close below the 50-day SMA opens the doors for a drop to the support line of the ascending channel pattern. Buyers are expected to fiercely defend the support line, as a close below it may sink the ETH/USDT pair to $1,916.
The first sign of strength will be a break and close above the $2,465 resistance. The ETH price may then ascend to the resistance line, which is a critical level to watch. A break above the resistance line may catapult the pair toward $3,050.
BNB price prediction
BNB (BNB) rebounded off the 20-day EMA ($643) on Tuesday and reached the $687 overhead resistance on Wednesday.

BNB/USDT daily chart. Source: Cointelegraph/TradingView
The upsloping 20-day EMA and the RSI near the overbought zone signal that the bulls have the upper hand. A close above the $687 level opens the doors for a rally to $730 and later to $790.
Sellers will have to tug the BNB price back below the 50-day SMA ($623) to weaken the bulls. If they manage to do that, the BNB/USDT pair may consolidate inside the $570 to $687 range for a while longer.
XRP price prediction
XRP (XRP) has been stuck between the downtrend line of the descending channel pattern and the moving averages for the past few days.

XRP/USDT daily chart. Source: Cointelegraph/TradingView
A tight consolidation below a crucial resistance suggests that the bulls are holding on to their positions as they anticipate an upside breakout. If the downtrend line is scaled, the XRP/USDT pair may surge to $1.61. Sellers are expected to defend the $1.61 level with all their might, as a close above it signals a potential trend change. The XRP price may then soar to $2.40.
Conversely, a close below the moving averages suggests that the bulls have given up. The pair may then descend to the $1.27 level, where the buyers are expected to step in.
Solana price prediction
Solana (SOL) turned down from the $98 resistance on Tuesday, indicating that the bears are active at higher levels.

SOL/USDT daily chart. Source: Cointelegraph/TradingView
The upsloping 20-day EMA ($89) and the RSI in the positive territory indicate an advantage to buyers. If the price rebounds off the 20-day EMA, the bulls will again attempt to pierce the $98 resistance. If they can pull it off, the SOL/USDT pair may climb to $106 and then to $117.
This positive view will be negated in the near term if the SOL price continues lower and breaks below the 20-day EMA. Such a move suggests that the pair may continue to oscillate between $76 and $98 for some more time.
Dogecoin price prediction
Dogecoin (DOGE) bounced off the 20-day EMA ($0.10) on Tuesday, indicating that the bulls are viewing the dips as a buying opportunity.

DOGE/USDT daily chart. Source: Cointelegraph/TradingView
The bulls tried to clear the $0.12 overhead hurdle but are facing significant resistance from the bears. However, if the bulls prevail, the DOGE/USDT pair may rally to $0.14 and subsequently to $0.16.
Sellers are likely to have other plans. They will attempt to defend the overhead resistance and pull the DOGE price back below the 20-day EMA. If they do that, the pair may extend its stay inside the $0.09 to $0.12 range for a few more days.
Hyperliquid price prediction
Hyperliquid (HYPE) continued lower and broke below the 50-day SMA ($40.55) on Tuesday, indicating profit-booking by short-term traders.

HYPE/USDT daily chart. Source: Cointelegraph/TradingView
If the price breaks below $38.70, it suggests that the HYPE/USDT pair may have topped out in the near term. The HYPE price may then tumble to $34.45.
Buyers have an uphill task ahead of them. Any recovery attempt is expected to face selling at the 20-day EMA ($41.56) and then in the $43.76 to $45.77 zone. The bulls will have to drive and sustain the price above the $45.77 level to signal the resumption of the up move. The pair may then surge to $50.
Related: Bitcoin to $100K in Q2? Strategy’s STRC unlocks potential to buy 3K BTC in two days
Cardano price prediction
Cardano’s (ADA) pullback is attempting to find support at the 20-day EMA ($0.26), but the bears continue to exert pressure.

ADA/USDT daily chart. Source: Cointelegraph/TradingView
If the price continues lower and breaks below the moving averages, it suggests that the ADA/USDT pair may remain inside the $0.22 to $0.31 range for a few more days.
Buyers will have to fiercely defend the moving averages and start a rebound off it to signal strength. The ADA price may then rise to $0.29 and later to $0.31. Sellers are expected to defend the $0.31 level, as a close above it indicates the start of a new up move. The pair may soar to $0.36 and eventually to the pattern target of $0.40.
Zcash price prediction
Zcash (ZEC) bounced off the $560 level on Tuesday, but the bulls could not sustain momentum on Wednesday.

ZEC/USDT daily chart. Source: Cointelegraph/TradingView
If the ZEC price closes below the breakout level of $560, it signals profit booking by short-term traders. The ZEC/USDT pair may then slump to the 20-day EMA ($481). A deeper correction to $400 may begin if the 20-day EMA cracks.
Contrarily, if the price bounces off the 20-day EMA with force, it suggests that the bulls remain in charge. Buyers will then make one more attempt to drive the price above the $643 level. If they succeed, the pair may surge to $750.
Bitcoin Cash price prediction
Bitcoin Cash (BCH) fell below the moving averages and the $443 support on Tuesday, indicating that the bears have an edge.

BCH/USDT daily chart. Source: Cointelegraph/TradingView
Sellers will attempt to pull the BCH price to the solid support at $419. Buyers are expected to aggressively defend the $419 level, as a close below it may resume the downtrend. The next stop on the downside may be $375.
Instead, if the price turns up sharply from $419 and breaks above the moving averages, it suggests that the BCH/USDT pair may remain range-bound for some more time. Buyers will be back in the driver’s seat on a close above $486.


The Trump administration’s decision to cut foreign access to Anthropic’s most powerful AI models was reportedly set in motion by outreach from Amazon CEO Andy Jassy, after researchers found a potential way to coax the company’s “Fable 5” model into producing information that could be repurposed for cyberattacks. The episode escalated quickly into White House-level review and culminated in export controls that, according to Anthropic, followed a U.S. directive.
As the dispute unfolded, U.S. regulators also demonstrated how fast access to a widely used AI system can be curtailed—an event that traders linked to a rebound in several decentralized “AI token” projects on Friday and Saturday. The move has reignited questions about how AI safety issues are assessed, communicated, and ultimately enforced across borders.
Key takeaways
- According to The Wall Street Journal, Amazon CEO Andy Jassy contacted senior U.S. officials after Amazon researchers identified a prompt-based workaround affecting Anthropic’s Fable 5.
- The White House reportedly moved to impose export controls and engaged Anthropic leadership; Anthropic pushed back and said it was working to restore access for users.
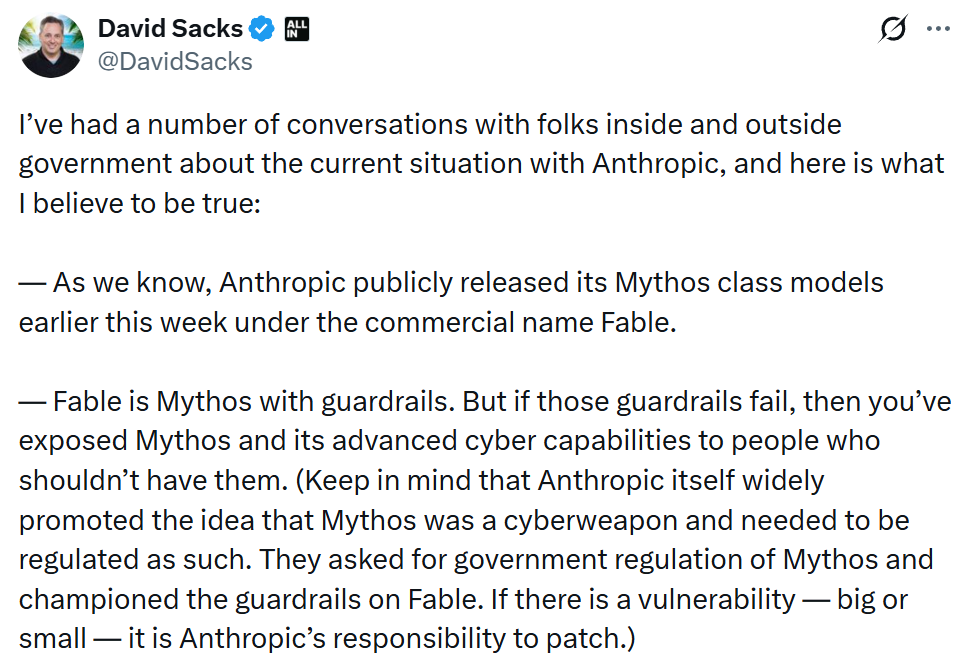
- David Sacks, co-chair of the President’s Council of Advisors on Science and Technology, said the administration acted “reluctantly” and hoped Anthropic would fix the jailbreak issue quickly.
- On-chain and token-linked markets appeared to react to the sudden availability shift, with decentralized AI-related tokens posting gains over the same period.
How the alleged “jailbreak” concern reportedly triggered export controls
In a report cited by The Wall Street Journal, the core catalyst was described as a method discovered by Amazon researchers that could prompt Anthropic’s Fable 5 into returning information that might be used in cyberattacks. The WSJ reports that Jassy reached out to senior U.S. officials on Thursday after that finding, along with similar warnings from at least five other firms.
Those escalations reportedly led to a “frantic shuffle” within the White House to assess the threat and to contact Anthropic CEO Dario Amodei. According to the Politico reporting referenced in the original account, Amodei pushed back on the administration’s concerns and asked to resolve them through voluntary cooperation rather than immediate removal of access.
Anthropic ultimately said it believed the U.S. directive stemmed from a misunderstanding of the threat, describing the issue as a “non-universal jailbreak” that came from an unnamed report. In earlier coverage from Cointelegraph, Anthropic was reported to have suspended access to its new model—an action tied to the U.S. directive.
What Anthropic and U.S. officials said—and what remains disputed
One signal of where the disagreement may lie is the framing of the risk. Anthropic’s blog post, as described in the reporting, suggests the administration’s understanding of the jailbreak’s scope may have been overstated. The company’s view was that the jailbreak was not “universal,” implying it would not reliably work across prompts and contexts.
Still, U.S. officials acted decisively. David Sacks told X on Saturday that the administration issued the export control in response to the situation and that it was “very surprised” Anthropic did not want to cooperate on a “reasonable safety request” to fix the jailbreak issue. Sacks characterized the administration’s approach as cautious and reluctant, but nonetheless committed to the safety request and the goal of restoring access after remediation.
The original reporting also states that Amazon did not confirm whether it spoke directly with government officials about the models. In an emailed statement, an Amazon spokesperson said that it is common for governments to seek counsel on potential security risks and that the company does not share details of those discussions when they occur. That leaves some of the exact internal communications unclear, even as the WSJ account links Jassy’s outreach to the administration’s subsequent decision.
Why the “switch-off” matters for AI providers and users
Beyond the specific model dispute, the episode highlights a practical reality for AI users and integrators: access to a U.S.-linked model can be restricted quickly, even for high-demand systems. Cointelegraph’s earlier coverage noted that the directive forced Anthropic to pull its model from public availability, and the current reporting ties the export control to the same turning point.
For enterprises that depend on frontier models—whether for customer-facing applications, research workflows, or operational automation—the risk is not only technical but operational. A safety finding, a regulatory determination, or even a disagreement about the severity of a vulnerability can translate into abrupt availability changes. That can affect uptime, roadmap planning, compliance reporting, and model routing strategies across vendors.
Anthropic stated it is working to restore access for its users. Sacks’ comments add what many market participants will likely focus on next: whether remediation happens fast enough to satisfy regulators and lead to removal or easing of the export control.
Token markets react to sudden access restrictions
The crackdown also appeared to ripple into crypto markets tied to decentralized AI narratives. The original reporting describes the U.S. government’s ability to rapidly disable access to U.S.-based AI models as a factor behind gains in several decentralized AI tokens over Friday and Saturday.
According to the cited CoinGecko pricing data, Bittensor’s native token rose 23.9% over the past 24 hours referenced in the article. Bittensor is described as a decentralized AI protocol enabling people to build and monetize AI models. The reporting also cited Venice Token (VVV) up 16% and Near Protocol’s token rising 6.2%, with Near positioned as infrastructure for decentralized AI agent applications.
While these moves do not necessarily indicate a direct causal relationship between the export control and token valuations, the timing underscores how quickly crypto markets can respond to policy-driven changes in the broader AI ecosystem. For traders and long-term holders, the key question is whether the market is reacting to the news itself or to expectations that decentralized models and infrastructure will gain relative attention if centralized providers face recurring regulatory constraints.
As the situation develops, readers should watch for concrete updates from Anthropic on remediation efforts, as well as any indications that regulators are prepared to lift or modify the export controls. The central uncertainty remains whether the jailbreak risk is viewed as sufficiently resolved—and how regulators will define “enough” safety to re-enable broader access.
The Trump administration’s decision to cut foreign access to Anthropic’s most powerful AI models was reportedly triggered by calls from Amazon CEO Andy Jassy.
According to a report from The Wall Street Journal, Jassy contacted senior government officials on Thursday after Amazon researchers discovered a way to prompt Anthropic’s Fable 5 model into returning information that could be used for cyberattacks.
The call, along with warnings from at least five other firms, led to a frantic shuffle within the White House to gauge the threat and contact Anthropic CEO Dario Amodei, who reportedly pushed back on the administration’s concerns and requests to voluntarily pull the model.
“In reaction, the Admin issued the export control. The Admin did this reluctantly,” said David Sacks, the co-chair of the President’s Council of Advisors on Science and Technology, on Saturday. “It’s been very surprised that Anthropic hasn’t wanted to cooperate with a reasonable safety request (ie fixing the jailbreak issue).”

Source: David Sacks
The episode sheds light on what led to the US directive that forced Anthropic to pull its new model from the public on Friday night. Anthropic Claude is estimated to have around 18,900 monthly active users.
In a blog post on Friday, Anthropic said it believed the US directive was the result of a misunderstanding about the threat posed by a “non-universal jailbreak,” which came from an unnamed report.
Amazon did not confirm if it spoke to government officials about Anthropic’s models.
“As a leading cloud provider that serves a large number of private and public sector customers, it’s not uncommon for governments to seek our counsel on potential security risks,” a spokesperson said. “When they occur, we don’t share the details of these discussions.”
Anthropic said it is working to restore access for its users.
Related: Anthropic suspends access to Fable 5, Mythos 5, citing US directive
“The Admin’s hope now is that Anthropic remediates the safety issue,” Sacks said, which would see the export control lifted, and Fable goes back into general release.
“The Admin wants all of this to happen as soon as possible.”
AI tokens surge after Anthropic crackdown
The episode has also demonstrated the US government’s ability to promptly switch off access to US-based AI models on command, leading to a rally in decentralized AI tokens on Friday and Saturday.
The native token of Bittensor, a decentralized AI protocol that lets people build and monetize artificial intelligence models, which some refer to as “the Bitcoin of AI,” surged 23.9% over the past 24 hours.
Venice Token (VVV), the native utility and privacy coin powering Venice AI, a decentralized, uncensored AI platform founded by Erik Voorhees, rose 16%.
Near Protocol, a blockchain project building the infrastructure to support a decentralized AI agent economy, rose 6.2%.
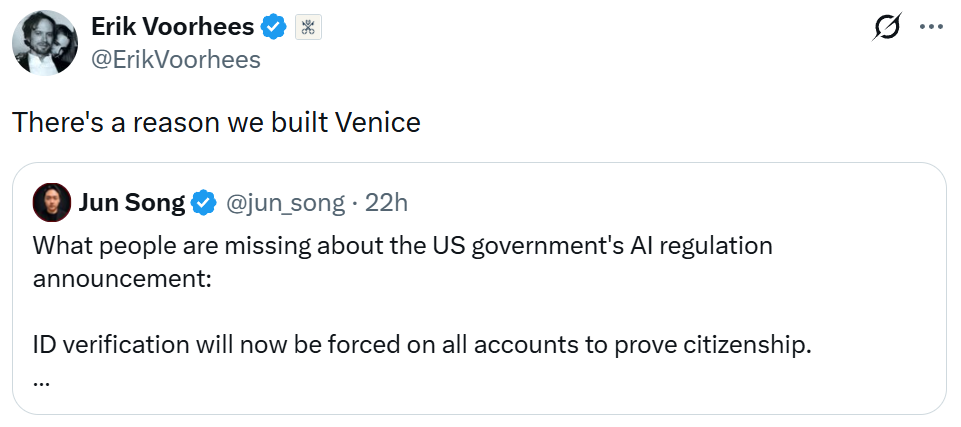
Source: Erik Voorhees
Magazine: Bitcoin, the ‘canary in the coal mine,’ XRP transaction demand falls 91.5%: Market Moves
Iran has disputed US President Donald Trump’s claim that a deal ending the war will be signed on Sunday, with the Islamic Revolutionary Guard Corps calling the timeline false and the framework unfinished.
The clash surfaced as both sides signaled a broader agreement was close, one that would replace a fragile 60-day ceasefire.
US and Iran Split on the Deal Signing Date
Trump said on Truth Social that the agreement would be signed on Sunday and that the Strait of Hormuz would open to all traffic immediately after.
This post came after Pakistan, acting as mediator, struck an optimistic tone. Prime Minister Shehbaz Sharif said the parties were closer than ever and that Islamabad was preparing for an electronic signing.
“We are closer to a peace deal than ever before. With finalisation likely expected in the next 24 hours,” the post read.
Tehran pushed back fast. A source cited by Iran’s Fars News Agency called reports of a finalized deal on Sunday completely false.
Follow us on X to get the latest news as it happens
The Islamic Revolutionary Guard Corps (IRGC) described the timeline as a test for Iran’s negotiating team and said the memorandum was not yet finalized. The Guard linked Trump’s insistence to his birthday, suggesting a publicity motive.
“A notable point is that Sunday coincides with June 14, Trump’s birthday. Some observers consider it likely that, through this insistence, he is seeking to exploit the occasion symbolically and turn it into a publicity event for himself. But given the clear position of Iranian officials that the agreement is not finalized, it appears our country’s negotiators are aware of these hidden layers and will not allow such a media and ceremonial maneuver,” the statement read.
Oil and Crypto Markets Brace for Monday
The dispute leaves markets waiting for confirmation when trading resumes Monday. A signed deal could pull oil prices lower after they climbed during the conflict.
Reopening the Strait of Hormuz would ease supply fears, since the waterway carries a large share of global crude shipments.
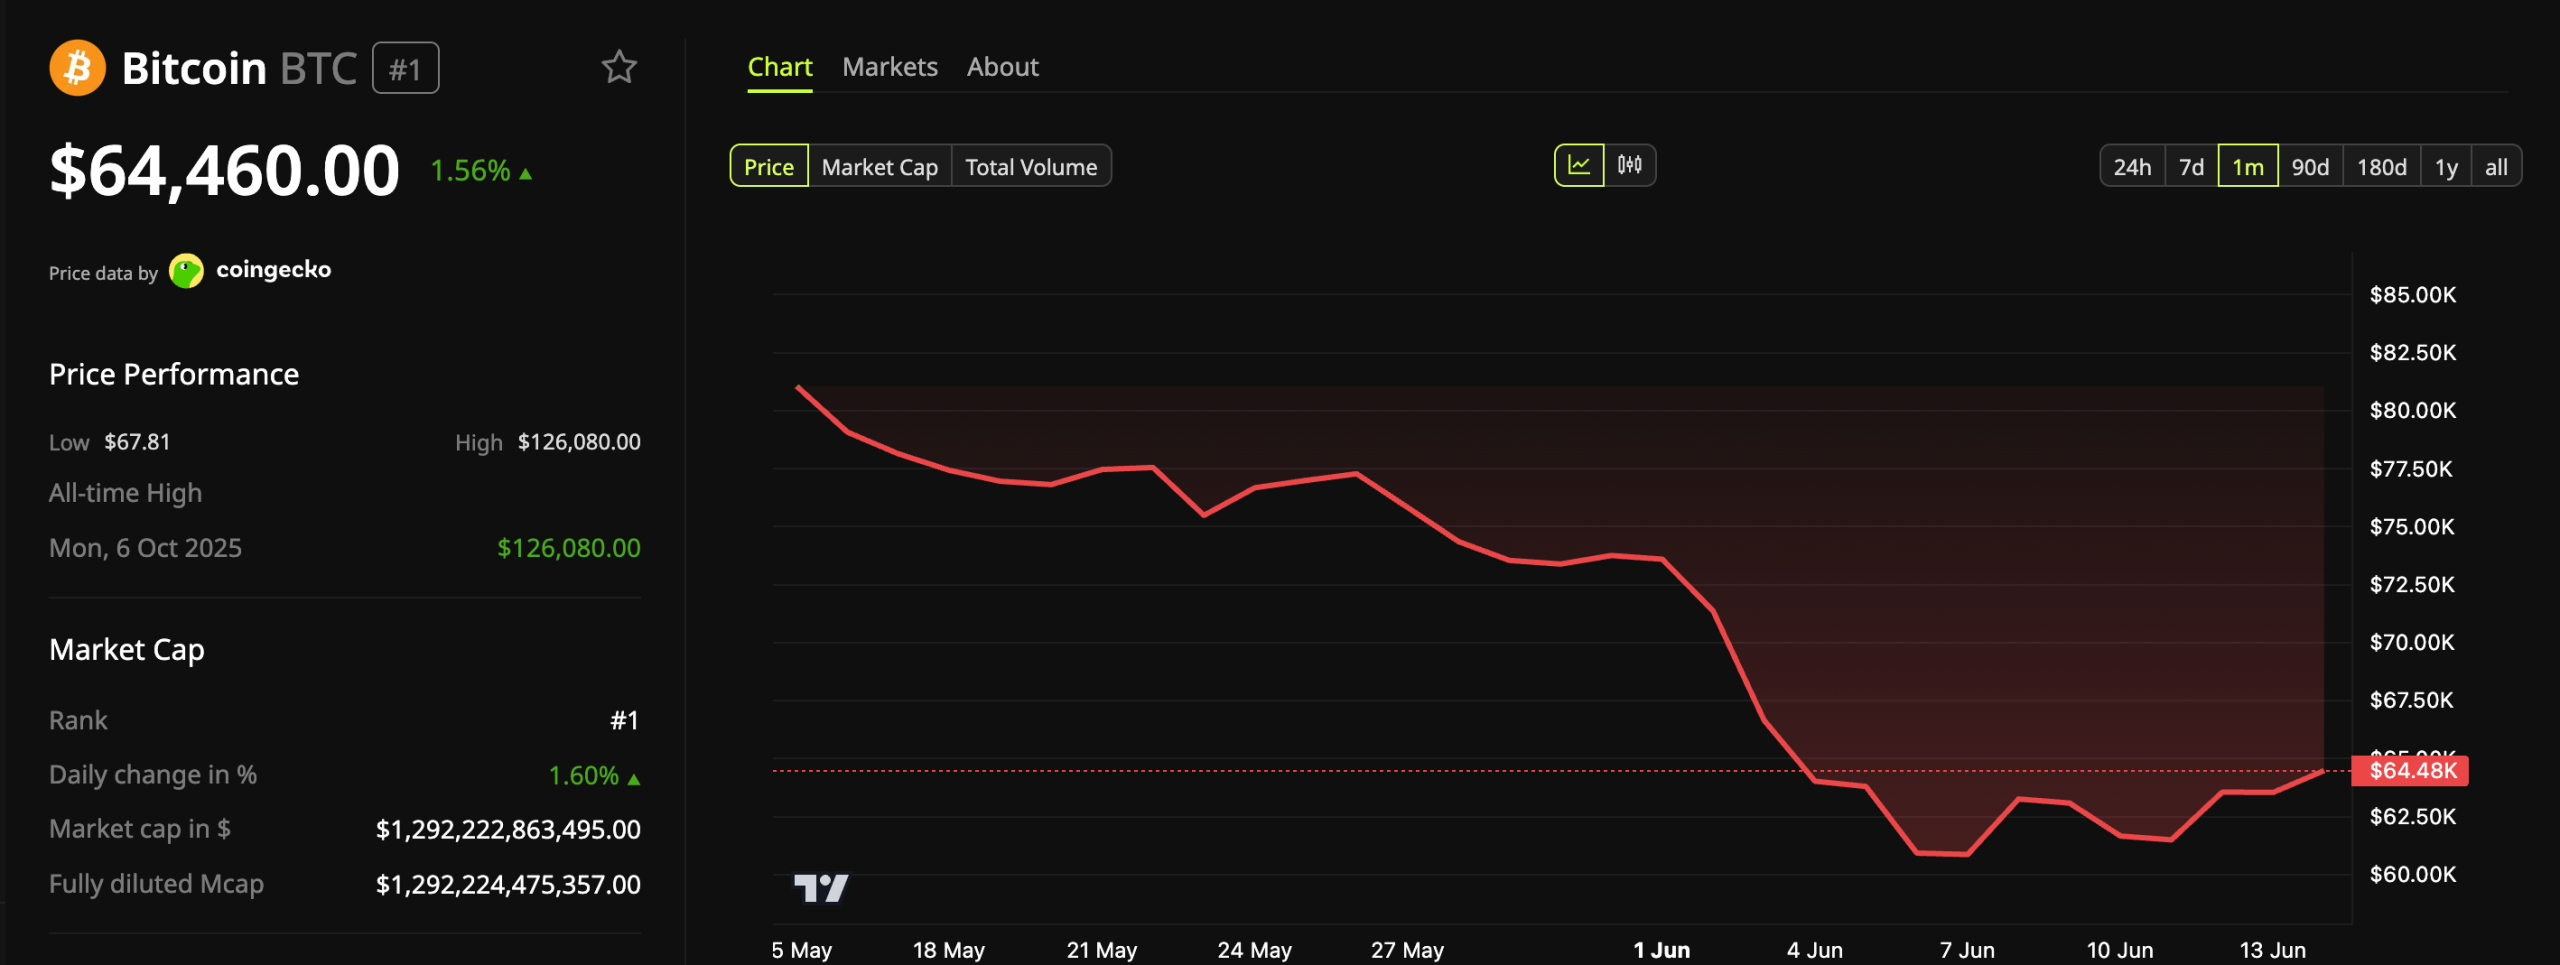
Crypto markets have already reacted to the headlines. Bitcoin (BTC) traded near $64,460, up about 1.56% over 24 hours, while the total crypto market rose roughly 1%.

The recovery followed Pakistan’s 24-hour signing claim. However, sentiment stayed cautious, with the Crypto Fear and Greed Index near 18.
A confirmed agreement could extend the relief move. Any delay or fresh clash, in contrast, could pressure oil and digital assets again.
Subscribe to our YouTube channel to watch leaders and journalists provide expert insights
The post Iran Contradicts Trump on Timing of Peace Deal Signing appeared first on BeInCrypto.

Public crypto token sales have raised just $58 million in Q2 2026, according to data published by CryptoRank on June 10, a drop of 85% from the previous quarter.
It means that the period is well on the way to becoming the weakest fundraising quarter for ICOs, IDOs, and IEOs in five years.
Public Fundraising Is Drying Up Across Crypto
CryptoRank’s data showed that Q1 2026 had already looked weak, with about $390 million raised across 105 sales, but things have deteriorated even further in the second quarter.
The severity of the situation is even clearer in the month-by-month breakdown: April saw just $15 million raised across 20 sales, while May brought in around $41 million from just 13 sales, marking the lowest monthly count since December 2020.
June, which is still in progress, has so far recorded just 4 sales that raised about $2 million. To put that in context, January 2025 alone saw $654 million raised, with that quarter serving as the cycle peak, as 429 sales raised just under $850 million. Since then, the market has shed more than 93% of its quarterly fundraising volume in dollar terms.
Still, CryptoRank’s dashboard shows that public token sales raised more than $4 billion between the first quarter of 2024 and the second of 2026.
In that time, IDOs were consistently the dominant format, accounting for nearly 75% of all public sales. IEOs and ICOs respectively made up 18% and 7% of activities. However, all three formats have contracted quite sharply this quarter.
Among launchpads, Coinlist is the largest by capital raised, having handled $1.37 billion. It is followed by Fjord Foundry with $975 million and Echo at $201 million, with Gate Launchpad and DAO Maker rounding off the top five.
Venture Capital Is Still Active
According to a May report by Galaxy Digital, crypto venture capital activity also slowed in Q1 2026. In that period, private investors put in some $4 billion in 355 deals, a 50% drop from the previous quarter, the report said.
Galaxy Digital noted that the decline was mainly due to a lack of huge late-stage rounds that had dominated late 2025, but there have still been a few large raises occurring recently. One such example is Digital Asset Holdings’ $355 million raise in a new round led by Andreessen Horowitz, which came just a month after it pulled in $300 million.
CryptoRank’s figures suggest that while capital is still available in crypto, it is increasingly concentrated in a smaller number of companies and private funding rounds rather than public token launches. Those hit their peak when sentiment was strongest, but they seem to have since tracked the broader market lows.
This can be seen from a previous report also published by CryptoRank that showed many of the projects that had been funded between April and June 2025, when the crypto market was enjoying a rebound, ended that year trading well below their fundraising valuations.
And that may explain why retail appetite for new launches has dried up so completely in 2026.
The post Crypto Public Token Sales on Track for 5-Year Lows in Q2 2026 appeared first on CryptoPotato.

Lawmakers in Brazil have advanced a bill that would let authorities freeze cryptocurrency assets linked to investigations. This bill is part of an effort to combat online fraud and organized crime in Brazil.
The bill is called PL 5819/2025. A committee in Brazil’s Chamber of Deputies approved it. If this bill becomes a law, courts will have the power to freeze crypto holdings stored on exchanges and other financial platforms when people are under investigation for cyber fraud and related offenses.
Authorities Gain Broader Powers Over Digital Assets
Judges will be able to order the blocking of cryptocurrency balances along with bank accounts. Supporters of this bill say criminals use assets to move and hide funds, making it hard for investigators to recover stolen money.
This bill also aims to strengthen penalties for cyber fraud. Prison sentences for online fraud offenses could rise from four to eight years to six to ten years. People linked to criminal groups may face even harsher punishments.
The proposal builds on Brazil’s efforts to keep an eye on digital assets. This year, President Luiz Inácio Lula da Silva signed a law that lets authorities freeze, seize, and even liquidate cryptocurrencies connected to criminal activities. The law also allows confiscated crypto assets to fund public security programs, including police equipment, intelligence operations, and officer training.
Brazil Tightens Crypto Oversight
Brazil has become one of the most active crypto markets in Latin America, so regulators are introducing stricter rules for the sector. The country’s central bank recently implemented requirements for virtual asset service providers, including stronger anti-money laundering measures and cybersecurity standards.
Regulators say this cyber fraud bill is aimed at stopping criminals from exploiting assets while ensuring law enforcement can respond more effectively to online financial crimes.
Conclusion
Brazil’s latest legislative push shows that the country is serious about stopping cyber fraud and organized crime. By expanding the government’s ability to freeze and recover cryptocurrency assets, lawmakers hope to close loopholes used by criminals while strengthening the framework surrounding digital assets. If this bill is approved, it could make Brazil one of the region’s more proactive regulators of the crypto industry. Brazil and crypto will be closely watched as this bill moves forward.
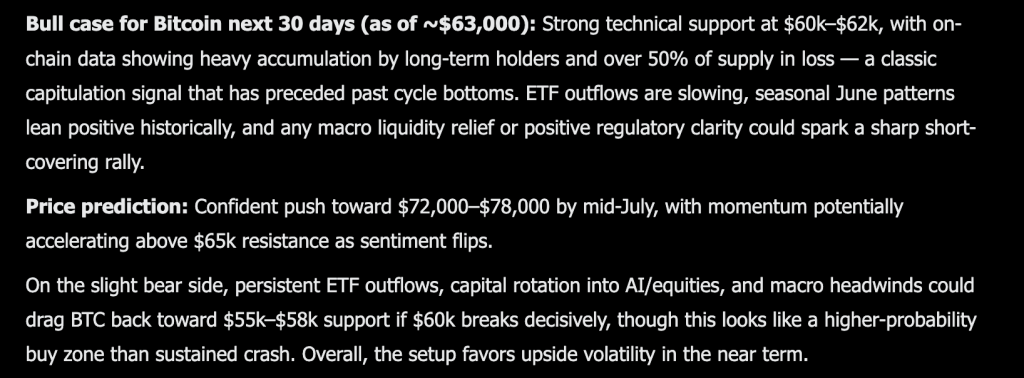
Here is the thing about capitulation calls. They only sound smart in hindsight. Right now, with Bitcoin price scraping along the low $60,000s, calling for a run to the mid $70,000s feels like wishful thinking. Elon Musk’s SpaceX AI is making predictions anyway, pinning a 30-day target of $72,000 to $78,000 on a coin that just got cut nearly in half.
From $63,000, that is a 14% to 24% bounce, and the entire argument rests on the idea that the people selling right now are the ones who always sell at the bottom.
That is really what the bull case comes down to. More than 50% of supply is sitting in loss, which xAI reads not as weakness but as the classic capitulation flush that has marked the floor in past cycles.

Long-term holders are quietly accumulating into that fear, ETF outflows are drying up, and June has a habit of leaning green historically.
Add even a whiff of macro liquidity relief or regulatory clarity and you get the spark for a violent short-covering rally.
The confident version of this story has BTC pushing through $65,000 resistance and accelerating toward the mid $70,000s by mid July as sentiment flips.
xAI is honest about the other side, though. If $60,000 gives way decisively, capital keeps bleeding into AI and equities, and macro stays heavy, Bitcoin slips toward $55,000 to $58,000.

The interesting tell is that it frames that drop as a higher-probability buy zone rather than the start of a real crash. In other words, even the downside scenario is treated as a discount, not a disaster.
Bitcoin Price Prediction: Where The Sellers Run Out Of Sellers
So does the chart back any of this up. Pull up the daily and the damage is obvious. Bitcoin is at $63,024 after a long ugly slide from the $126,000 peak set back in October, a drop that has erased more than half the move.
The trend is unmistakably down, lower high after lower high, and the latest leg just dumped price into the low $60,000s where it printed a candle near $60,000 before this small bounce.
But that exact zone is the whole story. This $60,000 to $62,000 shelf is where buyers stepped in hard back in February, and it is the floor xAI is leaning on.
Lose it on a daily close and $58,000 opens up quickly, with $55,000 underneath. Hold it, and the first real test is $65,000, the level that has to crack before any of this turns into momentum, with $72,000 and the heavier $76,000 ceiling stacked above.
The RSI is the part that actually agrees with the bulls. It is sitting at 31.95 with the signal line at 25.74, so price momentum has flushed into deeply oversold territory but has already curled back above its own average.
That roughly 6 point gap, with RSI now leading the signal higher, is the early fingerprint of selling exhaustion rather than fresh downside.
It is not a buy signal on its own, but it is exactly what you would expect to see if xAI is right that the weak hands are nearly done. Reclaim $65,000 with this momentum building underneath and that mid $70,000s target stops looking like wishful thinking and starts looking like the path of least resistance.
You Might Like What SpaceX AI Predicts About LiquidChain
Large caps are not in trouble. They are just out of the room. Bitcoin, Ethereum, and XRP have been testing the same ceilings for weeks with nothing breaking through.
Every macro catalyst has a new arrival date. Every institutional wave has a new quarter attached to it. Holding assets where the next leg depends entirely on someone else’s decision is not a trade. It is a waiting room.
The money that wins cycles never announces where it is going.
The capital that actually moves in cycles relocates before the destination has a name.
Small market cap infrastructure plays operate on physics that large caps simply cannot replicate. A rotation that would not register as a rounding error at Bitcoin’s scale can reprice an undiscovered project by multiples.
The opportunity lies in the distance between what something is genuinely worth and what the market has assigned it so far. That distance shrinks to zero the moment discovery happens. Before that moment, it is fully capturable.
Multi-chain fragmentation is one of the most consistently expensive problems in DeFi, and it has never been solved. Bitcoin, Ethereum, and Solana exist as completely isolated systems. No shared architecture. No native interoperability. Every time value moves between them, the disconnection extracts its cost in fees, slippage, and failed transactions. That cost hits every single crossing every single time.
LiquidChain makes the crossing free as SpaceX xAI predicts. All 3 networks inside one execution environment. Single deployment. Complete ecosystem access. No tax on any interaction.
The presale is at $0.01454 with just over $830,000 raised. Early and undiscovered.
Execution is unproven. Adoption is unknown. Established assets offer predictability toward a ceiling that the market already sees. LiquidChain is an entry point that does not exist once the market finds it.
Explore the LiquidChain Presale
The post Elon Musk SpaceX AI Predicts Incredible Bitcoin Price For Next 30 Days appeared first on Cryptonews.

TLDR:
- Litecoin has entered the lower Fibonacci Adjusted Market Mean Price band, a zone tied to past accumulation phases.
- Whale and shark wallets holding at least 10,000 LTC have grown by 7% over the past five months despite flat prices.
- LitVM is bringing smart contract functionality to Litecoin via a zkLTC wrapper, renewing social media interest in LTC.
- Santiment data ranked Litecoin as the top trending coin, with retail volume expected to recover on any price rally.
Litecoin is drawing renewed attention from analysts and on-chain data providers as price action revisits historically significant support levels.
Whale and shark wallet growth continues alongside fresh ecosystem interest from LitVM, a smart contract project building on the Litecoin network.
Together, these developments are placing LTC under the spotlight at a time when broader market conditions remain uncertain.
Litecoin Price Revisits Key Fibonacci Support Region
Litecoin’s price has moved into what analysts describe as a structurally meaningful zone. According to crypto analyst Alphractal, LTC has touched the first lower level of the Fibonacci Adjusted Market Mean Price model.
This metric uses the Market Mean Price as a base and builds proportional Fibonacci bands to map expansion, mean reversion, and accumulation areas.
Historically, Litecoin has found support within the blue and green bands of this model during periods of market stress.
The green band, representing the lowest level, has marked points of strongest selling pressure across previous cycles. The blue region, where LTC currently sits, has also served as a relevant value area in past market structures.
On a logarithmic scale, Alphractal notes that Litecoin is once again approaching zones that historically attracted long-term investor attention.
The upper bands of this model have typically aligned with overheated market conditions and distribution risk. Lower bands, by contrast, tend to reflect discounted pricing relative to the asset’s structural mean.
The analyst added that while Litecoin remains weak in the short term, periods of extreme weakness have also marked the early formation of longer-term value. That framing has resonated with investors monitoring LTC’s positioning within the broader crypto market cycle.
Whale Accumulation and LitVM Fuel On-Chain Interest
On-chain data from Santiment adds another layer to the current Litecoin narrative. The number of whale and shark wallets holding at least 10,000 LTC has climbed by 7% over the past five months, even as price performance has remained relatively flat.
Santiment noted that accumulation from large holders often precedes major trend shifts before retail participants take notice.
Transaction volume tied to these larger wallets has also remained active during this period. Santiment’s data shows that any price rally could quickly draw retail participants back into the market, which would likely support broader volume recovery for LTC.
Much of Litecoin’s current social media traction stems from LitVM, a project introducing smart contract functionality through a zkLTC wrapper.
The platform has sparked debate among traders about whether it can generate meaningful utility and demand for Litecoin going forward.
Santiment confirmed that LTC ranked as the top trending coin across social data at the time of the report. Whether LitVM delivers on its promise remains an open question, but the conversation itself has refreshed interest in an asset that had largely faded from active discussion.


Rug pulls made up over 54% of all newly detected crypto scams, according to the latest data from the on-chain security analysis platform Web3 Antivirus.
The findings suggest that while scam tactics are still evolving, many attackers continue to rely on token projects that appear legitimate at first before contract controls are used to trap investors or drain liquidity.
Rug Pulls Are the Biggest Threat
In a June 9 breakdown on X, Web3 Antivirus also noted that honeypots, a different but related trick, came in second at around 22%, followed by fake tokens at roughly 12% and scam airdrops at just under 12%.
The mechanics behind rug pulls are what make these schemes so effective. As the security firm reported, they are created in such a way that, in their initial phases, they resemble normal market activity with increasing prices, trade volumes, and high activity in online forums.
The risk only becomes visible when the contract owners exercise hidden permissions that either prevent users from selling, remove liquidity, or otherwise lock funds.
“A token can look alive with the chart moving up and the community getting louder, but one owner-side action can change everything in secs,” wrote Web3 Antivirus. “The same contract controls that were invisible during the pump can suddenly become the reason users cannot exit, liquidity disappears and the chart collapses.”
Honeypots work on the same basic principle. Bad actors create a fake token and push it to the public with convincing marketing as a big investment opportunity. They even artificially push up the token’s value by making transactions themselves to create an illusion of high demand to attract unwitting investors.
However, as soon as people buy in, often at inflated prices, the underlying contract prevents any sale, with the scammers withdrawing the profits and exiting. Web3 Antivirus’s latest Scam Pulse data shows more than 425,000 rug pulls detected alongside 172,000 honeypots and over 94,000 scam airdrops.
In addition, of more than 100 million contracts the platform has analyzed, it has flagged almost 4 million as scams, with at least 3.1 million of those appearing within the last 30 days alone.
There has also been an uptick in the impersonation of token contracts, as seen in the security firm’s weekly leaderboard showing Ethereum leading with 291 fake token detections. Tether followed close behind at 270, and USDC at 225, with activity up across nearly every tracked asset compared to the previous week.
Delivery Methods Are Getting Harder to Spot
Beyond the on-chain mechanics, Web3 Antivirus also pointed out that AI is changing how scams are reaching users in the first place. The technology, according to them, now makes phishing emails, fake support chats, and fraudulent social media posts look polished enough to pass a quick visual check.
Per their data, emails are the most common delivery channel at 53%, followed by SMS at 10%, social media at 9%, and online ads at 8%. And there are examples across the industry, including an incident in May, where a fake Uniswap website drained at least $400,000 from users before the alarm was raised.
That same month, Ripple CTO Emeritus David Schwartz issued a warning to XRP investors about a fake airdrop and giveaway campaign targeting XRPL users.
And not long ago, Web3 Antivirus identified a phishing account posing as the Canton Network, complete with the project’s branding, that was using a supposedly official announcement post to redirect unsuspecting users to a scam URL.
The post Report: Rug Pulls Dominate Crypto Scams, Accounting for 54% of Threats appeared first on CryptoPotato.
Crypto World
Anthropic Suspends Fable 5 and Mythos 5 After US Government Issues Export Control Directive
TLDR:
- The US government issued an export control directive ordering Anthropic to suspend all Fable 5 and Mythos 5 access globally.
- Anthropic reviewed the jailbreak report and found the capabilities were already available in models like OpenAI’s GPT-5.5.
- The reported jailbreak involved asking Fable 5 to read a codebase and flag software flaws, with no harmful result disclosed.
- Anthropic warned the recall standard, if applied industry-wide, would effectively halt all frontier AI model deployments.
Anthropic has disabled global access to Fable 5 and Mythos 5 following a US government export control directive.
The order, received at 5:21pm ET, cites national security concerns tied to a reported jailbreak method. All other Anthropic models remain available.
The company says it is complying with the directive while disputing the technical basis for the decision.
Government Directive Targets Reported Jailbreak Method
The US government issued the directive without disclosing specific national security details in writing. Officials communicated verbally that they had learned of a method capable of bypassing Fable 5’s safeguards.
Anthropic reviewed a demonstration of this technique and found it exposed only minor, previously known vulnerabilities.
The company reviewed what it believes is the report behind the government’s decision. Anthropic stated that the level of capability displayed “is widely available from other models, including OpenAI’s GPT-5.5, and is used every day by the defenders who keep systems safe.” That review found no Fable-specific uplift in the findings.
The reported jailbreak essentially involved asking the model to read a codebase and identify software flaws. Anthropic confirmed it “has not even received a disclosure of a concerning non-universal potential jailbreak that led to a harmful result.” The potential jailbreaks disclosed were either entirely benign or classified as minor findings.
The directive requires suspending access for all foreign nationals, including Anthropic employees with foreign national status, both inside and outside the United States. The company said compliance meant disabling the models for all customers to avoid any breach of the order.
Anthropic Disputes the Standard Applied to Commercial Models
Anthropic launched Fable 5 with a defense-in-depth strategy, combining narrow jailbreak resistance with real-time monitoring and mandatory 30-day data retention.
The company acknowledged during launch that “perfect jailbreak resistance is not currently possible for any model provider.”
The 30-day data retention policy was a deliberate trade-off. It drew pushback from customers but allowed Anthropic to detect, study, and respond to jailbreak attempts quickly.
Anthropic described this as making jailbreaks “either narrow or very expensive to produce,” keeping risk levels comparable to other deployed models across the industry.
On the government’s authority to act, Anthropic said it “believes the government should have the ability to block unsafe deployments, as part of a statutory process that is transparent, fair, clear, and grounded in technical facts.” The company argued this directive did not meet those standards.
Anthropic warned that applying this recall standard broadly “would essentially halt all new model deployments for all frontier model providers.”
The company committed to releasing additional technical details within 24 hours and confirmed all other models in its lineup continue to operate without restriction.
Americans rank job loss as their biggest fear about artificial intelligence (AI), while curing diseases like cancer tops their hopes, according to a survey of nearly 52,000 people by Anthropic.
The findings expose a gap between what the public wants from AI and what it dreads, as real layoff data and political pressure over automation build across the United States.
Job Loss Outranks Every Other AI Fear
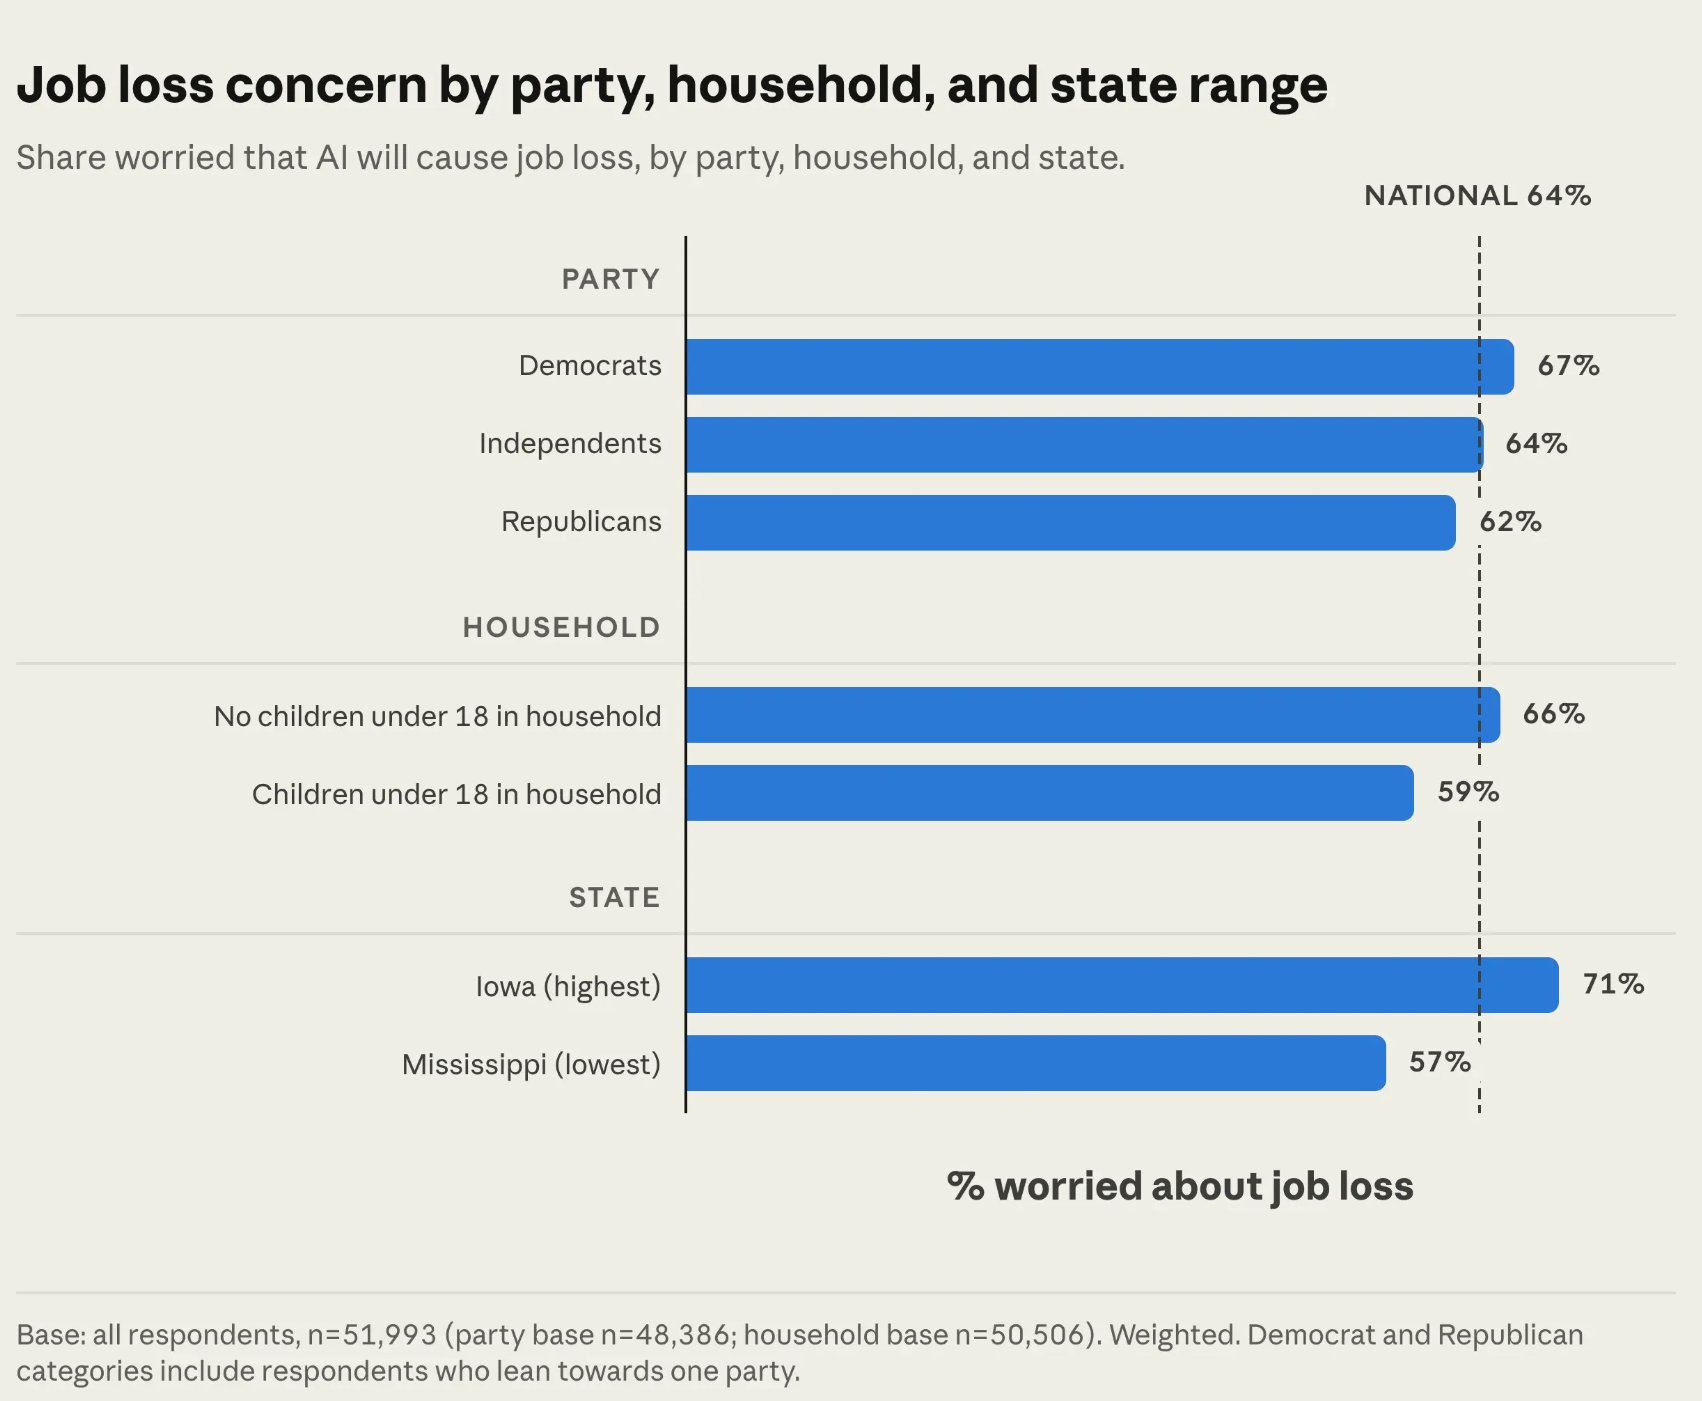
Anthropic surveyed 51,993 Americans in late 2025 for its first Public Record study. Job loss ranked as the top fear at 64%, leading in every state.
Concern ran from 71% in Iowa to 57% in Mississippi. It led among Democrats at 67% and Republicans at 62%.
“Americans with postgraduate degrees are nearly 10 percentage points more worried about job loss than those with a high school education or less,” the survey found. “At the same time, people who use AI at work every day are notably less worried about job loss than people who don’t use AI at all: 54% versus 70%.”
Follow us on X to get the latest news as it happens

Cognitive dependency followed at 56%, then misinformation at 52%. Only 15% of Americans said they trust AI companies to steer the technology. According to the findings,
“That was the lowest figure for any institution we tested, below the federal government (20%), state and local government (19%), and international bodies (20%), and far below independent experts (43%).”
AI Layoffs and a Billionaire Pushback
The fear is not abstract. BeInCrypto reported that AI drove 38,579 US job cuts in May, about 40% of the month’s total.
For 2026, employers have tied 87,714 cuts to AI. That total already exceeds the 54,836 attributed to the technology across all of 2025.
The pressure has reached Washington. Senators Elizabeth Warren and Bernie Sanders have urged Congress to protect workers now.
Not everyone agrees. Amazon founder Jeff Bezos rejects the job-loss narrative, predicting that AI will create labor scarcity instead. Bezos made the case as his AI startup, Prometheus, raised $12 billion at a $41 billion valuation.
“A lot of people who, for example, today have two-earner households, perhaps one of those earners will choose not to be in the job market, so they’ll become a one-earner household,” Bezos said.
Americans Want Cures and Accountability
On the hopeful side, 48% placed curing diseases like cancer or Alzheimer’s in their top three uses for AI. Helping people with disabilities followed at 36%.

Support for oversight ran high. 71% of respondents want government involvement in AI, including 79% of Democrats and 68% of Republicans.
Asked how to keep AI development steered toward humanity’s interest, 47% backed holding companies legally liable for harm. Another 44% wanted safety prioritized over growth.
Anthropic plans to repeat the Anthropic Public Record as AI adoption deepens. The early reading shows a public eager for breakthroughs yet skeptical of the firms building them.
Subscribe to our YouTube channel to watch leaders and journalists provide expert insights
The post Americans Fear AI Will Take Their Jobs, But Hope It Can Cure Cancer appeared first on BeInCrypto.

England hero insists he’s ‘not hating’ after reaction to Scotland beating Haiti | Football
Will the Magnificent Seven Give Way to the Dirty Dozen?

John McGinn lifts Scotland past Haiti in World Cup opener


-

 NewsBeat6 days ago
Alexander Zverev wins the French Open to finally earn a 1st Grand Slam title
-

 Crypto World6 days ago
Anatomy of the June crypto crash: Fed, Iran, Saylor
-

 Crypto World3 days ago
Oppenheimer backs SpaceX as $70 billion retail frenzy builds
-
 NewsBeat6 days ago
Alexander Zverev conquers demons and outlasts Flavio Cobolli to win French Open for first major title
-

 Crypto World3 days ago
Markets Rally as SpaceX IPO Looms Amid Iran Tensions and Inflation Surge
-

 Tech7 days ago
Microsoft unveils seven homegrown AI models in new bid for ‘long term self-sufficiency’
-

 Business6 days ago
High Stakes for Wembanyama as New York Pushes for 3-0 Lead
-

 Tech6 days ago
Notion restores access to Anthropic after service disruption
-

 Sports6 days ago
FIFA WC 2026 Group C: Morocco, Scotland challenge Brazil’s hunt for glory | FIFA World Cup 2022
-
 Business7 days ago
The investment to transform historic St Helen’s ground in Swansea
-
 Crypto World6 days ago
Eli Lilly (LLY) Stock Surges 4% Following Breakthrough Sleep Apnea Trial Results
-

 Crypto World7 days ago
Trump’s AI Ownership Plan Could Benefit Anthropic at OpenAI’s Expense
-
 Sports5 days ago
Bangladesh beat Australia after 20 years in ODIs, register only their second win over six-time world champions | Cricket News
-

 Fashion1 day ago
Weekend Open Thread: Tuckernuck – Corporette.com
-

 Tech1 day ago
NanoClaw integrates JFrog registries to secure AI agent downloads
-

 Crypto World23 hours ago
Bitget enters Argentina’s regulated crypto market through PSAV registration
-

 Tech2 days ago
This Week In Security: Microsoft On Microsoft, Register Your Domains, Linux On ARM, And FreeBSD Joins The File Cache Club
-

 Politics3 days ago
Politics Home | Healey Resignation Is “Colossal Failure Of Government”, Says Former Labour Defence Secretary
-

 Sports3 days ago
First Time Since 1971: Australia Register Historic Low In ODI Cricket
-
 Entertainment3 days ago
Donnie Wahlberg & More Heat Up Las Vegas at Circa’s Barry’s Downtown Prime
You must be logged in to post a comment Login