
Crypto World
Bitcoin and WW3: 5 Key Indicators as BTC Eyes Global Liquidity Surge
Bitcoin (BTC) acts as a barometer for global fear, but the latest geopolitical flare-up, which has many fearing for WW3, has failed to break the asset’s bullish prospects.
While headlines scream conflict, Bitcoin is holding the $60,000 line, eyeing a liquidity-driven breakout rather than a capitulation event.
Traders are now pricing in resilience, looking past the initial volatility to the underlying supply mechanics that favor the bulls.
The market climaxed with a sharp dip near $63,000 over the weekend before buyers stepped in, rejecting lower lows.
This price action suggests the market is desensitizing to headline risk, shifting focus back to the monetary drivers that typically fuel Q4 rallies. It is a clash of narratives: geopolitical uncertainty versus undeniable on-chain strength.
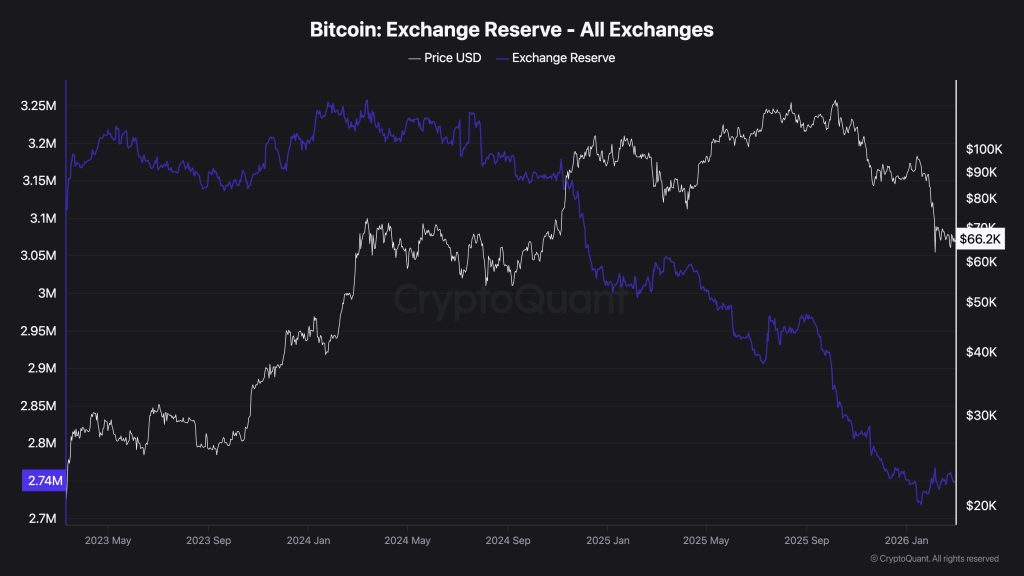
- Bitcoin Exchange Reserves have dropped to levels not seen since 2018, creating a significant supply shock as demand creates a floor.
- Spot BTC ETF Inflows are absorbing retail panic selling, with institutional players treating dips as accumulation opportunities.
- Global Liquidity M2 is expanding again, historically a primary driver for crypto asset repricing regardless of news cycles.
Indicator 1: Bitcoin Exchange Reserves Signal Supply Shock
The most critical on-chain metric currently is the rapid depletion of Bitcoin Exchange Reserves. According to data from CryptoQuant, reserves have fallen to approximately 2.6 million BTC, the lowest level since 2018. This is a structural supply squeeze that cannot be ignored.

When coins leave exchanges, they move to cold storage or custody solutions, effectively removing them from the immediate sellable supply.
The implication is straightforward: fewer coins available for sale means it takes less buy volume to push prices higher. In previous cycles, sharp declines in exchange balances often preceded supply shock rallies.
This drain on liquidity suggests that while weak hands are selling into headline fear, long-term holders are moving assets off the ledger. We are witnessing a transfer of wealth from impatient retail traders to high-conviction entities who understand the scarcity mechanics of the halving year.
Discover: The best crypto to diversify your portfolio with
Indicator 2: Bitcoin (BTC) ETF Inflows vs. Spot Selling
Institutional demand continues to act as a massive buffer against spot market volatility. Despite the bearish sentiment on social media, Spot BTC ETF Inflows tell a different story.
Recent weeks have seen net inflows effectively neutralizing the selling pressure from short-term holders, with the last week generated net inflows of $787.3 million, according to data by SoSoValue.
So, funds like BlackRock’s IBIT continue to attract capital even as price action chops sideways. This divergence of falling price against rising inflows is a classic accumulation signal. Institutional accumulation is not slowing down; it is accelerating during dips.
Adding to this institutional bedrock, major financial players are deepening their infrastructure. Morgan Stanley has moved to hold client crypto directly, signaling that the smart money thesis remains focused on long-term adoption rather than short-term geopolitical noise.
Indicator 3: How Bitcoin is Breaking the Downtrend Despite WW3 Fears
Technically, Bitcoin is respecting critical levels. The weekend dip found support before reaching the psychological $60,000 barrier, a level many traders had eyed for aggressive longs.
Trader CrypNuevo noted on X that a trip to anywhere between $60,000 and $61,000 would be a prime long entry, but the market front-ran that level, showing eagerness to buy.
So my strategy for this week is: — CrypNuevo
Wait for Monday stock market opening reaction:
• If it's a bloodbath (unlikely imo), then I'll long Bitcoin around $61k-$60k ahead of de-escalation talk news.
• If it's a slight decline, sideways or pump, I won't long until later in the week.
 (@CrypNuevo) March 1, 2026
A clean break above $70,000 would invalidate the downtrending structure that has plagued the chart since March.
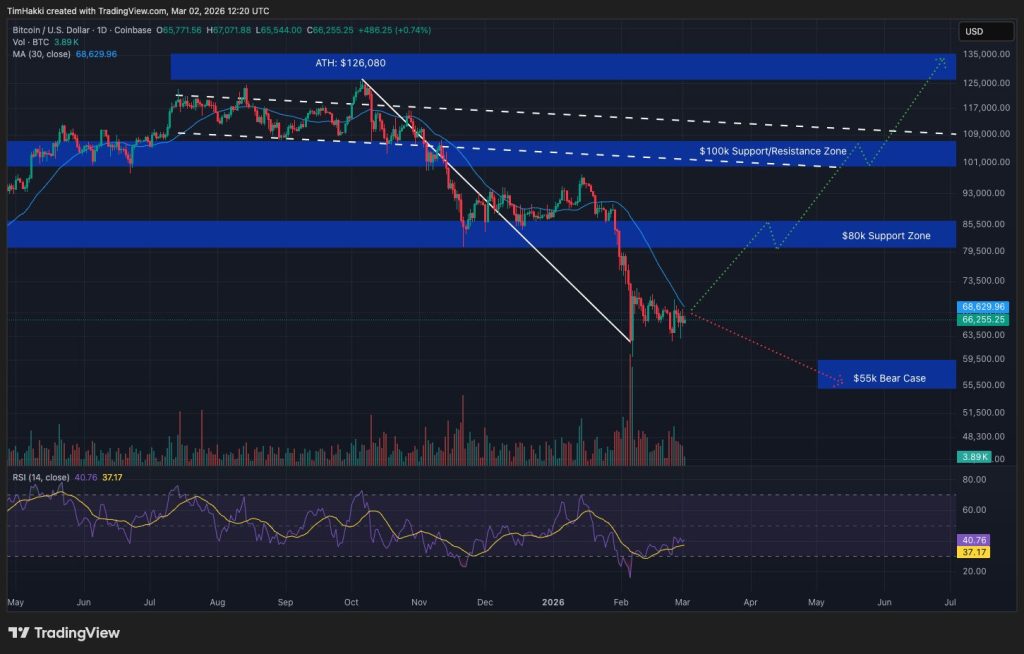
Support at $60,000 is the line in the sand; lose that, and the conversation shifts to $55,000 or lower. If Bitcoin can hold the line, the path back to six figures by Summer remains open.
Indicator 4: Global Liquidity and Central Bank Easing
Bitcoin is, above all else, a liquidity sponge. The current expansion of Global Liquidity M2, a measure of global liquidity that takes into account cash, checking and savings deposits, money market securities, and other near-cash assets, is the macro tailwind that bearish traders are overlooking.
As central banks from the ECB to the Fed signal or enact rate cuts, the cost of capital decreases, forcing money out of risk-free assets and into growth vehicles.
Historically, Bitcoin’s parabolic runs align perfectly with cycles of M2 expansion. We are currently in the early stages of a global easing cycle. While inflation data may cause temporary pauses in the Fed’s roadmap, the broader trend is clear: money printers are warming up.
Given the historic lag between M2 liquidity expansion cycles and Bitcoin bull markets, the injections hitting the system now will likely reflect in asset prices in Q4 2024 and Q1 2025.
Traders betting on a crash are effectively betting against the central bank liquidity cycle, a wager that rarely pays off in the crypto markets.
Discover: The best crypto to buy now
Indicator 5: Bitcoin Sees Geopolitical Resilience Despite WW3 Fears
The market’s reaction to recent Middle East tensions reinforces the “digital gold” narrative, albeit with high beta volatility.
While the initial reaction was a sell-off, Bitcoin rebounded swiftly after the shock, erasing nearly all losses within 48 hours. This V-shaped recovery is a hallmark of a resilient bull market structure.
Analyst consensus is shifting away from “World War Three” scenarios toward a contained conflict narrative, limiting the downside risk for risk assets.
However, the connection between energy prices and crypto remains tight. As oil prices react to Iran tensions, inflation expectations could tick up, complicating the Fed’s pivot. Yet, Bitcoin has shrugged off this correlation for now, trading more on idiosyncratic crypto flows than petrodollar dynamics.
Data from CoinGlass shows that the initial dip flushed out over-leveraged longs, resetting open interest to healthier levels. The market is now lighter, cleaner, and ready for organic price discovery without the weight of excessive leverage.
Ultimately, with institutional accumulation quietly putting a floor under price and Bitcoin Exchange Reserves draining, the path of least resistance appears to be upwards despite WW3 fears. The Bitcoin market has already priced in the conflict shock. Now it waits for the liquidity surge.
The post Bitcoin and WW3: 5 Key Indicators as BTC Eyes Global Liquidity Surge appeared first on Cryptonews.

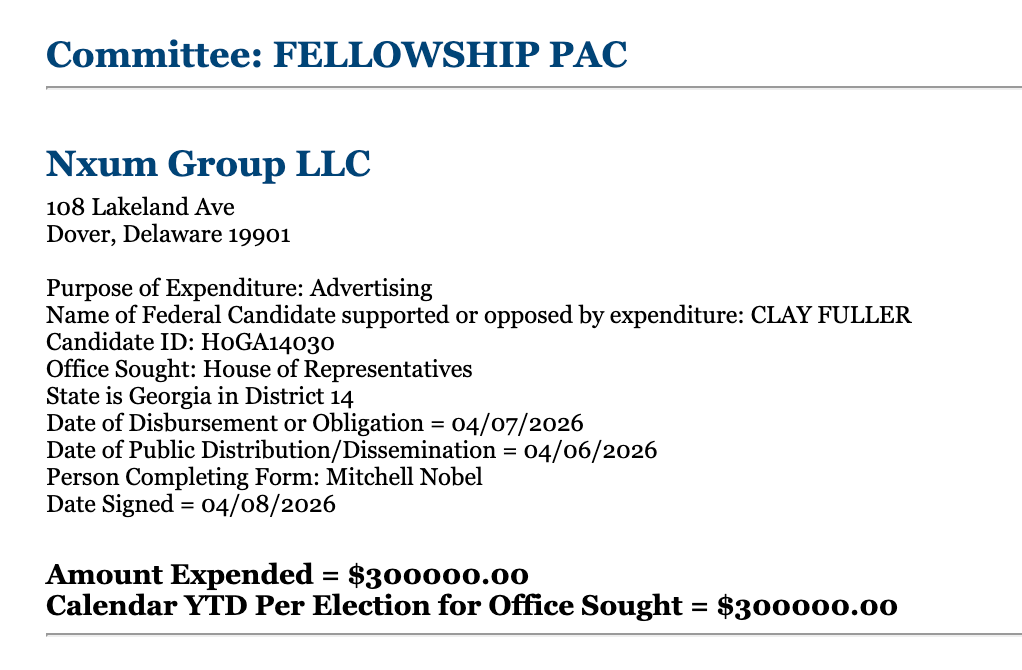
Fellowship, a super political action committee (PAC) that claims to have $100 million in its war chest from crypto-aligned parties ahead of the 2026 US midterms, has begun reporting spending and endorsements for the next election.
According to a filing with the Federal Election Commission (FEC), the Fellowship PAC reported spending $300,000 on advertising for Clay Fuller, a Republican who won a special election for Georgia’s 14th Congressional District to replace resigning congresswoman Marjorie Taylor Greene. The spending, reported disbursed on Tuesday, comes about a month before Georgia’s Republican primary on May 19.

Fellowship is just one of several crypto-backed or aligned PACs expected to pour money to support or oppose candidates in another critical US election season. In 2024, the Fairshake PAC spent more than $130 million in media buys in congressional races, possibly influencing the outcomes in key battlegrounds like the US Senate seat for Ohio.
According to the FEC, super PACs may “receive unlimited contributions from individuals, corporations, labor unions and other PACs for the purpose of financing independent expenditures and other independent political activity.”
In addition to its only reported expenditure since the Fellowship PAC’s statement of organization filed in 2025, Fellowship posted endorsements for candidates to its X account on Thursday, signaling support for Republicans in races across five states. The candidates included Alan Wilson for South Carolina governor, Blake Miguez for Louisiana’s 5th Congressional District, Mike Collins for the US Senate in Georgia, Julia Letlow for the US Senate in Louisiana, Pete Ricketts for the US Senate in Nebraska and Nate Morris for the US Senate in Kentucky.
Related: Chainlink and Anchorage Digital back launch of crypto-aligned PAC
Fellowship announced its launch in September, claiming to have “over $100 million” from undisclosed backers aligned with the crypto industry. On April 1, it said that Tether’s head of government affairs, Jesse Spiro, would chair the PAC, signaling support for candidates with pro-crypto views.
US lawmakers are still stalled on crypto market structure bill as midterms approach
The CLARITY Act, legislation passed by the US House of Representatives in July, has faced several delays in the Senate with no clear path forward on passing the legislation as of Monday.
Reports over the weekend signaled that the Senate Banking Committee, one of the two bodies needed to approve the bill in the chamber before a vote, was planning to hold a markup on the legislation, but the event was not on the committee’s calendar at the time of publication.
The bill, expected to be one of the most comprehensive pieces of legislation affecting the crypto and banking industries, has faced pushback from lawmakers to address ethics, stablecoin yield, tokenized equities and other potential issues.
Magazine: Should users be allowed to bet on war and death in prediction markets?
The European Central Bank is charting a cautious path toward tokenizing Europe’s capital markets, arguing that the gains from distributed ledger technology (DLT) hinge on anchoring transactions in central bank money, ensuring interoperable infrastructures, and maintaining a robust regulatory framework.
In its latest Macroprudential Bulletin, the ECB notes that tokenization could deepen the EU’s savings and investments union, but warns gains depend on policy action keeping pace with evolving risks. The stance signals a measured push to modernize market plumbing without compromising financial stability or monetary control.
Key takeaways
- Tokenization could streamline the issuance-to-settlement chain and boost liquidity, but true gains require interoperable platforms and central bank money for settlement, not just private or commercial instruments.
- Early evidence from tokenized bonds points to lower borrowing costs and tighter bid-ask spreads, yet these improvements depend on scale, risk controls, and market adoption.
- Tokenized money market funds and euro-denominated stablecoins are analyzed as experiments in on-chain cash-like instruments, bringing new operational vulnerabilities alongside familiar liquidity risks.
- MiCA-compliant euro stablecoins could influence sovereign-bond demand and market resilience, depending on how issuers meet deposit and reserve requirements.
- Across five Bulletin pieces, the ECB stresses that tokenization can support a more integrated capital market only if policy, prudential rules, and central-bank infrastructure evolve in tandem.
Tokenized capital markets: Conditions and expected benefits
The ECB’s analysis outlines how tokenized assets could rewire the issuance-to-settlement chain by moving both securities and cash onto compatible ledgers and by automating corporate actions. By doing so, the authors argue, operational frictions tied to multiple intermediaries and legacy systems could be reduced, potentially unlocking improved secondary liquidity. Yet the potential gains hinge on avoiding a patchwork of incompatible platforms and ensuring that central bank money—not merely commercial bank money or privately issued tokens—can be used for settlement in tokenized markets.
One article in the Bulletin highlights that tokenization and DLT are moving from concept to early-scale deployment, but the benefits will be realized safely only if European policy action keeps pace. This framing underscores the balance policymakers are seeking: enabling innovation while preserving financial stability and monetary integrity. For market participants, that means pilots and gradually expanded use cases rather than rapid, broad-based deployment.
The Bulletin also flags the need for robust interoperability standards and risk governance to prevent fragmentation as tokenized infrastructure expands. In practical terms, that could mean common settlement rails, standardized corporate-action workflows, and clear rules on settlement finality and collateral management across platforms.
Tokenized MMFs and euro stablecoins under the lens
The bulletin treats tokenized money market funds (MMFs) as a parallel set of experiments that largely mirror the liquidity and run-risk profile of traditional MMFs, but with added operational vulnerabilities inherent to on-chain structures. The analysis invites scrutiny of how such funds would behave under stress and how they interact with on-chain cash-like instruments during adverse conditions.
A separate piece examines euro-denominated, MiCA-compliant stablecoins and their potential impact on sovereign debt markets. Depending on whether issuers meet deposit and reserve requirements, these on-chain tokens could act as a liquidity buffer in turbulent times or, conversely, become a channel for bank contagion. The report emphasizes the regulatory hinge: the way deposits, reserves, and governance are structured will shape how these stablecoins influence demand for government bonds and overall market stability.
Broader implications and what to watch
Together, the five pieces in the Bulletin lay out a clear, conditional path for tokenization: it can support Europe’s goal of a more integrated and efficient capital market, but only if policy direction, prudential oversight, and central-bank infrastructure evolve in lockstep. The ECB’s nuanced stance reflects an intention to reap potential benefits while keeping a tight line on risk management, liquidity resilience, and monetary integrity as tokenized formats scale beyond flagship deals and select issuers.
For investors and market builders, the early signals are instructive. Tokenized bonds showing lower borrowing costs in initial deployments suggest real efficiency gains from streamlined settlement and enhanced transparency. Yet those advantages are not guaranteed to persist once activity broadens: scale, legal clarity, and robust liquidity mechanisms will determine whether the benefits are durable or merely episodic. The same tension applies to tokenized MMFs and stablecoins, where innovation can improve access to liquidity but must not outpace safeguards around reserve adequacy and systemic risk.
Policymakers appear determined to preserve a centralized architectural logic—anchoring settlements in central bank money and ensuring regulatory clarity—while allowing the market to experiment with tokenized formats. The coming months could bring pilot programs, shared standards, and possible adjustments to settlement infrastructures, as Europe weighs how best to harmonize technology, law, and prudential rules.
Readers should watch how the ECB formalizes these concepts in concrete policy and industry guidance, and how market participants respond to any push toward standardized cross-platform settlement rails. The balancing act between innovation and stability will continue to shape the pace and scope of tokenized instruments across Europe.
The ECB did not respond to Cointelegraph for comment by publication.
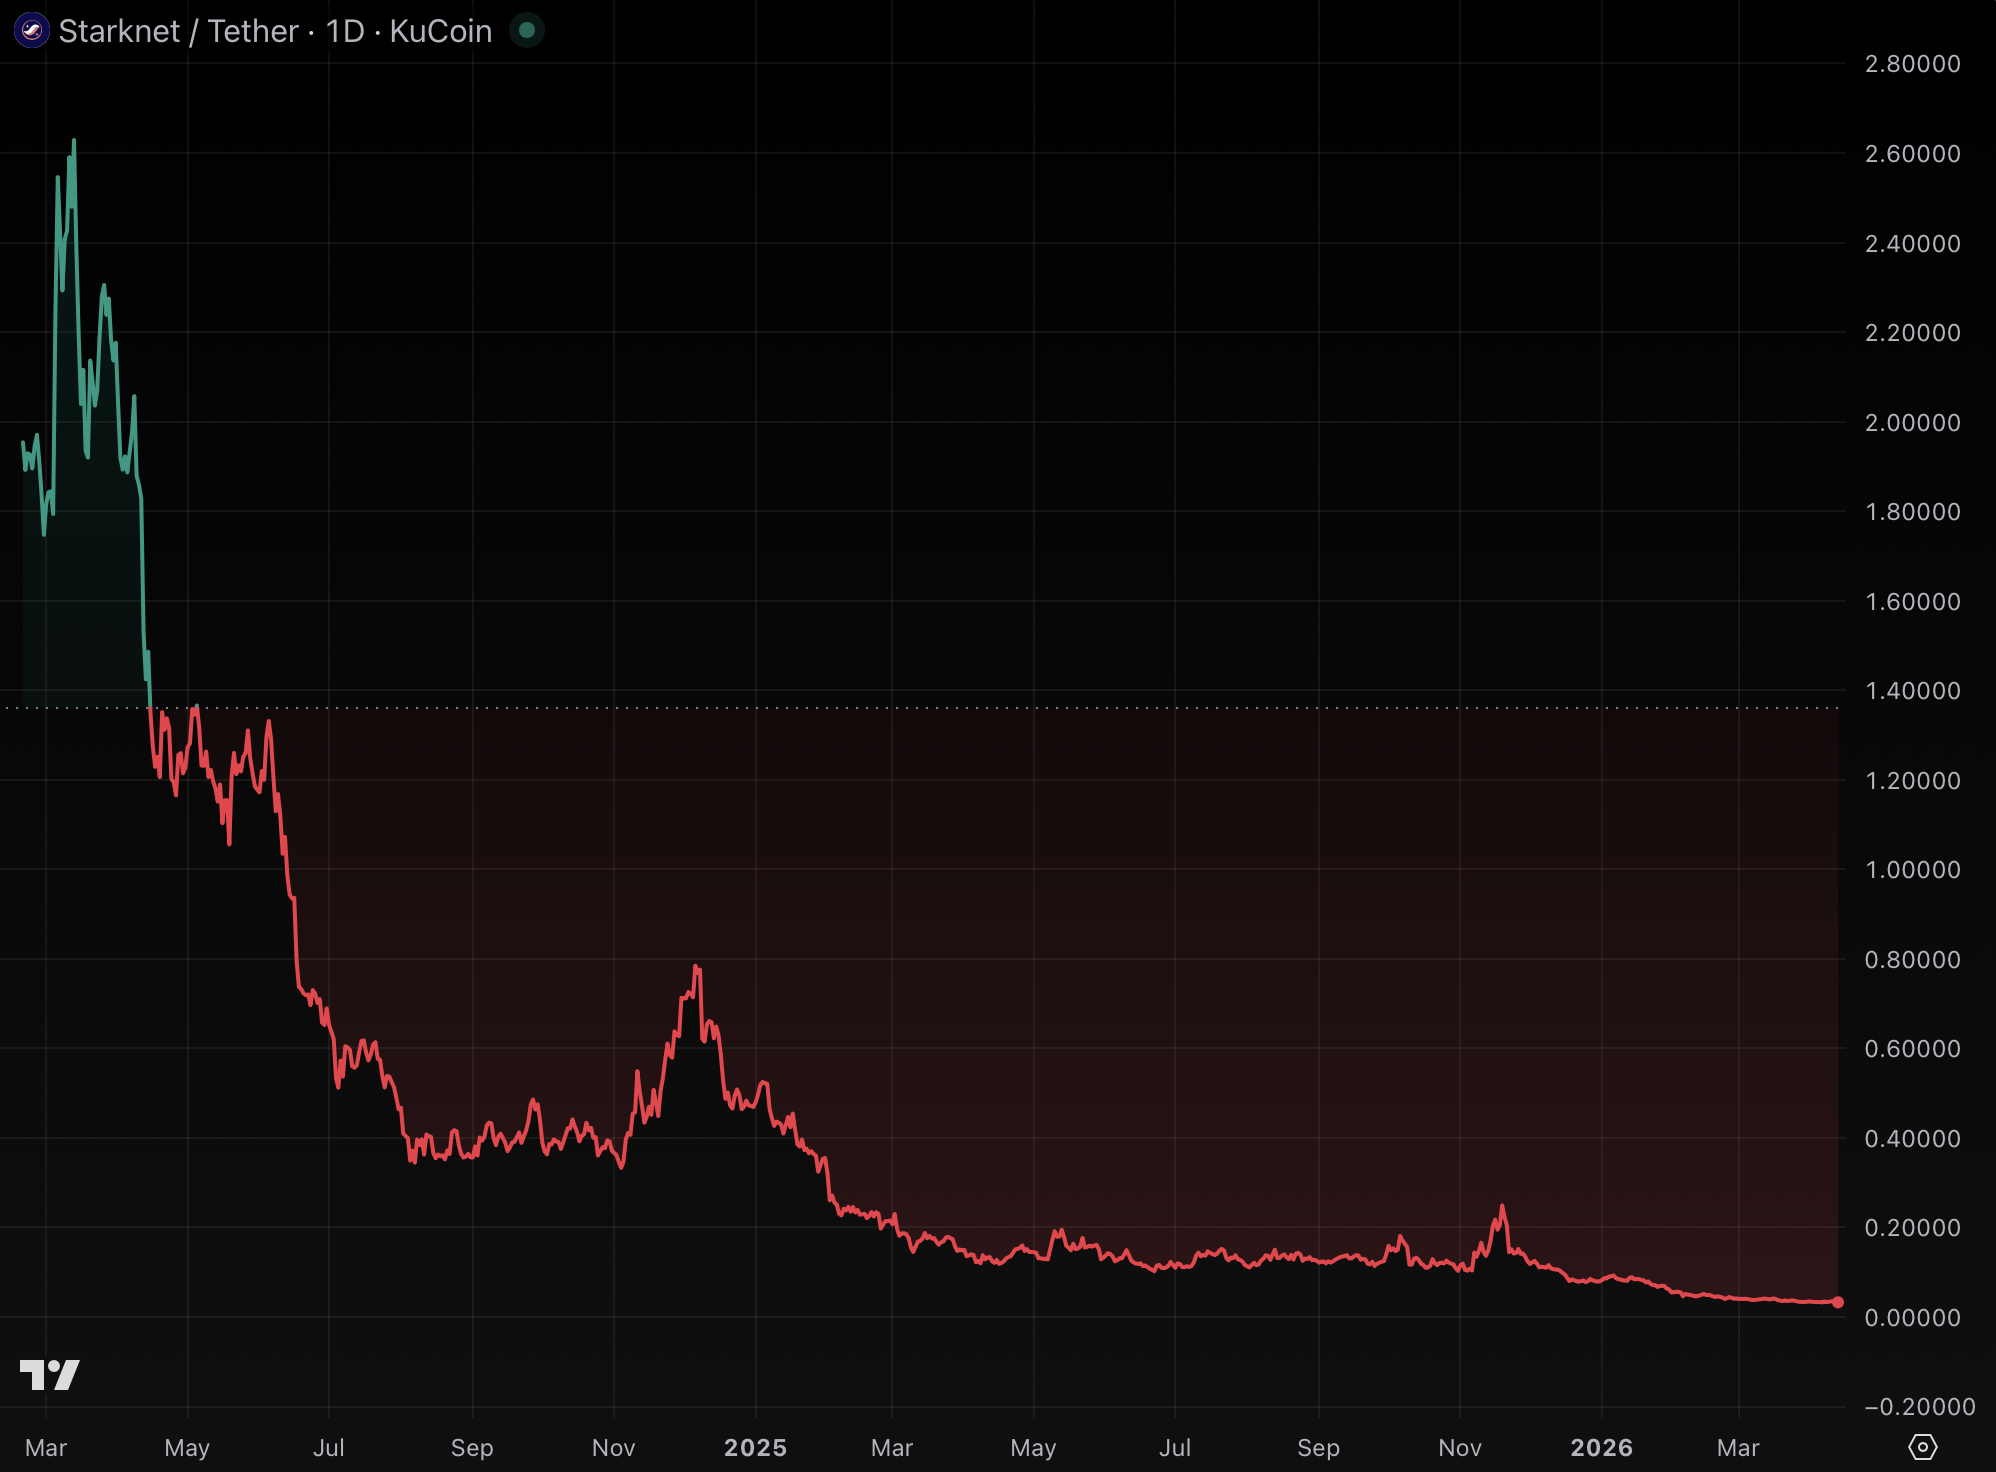
The CEO of StarkWare, the once-$8 billion Israeli company behind Ethereum-based blockchain Starknet, announced layoffs and a full corporate restructuring today. Monthly revenue on its flagship network has collapsed more than 98% from its peak.
In November 2023, Starknet’s on-chain revenue peaked near $5.8 million within a single month. This month, it is on track for approximately $100,000.
In other words, the network that once generated $187,000 in daily fees now generates about $3,500 per day. StarkWare declined to disclose the number of layoffs.
StarkWare, founded in Israel in 2018, develops Starknet, an Ethereum layer 2. For disambiguation, there is no StarkWave entity, a common misnomer that circulates online.
Starknet’s STRK token launched via airdrop in February 2024 and briefly traded to $4.41. It’s since fallen to $0.033, giving it a market capitalization of $187 million. That’s a 91% decline from its $2 billion market cap in March 2024.

StarkWare CEO: We are downsizing
CEO Eli Ben-Sasson posted his internal memo to X, telling staff the company had grown too large.
“Very sadly, as part of this process, we are downsizing,” he said as he fired staff. “Our new strategy requires that we move fast, and we’re too big and too inefficient for that.”
StarkWare raised $100 million at an $8 billion valuation in May 2022, quadrupling its size from $2 billion in a round six months prior. Although the company hasn’t updated its valuation in today’s downsizing announcement, it would probably be embarrassing relative to those 2022 figures.
GreenOaks Capital and Coatue were lead investors in the company. Earlier backers included Sequoia Capital, Paradigm, Founders Fund, as well as crypto dumpster fires Three Arrows Capital and Sam Bankman-Fried’s Alameda Research.
StarkWare raised more than $260 million over its lifetime — more than the current market cap of STRK.
COO Oren Katz has submitted his resignation and departs at the end of this month.
A split and a sunset
The restructuring splits StarkWare into two independent business units. An applications division, led by Chief Product Officer Avihu Levy, will chase revenue directly. A Starknet development unit, led by Product Head Tom Brand, will continue core protocol work.
Read more: Crypto Twitter upset by Starknet STRK airdrop
The revenue decline is mostly due to Starknet’s failure to attract usage of its blockchain as well as limited revenue across layer 2 blockchains.
Ethereum’s Dencun upgrade in March 2024 slashed data costs for all layer 2 networks, compressing fee revenue across the board. Layer 2 governance tokens like STRK posted average returns of negative 40% in 2025 in their second consecutive unprofitable year.
Starknet fared worse than most. Its total value locked sits around $241 million per DefiLlama, far behind Coinbase’s Base at roughly $4.3 billion and Arbitrum at $1.9 billion. Starknet’s all-time cumulative fees total just $45 million.
Ben-Sasson acknowledged as much. “Infrastructure alone does not win the game.”
Got a tip? Send us an email securely via Protos Leaks. For more informed news, follow us on X, Bluesky, and Google News, or subscribe to our YouTube channel.
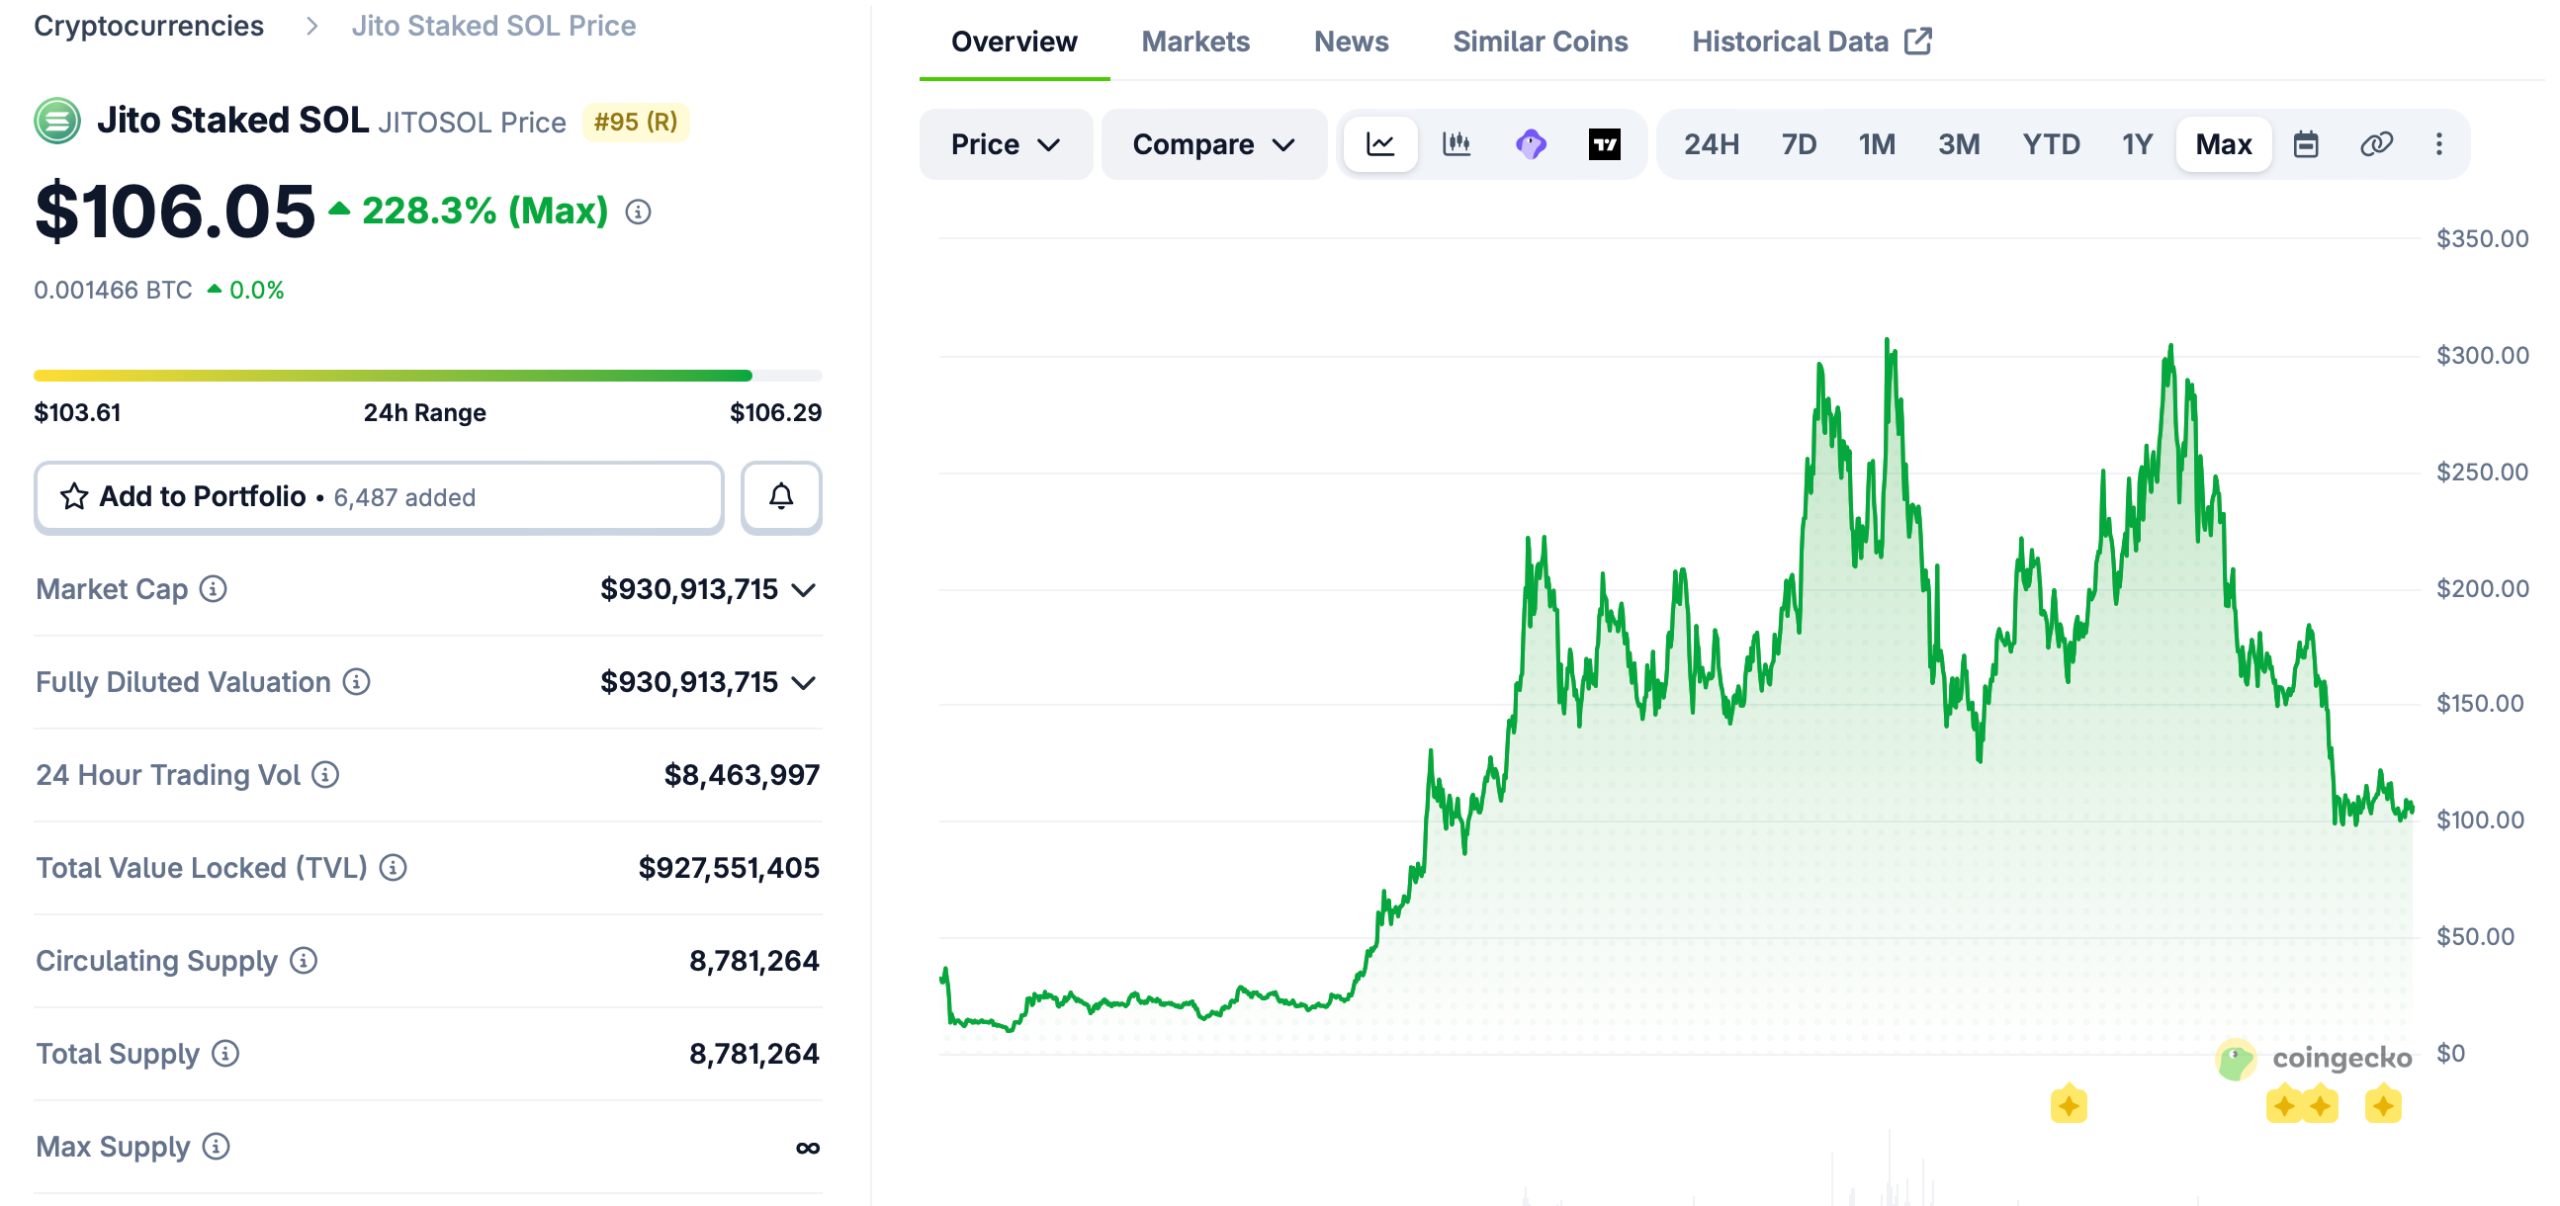
Jito Foundation has signed a memorandum of understanding with Korean digital asset custodian KODA to explore institutional custody and staking support for JitoSOL in the local market.
According to Monday’s announcement, the agreement includes outreach to institutional investors and the development of compliant custody and staking pathways.
It comes as South Korea’s Financial Services Commission is expected to finalize a digital asset regulatory framework later this year.
In February, the foundation said it would work with Hanwha Asset Management to explore a JitoSOL exchange-traded fund in South Korea, pending regulatory approval. Marc Liew, head of APAC at Jito Foundation, told Cointelegraph:
We are seeing significant interest from two main camps: large financial firms looking to build the next generation of wealth management products, and institutional entities that are interested in the yield-bearing nature of JitoSOL for their corporate treasuries.
KODA provides custody infrastructure including cold storage, MPC-based key management and institutional staking, carrying $20 million in digital asset insurance coverage. The company is backed by KB Kookmin Bank and other ininvestors andolds a registered VASP license and ISMS certification.
“Through KODA’s institutional-grade vaulting system, the KODA interface will allow the client to mint JitoSOL directly from their SOL holdings,” Liew said.
Jito is a liquid staking protocol on the Solana (SOL) network where users stake SOL in exchange for JitoSOL, a token usable across decentralized finance applications. The Jito Foundation supports development, partnerships and institutional outreach.
JitoSOL has a market capitalization of about $930 million, according to CoinGecko data. The token already has institutional exposure in Europe through a 21Shares exchange-traded product, while custodians including BitGo and Hex Trust support staking directly from custody accounts.

Related: Grayscale debuts Solana ETF, joining Bitwise in SOL staking ETF race
Seoul tightens crypto market controls
South Korean regulators and policymakers are pushing for tighter controls on the crypto sector as they move toward a more structured regulatory framework.
In January, the country approved changes to its crypto licensing regime, tightening requirements for virtual asset service providers and expanding oversight to include major shareholders. In March, policymakers followed with a proposal to cap ownership stakes in domestic exchanges at 20%, part of wider efforts to impose stricter controls on market structure.
The regulatory push accelerated after a payout error at crypto exchange Bithumb in early February, when users mistakenly received 620,000 Bitcoin (BTC) instead of 620,000 Korean won, triggering a sell-off and exposing weaknesses in exchange oversight.
Following the incident, the country’s Financial Services Commission introduced stricter reconciliation requirements between exchanges’ internal ledgers and onchain balances.
Earlier this month, lawmakers began drafting legislation that would classify stablecoins as foreign exchange payment instruments and require tokenized real-world assets to be backed by assets held in trust.
More recently, the Bank of Korea called for exchange-level “circuit breakers” and stronger internal controls, with the central bank warning that the industry lacks safeguards seen in traditional financial systems.
Magazine: Should users be allowed to bet on war and death in prediction markets?


The bitcoin price is range-bound between $68,000 support and $75,000 resistance heading into the most consequential two-week window of 2026, with three catalysts arriving back to back: the Iran ceasefire expiry on April 22, the CLARITY Act Senate markup targeted for late April, and the FOMC meeting on April 28 and 29.
Summary
- According to 24/7 Wall St. analysis, $68,000 is the key level to watch: bitcoin has held above it through both the Islamabad talks collapse and Monday’s blockade announcement, suggesting the market has already priced in the near-term bad news; if oil climbs past $110, however, analysts project bitcoin could fall to $65,000.
- If the ceasefire extends or new talks are announced before April 22, bitcoin could push back toward $75,000 to $80,000 on the same relief dynamic that drove the original ceasefire rally; a resumption of full hostilities with no diplomatic off-ramp is the scenario that breaks the $68,000 floor.
- The FOMC meeting on April 28 and 29 adds a second layer: with inflation running above 3 percent and oil still elevated above $100, Fed rate cut expectations have been effectively scrubbed from the near-term calendar, removing a key macro tailwind that historically supports bitcoin rallies.
Bitcoin (BTC) has spent 46 consecutive days in extreme fear territory, with the Crypto Fear and Greed Index reading between 8 and 12. Despite that, whale wallets accumulated 270,000 BTC over the past 30 days, the largest sustained buying spree since 2013, while exchange reserves hit their lowest level since December 2017 at 2.21 million BTC. Those on-chain signals suggest long-term holders are absorbing the selling from retail and tax-driven exits rather than liquidating.
One analyst described the level plainly: “$68,000: This is the line in the sand.”
The three catalysts between April 22 and April 29 interact with each other in ways that matter. If the ceasefire extends and oil drops toward $90, rate cut expectations improve going into the FOMC meeting and bitcoin gets a macro tailwind at the same time the CLARITY Act markup could add a crypto-specific catalyst. If all three resolve favorably in sequence, analysts at 24/7 Wall St project a move toward $75,000 to $80,000 by the end of April. That scenario requires a lot to go right simultaneously.
Why the Ceasefire Expiry Is the First Domino
The Islamabad talks ran 21 hours and ended without agreement on the two core issues: Iran’s nuclear program and control of the Strait of Hormuz. Iran’s parliament speaker returned home saying Iran would not bow to any threats. With the US Navy now blockading Iranian ports, the conditions for a ceasefire extension look harder to meet than they were before the weekend. 24/7 Wall St noted that “tax selling ahead of April 15 and uncertainty around the war will keep overriding Bitcoin’s rally attempts” in the near term.
What Happens to Bitcoin If $68,000 Breaks
As crypto.news has reported, the Fear and Greed Index has been in extreme fear for 46 consecutive days, and the market is structurally fragile with leveraged positions still present. As crypto.news has noted, a break below $68,000 would likely trigger liquidations from short-term holders who bought the ceasefire rally, with analysts projecting a move toward $65,000 if the war resumes and oil crosses $110.

Hungary’s 16-year Orbán era ended on April 12, 2026, when opposition leader Péter Magyar’s pro-EU Tisza Party secured a commanding parliamentary majority – and with it, a plausible path to unwinding one of the EU’s most aggressive national crypto crackdowns.
The political shift is confirmed. The regulatory reversal is not. That distinction matters, and this article will interrogate exactly what the gap between those two facts means for traders, operators, and the broader MiCA implementation map across Europe.
This story carries a speculative tag for good reason: no legislative rollback has been announced, no enforcement moratorium declared, and no Tisza-led government has yet been formally seated. What exists is a changed political vector – and in crypto policy, that’s often where the real repositioning begins.
- Political event: Péter Magyar’s Tisza Party won a parliamentary majority on April 12, 2026, ending Viktor Orbán’s 16-year rule, with Orbán conceding in early projections.
- Crypto crackdown at stake: Hungary’s amended Crypto Act, effective July 1, 2025, criminalized unauthorized exchange services and imposed a SARA-certificate validation regime on all crypto-to-fiat and crypto-to-crypto transactions.
- MiCA conflict: The European Commission launched infringement proceedings against Hungary’s validation regime, citing incompatibility with the harmonized MiCA framework – proceedings that a new government could resolve swiftly.
- Revolut exposure: The UK-based fintech, serving over 2 million Hungarian clients, halted crypto buying, staking, and deposits post-July 2025 and has given no reinstatement timeline.
- What remains unverified: No confirmed policy reversal, no legislative timeline, and no formal Tisza government position on crypto regulation has been announced as of publication.
Discover: Top Crypto Presales Worth Watching This Month
What Hungary Crypto Crackdown Actually Built – and What Post Election Reversal Would Have to Dismantle
The architecture of Hungary’s crackdown is more surgical than the headlines suggested. Amendments effective July 1, 2025 created two new criminal offenses – “crypto abuse” and “unauthorized crypto exchange services” – carrying penalties of up to 2 years in prison.
But legal analysis clarified the scope: the offenses target large-scale unvalidated exchange operations and unlicensed platforms, not node-running, Bitcoin holding, or personal use of international trading platforms.
The sharper tool was the validation layer. By December 27, 2025, a transaction-level system required SARA-licensed certificates for any crypto-to-fiat or crypto-to-crypto exchange executed through domestic platforms.

The practical effect was a state-controlled regulatory gatekeeper – one that crypto insiders characterized as designed to redirect market power toward licensed incumbents and away from foreign-operated platforms.
The capital flight concern was not hypothetical: Revolut, serving over 2 million Hungarians, has completely banned crypto buying, staking, and deposits, and has offered no reinstatement date.
A rollback under Tisza would not be a single vote to repeal. It would require unwinding the SARA validation regime, amending or nullifying the criminal offense provisions, and coordinating with the European Commission to close the active infringement proceedings.
That’s three separate institutional actions – legislative, regulatory, and diplomatic – that need to move in sequence. Possible within months under a motivated government. Not guaranteed even under a favorable one.
The EU infringement angle is the fastest lever available. The Commission’s proceedings against Hungary’s validation regime rest on a clear argument: MiCA sets a harmonized floor for crypto-asset service regulation across member states, and Hungary’s SARA certificate system creates a parallel national gatekeeping layer that MiCA’s architecture does not permit.
A new government signaling EU alignment – which Tisza’s pro-EU platform explicitly does – could resolve those proceedings through administrative withdrawal rather than full legislative reform. That would remove the validation layer fastest, even before the criminal provisions are revisited.
Discover: Best Crypto Presales Gaining Traction in 2026
The post Hungary Election Political Shake-Up Could Reopen Crypto Policy and Regulation Debate appeared first on Cryptonews.

This editorial introduces a press release describing a rapid market reassessment driven by geopolitical tensions and a rise in oil prices. It notes that talks with Pakistan collapsed and a blockade of the Strait of Hormuz has occurred, shifting sentiment from relief to caution across energy and equity markets. The release links higher crude costs to potential inflationary pressure and central‑bank policy responses, while framing the upcoming earnings season as a gauge for how firms price energy risk. A market analyst is quoted on whether the move signals a short‑term tactic or the start of a longer supply shock, a distinction readers will weigh carefully.
Key points
- Crude prices have risen about 8% on the development, signaling tighter energy markets.
- US equity futures have slipped as markets reassess risk and potential supply disruptions.
- Emergency stockpiles are being drawn down and the IEA warns that supply pressures could intensify.
- S&P 500 earnings are expected to grow about 12.6% this quarter, with major banks set to report; forward guidance will be critical.
Why it matters
The practical effect of geopolitical risk and higher energy costs extends to inflation expectations, borrowing costs, and corporate forecasting. If the disruption proves temporary, markets may adjust; if it persists, inflation and policy responses could become louder market drivers. For readers, traders, and investors, the message is to monitor how energy risk is priced into forecasts and what earnings commentary reveals about resilience or vulnerability in the near term.
What to watch
- The ceasefire deadline of April 22 and any progress toward a resolution.
- How companies adjust guidance on energy costs and demand in earnings reports.
- Oil maintaining levels above $100 per barrel and the implications for inflation and policy.
- Market volatility in response to headlines and headline-driven risk reassessment.
Disclosure: The content below is a press release provided by the company or its PR representative. It is published for informational purposes.
Markets Reprice as Oil Surges and Geopolitical Risks Escalate
Abu Dhabi, UAE -13 April 2026: Markets have rapidly shifted from optimism to uncertainty following the collapse of Pakistan talks and the immediate blockade of the Strait of Hormuz, reversing last week’s relief rally driven by ceasefire hopes. The move has already pushed crude prices higher by around 8%, while US equity futures have slipped, underscoring growing investor concern over potential disruptions to global energy supply.

Josh Gilbert, Market Analyst at eToro, said: “The key question for markets right now is whether this is a short-term negotiating tactic or the start of a more prolonged supply shock. If it’s temporary, markets may look through it. But if this disruption persists, the inflationary consequences will be significant and will quickly move back to the top of the agenda for investors.”
Higher oil prices are already feeding into global inflation expectations, complicating the outlook for central banks that had been edging closer to rate cuts. With oil expected to remain above USD $100, policymakers may be forced to delay easing plans, adding further pressure on consumer sentiment and economic growth.
The impact is being felt globally, with emergency stockpiles being drawn down and limited buffer capacity to absorb further shocks. Warnings from the International Energy Agency suggest supply pressures could intensify in the coming weeks, increasing the risk of sustained volatility across energy markets.
This backdrop coincides with the start of US earnings season, where the S&P 500 is expected to report earnings growth of approximately 12.6%, marking a sixth consecutive quarter of double-digit growth. Major banks including Goldman Sachs, JPMorgan, Wells Fargo, and Citi are set to report, offering early insight into how rising geopolitical tensions are impacting the real economy.
Gilbert added: “Forward guidance will be critical this earnings season. While first-quarter results may not fully reflect the impact of higher oil prices, the real focus will be on whether companies are starting to factor in a prolonged disruption. Any signs of caution around consumer spending, corporate confidence, or deal activity could add another layer of pressure on markets.”
With the ceasefire deadline approaching on April 22 and no clear path to resolution, markets are expected to remain highly sensitive to headlines. Volatility is likely to persist, with investors needing to stay prepared for further downside risks if tensions continue to escalate.
About eToro
eToro is the trading and investing platform that empowers you to invest, share and learn. Founded in 2007 with the vision of a world where everyone can trade and invest in a simple and transparent way, today eToro has 40 million registered users from 75 countries.
eToro believes in the power of shared knowledge and that investors can become more successful by investing together. The platform has built a collaborative investment community designed to provide users with the tools they need to grow their knowledge and wealth. On eToro, users can hold a range of traditional and innovative assets and choose how they invest: trade directly, invest in a portfolio, or copy other investors.
Visit eToro’s media centre for the latest news.


The crypto market entered a new phase of geopolitical stress on Monday morning when the US Navy began enforcing a blockade of Iranian ports at 10 AM ET, sending Brent crude above $103 a barrel and keeping bitcoin pinned near the $70,000 support level that has held since the Islamabad ceasefire talks collapsed over the weekend.
Summary
- Brent crude rose more than 7 percent to top $103 a barrel after CENTCOM confirmed the blockade, while WTI climbed 7.8 percent to $104; the moves came after the US and Iran failed to agree on extended terms during 21 hours of talks in Islamabad on April 11 and 12, with VP Vance announcing the breakdown Saturday night.
- Bitcoin traded around $70,600 to $71,085 on Monday morning, holding above $70,000 through the blockade announcement; the ceasefire technically remains in effect until April 22, though neither side has indicated it will be extended following the Islamabad collapse.
- CENTCOM clarified the blockade targets maritime traffic to and from Iranian ports only and will not impede freedom of navigation for vessels transiting the Strait to non-Iranian ports, a partial scaling back of Trump’s social media announcement which said the Navy would interdict any ship that had paid a toll to Iran.
As CNN Business reported, WTI crude is now more than 50 percent higher than before the war effectively shuttered the Strait in late February. Iran’s oil accounts for roughly 4 percent of world supply, most of it exported to China, and the blockade could cut off a significant source of funding for Tehran’s government and military. Capital Economics chief economist Neil Shearing wrote in a note that the move “risks creating new potential flashpoints,” raising the question of whether the US Navy would seize allied ships that had paid tolls to Iran or target Chinese vessels in the Strait. Only 17 ships passed through the waterway on Saturday, compared with an average of roughly 130 daily crossings before the war.
Bitcoin’s resilience at the $70,000 level through this weekend’s events is meaningful. The asset dropped into the low $60s when Iran first closed the Strait in late February, then rallied to $72,700 when the ceasefire was announced April 7, liquidating $427 million in short positions. The subsequent pullback to the $70,000 to $71,000 range on the Islamabad collapse and Monday’s blockade news shows the market has partially priced in a return to conflict. Holding $70,000 through a formal naval blockade is a structurally different outcome than the early-war behavior.
What the Oil Price Level Means for Bitcoin
The direct transmission between oil and bitcoin runs through inflation expectations and Federal Reserve policy. Every dollar oil climbs above $100 makes a rate cut less likely, keeps liquidity tighter, and suppresses risk appetite across equities and crypto simultaneously. As crypto.news has reported, bitcoin’s behavior as a high-beta risk asset during oil spikes has been consistent across the entire conflict period, with an 85 percent correlation to the Nasdaq-100 during energy price surges.
What Happens Next Before April 22
As crypto.news has noted, three catalysts now define the two weeks ahead: the ceasefire expiry on April 22, the CLARITY Act Senate markup targeted for late April, and the FOMC meeting on April 28 and 29. If the blockade tightens oil supply further and prices push past $110, analysts project bitcoin could fall toward $65,000. A last-minute diplomatic breakthrough before April 22 could reverse that move sharply, as the original ceasefire rally demonstrated.

- TRUMP price holds $2.78 support after a technical double-bottom bounce.
- Whale accumulation grows ahead of April 25 Mar-a-Lago event.
- The memecoin’s price may target $3.34 if support holds.
The Official Trump (TRUMP) token is beginning to show signs of life after weeks of sustained pressure, with price action stabilising just above a critical support level.
While the broader trend remains weak, recent movements suggest that large investors are quietly positioning themselves ahead of a highly anticipated event later this month.
At the time of writing, TRUMP was trading around $2.81, posting a modest daily gain and slightly outperforming Bitcoin (BTC), which has remained relatively flat.
Technical support sparks a cautious price rebound
The recent bounce can largely be traced to a well-defined support zone around $2.78, forming a double-bottom pattern and giving traders a clear reference point for short-term positioning.
Notably, after testing the support area, the price held firm and began to edge higher, suggesting that buyers are stepping in at this range.
This kind of reaction is typically driven by market structure rather than new fundamental developments.
Repeated tests of a support are often viewed as a confirmation that a floor has been established and, in this case, $2.78 has become the immediate floor price.
As long as TRUMP holds above this support, the structure remains intact.
A sustained move below it, however, would weaken the setup and likely open the door to lower levels near $2.44.
Whale accumulation builds quiet pressure
Alongside the technical setup, steady accumulation by large holders is helping to support the market.
In recent days, several high-value wallets have been increasing their exposure to TRUMP, often moving tokens off exchanges into private storage.
This behaviour is typically associated with longer-term positioning, as it reduces immediate selling pressure and signals intent to hold.
Notably, this accumulation coincides with an upcoming event scheduled for April 25 at Mar-a-Lago for large TRUMP token holders.
The Mar-a-Lago event has created a unique layer of demand, which, while it may not be sustainable over the long term, can still provide a meaningful boost for the token’s price in the short term.
TRUMP price outlook: A narrow path toward $3.34
With support holding and whale demand building, attention is now shifting to the next key level on the chart, which is $3.34.
However, a move toward $3.34 would require continued stability above $2.78, along with enough buying pressure to push through minor barriers along the way.
And at the moment, the setup suggests a market that is range-bound but leaning slightly upward, and eyes are on whether momentum can build.
It is also worth noting that the token remains deep in a broader downtrend, having lost a significant portion of its value over the past year, meaning any upside move is likely to be viewed with caution until stronger confirmation appears.

TLDR
- Kraken identified and contained two insider-related access incidents involving limited client data.
- The company confirmed that no systems were breached and no client funds were at risk.
- About 2,000 accounts were potentially viewed, representing only 0.02% of users.
- Kraken rejected extortion demands and is cooperating with law enforcement authorities.
- Galaxy Digital reported a separate cybersecurity incident with no impact on client data or funds.
Kraken confirmed an extortion attempt involving internal access claims, while it denied any system breach or fund risk. The company said it contained two insider-related incidents and limited data exposure. It also stated that affected accounts represented about 0.02% of its global user base.
Kraken Rejects Extortion Attempt and Secures Internal Systems
Kraken reported that attackers tried to extort the firm using alleged internal access videos. However, the company said its systems remained secure, and funds stayed protected.
The firm identified two separate incidents involving support staff access and limited client data visibility. It removed both individuals quickly and enforced tighter security controls after internal investigations.
Kraken said the first case emerged in February 2025 after it received a tip about a circulating video. The company then revoked access, identified the individual, and informed affected users.
Later, Kraken received another tip about a similar video linked to a different insider. It terminated access again and notified impacted users while strengthening safeguards.
Nick Percoco, chief security officer, stated, “Our systems were never breached; funds were never at risk.” He also added that the company will not negotiate with criminal groups.
Kraken said about 2,000 accounts were potentially viewed across both incidents. However, the firm emphasized that millions of users remained unaffected by the events.
Insider Access Cases Highlight Targeted Attack Attempts
Kraken reported that extortion demands followed shortly after it blocked the latest unauthorized access. The group threatened to release materials through media channels and social platforms.
The company confirmed it will not comply with any demands from the attackers. It also said it is working closely with law enforcement agencies and industry partners.
Kraken believes the case connects to wider insider recruitment efforts targeting crypto and technology firms. It stated that investigators have enough evidence to identify suspects.
The exchange added that it continues to improve internal monitoring and employee access controls. It also said it reviews processes to prevent similar incidents.
The firm stressed that no funds were lost and no core systems were compromised. It maintained that its infrastructure remained secure throughout both events.
Related Cybersecurity Event Reported by Galaxy Digital
Galaxy Digital also disclosed a separate cybersecurity incident involving unauthorized access. The company said the breach affected an isolated development workspace.
Galaxy Digital confirmed that no client funds or account data were exposed. It stated that the incident remained contained within internal systems.
The firm acted quickly to block access and investigate the situation. It also confirmed that operations continued without disruption.
Kraken said it continues to monitor threats and cooperate with authorities. Percoco stated, “We remain committed to combating insider recruitment threats globally.”


Coffee Break: Cloud Tote – Corporette.com

Smyth’s Toys asbestos alert: Everything you need to know

Hershey seeking to add to its presence in protein


-

 Politics3 days ago
US brings back mandatory military draft registration
-

 Fashion3 days ago
Weekend Open Thread: Veronica Beard
-
 Sports3 days ago
Man United discover Nico Schlotterbeck transfer fee as defender reaches Dortmund agreement
-

 Tech6 days ago
How Long Can You Drive With Expired Registration? What Florida Law Says
-

 Politics1 day ago
World Cup exit makes Italy enter crisis mode
-

 Crypto World4 days ago
Canary Capital Files SEC Registration for PEPE ETF
-

 Business3 days ago
Tesla Model Y Tops China Auto Sales in March 2026 With 39,827 Registrations, Beating Cheaper EVs and Gas Cars
-

 Crypto World5 days ago
Bitcoin recovers as US and Iran Agree a Ceasefire Deal
-

 Politics4 days ago
Malcolm In The Middle OG Turned Down ‘Buckets Of Money’ To Appear In Reboot
-

 Fashion6 days ago
Let’s Discuss: DEI in 2026
-
 NewsBeat20 hours ago
Pep Guardiola and Gary Neville agree over Arsenal title problem that benefits Man City
-

 Business3 days ago
OpenAI Halts Stargate UK Data Centre Project Over Energy Costs and Copyright Row
-

 Business2 days ago
Ireland Fuel Protests Enter Day 5 as Blockades Spark Shortages and Government Prepares Support Package
-

 Politics4 days ago
LBC Presenter Mocks Trump Over Iran War Failures
-

 Crypto World3 days ago
Federal judge blocks Arizona from bringing criminal charges against Kalshi
-

 Tech4 days ago
A version of Windows 10 released a decade ago is now eligible for additional security patches
-
 NewsBeat1 day ago
JD Vance announces ‘no agreement’ with Iran over nuclear weapons fear
-

 Business3 days ago
IMF retains floor for precautionary balances at SDR 20 billion
-
 Entertainment5 days ago
Alfred Hitchcock’s 10 Most Suspenseful Masterpieces, Ranked
-
 Entertainment3 days ago
A ‘Bridgerton’ Star’s New Survival Thriller Is a Must-Watch on Netflix This Weekend
You must be logged in to post a comment Login