

Crypto World
Bitcoin and WW3: 5 Key Indicators as BTC Eyes Global Liquidity Surge
Bitcoin (BTC) acts as a barometer for global fear, but the latest geopolitical flare-up, which has many fearing for WW3, has failed to break the asset’s bullish prospects.
While headlines scream conflict, Bitcoin is holding the $60,000 line, eyeing a liquidity-driven breakout rather than a capitulation event.
Traders are now pricing in resilience, looking past the initial volatility to the underlying supply mechanics that favor the bulls.
The market climaxed with a sharp dip near $63,000 over the weekend before buyers stepped in, rejecting lower lows.
This price action suggests the market is desensitizing to headline risk, shifting focus back to the monetary drivers that typically fuel Q4 rallies. It is a clash of narratives: geopolitical uncertainty versus undeniable on-chain strength.
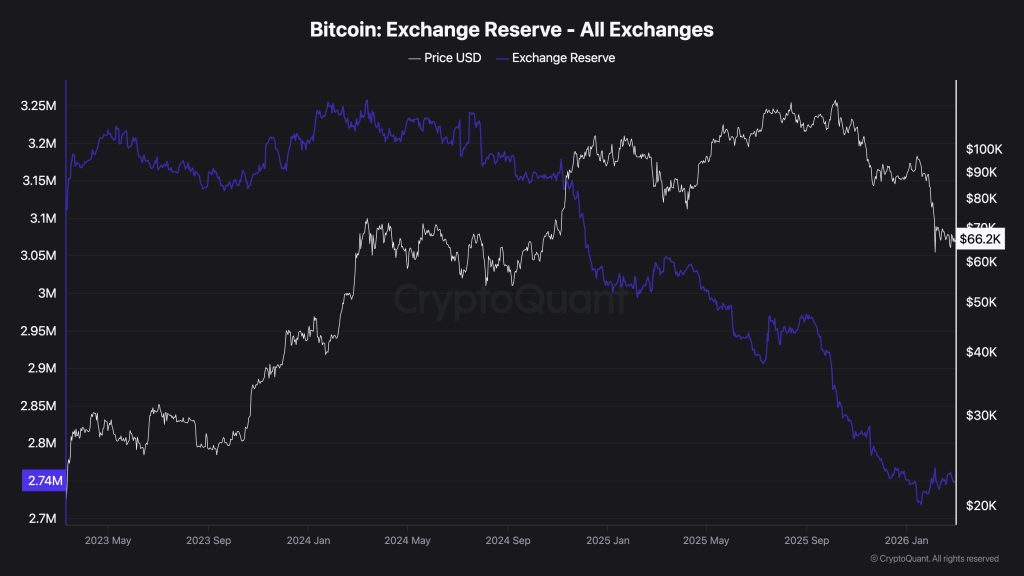
- Bitcoin Exchange Reserves have dropped to levels not seen since 2018, creating a significant supply shock as demand creates a floor.
- Spot BTC ETF Inflows are absorbing retail panic selling, with institutional players treating dips as accumulation opportunities.
- Global Liquidity M2 is expanding again, historically a primary driver for crypto asset repricing regardless of news cycles.
Indicator 1: Bitcoin Exchange Reserves Signal Supply Shock
The most critical on-chain metric currently is the rapid depletion of Bitcoin Exchange Reserves. According to data from CryptoQuant, reserves have fallen to approximately 2.6 million BTC, the lowest level since 2018. This is a structural supply squeeze that cannot be ignored.

When coins leave exchanges, they move to cold storage or custody solutions, effectively removing them from the immediate sellable supply.
The implication is straightforward: fewer coins available for sale means it takes less buy volume to push prices higher. In previous cycles, sharp declines in exchange balances often preceded supply shock rallies.
This drain on liquidity suggests that while weak hands are selling into headline fear, long-term holders are moving assets off the ledger. We are witnessing a transfer of wealth from impatient retail traders to high-conviction entities who understand the scarcity mechanics of the halving year.
Discover: The best crypto to diversify your portfolio with
Indicator 2: Bitcoin (BTC) ETF Inflows vs. Spot Selling
Institutional demand continues to act as a massive buffer against spot market volatility. Despite the bearish sentiment on social media, Spot BTC ETF Inflows tell a different story.
Recent weeks have seen net inflows effectively neutralizing the selling pressure from short-term holders, with the last week generated net inflows of $787.3 million, according to data by SoSoValue.
So, funds like BlackRock’s IBIT continue to attract capital even as price action chops sideways. This divergence of falling price against rising inflows is a classic accumulation signal. Institutional accumulation is not slowing down; it is accelerating during dips.
Adding to this institutional bedrock, major financial players are deepening their infrastructure. Morgan Stanley has moved to hold client crypto directly, signaling that the smart money thesis remains focused on long-term adoption rather than short-term geopolitical noise.
Indicator 3: How Bitcoin is Breaking the Downtrend Despite WW3 Fears
Technically, Bitcoin is respecting critical levels. The weekend dip found support before reaching the psychological $60,000 barrier, a level many traders had eyed for aggressive longs.
Trader CrypNuevo noted on X that a trip to anywhere between $60,000 and $61,000 would be a prime long entry, but the market front-ran that level, showing eagerness to buy.
So my strategy for this week is: — CrypNuevo
Wait for Monday stock market opening reaction:
• If it's a bloodbath (unlikely imo), then I'll long Bitcoin around $61k-$60k ahead of de-escalation talk news.
• If it's a slight decline, sideways or pump, I won't long until later in the week.
 (@CrypNuevo) March 1, 2026
A clean break above $70,000 would invalidate the downtrending structure that has plagued the chart since March.
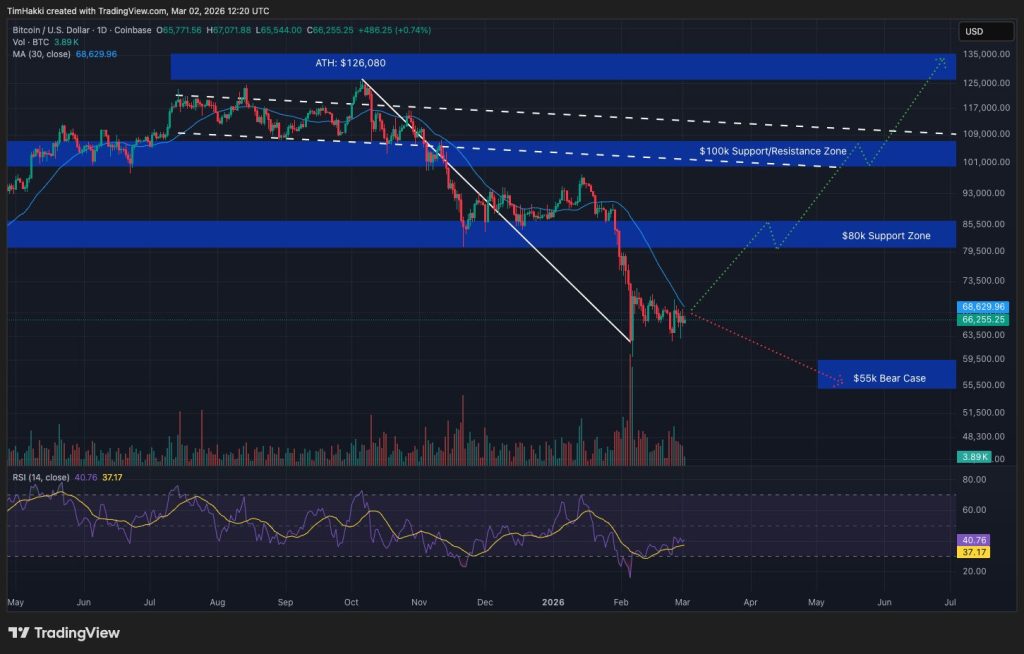
Support at $60,000 is the line in the sand; lose that, and the conversation shifts to $55,000 or lower. If Bitcoin can hold the line, the path back to six figures by Summer remains open.
Indicator 4: Global Liquidity and Central Bank Easing
Bitcoin is, above all else, a liquidity sponge. The current expansion of Global Liquidity M2, a measure of global liquidity that takes into account cash, checking and savings deposits, money market securities, and other near-cash assets, is the macro tailwind that bearish traders are overlooking.
As central banks from the ECB to the Fed signal or enact rate cuts, the cost of capital decreases, forcing money out of risk-free assets and into growth vehicles.
Historically, Bitcoin’s parabolic runs align perfectly with cycles of M2 expansion. We are currently in the early stages of a global easing cycle. While inflation data may cause temporary pauses in the Fed’s roadmap, the broader trend is clear: money printers are warming up.
Given the historic lag between M2 liquidity expansion cycles and Bitcoin bull markets, the injections hitting the system now will likely reflect in asset prices in Q4 2024 and Q1 2025.
Traders betting on a crash are effectively betting against the central bank liquidity cycle, a wager that rarely pays off in the crypto markets.
Discover: The best crypto to buy now
Indicator 5: Bitcoin Sees Geopolitical Resilience Despite WW3 Fears
The market’s reaction to recent Middle East tensions reinforces the “digital gold” narrative, albeit with high beta volatility.
While the initial reaction was a sell-off, Bitcoin rebounded swiftly after the shock, erasing nearly all losses within 48 hours. This V-shaped recovery is a hallmark of a resilient bull market structure.
Analyst consensus is shifting away from “World War Three” scenarios toward a contained conflict narrative, limiting the downside risk for risk assets.
However, the connection between energy prices and crypto remains tight. As oil prices react to Iran tensions, inflation expectations could tick up, complicating the Fed’s pivot. Yet, Bitcoin has shrugged off this correlation for now, trading more on idiosyncratic crypto flows than petrodollar dynamics.
Data from CoinGlass shows that the initial dip flushed out over-leveraged longs, resetting open interest to healthier levels. The market is now lighter, cleaner, and ready for organic price discovery without the weight of excessive leverage.
Ultimately, with institutional accumulation quietly putting a floor under price and Bitcoin Exchange Reserves draining, the path of least resistance appears to be upwards despite WW3 fears. The Bitcoin market has already priced in the conflict shock. Now it waits for the liquidity surge.
The post Bitcoin and WW3: 5 Key Indicators as BTC Eyes Global Liquidity Surge appeared first on Cryptonews.

Riot stock price rose by over 1.2% on Monday as Bitcoin and other altcoins rose despite the ongoing geopolitical risks. It also rose as traders waited for its financial results.
Summary
- Riot Platforms stock rose as the crypto market rebounded.
- The company will publish its financial results on Monday.
- The stock has formed a diamond reversal pattern, pointing to a potential reversal.
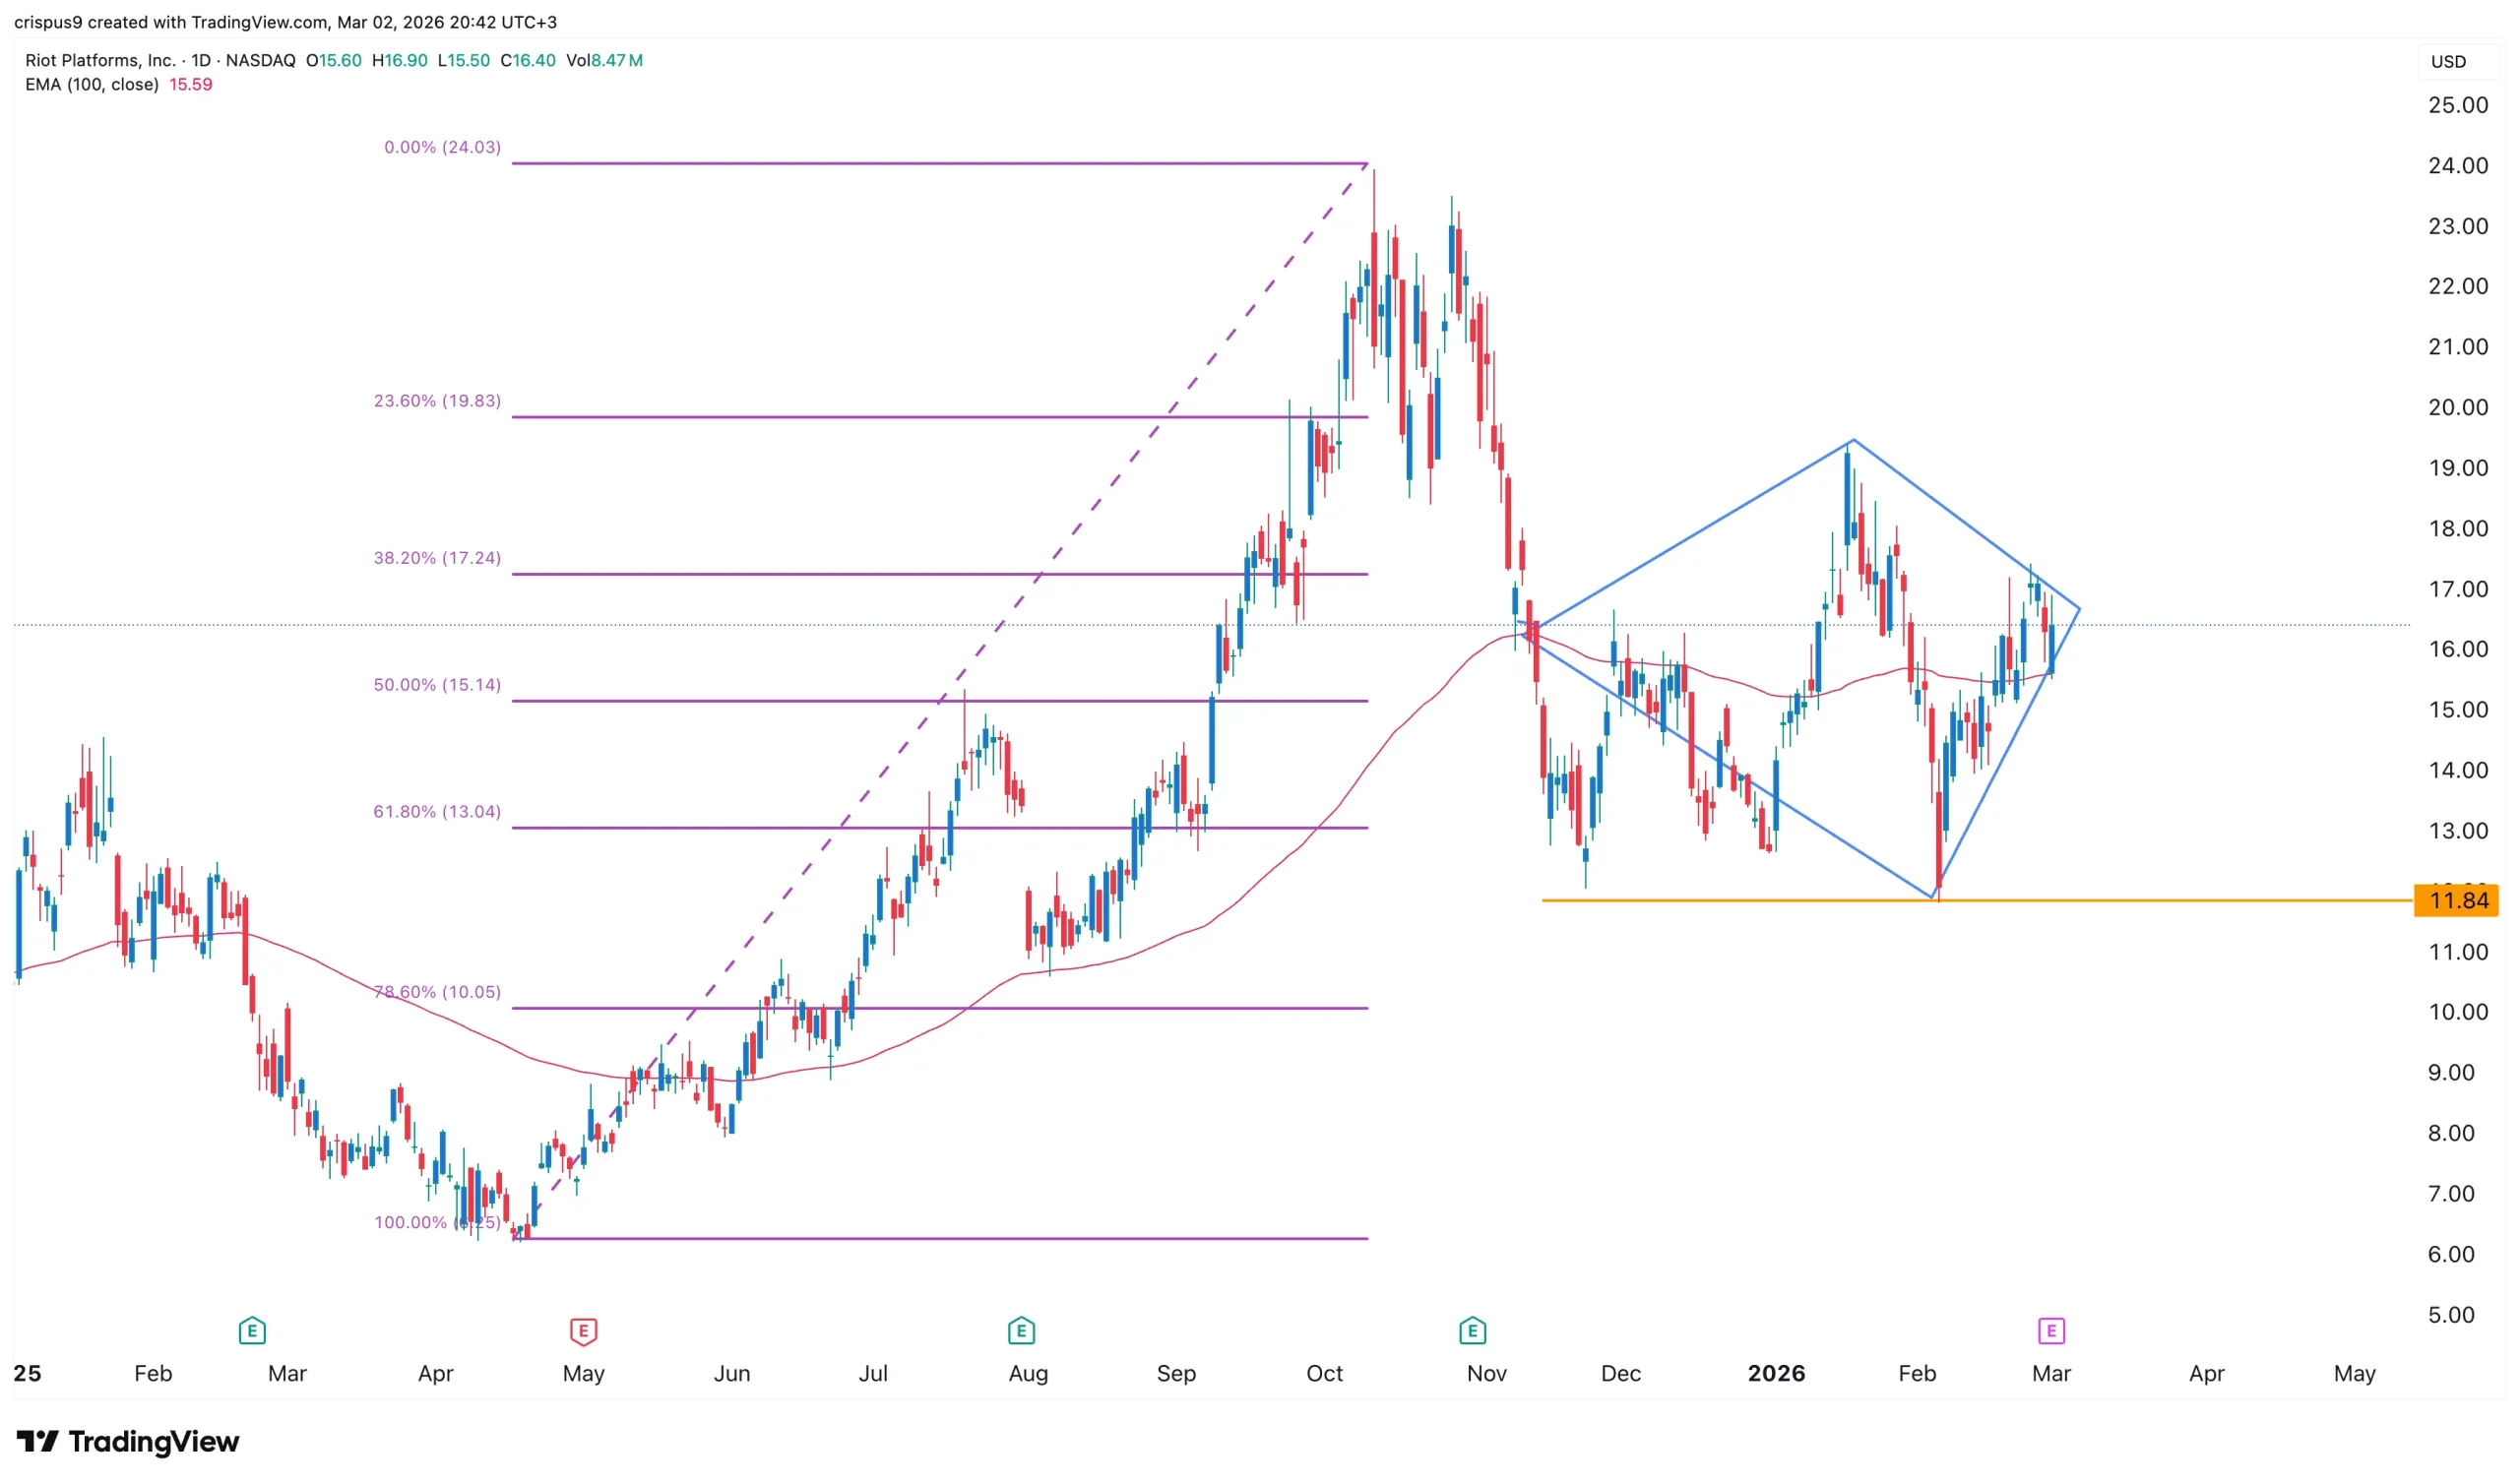
RIOT stock rose to $16.50 from the intraday low of $15.45. It remains 40% above its lowest level in February, with the market capitalization soaring to over $6.14 billion.
Wall Street analysts expect the upcoming results to show that the Bitcoin (BTC) mining giant did well in the last quarter, with its revenue rising by 10% to $158 million. Its annual revenue is expected to come in at $658 million, up by 75% YoY.
The most recent showed that its revenue jumped to $180 million in the third quarter from $84 million in the same period in 2024. This growth was driven by its mining operations, whose revenue rose from $67 million to $160 million. Its engineering revenue rose to $19 million from $12 million.
Like other Bitcoin mining companies, Riot Platforms is facing major challenges as the coin remains in a technical bear market after falling by over 40% from its all-time high. As a result, it is expanding to the data colocation industry, which is booming as companies boost their capital expenditure.
It recently acquired 200 acres of land in Texas to expand its mining operations. Also, it entered a data center leasing agreement with AMD, a top semiconductor company. Its initial deal is for 25 MW of IT capacity.
Riot Platforms is under pressure from Starboard Value, an activist investor, who believes that it should accelerate its transition into a data center operator. It wants it to accelerate the rollout of its data centers, a move that will make it more attractive to hyperscalers. For example, IREN has already inked deals worth over $10 billion, while CoreWeave has a backlog of over $50 billion.
Riot Platforms stock price technical analysis
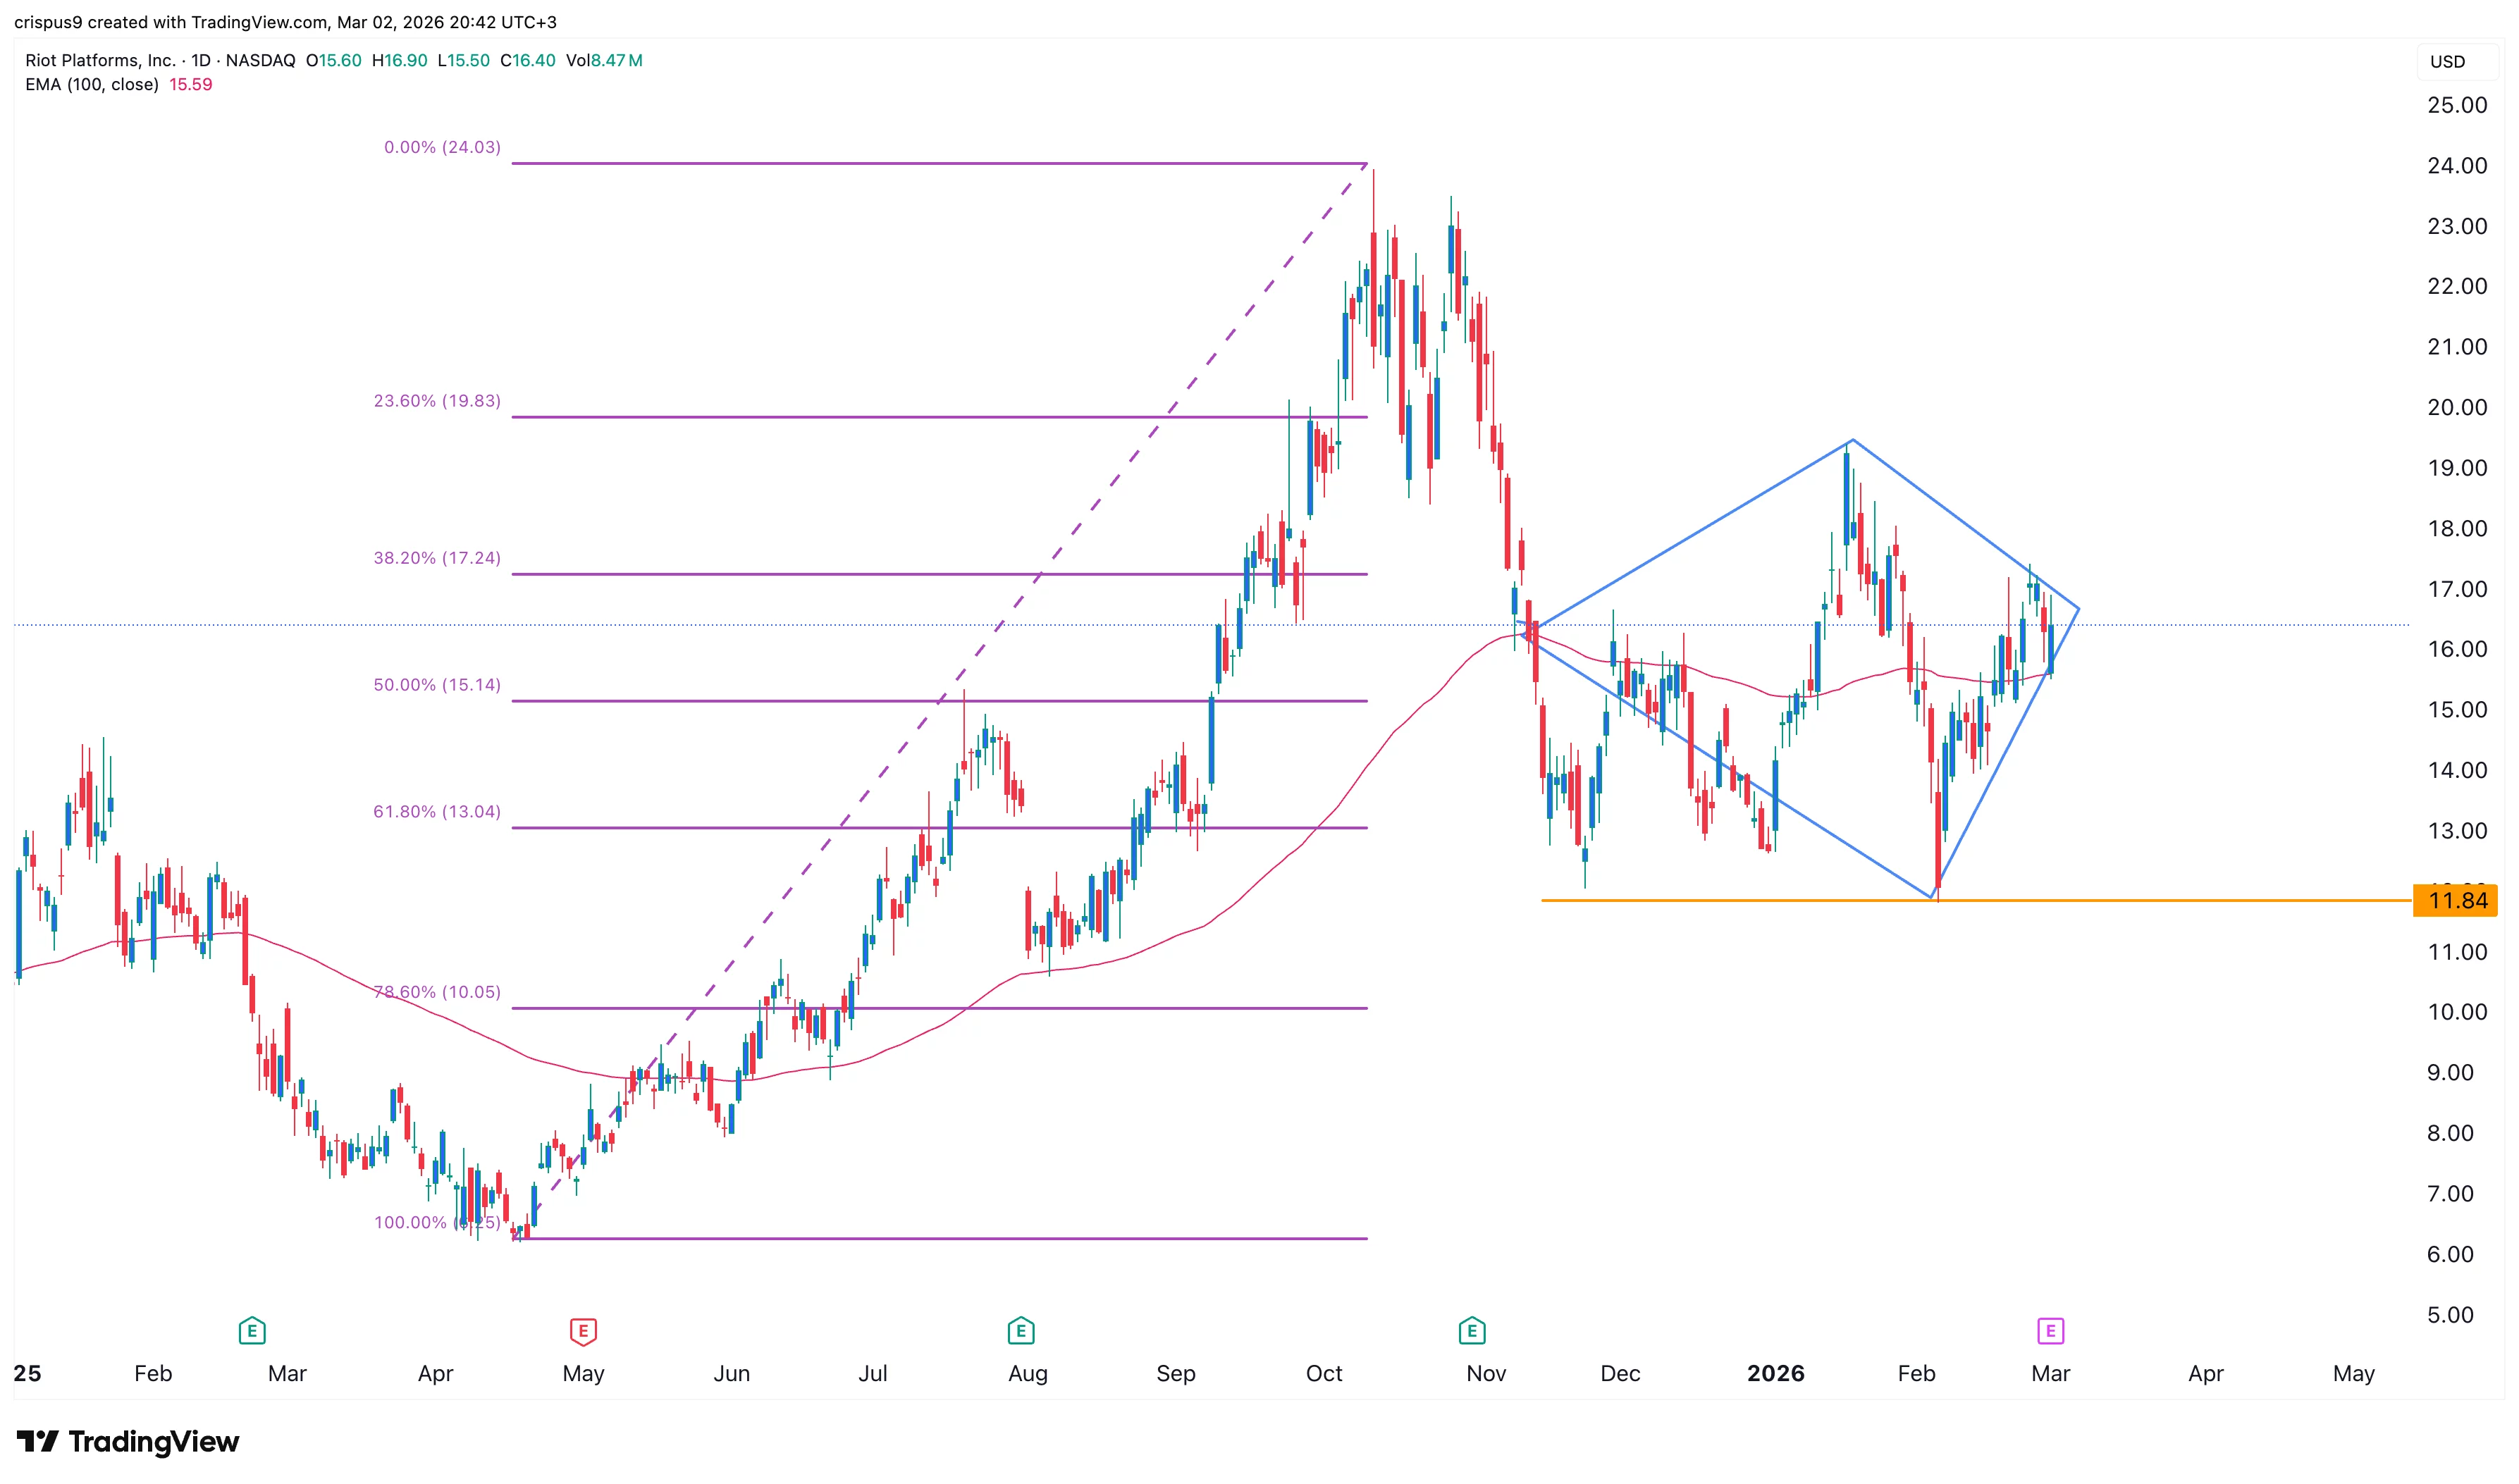
The daily chart shows that the Riot Platforms share price has rebounded from the year-to-date low of $11.85 in February to the current $16.50.
It remains between the 50% and 38.2% Fibonacci Retracement level. It also moved slightly above the 100-day Exponential Moving Average.
However, the stock has also formed a diamond reversal pattern, which often leads to a bearish breakdown.
Therefore, it will likely have a bearish breakdown after its earnings. If this happens, the next key target to watch will be the psychological level at $15.
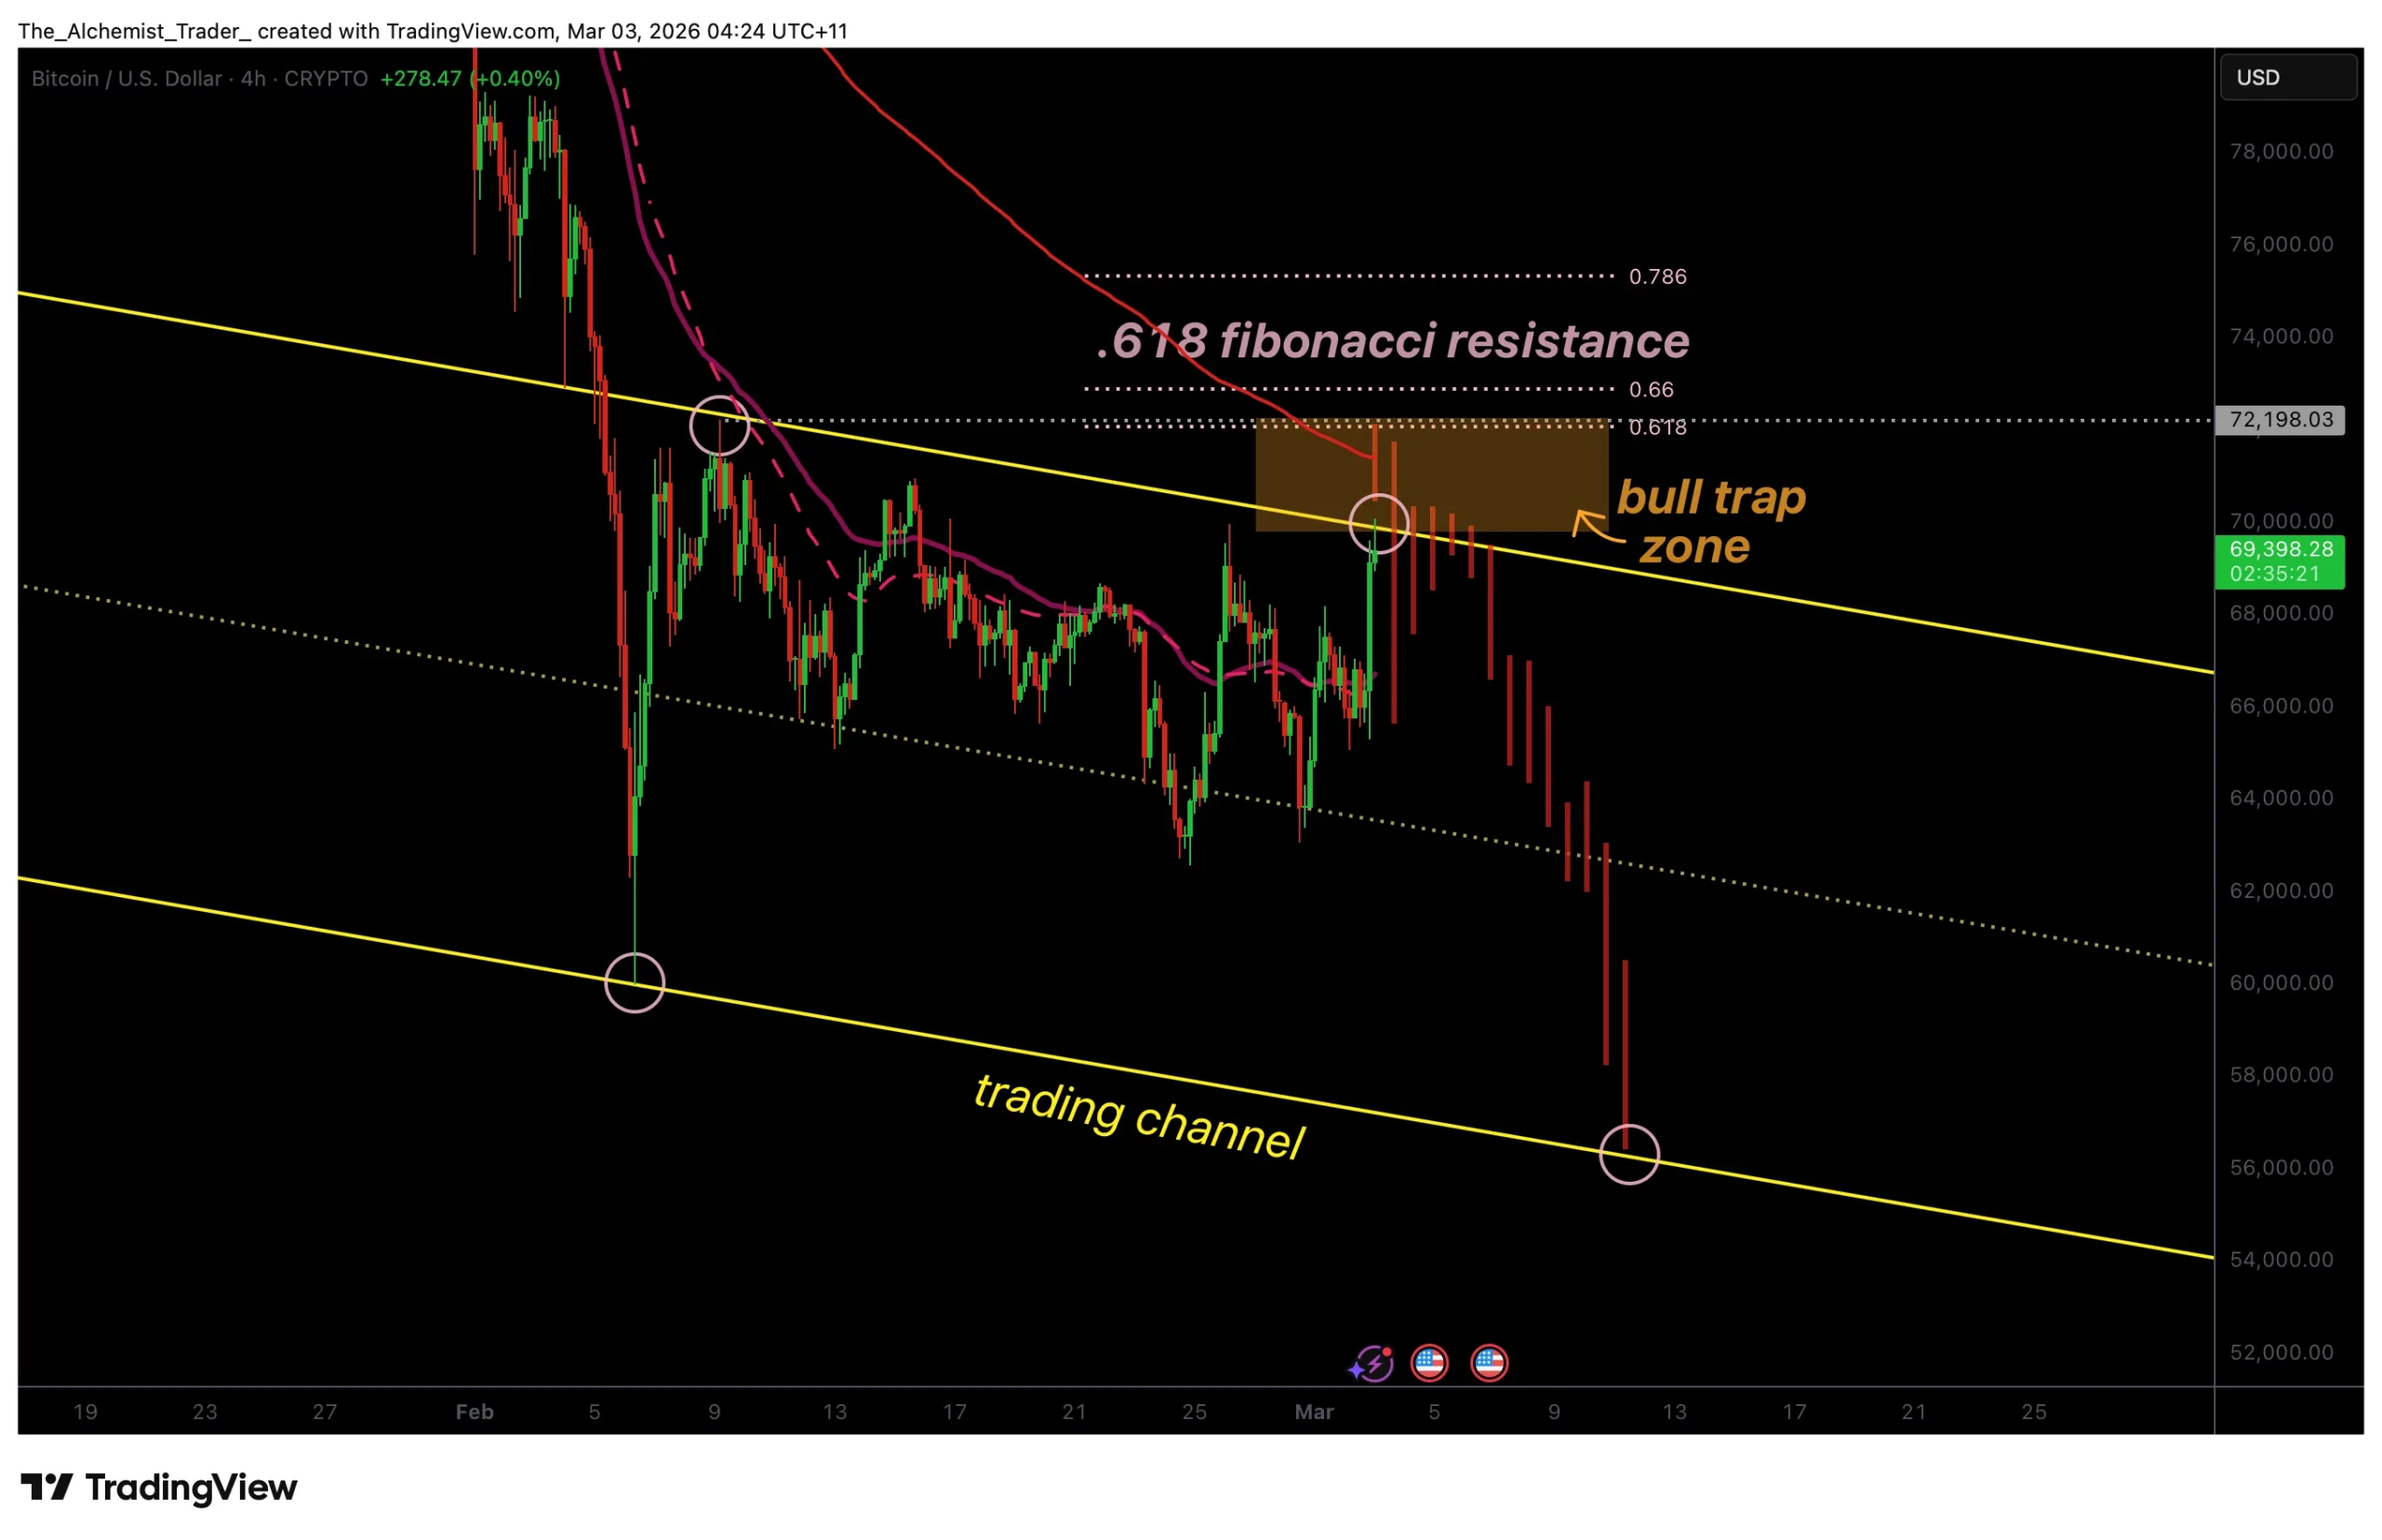
Bitcoin price impulsive rally is approaching a dense resistance cluster, raising concerns that the move could evolve into a bull trap.
Summary
- Price testing channel high and Fibonacci resistance
- Declining volume signals weakening bullish momentum
- Rejection risks rotation toward $60,000 channel support
Bitcoin (BTC) price has staged a sharp recovery from recent lows near $60,000, pushing price back toward the upper boundary of its broader trading channel. While the rally has improved short-term sentiment, the technical landscape suggests caution.
Multiple layers of resistance now converge above price, creating conditions where upside continuation may struggle to sustain momentum.
Bitcoin price key technical points
- Channel Resistance: Price approaching upper boundary of established trading channel.
- Fibonacci Confluence: Overhead resistance aligns with key swing high and moving averages.
- Volume Concern: Declining participation signals potential bull trap formation.

Bitcoin price recent rally has carried price above the channel midpoint, signaling short-term strength within the broader range. However, the move is now testing the upper channel boundary, an area that has repeatedly capped upside since $60,000 was established as the weekly low. This level represents a key structural ceiling within the ongoing consolidation phase.
Adding to the resistance confluence is the presence of a significant Fibonacci retracement level, which overlaps with a prior swing high and descending moving average resistance. When multiple technical indicators align within a narrow price zone, markets often react decisively. In this case, the overlapping resistance cluster increases the probability of rejection rather than breakout continuation.
Volume dynamics further reinforce caution. Despite the impulsive appearance of the rally, trading volume has steadily declined as price approaches resistance. Healthy breakouts typically require expanding participation to confirm strength.
Instead, fading volume suggests that buying pressure may be weakening, a classic precursor to bull trap scenarios, particularly as roughly 46% of Bitcoin supply is currently held at a loss, nearing levels seen during the 2022 bear market.
A bull trap typically forms when price briefly breaks above resistance, attracting breakout buyers, only to reverse sharply and close back below key levels. Should Bitcoin fail to hold above the channel high and instead fall back into the channel structure, it would signal weakness and confirm the trap setup. A bearish close back within the channel would likely shift momentum downward.
If rejection occurs, the next logical destination would be the lower boundary of the trading channel. Notably, the channel support has not been retested since the $60,000 weekly low was formed. Markets frequently revisit untested support zones to rebalance liquidity before determining the next major direction.
From a broader market structure perspective, Bitcoin remains range-bound rather than in confirmed bullish expansion. Without a decisive breakout supported by strong volume, rallies into resistance carry elevated failure risk.
The confluence of Fibonacci resistance, moving averages, and structural channel highs strengthens the argument that this zone may cap upside in the near term, particularly as Bitcoin navigates a defensive liquidity backdrop amid escalating US–Iran tensions and broader market volatility.
What to expect in the coming price action
Bitcoin’s rally remains vulnerable while testing confluence resistance with declining volume. A rejection from this zone would confirm a potential bull trap and increase the probability of a corrective move back toward channel support near $60,000.
Only a strong breakout with volume confirmation would shift the outlook decisively bullish.


U.S. spot Bitcoin ETFs added 21,000 BTC worth $1.45 billion, marking the first major accumulation wave since mid-October 2025.
Spot Bitcoin exchange-traded funds (ETFs) recorded one of their best days for weeks in terms of inflows on February 25, marking their first meaningful increase in holdings since mid-October 2025.
The shift comes as analysts point to falling retail flows and heavy unrealized losses among newer buyers as signs that market structure could be turning.
The Institutional Signal vs. Retail Exit
In a March 2 market update, analyst Amr Taha tracked two key data points that suggest a major shift in how Bitcoin moves between different types of investors. The first chart tracks 30-day cumulative Bitcoin inflows to Binance, separated into retail inflows (small investor flows) and whale inflows (large investor flows).
According to the chart, between February 6 and March 2, retail inflows dropped significantly, going from $14.1 billion down to $9.05 billion, a total contraction of approximately $5 billion.
What makes this interesting, Taha explained, is that nearly identical patterns appeared twice in 2025, with retail inflows contracting by about $8 billion from March 5 to April 7 of that year and falling by around $5 billion from June 6 to June 22. In both cases, the drop in retail inflows happened right before significant market movements.
The second chart tracks the total Bitcoin held by all US spot ETFs combined. Here, Taha observed something important occurring on February 25: for the first time since mid-October, ETF holdings increased meaningfully. Approximately 21,000 BTC flowed into the funds, equivalent to $1.45 billion at current prices, marking what Taha called the first noticeable accumulation wave after months of stagnation.
“Historically, rising ETF demand tends to be constructive for price, while declining demand often aligns with price weakness,” the crypto trader noted.
However, data from SoSoValue and FarSide show a different number. Both sites claim that the actual net inflows on February 25 were just over $500 million, or almost three times less than what Taha suggested. Nevertheless, it was still the best day for net inflows since mid-January.
You may also like:
Market Situation and Sentiment
The broader backdrop for this on-chain signal has been brutal, with Bitcoin posting five consecutive monthly losses for the first time since 2018, after ending February with a nearly 15% drop. The asset is currently trading just above $66,000, down by over 20% in the past month and sitting 47% below its October 2025 all-time high.
Analyst Crypto Dan offered additional context on market psychology, noting that most investors who purchased Bitcoin within the past two years are currently in loss positions.
“In the investment market, sharp reductions often follow when the majority of people are making big profits, and conversely, strong rallies tend to begin after most people experience significant losses,” he pointed out.
Dan suggested that if Bitcoin’s price drops below $60,000, putting the majority of investors (excluding very long-term holders) into loss territory, it could represent an accumulation opportunity for those with clear entry criteria.
As it is, Taha’s data suggests institutional buyers are already making that calculation, even as retail traders step back.
Binance Free $600 (CryptoPotato Exclusive): Use this link to register a new account and receive $600 exclusive welcome offer on Binance (full details).
LIMITED OFFER for CryptoPotato readers at Bybit: Use this link to register and open a $500 FREE position on any coin!
Fold, a publicly traded Bitcoin financial services company, has eliminated $66.3 million in convertible debt, removing a potential source of share dilution and simplifying its balance sheet as it prepares to expand its product lineup.
In a recent disclosure, Fold said it retired two outstanding convertible notes, which are debt instruments that can be converted into equity at a later date. By paying them off, the company reduces the risk that new shares would be issued in the future, which may dilute existing shareholders.
Fold also said it released 521 Bitcoin (BTC) that had been pledged as collateral against the debt. With the notes retired, those Bitcoin holdings are no longer encumbered and can now be used for corporate purposes.
The company said the restructuring leaves it with fewer financing restrictions and greater operational flexibility. Fold plans to use that flexibility to support growth initiatives, including the rollout of a consumer-targeted Bitcoin rewards credit card that offers BTC instead of traditional points or cash-back rewards.
Founded in 2019, Fold went public on the Nasdaq in February 2025 through a SPAC merger with FTAC Emerald Acquisition, becoming one of the first Bitcoin-focused financial services companies to trade on a major US exchange.

Related: ProCap boosts Bitcoin holdings to 5,457 BTC, aims to narrow NAV discount
Crypto rewards cards compete for users
Fold built its brand as a Bitcoin rewards platform, offering a debit card that allows users to spend US dollars while earning Bitcoin cashback on everyday purchases. Over time, the company expanded its services to include savings features and merchant partnerships aimed at encouraging Bitcoin accumulation rather than direct crypto spending.
Competition is fierce in the crypto rewards space, with a number of other companies offering similar products.
The Coinbase Card, for example, allows users to spend cryptocurrency balances directly and earn crypto rewards on purchases. It is now part of Coinbase’s broader “super app” strategy announced last fall, which aims to integrate payments, trading and other financial services into a single platform.
Rival offering Nexo Card lets customers borrow against their crypto holdings to make purchases without selling their assets, while earning rewards. Bybit and Crypto.com offer Visa-branded cards that provide cashback in crypto tokens tied to their platforms.

More recently, Mastercard and MetaMask launched a US crypto-linked card that allows users to spend digital assets at any merchant that accepts Mastercard, with crypto converted to fiat at the point of sale.
Related: PayPal draws takeover interest following 46% stock slide: Report

TLDR
- Turkey proposed a new bill that introduces a 10% tax on cryptocurrency income and gains.
- Lawmakers stated that platforms must withhold the tax on a quarterly basis for all users.
- The bill allows the president to adjust the withholding rate between 0% and 20%.
- Service providers would pay a 0.03% transaction tax on every crypto trade they facilitate.
- Authorities confirmed that tax enforcement will rely on detailed records kept by platforms.
- The bill connects all crypto definitions to the existing Capital Markets Law for consistency.
Turkey’s ruling party advanced a new plan that would introduce a 10% tax on cryptocurrency gains, and lawmakers presented the draft to parliament as they moved to update current tax laws while outlining new rules for service providers.
Proposed Crypto Tax Framework
Turkey introduced a draft bill that creates a new structure for crypto taxation, and lawmakers placed the proposal before the Grand National Assembly as they sought clear rules for the sector. They stated that platforms regulated under the Capital Markets Law must withhold a 10% tax on quarterly income and gains, and officials confirmed that this applies to residents and non-residents.
The bill grants the president the power to adjust the withholding rate, and officials said it could move between 0% and 20% depending on asset type. They also linked the tax rate to holding periods and wallet usage, and they highlighted that different token categories may face different rules.
The legislation introduces a 0.03% transaction tax for service providers, and it applies to the sale amount or market value of assets. Lawmakers said this measure covers platforms that facilitate trades, and they reported that brokers must maintain detailed records.
Authorities emphasized that incomplete user information may trigger enforcement, and the tax agency would pursue shortfalls directly from the user. The bill ties terms such as “crypto asset,” “wallet,” and “platform” to existing financial regulations, and it ensures consistent definitions across the law.
Market Context and International Comparisons
Chainalysis reported that Turkey recorded $200 billion in crypto activity between July 2024 and June 2025, and analysts stated that rising volumes followed economic pressure in recent years. They wrote that Turkey’s economic conditions pushed many users toward digital assets, and the report said people used crypto for alternative savings.
Turkey experienced inflation that peaked at 85% in late 2022, and the rate later stabilized near 30% by early 2025. Officials believe tax reform can support regulatory oversight, and they said the new framework aims to match existing market behavior.
Lawmakers referenced international trends, and they pointed to a Dutch plan that proposed a 36% capital gains tax on digital holdings. They acknowledged that the Dutch proposal awaits a Senate vote, and they said the measure could start in 2028.
The Turkish draft includes a VAT exemption for crypto deliveries covered by the transaction tax, and lawmakers confirmed that service providers fall under the updated expenditure rules. They also stated that foundation university hospitals will lose corporate tax exemptions in 2027, and they kept this clause in the broader bill.

TLDR
- Chainlink enabled the transfer of Coinbase’s cbBTC to Monad through its CCIP system.
- The integration opened new access to Bitcoin-backed liquidity for developers building on the Monad Foundation network.
- Early adopters such as Curvance and Neverland prepared markets built around cbBTC on Monad.
- Coinbase confirmed that cbBTC remains backed 1:1 by Bitcoin held in custody across multiple networks.
- CCIP now supports more movement of tokenized Bitcoin and enables new trading and lending products on high-speed systems.
The update links Coinbase’s cbBTC with Monad through Chainlink’s CCIP, and the move expands access to Bitcoin-backed liquidity while it also provides developers a direct route to build new on-chain financial products across the network.
Chainlink Expands cbBTC Access Through CCIP
Chainlink enabled the transfer of Coinbase’s cbBTC to Monad through its CCIP system, and the rollout opened new routes for Bitcoin-backed liquidity across DeFi. The network confirmed the integration on March 2, and it stated that it aims to support developers building on fast-settlement environments.
The bridge now moves cbBTC from Base to Monad, and users can place the asset in lending or trading markets without delays. Curvance and Neverland adopted the token early, and the two platforms plan to deploy structured products built around cbBTC.
Coinbase issues cbBTC with a 1:1 Bitcoin backing, and the asset holds more than $5 billion in circulation across multiple chains. The supply spans Ethereum, Base, Arbitrum, and Solana, and the new pathway expands distribution further into high-speed environments.
Chainlink said CCIP has processed over $28 trillion in on-chain value, and the protocol uses a standardized security model for cross-chain transactions. “The system moves assets with institutional-grade protection,” said Johann Eid, and he emphasized that the design supports broad multi-network activity.
Keone Hon of the Monad Foundation said the integration gives developers a strong base asset, and he stated that builders gain faster ways to expand Bitcoin-based markets. The network expects growing use cases that center on automated routing and high-frequency strategies.
cbBTC Liquidity Extends to Monad
cbBTC now enters markets that target high-speed settlement, and developers can design products that use Bitcoin-backed liquidity with lower fees. The network targets up to 10,000 transactions per second, and it aims for sub-second finality.
The integration creates access to deeper liquidity pools, and teams can design derivatives tied to Bitcoin prices with improved execution. Lending markets will also expand, and early platforms have begun preparing launch timelines.
Users gain additional ways to earn returns on Bitcoin-backed assets, and some current cbBTC markets already offer returns near 3%. The new route brings that activity to Monad, and teams intend to scale borrowing products around the asset.
The addition of cbBTC also increases available capital for automated trading programs, and developers gain predictable settlement times. This pairing aligns with the network’s push toward capital-intensive applications, and builders will test new strategies anchored to Bitcoin.
Monad now receives more than $5 billion in potential inflows from cbBTC, and teams across the ecosystem expect rising on-chain liquidity as markets expand access to Bitcoin-backed instruments.

Strategy (MSTR), the world’s largest publicly traded corporate holder of bitcoin, expanded its position last week by acquiring 3,015 BTC for approximately $204.1 million, or an average price of $67,700 each.
Bitcoin is trading at $66,000 on Monday morning, with MSTR shares flat in early action.
To fund the buys, Strategy raised roughly $229.9 million through common stock sales, along with $7.1 million in net proceeds of its Variable Rate Series A Perpetual Stretch Preferred Stock, STRC, according to a Monday filing.
Following the latest purchase, the company now holds 720,737 BTC acquired for roughly $54.77 billion, or an average price of approximately $75,985 per coin.


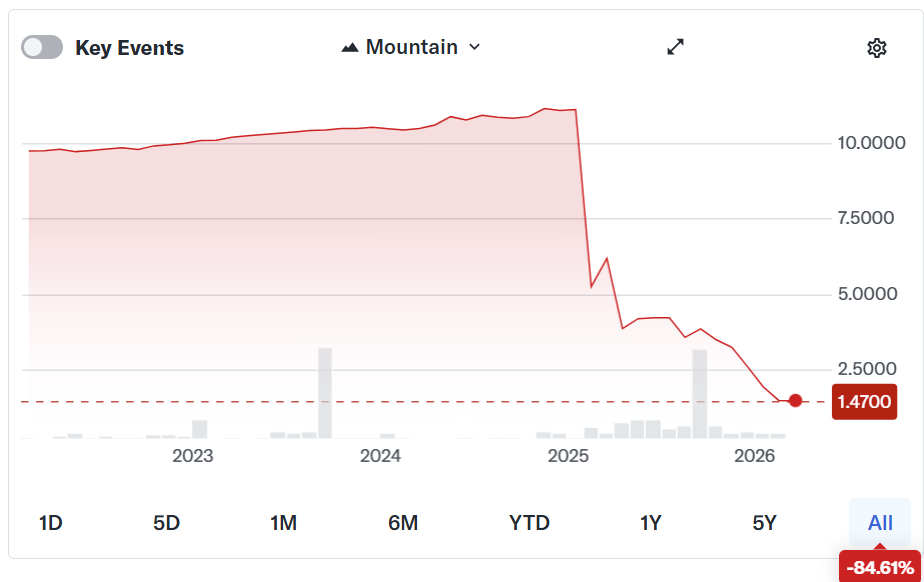
Magic Eden is winding down its Ethereum, Polygon, and Bitcoin NFT marketplaces to pivot resources toward its Solana operations and growing iGaming platform, Dicey.
The decision, confirmed by CEO Jack Lu, is that the platform will cease support for non-Solana chains by early April 2025, following a broad collapse in cross-chain trading volumes.
- Magic Eden will terminate support for Bitcoin and EVM marketplaces starting March 9, with full wallet shutdowns scheduled for April 1.
- The pivot follows internal data showing Solana markets account for over 85% of volume while multi-chain maintenance costs remained high.
- Resources will be reallocated to Dicey, a crypto gambling platform that processed $15 million in wagers during its closed beta.
In his post, CEO Jack Lu outlined a phased sunset for EVM and Bitcoin-based Runes and Ordinals markets.
Trading support will end on March 9, followed by the Bitcoin API on March 27. The platform’s crypto wallet will switch to an export-only mode in the middle of March before a full shutdown on April 1.
Lu stated the company is “doubling down” on Dicey, citing a “massive opportunity” in the intersection of finance and entertainment. The casino platform’s closed beta recently saw 200 users wager over $15 million in just two months.
The strategic shift mirrors a broader trend where crypto funds and companies are diversifying revenue streams; for instance, venture firm Paradigm plans to expand into AI and robotics to capture value beyond traditional digital assets.
Magic Eden plans to replicate this diversification by launching a sportsbook to compete with blockchain gambling heavyweights like Stake.
Discover: The next crypto to explode
Falling NFT Volume Forces Strategic Realignment
The retreat from multi-chain operations reflects a stark consolidation of NFT liquidity on Solana.
Despite raising over $130 million to expand support for Ethereum and Bitcoin Ordinals, market data indicates that Solana assets continued to drive over 85% of the platform’s trading volume in late 2024.
While Ethereum retains dominance in stablecoin infrastructure, its NFT sector has suffered prolonged decline, making the maintenance of cross-chain compatibility technically burdensome for decreasing returns.
Lu noted that the shift was ultimately driven by the fact that most of the platform’s non-Solana products were not contributing significantly to revenues.
The marketplace had briefly ranked No. 1 globally in early 2024 following its Bitcoin expansion, but sustained engagement failed to materialize as the Ordinals and Runes hype cycles cooled.
Going forward, the platform will exclusively focus on NFT packs that bundle random assets, attempting to gamify the remaining trading experience.
Will Magic Eden Exit Cause Token Volatility and Liquidity Concerns?
The announcement precipitated severe volatility for the ME token, which reportedly fell nearly 2.5% in the last 24 hours, although this was broadly in line with Ethereum’s losses over the period.
The exit also leaves a significant vacuum in the Bitcoin Ordinals market, which may strengthen competitors like OKX and UniSat that remain committed to the Bitcoin ecosystem.
Magic Eden’s long-term valuation now hinges on its ability to convert NFT traders into active gamblers on Dicey.
The platform’s user retention metrics after April 1 will be most insightful; if the pivot fails to capture the high volume gambling cohort, the total loss of the multichain user base could isolate the protocol from future liquidity cycles on Bitcoin and Ethereum.
Discover: The best Solana meme coins
The post Magic Eden Winds Down EVM and Bitcoin NFT Markets in Strategic Pivot appeared first on Cryptonews.


Prediction market Kalshi apparently allowed traders to bet on the ousting of Iranian Supreme Leader Ayatollah Ali Khamenei, racked up $54 million in trades, then voided the result the moment he was killed in a US-Israeli airstrike.
Kalshi listed its “Ali Khamenei out as Supreme Leader?” prediction market contract before he was killed on Saturday.
Although a fiery death at the business end of a US or Israeli missile would certainly, in most people’s eyes, count as being “out,” Kalshi’s rules technically contained a death carve-out.
Specifically, the fine print specified that if Khamenei’s removal happened via death, the contract wouldn’t pay out.
Traders were predictably furious. “Getting rugged on a 100% correct prediction because of a fine-print ‘death carveout’ is wild,” one user wrote on Kalshi’s Discord.
“What you’re doing is stealing,” wrote another.
Critics accused Kalshi of trying to have its cake and eat it too by platforming a contract in the first place that involved bets on human death, then hiding behind compliance language when reality hit.
It had the option all along to not list the market for trading, after all. It decided to list it and accept trades.
Using crypto to profit from death
Even though the market involved potential death, Kalshi promoted it on social media for days. Users wagered $54 million on it.
US Senator Chris Murphy called it “insane this is legal.”
Ex-SEC Chief of Staff Amanda Fischer told NPR that prediction markets are “promoting opportunities to bet on events that can only be seen as a proxy for war or assassination… this betting market shouldn’t exist in the first place”
Six Democratic senators had already urged the CFTC in late February to ban contracts tied to anyone’s death. Wagers on Khamenei’s killing made their letter prophetic.
On Polymarket, Kalshi’s less-regulated offshore competitor, the numbers were uglier.
Roughly half a billion dollars changed hands on contracts tied to when US forces would strike Iran which, again, has obvious ramifications on human life.
Crypto keeps building death markets
Sadly, crypto wagers on death are nothing new. Early concepts of cryptographic assassination markets have circulated since at least a 1995 essay by cypherpunk Jim Bell.
In 2018, crypto prediction platform Augur launched with assassination markets appearing almost immediately.
Read more: Lord Miles wants YouTubers to help settle Polymarket scandal
In September 2025, Polymarket hosted a multimillion-dollar market on whether YouTuber Lord Miles would survive a 40-day desert fast . Trading odds crashed when fears spread that he had actually died.
Hivemind progenitor Paul Sztorc repeated his multi-year call for a “fully peer-to-peer prediction market system that cannot be shut off by anyone under any circumstances.”
More recently, in January 2026, an anonymous Polymarket trader made $400,000 on a suspiciously well-timed bet on Venezuelan leader Nicolás Maduro’s downfall.
In February, Israeli authorities indicted two people for using IDF classified information to bet on Polymarket during military conflict last June between Israel and Iran.
Got a tip? Send us an email securely via Protos Leaks. For more informed news, follow us on X, Bluesky, and Google News, or subscribe to our YouTube channel.
TLDR
- Bitcoin moved near $70,000 while holders showed no panic during rising Middle East tensions.
- Short-term holder loss transfers dropped to a 2- week low as selling pressure eased.
- Realized losses fell to 3,700 BTC even as geopolitical risks increased across the region.
- BTC derivatives showed reduced risk as Binance open interest declined by 25 %.
- The leverage ratio reached a low weekly average that aligned with ongoing deleveraging.
Bitcoin traded near $70,000 on Monday as war fears grew across the Middle East, and the market held steady and pushed higher. Traders watched exchange activity closely because short-term flows shifted again. The latest chain data showed cooling loss-driven selling, and futures activity kept falling as open interest reset lower during the session.
Short-term Flows Shift as Loss Transfers Fall
Short-term holder loss transfers dropped to a two-week low, and this shift aligned with slowing exchange flows across major venues. Realized losses fell to 3,700 BTC on March 1 as tensions rose, and traders kept BTC above $63,000 as inflows stayed muted.
The reduction contrasted with early February, and that period saw 89,000 BTC sent at a loss within one day. Analysts said the current environment showed reduced stress and “zero panic,” and loss-driven inflows kept compressing into March.
This decline showed less pressure from recent buyers, and the market tracked whether losses would surge again. The steadier flows set a calmer tone, and traders watched if the pattern would hold under geopolitical pressure.
Bitcoin Holders Watch Liquidity Bands
BTC moved through $70,000 on the four-hour chart, and the price approached liquidity between $70,000 and $71,500. Traders said this area could turn into support, and they pointed to past supply reactions near $80,000.
Analysts highlighted growing clusters near the range highs, and these pockets sat between $70,000 and $73,000. They said these areas often pull price when they grow, and the market kept scanning for reactions.
Spot flows supported the move, and Binance recorded $7.79 million in positive delta during the breakout. Coinbase added $1.16 million, and OKX logged $3.7 million, and this pattern pointed to steady spot demand.
The activity showed stronger bidding across venues, and the move came while leverage decreased again. Traders then turned to the $71,500 band, and they watched for a reaction if buyers held the zone.
Derivatives Reset as Leverage Drops for Bitcoin holders
Futures data showed a clear reduction in risk, and analysts tracked a 25% contraction in Binance open interest since the year began. The metric fell from 130,800 BTC to 97,680 BTC, and the reset aligned with calmer positioning.
The estimated leverage ratio slipped to a 0.146 weekly average, and past cycles tied low readings with heavy deleveraging. This trend revealed a lighter market structure, and traders monitored the shift as BTC tested key monthly metrics.
BTC attempted to reclaim its Monthly RVWAP in the high-$68,000 zone, and trading above it placed the month’s average buyer in profit. Analysts said this move often changes positioning, and they watched to see if BTC could stabilize above the level.
The session ended with BTC near the $71,500 liquidity band, and the market focused on spot flows as the price tested the region.

Stefanos Tsitsipas clarifies South America comments

Cybercriminals hire women for voice scams, promising up to $1,000 while exploiting IT helpdesks worldwide

BITCOIN: We’re Being Played! (here’s proof) – BTC, ETH, XRP Price Prediction Today


-

 Fashion3 days ago
Weekend Open Thread: Iris Top
-

 Politics4 days ago
ITV enters Gaza with IDF amid ongoing genocide
-

 Business6 days ago
True Citrus debuts functional drink mix collection
-

 Tech2 days ago
Unihertz’s Titan 2 Elite Arrives Just as Physical Keyboards Refuse to Fade Away
-
Sports3 days ago
The Vikings Need a Duck
-

 Crypto World7 days ago
XRP price enters “dead zone” as Binance leverage hits lows
-
 NewsBeat2 days ago
Dubai flights cancelled as Brit told airspace closed ’10 minutes after boarding’
-

 NewsBeat5 days ago
Cuba says its forces have killed four on US-registered speedboat | World News
-

 Tech6 days ago
Unsurprisingly, Apple's board gets what it wants in 2026 shareholder meeting
-
 NewsBeat2 days ago
The empty pub on busy Cambridge road that has been boarded up for years
-
 NewsBeat5 days ago
Manchester Central Mosque issues statement as it imposes new measures ‘with immediate effect’ after armed men enter
-

 NewsBeat1 day ago
‘Significant’ damage to boarded-up Horden house after fire
-

 NewsBeat2 days ago
Abusive parents will now be treated like sex offenders and placed on a ‘child cruelty register’ | News UK
-
 NewsBeat6 days ago
Police latest as search for missing woman enters day nine
-

 Entertainment13 hours ago
Baby Gear Guide: Strollers, Car Seats
-

 Business5 days ago
Discord Pushes Implementation of Global Age Checks to Second Half of 2026
-

 Business4 days ago
Only 4% of women globally reside in countries that offer almost complete legal equality
-
 Tech3 days ago
NASA Reveals Identity of Astronaut Who Suffered Medical Incident Aboard ISS
-

 Crypto World6 days ago
Entering new markets without increasing payment costs
-
Politics2 days ago
FIFA hypocrisy after Israel murder over 400 Palestinian footballers