

Crypto World
Bitcoin DeFi without complexity: Rootstock’s user-friendly approach


Disclosure: This article does not represent investment advice. The content and materials featured on this page are for educational purposes only.
Bitcoin DeFi platforms on Rootstock simplify staking, rBTC rewards, and DeFi access for mainstream users.
Summary
- Rootstock is expanding Bitcoin DeFi access with staking, rBTC rewards, and EVM-compatible infrastructure.
- The sidechain has operated since 2018, offering lower fees, faster confirmations, and Bitcoin-backed security.
- RootstockCollective lets users stake RIF tokens while helping fund Bitcoin-focused builders through its DAO model.
Bitcoin DeFi is no longer reserved for technical experts. Platforms built on Rootstock make it simple to stake RIF, earn rBTC rewards, and participate in decentralized finance backed by Bitcoin’s consensus security, no specialized knowledge required.
Why Bitcoin DeFi has been so hard
Less than 1% of all BTC is deployed in decentralized finance, despite Bitcoin being the most widely held cryptocurrency. The reason is friction: specialized wallets, multi-chain bridging, unfamiliar gas tokens, and confusing interfaces. A BTCFi survey reported that 36% of respondents avoid BTCFi entirely due to lack of trust.
That’s changing fast. BTCFi total value locked grew roughly 20x from about $307 million in January 2024 to approximately $6.5 billion by mid-2025 (figures vary by methodology), driven by EVM-compatible Bitcoin sidechains like Rootstock that bring familiar tools to Bitcoin’s security.
How Rootstock and RootstockCollective remove the barriers
Rootstock is Bitcoin’s longest-running sidechain, operating since 2018 with 100% uptime. It inherits consensus security from Bitcoin via merged mining (participation reported in the 60–80%+ range of Bitcoin’s hashpower) while offering full EVM compatibility. The native token rBTC is pegged 1:1 to Bitcoin via the PowPeg bridge, a federated peg design. Transactions confirm within one to two blocks, fees are far lower than Ethereum’s (reduced ~60% after network upgrades), and the ecosystem includes 150+ partner applications with familiar names like Uniswap (via Oku), SushiSwap, and LayerBank.
RootstockCollective is the first DAO built for Bitcoin builders on this foundation. It’s where users can stake RIF tokens AND directly fund builders, combining rewards with real ecosystem impact. Key features that simplify onboarding:
Feature
Traditional Bitcoin DeFi
RootstockCollective on Rootstock
Wallet setup
Specialized, unfamiliar wallets
MetaMask and popular EVM wallets via Reown AppKit
Gas costs
High and unpredictable
Far lower than Ethereum; reduced ~60% after upgrades
Custody model
Often custodial or wrapped
Non-custodial; the user controls tokens
Reward transparency
Variable, often unclear
Bi-weekly distributions in rBTC, RIF, and USDRIF
Staking flexibility
Lock-up periods common
No lock-up; unstake anytime
With an approximately 20% average Annual Backer Incentive (varies by period), over 3.7 BTC,1.4 million RIF and $20k USDRIF paid out in Collective Rewards, and 35 million+ RIF staked, the reward mechanics are transparent and proven. Governance happens on-chain via the RootstockCollective dApp, so that funds can be seen exactly where they go.
Start earning in six steps
Step 1: Set Up a Wallet. Install MetaMask (or Rabby, SafePal, etc.) and add the Rootstock network by visiting the Get RIF page and clicking “Add RIF to wallet.” It configures everything automatically. Coming soon: social login via MagicLink for users new to web3 wallets.
Step 2: Get RIF Tokens. Purchase RIF on Binance, Gate.io, Bitget, or MEXC, then withdraw to a wallet. When withdrawing, select the RSK/Rootstock network, not ERC-20 or BEP-20. Alternatively, use Symbiosis or Router Protocol to bridge assets directly to Rootstock.
Step 3: Get rBTC for Gas. Swap a small amount of RIF for rBTC on SushiSwap (select RIF → rBTC and confirm), even 0.001 rBTC covers many transactions. Users can also bridge BTC via the PowPeg app at 2wp.rootstock.io (Fast Mode completes in ~20 minutes) or use Boltz.
Step 4: Stake RIF. Visit the official website, click “Connect Wallet” (top right), and select a wallet. Navigate to “Stake,” enter an amount, click “Stake,” and approve in MetaMask. RIF converts to stRIF at 1:1. After approving, the user has voting power in the DAO.
Step 5: Back Builders. Go to the Builders screen to see active builders. Review each builder’s “Backer Share %”, the percentage of earnings they share with backers. Hover over a chosen builder, press “Back builder,” then type an allocation or drag the allocation bar on the Backing page. Confirm on-chain. Example: if a builder earns 20% of total cycle rewards and sets a 25% Backer-Reward Percentage, backers collectively receive 5%, distributed proportionally by allocated stRIF.
Step 6: Claim Rewards. Go to the Holdings screen, view “My Balances,” and click “Claim Rewards.” rBTC, RIF, and USDRIF arrive in a wallet after approval. There’s no deadline; rewards remain available until they are collected.
Two roles, one virtuous cycle
RootstockCollective runs on two complementary roles.
- Backers stake RIF, vote on proposals, and allocate stRIF to support builders, earning a share of their rewards proportional to their backing.
- Builders, teams creating dApps, protocols, and infrastructure on Rootstock, submit proposals, receive community votes, and access grants plus ongoing Collective Rewards. The more backing a builder attracts, the larger their share of the reward pool, and a portion flows back to their backers.
Current ecosystem projects include OpenOcean, Boltz, WoodSwap, Money On Chain, Tropykus, WakeUp Labs, LayerBank, Steer Protocol, Symbiosis, Hunters of Web3 and Top Tier Alliance, and more. All smart contracts are built on audited OpenZeppelin libraries, treasury is managed through multisig controls with Foundation oversight, and all actions are recorded on-chain.
The next step: visit the RootstockCollective website, connect a wallet, and stake the first RIF.
Disclosure: This content is provided by a third party. Neither crypto.news nor the author of this article endorses any product mentioned on this page. Users should conduct their own research before taking any action related to the company.

Crypto World
Ondo Finance Adds 173 Tokenized Stocks and ETFs, Taking Catalog Past 430 Assets Across Three Chains


Ondo Finance added 173 tokenized stocks and ETFs to Ondo Global Markets on Tuesday, pushing its catalog past 430 assets available across Ethereum, Solana, and BNB Chain. Ondo Finance's official X account announced the expansion on June 17. The batch spans some of the most capital-intensive corners… Read the full story at The Defiant
The CME Group has said that it will sue the Commodity Futures Trading Commission (CFTC) over its decision to approve perpetual futures in the U.S.
CEO Terrence Duffy told CNBC on Wednesday that the firm plans to file the lawsuit on Thursday, saying its case will be based on the argument that perpetual futures are swaps under the Dodd-Frank Act.
Perpetuals Should Be Classified As Swaps
Duffy said CME believes the products should be treated as swaps instead of futures contracts, adding that the company’s benchmark licensing agreements mean providers offering them would need to work through the exchange.
“We have an exclusive license with every single provider of the benchmarks. So all of these would have to go through CME regardless of the perpetual,” said Duffy.
Perpetual futures are contracts that do not have an expiration date and allow traders to speculate on an asset’s price without directly owning it.
The development follows the CFTC’s May approval of Kalshi to offer BTC perpetual futures, making it the first time the product was greenlighted for the U.S. market. Meanwhile, the offering has already been widely used in international markets, with the prediction market platform already making plans to expand its range to include other cryptocurrencies.
Last year, Coinbase also became the first exchange to offer these derivatives to American investors through its Coinbase Financial Markets (CFM) platform.
Duffy Says CME is Ready for the Dispute
The CEO said the company has been preparing for the legal battle with its board for the past eight months and is prepared to proceed with the challenge.
“I’ve never shied away from one, and I won’t shy away from this…And that’s why I wanted to announce on your show that we will be filing this litigation tomorrow, because we are not taking this lightly,” he said.
Elsewhere, CFTC Chair Michael Selig has defended the agency’s decision to approve perpetual futures in the U.S., saying the move was aimed at allowing regulated products without expiration dates to become available domestically while ensuring they operate under American oversight.
The post CME Group to Sue CFTC Over Approval of Bitcoin Perpetual Futures appeared first on CryptoPotato.

SpaceX celebrates their IPO at the Nasdaq on June 12th, 2026.
Adam Jeffery | CNBC
The average investor who bought SpaceX shares in the open market after its debut has seen nearly all of their gains disappear as a sharp pullback erased a large chunk of the stock’s post-IPO surge.
Shares of SpaceX fell 3.6% Thursday to just under $184.98 a share. The stock’s five-day volume-weighted average price, or VWAP, is $181.71 a share. VWAP measures the average price a security has traded throughout the day, weighted by trading volume and is widely used by traders to gauge investors’ positioning.
The move suggests the average post-IPO buyer is now approximately breaking even.
The stock soared from its $135 IPO price to an intraday high above $225 on Tuesday as investors piled into one of the most anticipated public offerings in years. Since then, however, shares have retreated 20%, wiping out much of the gains accumulated after the debut. It’s now back to where it was trading on day two, Monday..
The decline has also narrowed the profits for thousands of retail investors who gained access to the IPO through brokerage platforms including Robinhood, Fidelity and SoFi. While many individual investors received only a fraction of the shares they requested — in some cases just one or a handful of shares — those allocations were purchased at the $135 offering price, leaving them with gains even after the recent pullback.
The reversal underscores how quickly sentiment has shifted following the company’s blockbuster debut. After briefly pushing SpaceX’s market value close to $3 trillion, investors have begun reassessing whether the stock’s rapid advance can be justified by fundamentals.
— CNBC’s Chris Hayes and Deena Zaidi contributed to the story.

Key Highlights
- Intel stock soared following news of a strategic chip collaboration with Apple centered on domestic U.S. production facilities
- Major semiconductor names like Nvidia, Micron, and Broadcom staged a powerful comeback following recent weakness
- SpaceX experienced its most significant drop since its blockbuster public debut as early investors locked in returns
- Crude oil retreated on optimism surrounding potential diplomatic progress between the United States and Iran
- Apple cautioned investors that escalating memory and storage component expenses may necessitate higher device pricing
Intel’s shares surged during Wednesday’s trading session following revelations that Apple intends to partner with the chipmaker on design and production initiatives within American borders. The strategic alliance between these tech giants is anticipated to focus on semiconductor projects as the nation intensifies efforts to expand domestic chip manufacturing capabilities.
This development arrives as welcome news for Intel during a critical transformation period. The company has been aggressively expanding its contract manufacturing operations—referred to internally as its foundry business—in an effort to challenge industry leaders such as TSMC and Samsung.
Semiconductor Sector Mounts Impressive Comeback
The wider chip industry experienced a robust trading day. Nvidia, Micron, Broadcom, and Marvell Technology each recorded significant advances following several challenging weeks.
Market participants had been stepping away from semiconductor investments amid worries about elevated valuations and interest rate dynamics. Numerous investors viewed the recent decline as an attractive entry point to rebuild positions.
Artificial intelligence continues serving as the primary catalyst for sector demand. Corporations are allocating substantial capital toward AI processors, data center infrastructure, and network equipment, with industry observers projecting this momentum to persist.
SpaceX Experiences Profit-Taking Pressure Following Historic Public Offering
SpaceX endured one of its most challenging trading sessions since its market debut earlier in the year. Shares declined as initial investors capitalized on profits following the company’s unprecedented IPO performance.
The SpaceX public offering set records as the largest ever completed. The enterprise’s diversified operations spanning rocket technology, satellite broadband services, artificial intelligence, and defense contracting generated substantial early enthusiasm among market participants.
Industry analysts note that post-IPO price swings are typical following high-profile market entries. The stock is projected to exhibit continued volatility in coming sessions as market forces establish appropriate valuation levels.
Crude Prices Decline on Diplomatic Optimism
Oil prices retreated as market participants grew increasingly hopeful regarding potential diplomatic breakthrough between Washington and Tehran. Should Iran resume greater oil exports to international markets, global supply would expand and prices would face additional downward pressure.
Decreasing crude costs typically provide relief for aviation companies, logistics firms, and end consumers. They can also alleviate pressure on monetary authorities working to contain inflationary forces.
Apple Signals Potential Device Price Increases
Apple informed the investment community that escalating expenses for memory and storage elements may result in price adjustments for upcoming product releases. The technology leader has been impacted by robust demand for AI-focused semiconductors, which has elevated costs for critical components within its supply chain.
Market watchers are monitoring whether potential price hikes will impact unit sales volumes and the company’s profitability metrics.
Apple’s cost warnings underscore how artificial intelligence investment is creating cascading effects throughout the broader technology landscape, influencing everything from enterprise computing infrastructure to consumer-facing electronics products.

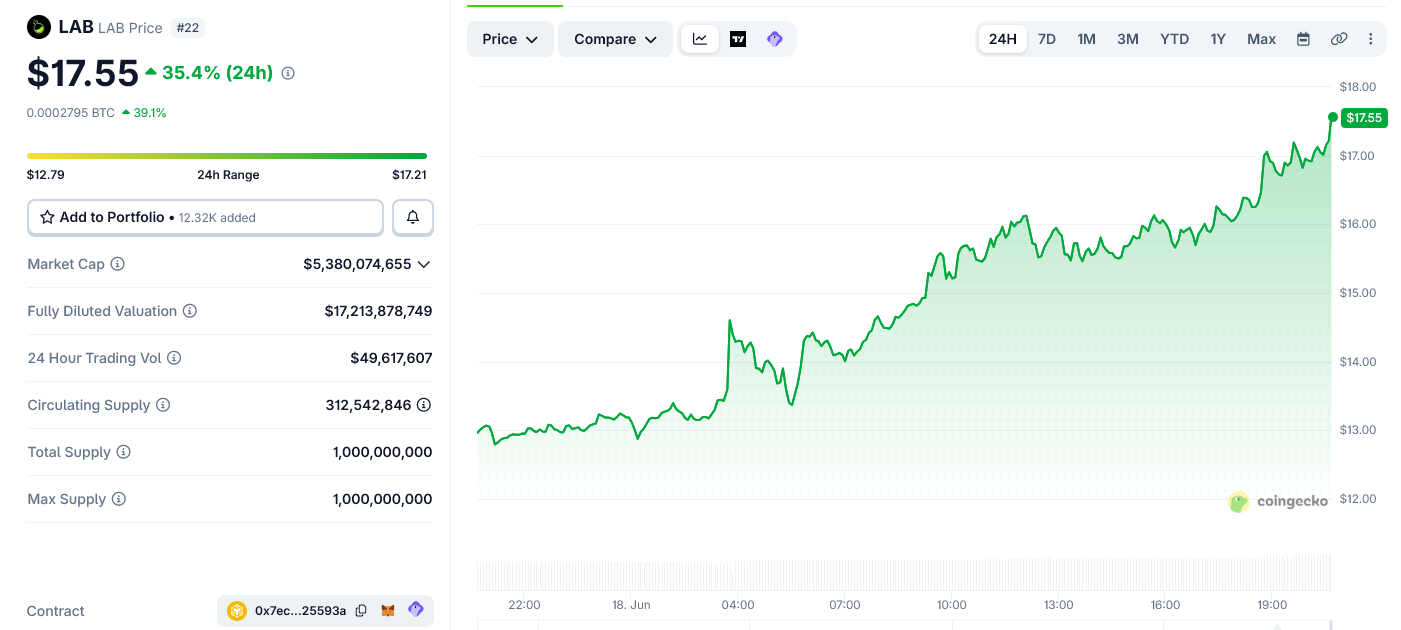
LAB jumped more than 19% in a single day, reclaiming the $17 area as whale wallets stacked fresh long positions. A parabolic curve on lower timeframes now points the token toward $19.
The move extends a recovery off the $7 support band, where larger holders defended price and printed a higher low. On-chain positioning and momentum readings now suggest buyers still hold the advantage.

Whale Wallets Pile Into LAB Longs
Whale positioning leans heavily bullish. The notional long-to-short ratio is 260.67%, indicating long exposure outweighs shorts by roughly 2.6 times across 214 tracked whales.
The 129 long whales hold $27.58 million in positions at an average entry of $10.25. That cohort shows 92.24% profitability and $4.73 million in unrealized gains.

The 85 short whales tell the opposite story. They hold $10.58 million at an average entry of $10.85, yet only 4.70% sit in profit, with $1.30 million in unrealized losses.
Short-term flow confirms the same bias. Over the past hour, 67 whales bought against 35 sellers, with net buy volume of $490,000 versus $179,000 in net selling.
This accumulation echoes recent whale buying across other altcoins. A sustained move below the $13 zone would be the first sign that longs are unwinding.
RSI Climbs Toward Overbought Territory
On the daily chart, LAB reclaimed the $16 area with a daily candle up more than 19%, extending the uptrend that began at the May 29 low after the price bounced off the $7 support band and printed a higher low (blue circle).
The token now tests the 0.5 Fibonacci retracement at $16.03 as resistance, with the 0.382 level near $18.84 standing as the next upside target if buyers hold control.

Momentum supports the whale bias, though it carries a warning. The daily Relative Strength Index (RSI) reads near 65 and is rising into bullish territory.
On the hourly chart, RSI trades inside an ascending parallel channel and sits just above the midline. That structure leaves room for a push toward the channel’s overbought extreme.

However, the advance comes on thin volume. A parabolic move into overbought conditions on weak participation often precedes sharp pullbacks. Therefore, the same readings that look bullish now could flip quickly if buyers fail to follow through.
LAB Price Prediction and the $13 Line
The hourly chart shows LAB tracking a steepening parabolic curve since the May 29 low. The token trades near $15.46 and is testing the 0.5 Fibonacci retracement at $16.03 as immediate resistance.
A clean break opens the path to the 0.382 Fibonacci level near $18.84, just below $19. That target is roughly 22% above the current price and aligns with the rally’s next logical resistance level.

Momentum favors that scenario in the near term. However, parabolic structures rarely hold for long, and the thin volume behind this leg keeps the risk of a fast reversal elevated.
The critical support is the 0.618 Fibonacci level at $13.21, the same $13 zone whales are watching. Losing it would invalidate the bullish thesis and expose the 0.786 level near $9.20.
Fundamentals add risk to the setup. A scheduled unlock of 282 million tokens in August could pressure a market still recovering from its June crash, when LAB fell 77% from its record high of $27.96.
For now, LAB price holds above support and eyes $19, but $13 remains the level that decides the trend.
The post BNB Chain’s LAB Token Keeps Exploding in a Parabolic Rally: What’s Next? appeared first on BeInCrypto.


Michael Saylor’s bitcoin (BTC) treasury company Strategy has lost 40 years of forecasted dividend coverage in just seven months.
On November 20, the company announced, “At current BTC levels, we have 71 years of dividend coverage assuming the price stays flat.”
However, on Thursday morning, it admitted, “We have 32 years of dividend coverage through our BTC Reserve.” A few hours later, the counter on its homepage ticked down to 31.
Things aren’t going well for Strategy. As of writing time, the company’s common stock, MSTR, is within 7% of its 52-week low and its largest dividend-paying stock, STRC, hit an all-time low today.
Strategy loses four decades of dividend coverage
Strategy calculates Dividend Coverage using elementary division, dividing the market value of its BTC holdings by its forecasted year of dividend payments.
Obviously, the lower the price of BTC, the fewer years Strategy can pay dividends by hypothetically selling its BTC.
Moreover, years decrease even with a flat BTC price as Strategy increases its annual dividend obligations by issuing more dividend-paying shares.
This second cause, also known as dilution, is the primary reason for Strategy’s shortened runway.
Indeed, the company has aggressively diluted shares of its preferred stocks, especially STRC. On November 20, 2025, the total face value of STRC was $2.8 billion. Today, it’s $10.5 billion.
All of those extra preferred shares pay dividends.
Read more: Saylor distances himself from STRC-backed DeFi after stablecoin wobble
STRC hit an all-time low today
STRC, according to dubious claims about its stability and comparisons to savings accounts or money markets, pays a variable 11.5% annualized dividend rate and is supposed to trade near its $100 par value.
In fact, it trades at wildly lower prices than that Saylor’s intention. Today, for example, STRC fell to an all-time low of $82.53, 17.5% below its intended price.
As the price of BTC dropped from about $90,000 in mid-November to roughly $63,000, a decline of 30%, smaller numerator reduced Strategy’s dividend coverage.
Over the same time period, Strategy ran up its dividend bill. Annual preferred obligations have increased by hundreds of millions of dollars, and they all require USD cash.
Over the last seven months, the company kept diluting preferred shareholders, manufacturing more obligations that never end, in order to fund one-time purchases of BTC that are almost entirely underwater as the BTC bear market has continued lower.
Got a tip? Send us an email securely via Protos Leaks. For more informed news and investigations, follow us on X, Bluesky, and Google News, or subscribe to our YouTube channel.


The punishments of Alexander Mashinsky, the imprisoned former chief of Celsius until its high-profile collapse, continue with a formal banishment from any ability to seek business with the U.S. Commodity Futures Trading Commission or the trading it oversees.
The derivatives regulator didn’t pile any new fines onto Mashinsky, who previously pleaded guilty to accusations he misled the public about the health of his failing crypto firm as it was imploding, but the agency added an expected registration and trading ban, according to a Thursday statement. That’s a minor addition to the 12-year prison sentence imposed in his criminal case, in which he pleaded guilty to fraud, was hit with a $50,000 fine and ordered to return $48 million.
The CFTC’s arrangement, which “permanently restrained, enjoined and prohibited” him from any commodities activity, has been recorded in U.S. District Court for the Southern District of New York, according to the filing, and was approved by a judge on Thursday, the court docket shows.

Key Takeaways
- Strategy’s common stock plummeted nearly 6%, settling around $109 following STRC preferred stock’s decline to an all-time low of $89
- The STRC price drop beneath $100 par value has suspended Strategy’s capacity to issue additional shares for bitcoin acquisitions
- In May, Strategy liquidated 32 bitcoin — marking its first cryptocurrency sale since 2022 — to cover STRC dividend obligations
- Board member Jarrod Patten offloaded approximately $9 million in MSTR shares across a three-month period; additional executives sold earlier this year
- Wall Street firms including Bernstein, TD Cowen, Citigroup, and BTIG maintained positive ratings with price objectives ranging from $250 to $450
Strategy (MSTR) shares experienced a sharp 6% decline Thursday, hovering near $109, as the company confronted mounting challenges from several fronts — deteriorating preferred share valuations, executive stock sales, and a subdued cryptocurrency market following the Federal Reserve’s recent policy announcement.
The primary catalyst was the decline of STRC, Strategy’s Stretch preferred stock, which plummeted to an unprecedented low of $89. This development carries significant implications because STRC’s trading price below its $100 par value has compelled Strategy to suspend its at-the-market offering program — the principal vehicle through which it generates capital for bitcoin purchases.
With this financing avenue now closed, Strategy’s fundamental bitcoin acquisition model has ground to a halt.
Company Breaks Bitcoin-Only Policy
Toward the end of May, Strategy liquidated 32 bitcoin for roughly $2.5 million to satisfy STRC dividend requirements. This transaction represented the company’s first bitcoin sale since initiating its accumulation program in 2022.
Executive Chairman Michael Saylor had consistently championed a hold-only approach. The sale marked a significant shift from that established strategy, though analysts from Benchmark and TD Cowen dismissed concerns about a wider strategic unraveling.
Compounding the competitive dynamics, Strive’s competing SATA preferred stock maintains trading above $99 while offering a 13.69% yield, attracting dividend-seeking investors toward an alternative vehicle.
Market analytics firm QCP calculates Strategy possesses approximately 7.5 months of remaining liquidity to satisfy preferred dividend commitments. QCP highlighted the company may ultimately confront a decision between securing additional capital, further diluting existing shareholders, or liquidating additional bitcoin holdings.
Strategy recently bought back nearly $1.5 billion in convertible debt instruments maturing in 2029 while simultaneously raising approximately $200 million through MSTR equity sales — a portion of which financed another $100 million bitcoin purchase.
Director Stock Sales Compound Concerns
Director Jarrod Patten exercised options on 1,500 Class A shares at an exercise price of $18.236 and disposed of them at approximately $134, netting roughly $200,000. Throughout the preceding three months, Patten has divested 55,750 MSTR shares generating total proceeds near $9 million.
He maintains ownership of 28,406 Class A shares along with 44,250 outstanding director options.
Earlier this year, CEO Phong Le, CFO Andrew Kang, and former EVP Wei-Ming Shao similarly sold millions in MSTR equity.
The Federal Reserve’s June 17 unanimous 12-0 decision maintained interest rates at 3.50%–3.75%, though the updated dot plot revealed nine of 18 FOMC participants now anticipate at least one rate increase before 2026 concludes. This hawkish shift pressured bitcoin and cryptocurrency-related equities despite broader market strength.
Bitcoin was trading around $63,850 at publication time, declining approximately 2% over 24 hours. At this valuation, Strategy’s holdings reflect an unrealized loss of roughly $11,658 per coin relative to its average purchase price.
MSTR finished Wednesday’s session down 5.09% at $116.56, followed by an additional 2.1% drop to $114.04 during Thursday morning trading. The equity has now declined approximately 31% over the trailing month.
Notwithstanding these headwinds, Bernstein maintained its buy recommendation with a $450 price objective. TD Cowen sustains its $350 target, Citigroup at $260, and BTIG at $250.
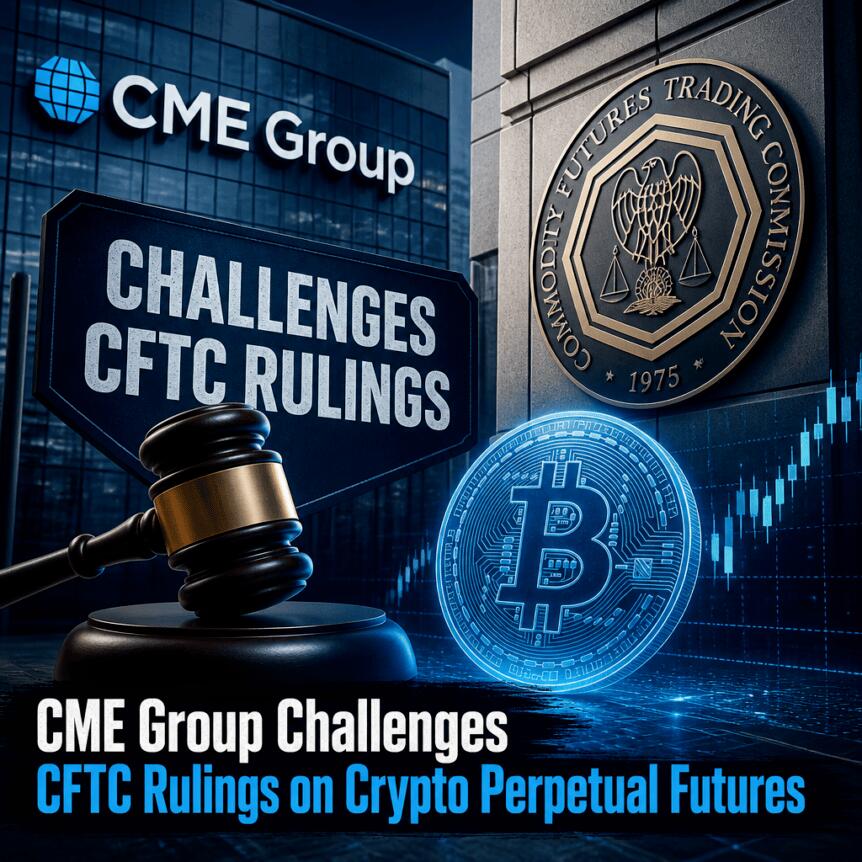
CME Group has filed a lawsuit challenging the US Commodity Futures Trading Commission’s (CFTC) handling of cryptocurrency perpetual futures, arguing the agency has been applying the Commodity Exchange Act in a way that Congress did not intend. The complaint was submitted in a Thursday filing in the US District Court for the District of Columbia against the CFTC and its chair, Michael Selig.
The dispute centers on the CFTC’s recurring approvals of perpetual futures tied to crypto spot prices, including a May 29 notice that approved a Bitcoin (BTC)-linked perpetual futures structure for prediction markets platform Kalshi and issued a no-action position for similar products on Coinbase. CME argues these actions conflict with congressional directives and asks the court to vacate the approvals.
Key takeaways
- CME’s lawsuit targets the CFTC and chair Michael Selig over the agency’s regular handling of crypto perpetual futures.
- The complaint ties the disagreement to how perpetual products are classified under the Commodity Exchange Act, including whether they should be treated like “swaps” with expiry dates.
- CME alleges Selig acted unilaterally rather than through a full five-commissioner panel.
- CFTC’s response, via a spokesperson, rejects the claims and calls the complaint “frivolous.”
- The case comes amid wider uncertainty around CFTC leadership composition, with Selig operating as sole commissioner.
What CME is alleging in its complaint
According to CME’s filing, the CFTC’s approvals of perpetual futures attached to crypto spot benchmarks run contrary to what CME says Congress intended when it set out the regulatory framework for derivatives. CME’s argument focuses on the agency’s approach to classification—specifically, CME claims the CFTC has treated “futures” as if they were “swaps” that carry expiration dates.
CME further contends that these steps violate the Commodity Exchange Act. In addition to the statutory interpretation issue, the company raises a procedural concern: it argues Selig acted without the full complement of five CFTC commissioners, which CME characterizes as improper.
“With one stroke of his pen, [Selig] overrode Congress’s definition of the term ‘swap’ and circumvented the regulatory regime Congress required for that form of derivative,” the complaint says.
“The CFTC’s failure to evenhandedly, consistently, and correctly apply the CEA risks harming competition and destabilizing derivatives markets.”
Why Kalshi and Coinbase are central to the dispute
The lawsuit draws on a May 29 CFTC notice that CME says illustrates the agency’s approach. In that notice, the CFTC approved a Bitcoin spot-linked perpetual futures contract structure for Kalshi, a platform that operates in prediction markets, and it also issued a no-action position for comparable products associated with Coinbase.
CME is effectively challenging the logic behind those approvals: if the products are treated in a way that CME believes blurs the futures-versus-swaps distinction, CME argues it undermines the regulatory boundaries that Congress set.
For market participants and venues, the case matters because perpetual products are widely used in crypto markets, and regulatory classification can affect compliance expectations, oversight, and competitive dynamics among exchanges and liquidity providers. CME’s complaint signals that at least some major market infrastructure operators believe there are unresolved legal questions about how these instruments should be regulated in the US.
CFTC’s chair response and the question of authority
CME’s legal action follows closely behind public statements from both sides. One day before the lawsuit filing, CME CEO Terrence Duffy said the exchange operator would sue the CFTC over perpetual futures. In an earlier CNBC interview, Selig described perpetual futures contracts as trading similarly to other derivatives and argued that the Commodity Exchange Act does not define the term “futures contract.”
In response to the filing, a CFTC spokesperson told Cointelegraph that CME was engaging in “lawfare” and framed the suit as part of broader disputes over crypto policy. The spokesperson called CME’s complaint “frivolous.”
The clash highlights an enduring regulatory tension: whether perpetual crypto products should be treated as futures within the CFTC’s established framework, or whether they align more closely with a swaps regime that carries different requirements. CME’s filing also adds a governance dimension—its claim that Selig acted outside a full commissioner process—raising questions about how decisions should be authorized under the CFTC’s internal structure.
Leadership backdrop at the CFTC
The lawsuit lands in a period of leadership uncertainty at the agency. Selig was confirmed by the US Senate in December 2025 and, as of Thursday, remained the chair and the only commissioner on the CFTC. The CFTC’s intended leadership panel is supposed to include five people, but as of Thursday, President Donald Trump had not announced nominations to fill those seats.
Cointelegraph previously reported that many members of Congress had urged the administration to nominate commissioners for the remaining roles. This governance context is relevant to CME’s procedural argument that unilateral action should not be treated as sufficient for decisions that shape derivatives regulation.
At the same time, CME’s dispute does not only concern whether perpetual futures are substantively comparable to other derivatives; it also challenges whether the regulator’s power has been exercised in a manner consistent with the agency’s legal and administrative expectations.
What to watch next is how the court handles CME’s request to vacate the CFTC’s actions and what standard it applies to the classification and authority questions. The case could influence how perpetual crypto derivatives are structured and approved in the US, but until rulings arrive, the regulatory status of future perpetual contracts may remain contested for venues, traders, and counterparties.
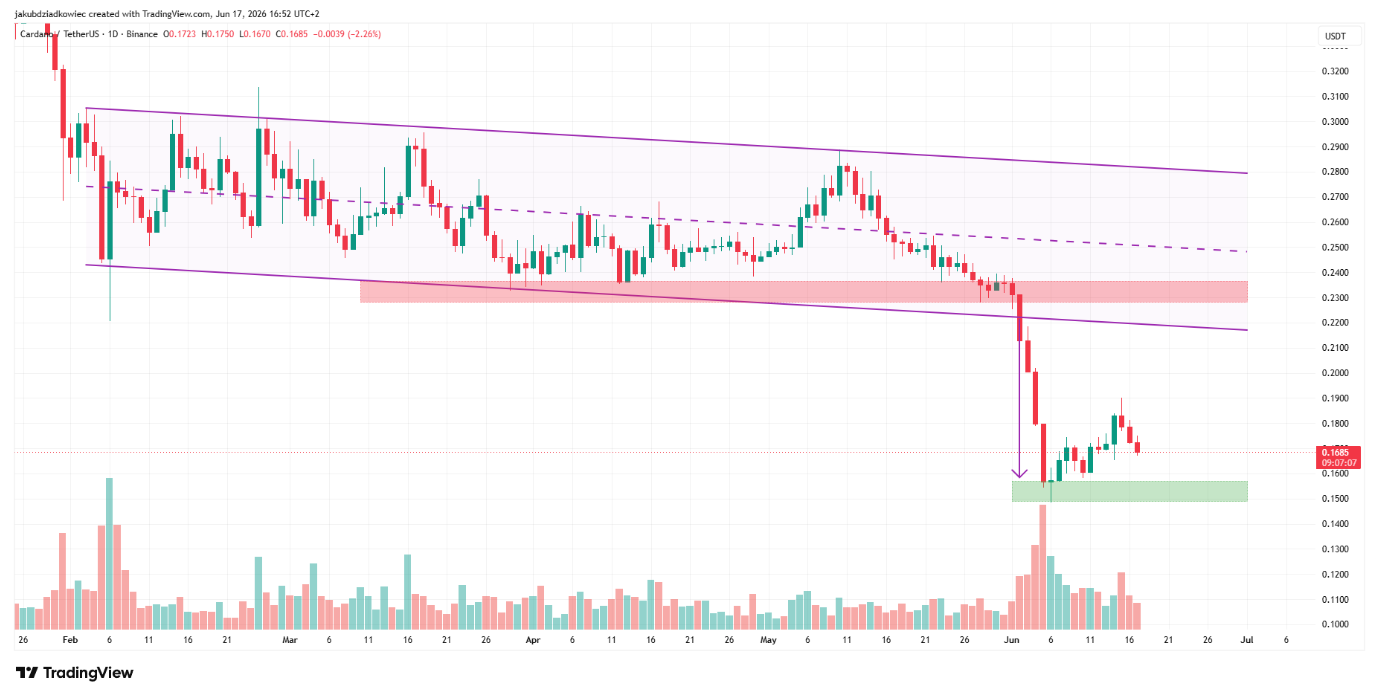
Charles Hoskinson has returned with a plan to repair Cardano’s stalled governance system. The market is still unconvinced, as ADA price remains near $0.16, down 35% in a month.
The Cardano founder spent three videos in mid-June arguing that the network needs a new decision-making structure, a moderated Discord, and a voting bloc with enough power to pressure funding applicants into public accountability.
ADA holders have answered with the chart. The token remains near five-year lows after a steep monthly decline, even as Hoskinson says Cardano is approaching a decisive moment.
Cardano’s Governance Crisis Comes With a Price Tag
The backdrop is ugly. ADA has fallen roughly 32% over the past 30 days, while Cardano’s market value has slipped to about $6.3 billion.
The decline has arrived alongside deeper ecosystem stress. Analytics platform TapTools is winding down. Other Cardano builders have also stepped back. DRep fatigue has spread as governance votes become more contentious.
Hoskinson says the system has hit a bottleneck. By his count, Cardano faces more than 600 million ADA in funding requests against a 350 million ADA net change limit, with no agreed strategy to decide what should come first.
The failed treasury vote for a 2026 Cardano summit added to the tension. Several Delegated Representatives have also stepped back from active governance, feeding the view that Cardano’s new political system is already straining.
Hoskinson Wants the Fight Off X
Hoskinson says that Cardano’s governance problem starts with the venue.
He described X as a “broadcast channel” built for spectacle, where conflict gets rewarded, and serious compromise gets buried. In his view, that structure makes long-term decision-making almost impossible.
He used a blunt image to explain the problem.
“Would you go to a library where every day the people show up with pots and pans?”
His answer is a moderated Discord for governance discussion, modeled on Midnight’s community server. He says that space grew to about 49,000 members after bad-faith actors were removed.
The proposed Cardano version would use zero-knowledge technology so members can speak and vote without public attribution. Hoskinson says that would protect early ideas from harassment and retaliation.

A Voting Bloc With Teeth
The sharper part of the plan is political.
Hoskinson says he will register as a DRep and form what he calls a political party. Its rule would be direct.
“We will automatically vote no on all funding proposals unless they join and participate in the governance Discord.”
He frames the move as an accountability tool rather than a takeover. Anyone holding ADA could join, he says, and all final decisions would still require on-chain votes.
He also wants a new version of the Cardano constitution with clearer executive roles, elected authority, and defined growth targets. Without an agreed definition of growth, he argues, every budget fight will collapse into competing interpretations of success.
The commercial push is running in parallel. Hoskinson has pointed to RealFi, Bitcoin-focused work through Pogan, Blockfrost infrastructure, Midnight, Midgard, and the Leios scaling upgrade as proof that Cardano still has a growth path.
Leios is expected to reach testnet on June 23.
ADA Holders are Waiting for Proof
For now, the market is not treating the plan as a turning point.
ADA broke below support near $0.23 on June 2 and fell toward $0.157 by June 6, a level last seen in 2020. The heaviest volume came during the selloff, suggesting capitulation rather than orderly rotation.
The videos landed during a weak bounce. ADA briefly recovered toward $0.18, then slipped back near $0.17. It remains far below the $0.23 level that now acts as resistance.
Hoskinson says he does care about the token.
“Of course, I care about the price of ADA. The price of ADA is directly connected to the security and the utility of Cardano.”
His larger warning was even clearer.
“Cardano has to do or die.”
That line may capture the mood better than the plan itself. Hoskinson is asking the community to rebuild governance before the market loses patience. ADA holders appear to be waiting for evidence that the system can still produce growth.
The post Hoskinson Has a Plan to Save Cardano, But ADA Holders aren’t Buying It appeared first on BeInCrypto.

Ondo Finance Adds 173 Tokenized Stocks and ETFs, Taking Catalog Past 430 Assets Across Three Chains
Three ranking points cost Manika Batra Asian Games spot | More sports News

44 Best Father’s Day Gifts for Dads (2026)


-

 Business4 days ago
No Jackpot Winner as $257 Million Prize Rolls Over to $269 Million Monday Draw
-

 Fashion6 days ago
Weekend Open Thread: Tuckernuck – Corporette.com
-
Crypto World4 days ago
Zimbabwe Requires Crypto Businesses to Register Annually Under New FIU Regulations
-

 Crypto World6 days ago
Bitget enters Argentina’s regulated crypto market through PSAV registration
-

 Tech6 days ago
NanoClaw integrates JFrog registries to secure AI agent downloads
-

 Tech6 days ago
This Week In Security: Microsoft On Microsoft, Register Your Domains, Linux On ARM, And FreeBSD Joins The File Cache Club
-

 NewsBeat7 days ago
El Nino has formed in the Pacific and could set records, forecasters say
-

 NewsBeat6 days ago
FBI searches office of Ohio voter registration group
-
 Tech7 days ago
Anthropic is spending $150M to embed 1,000 AI fellows inside nonprofits. No degree required.
-
 Entertainment7 days ago
‘The Pitt’s Fan-Favorite Doctor Confirms Noah Wyle Gave His Blessing to Return [Exclusive]
-

 Tech7 days ago
Former AWS CEO Adam Selipsky to lead new $10B AI data center venture
-
 Crypto World7 days ago
Ripple and Bitso Bring MXNB Stablecoin to XRP Ledger
-
 Entertainment4 days ago
Matt Damon’s Viral Sci-Fi Thriller Has Taken Over HBO Max
-

 Business4 days ago
Anthropic staff to meet White House officials next week, Axios reports
-

 Business7 days ago
Justin Bieber Prepares for 2026 Tour Return with New Music and Promoter Talks
-

 Tech4 days ago
As AI companies race to go public, who else is along for the ride?
-
 Crypto World4 days ago
Bitcoin could crash to $48,000, if this historical pattern is triggered
-
 Tech7 days ago
Euro-Office 1.0 Arrives To Open-Source Infighting: ‘Compatibility Is Not Sovereignty’
-

 Politics4 days ago
“Israel’s” ban on ICRC visits ruled illegal, but Knesset moves to stop them permanently
-
Entertainment7 days ago
Ana Navarro unleashes explosive tirade on ex-Trump aide, Disney Channel star in epic on-air fight: 'Have you no shame?'
You must be logged in to post a comment Login