

Crypto World
Bitcoin Lags Global Liquidity at Record Highs: Will It Catch Up?
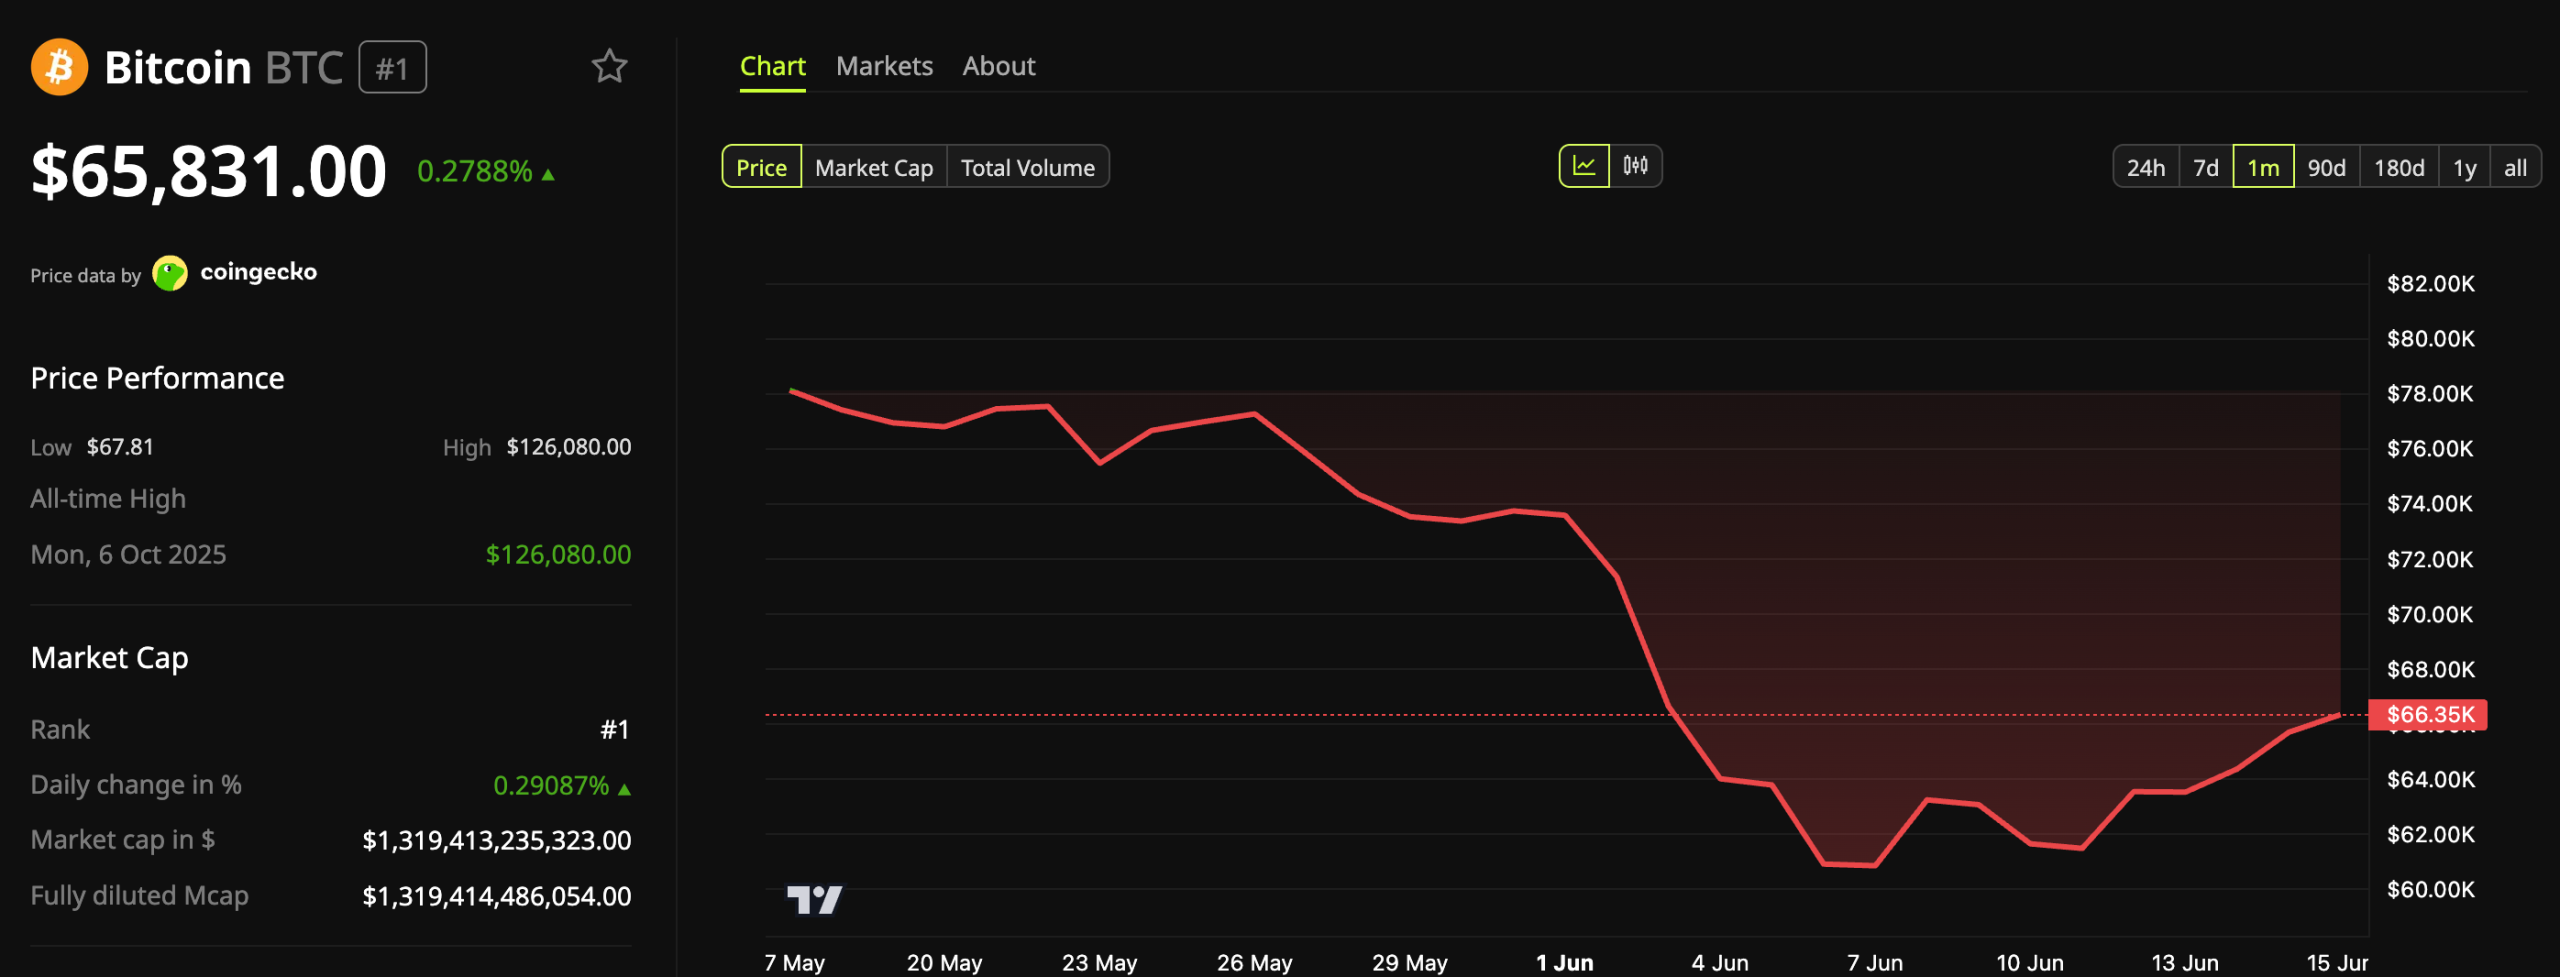
Bitcoin (BTC) is trading roughly 48% below its October peak even as global money supply sets a record, opening a key gap between the asset and global liquidity this cycle.
The divergence has drawn attention from market analysts who treat liquidity as a leading signal for risk assets. Their core question is whether Bitcoin breaks or continues a long-standing pattern.
Bitcoin and Global Liquidity Are Diverging
Alphractal noted that the global M2 money supply, a common proxy for worldwide liquidity, recently reached a record of nearly $135 trillion. The S&P 500 has tracked that expansion, trading near its own record highs.
Bitcoin historically follows the same liquidity wave, though with higher volatility and a longer lag. That relationship held through 2024 and into early 2025 before it broke down.
“Since early 2025, BTC has diverged sharply: while M2 continued making new highs and SPX recovered to near-ATH, BTC has compressed,” the firm mentioned.
Alphractal called the current divergence the most pronounced in its dataset and described two ways to read it.
The first is the convergence reading. It holds that an asset this far below liquidity has typically closed the gap through price gains. That recovery comes from appreciation rather than shrinking liquidity.
The second is the structural reading. It treats the Bitcoin-liquidity link as non-mechanical rather than fixed. Past divergences in 2018 and 2022 were resolved over 6 to 18 months. The correlation can also weaken as the holder base changes.
“Which reading applies depends on whether the current divergence reflects a temporary dislocation or a structural shift in BTC’s correlation regime,” Alphractal said.
Analyst Martini Guy framed it the same way. He said the macro backdrop is improving, while Bitcoin has not yet reflected it. Either Bitcoin starts closing the gap, or its tie to liquidity breaks in a way “we haven’t seen for quite some time.”
Follow us on X to get the latest news as it happens
Can Bitcoin Catch Up to Liquidity?
Meanwhile, Bitcoin firmed toward $66,000 this week as the US-Iran deal lifted equities and risk assets. At press time, the asset traded at $65,831, up 0.27% over the past day.

The bounce strengthens the stabilization signal but does not confirm a trend change. On-chain data supports that reading.
Glassnode described the recent move up from near $60,000 as base-building rather than a confirmed reversal.
“The recovery is happening on thin ice. Spot volume collapsed 40.4% to $5.8B and Futures Open Interest declined another 3% to $30.6B, a sign the bounce is being driven by covering rather than fresh conviction. Long-side funding payments fell 22.3% and ETF trade volume dropped 38.1% to $11.1B. The market is lighter, not healthier,” the report read.
The macro backdrop favors a recovery, but Bitcoin has not confirmed one. The coming weeks of flow and volume data should show which reading holds.
Subscribe to our YouTube channel to watch leaders and journalists provide expert insights
The post Bitcoin Lags Global Liquidity at Record Highs: Will It Catch Up? appeared first on BeInCrypto.


Bitcoin retreated to around $66,000 after Tuesday’s Wall Street open as broader equity markets pushed higher. The move underlined a growing split between crypto and traditional risk assets, even as a reported U.S.–Iran peace development supported stocks and weighed on crude oil.
While U.S. WTI crude slid to three-month lows—a backdrop that typically benefits risk sentiment—traders appeared unwilling to press fresh bullish bets on BTC. Multiple analysts pointed to $70,000 as the key upside area for this leg, while others argued that the market may be entering a sell zone or even getting “lured” into positions that fail to materialize.
Key takeaways
- BTC fell back to roughly $66,000 after the Wall Street open, despite strong gains in U.S. equities.
- Shares received a boost alongside reports of U.S.–Iran progress, while oil prices hit three-month lows.
- Trading analysis cited $70,000 as a likely near-term upside target, with expectations for rangebound behavior.
- On-chain and derivatives commentary highlighted risks around liquidity-driven moves, including areas around $68,000 and a sell zone concept from a trader.
- CoinGlass data showed $230 million in short liquidations over the prior 24 hours at the time of writing.
Stocks lead, oil softens, but BTC fails to keep pace
According to TradingView data cited in earlier market commentary, BTC’s price action cooled after it had reached its highest level in nearly two weeks. The broader risk-off/risk-on picture appeared mixed: investors pushed into equities after headlines around U.S.–Iran peace plans, while crude oil weakened sharply.
In its latest newsletter The Market Mosaic, Mosaic Asset Company said that confirmations from both sides and other negotiation parties were contributing to a spillover effect in markets. The firm connected the drop in energy prices to a tailwind for equities, pointing to the usual dynamic where oil and longer-dated bond yields fall together—factors that can reinforce stock momentum.
“That’s leading to a spillover effect in the stock market, where oil prices and longer-dated bond yields are both pulling back. A negative correlation between stocks and oil prices means the drop in energy prices is a tailwind for equities.”
Crypto reverts to its range—traders eye $70,000
Despite the equity-led optimism, Bitcoin showed what traders described as divergence from other risk assets. Daan Crypto Trades wrote on X that BTC had moved back “into its range,” adding that he would not be surprised to see consolidation for “a few more weeks at least,” especially as summer typically brings lower liquidity and volatility.
“I would not be surprised if we hang around this big area for a few more weeks at least. Especially with Summer coming up and lower liquidity/volatility.”
Another trader, Roman, similarly framed $70,000 as the level to watch for completing a bounce. In his X post, he said he was “still eyeing the 70k level for our bounce to be completed,” while noting that hourly timeframes looked favorable and that there were no apparent issues to stop the move.
“Still eyeing the 70k level for our bounce to be completed.”
That combination—range expectations plus a defined upside target—helps explain why BTC could slip even while other markets advanced. In practice, traders appeared more focused on near-term technical levels than on extending directional exposure.
Debate over support strength and the role of liquidity
Some market analysis has questioned whether $60,000 is truly strong long-term support, with Cointelegraph earlier reporting that the bear market may still be too young to conclude a full reversal. That critique contrasts with the more tactical approach from other traders who emphasized how order-book dynamics and liquidity can shape short-term price behavior.
Killa, for example, suggested that market makers and trading algorithms may have encouraged traders to bet on lower lows that never arrive, characterizing the pattern as a “market psyop.” In the same line of discussion, he referenced order-book liquidity data.
“Just another classic market psyop,” they summarized alongside a chart of order-book liquidity data.
Liquidations spike as $230M in shorts exit
Derivatives activity added another layer to the caution around follow-through. According to CoinGlass liquidation data, crypto saw $230 million in short liquidations over the prior 24 hours at the time of writing.
Liquidation events can be double-edged for traders. While they may clear crowded positions and relieve downward pressure temporarily, they can also signal that leverage was aggressively harvested—after which price can stall or reverse as new buyers hesitate.
Lennaert Snyder pointed to this type of dynamic in his commentary. He said price was entering a “high-time frame sell zone,” and he referenced $68,000 as the target for Tuesday. Snyder added that liquidity below 63.6K looked “too juicy” to avoid, but he preferred a push upward first for a “quality short,” suggesting he was waiting for a better entry rather than chasing immediate downside.
“The liquidity sub 63.6K looks too juicy to not mitigate, but for the quality short I’d prefer that push to the upside first,” he wrote.
Looking ahead, traders are likely to monitor whether BTC can break through $70,000 with sustained momentum—or whether liquidation-driven flows and “sell zone” expectations cap the rebound. With equities supported by macro headlines and oil acting as a changing variable for risk sentiment, the key uncertainty is whether crypto can align with broader market direction, or continue trading as a more self-contained range where liquidity dictates the next move.

Bitcoin (BTC) dropped back to $66,000 after Tuesday’s Wall Street open as stocks locked in fresh gains.
Key points:
- Bitcoin cools its rebound, even as stock continue higher on US-Iran peace plans.
- Oil prices hit their lowest levels in three months, but crypto struggles to leverage the tailwinds.
- BTC price takes still see $70,000 as the limit for the current push higher.
BTC price dips with oil as stocks head out in front
Data from TradingView showed BTC price action coming off its highest levels in nearly two weeks.
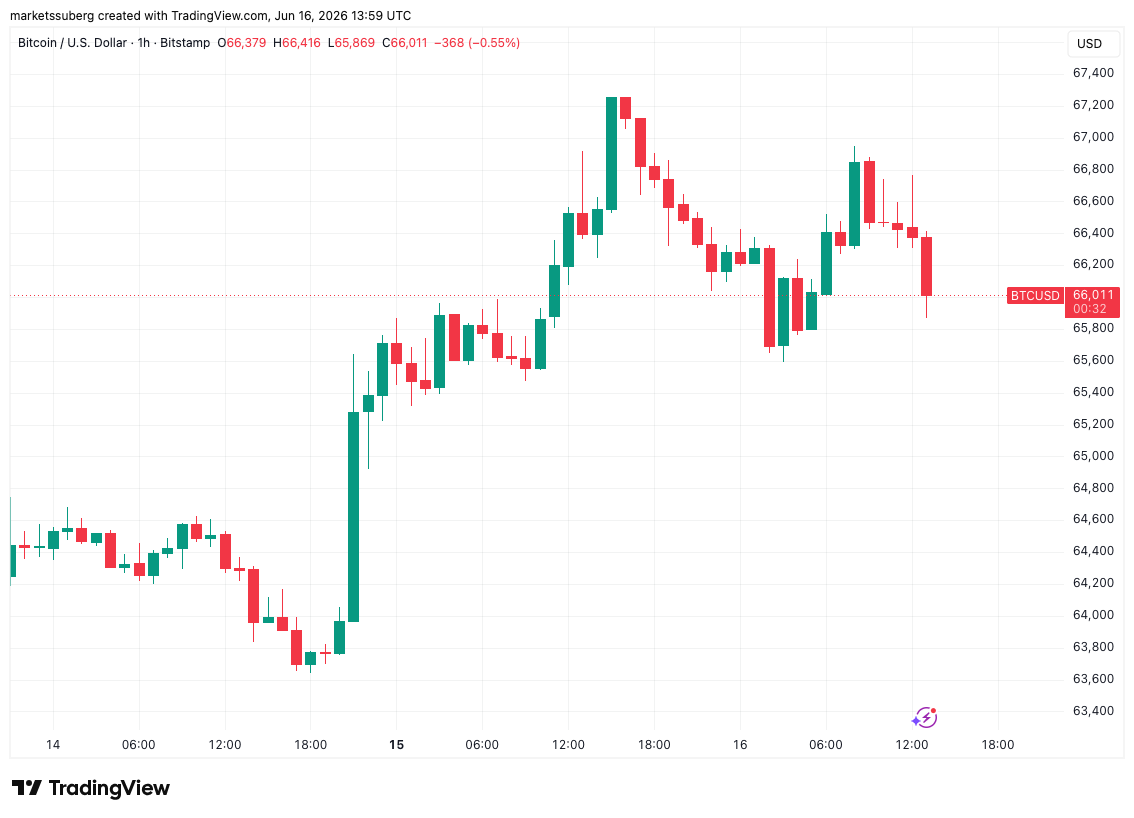
BTC/USD one-hour chart. Source: Cointelegraph/TradingView
Hopes that a US-Iran peace deal would go ahead kept equities bullish, with the S&P 500 adding over 1.5% on the day, while US WTI crude oil hit three-month lows.
“News of an peace deal between the U.S. and Iran has made headlines frequently in the past. But this time, both sides along with other parties involved with negotiations are confirming the deal,” trading resource Mosaic Asset Company wrote in the latest edition of its regular newsletter, The Market Mosaic.
“That’s leading to a spillover effect in the stock market, where oil prices and longer-dated bond yields are both pulling back. A negative correlation between stocks and oil prices means the drop in energy prices is a tailwind for equities.”
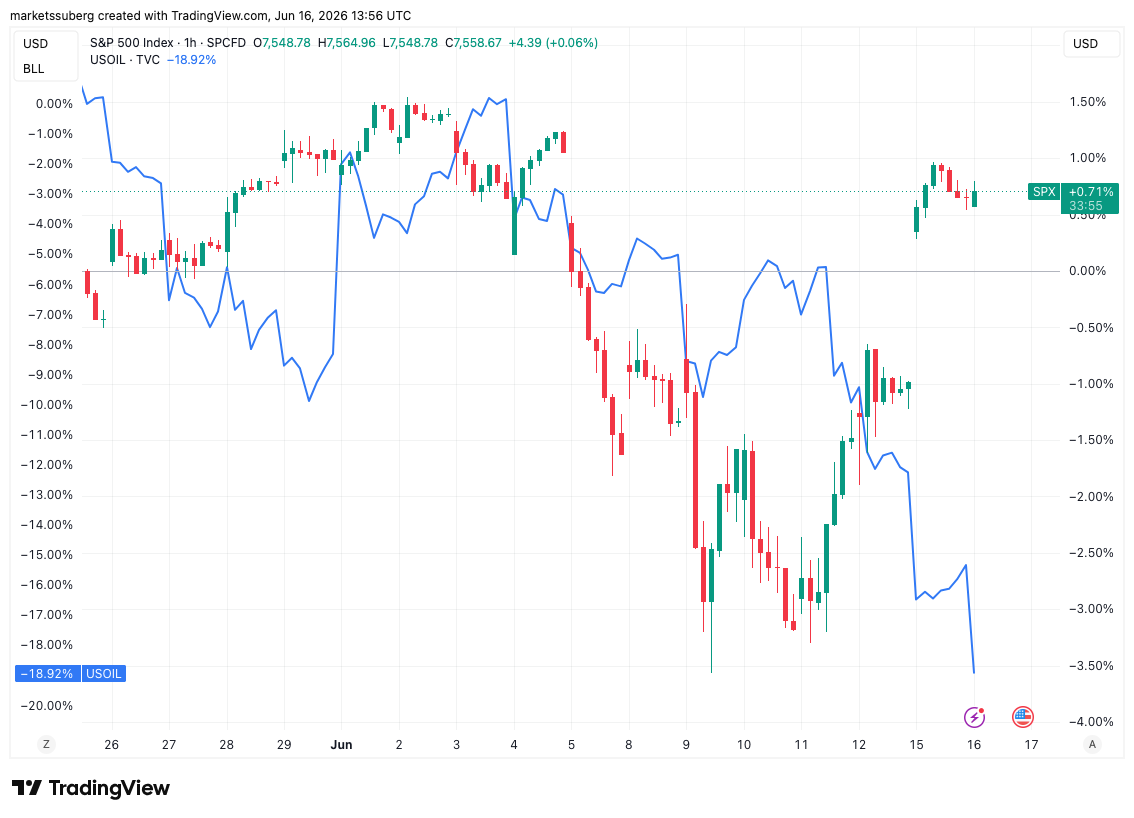
S&P 500 vs. WTI crude oil one-hour chart. Source: Cointelegraph/TradingView
Bitcoin nonetheless brought back its own divergence from other risk assets, and traders avoided bets on major BTC price upside.
“$BTC Has moved up further back into its range,” Daan Crypto Trades wrote in his latest analysis on X.
“I would not be surprised if we hang around this big area for a few more weeks at least. Especially with Summer coming up and lower liquidity/volatility.”
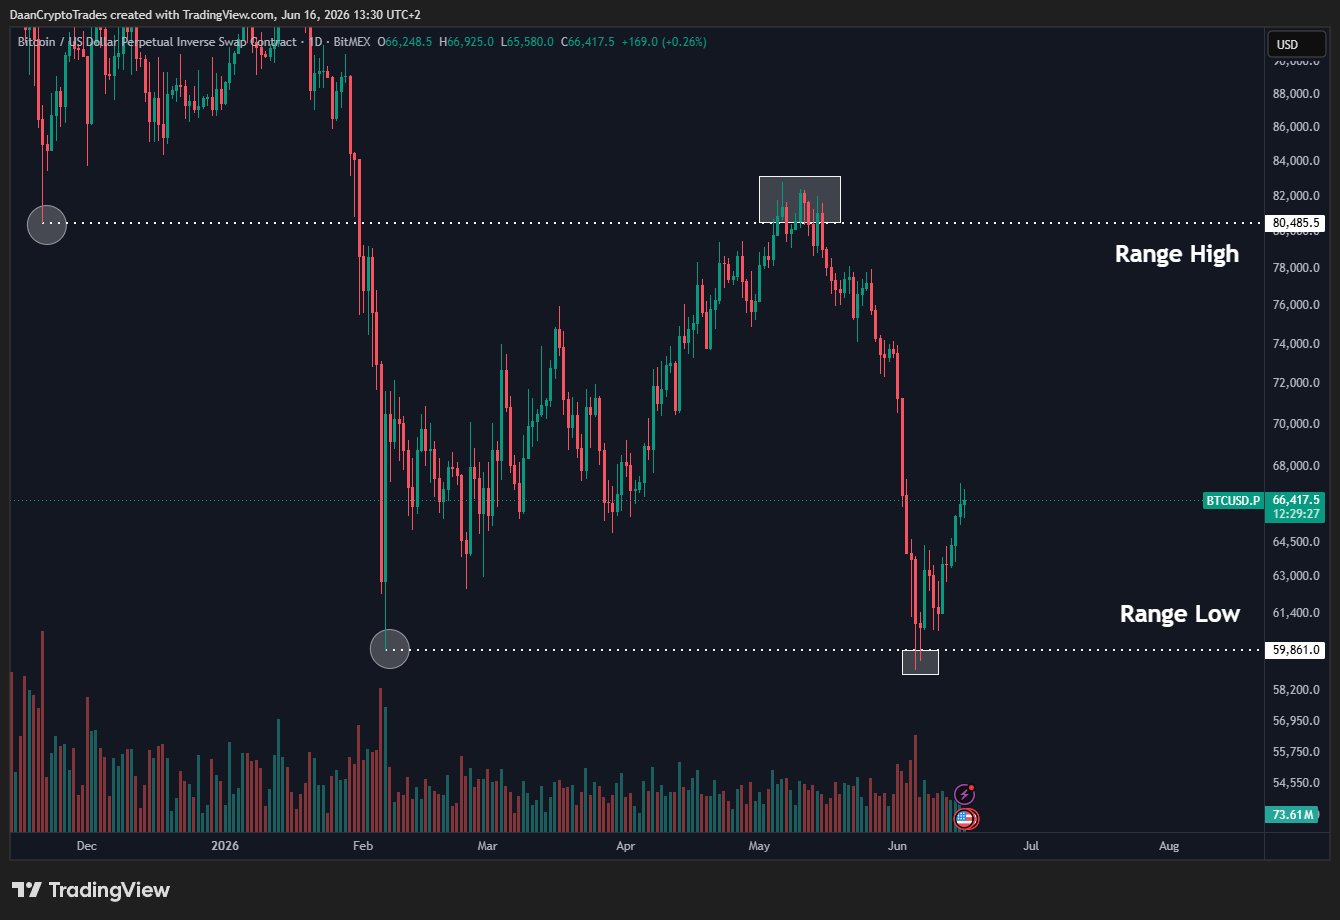
BTC/USDT perpetual contract one-day chart. Source: Daan Crypto Trades/X
Trader Roman joined those putting the area around $70,000 as a likely local top target.
“Still eyeing the 70k level for our bounce to be completed.,” he told X followers.
“Hourly TFs look good to continue a bit higher. There aren’t any ‘issues’ that I see yet to stop this bounce.”
Bitcoin trader calls “classic market psyop”
As Cointelegraph reported, other market analysis has cast doubt over the strength of $60,000 as long-term support, arguing that the bear market is too young to be over yet.
Related: Bitcoin analysis warns over BTC price rejection as $67K approaches
Countering this, trader Killa suggested that both market makers and trading algorithms had lured traders into betting on new lows that would never come.
“Just another classic market psyop,” they summarized alongside a chart of order-book liquidity data.
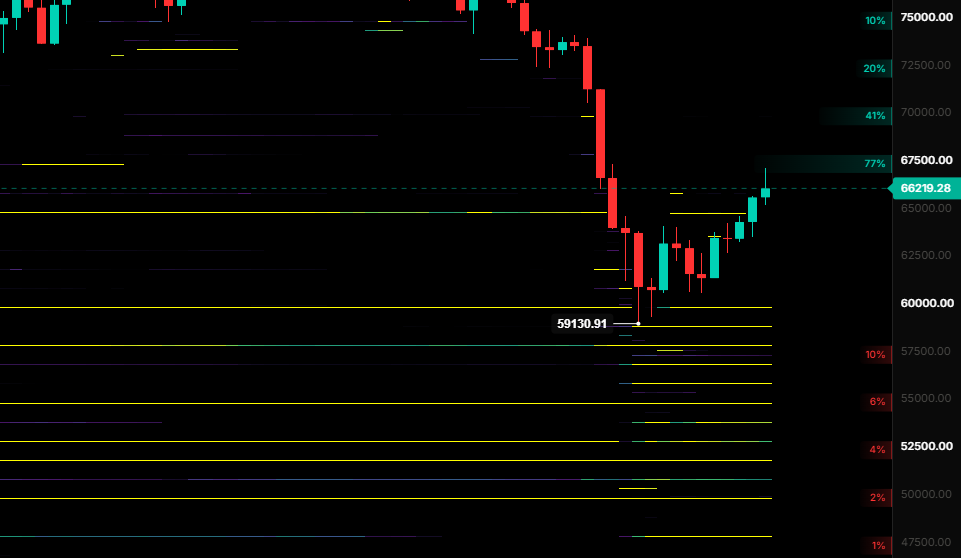
BTC/USD order-book liquidity data. Source: Killa/X
Data from CoinGlass put 24-hour crypto short liquidations at $230 million at the time of writing.
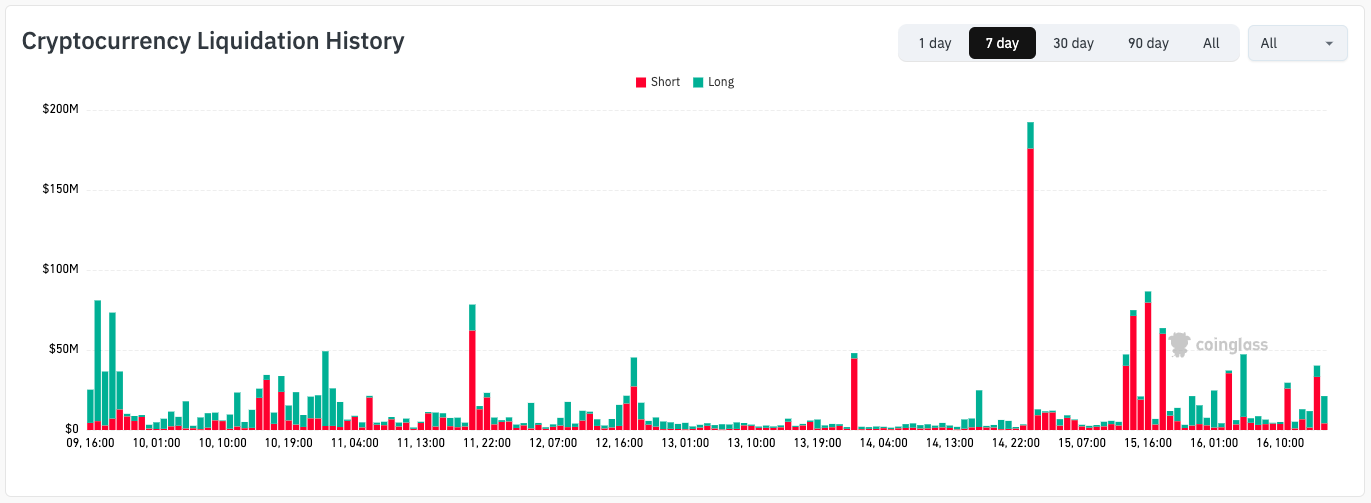
Cryptocurrency liquidation history (screenshot). Source: CoinGlass
Commenting, trader Lennaert Snyder said that price was headed into a “high-time frame sell zone,” targeting $68,000 for Tuesday.
“The liquidity sub 63.6K looks too juicy to not mitigate, but for the quality short I’d prefer that push to the upside first,” he wrote on X.
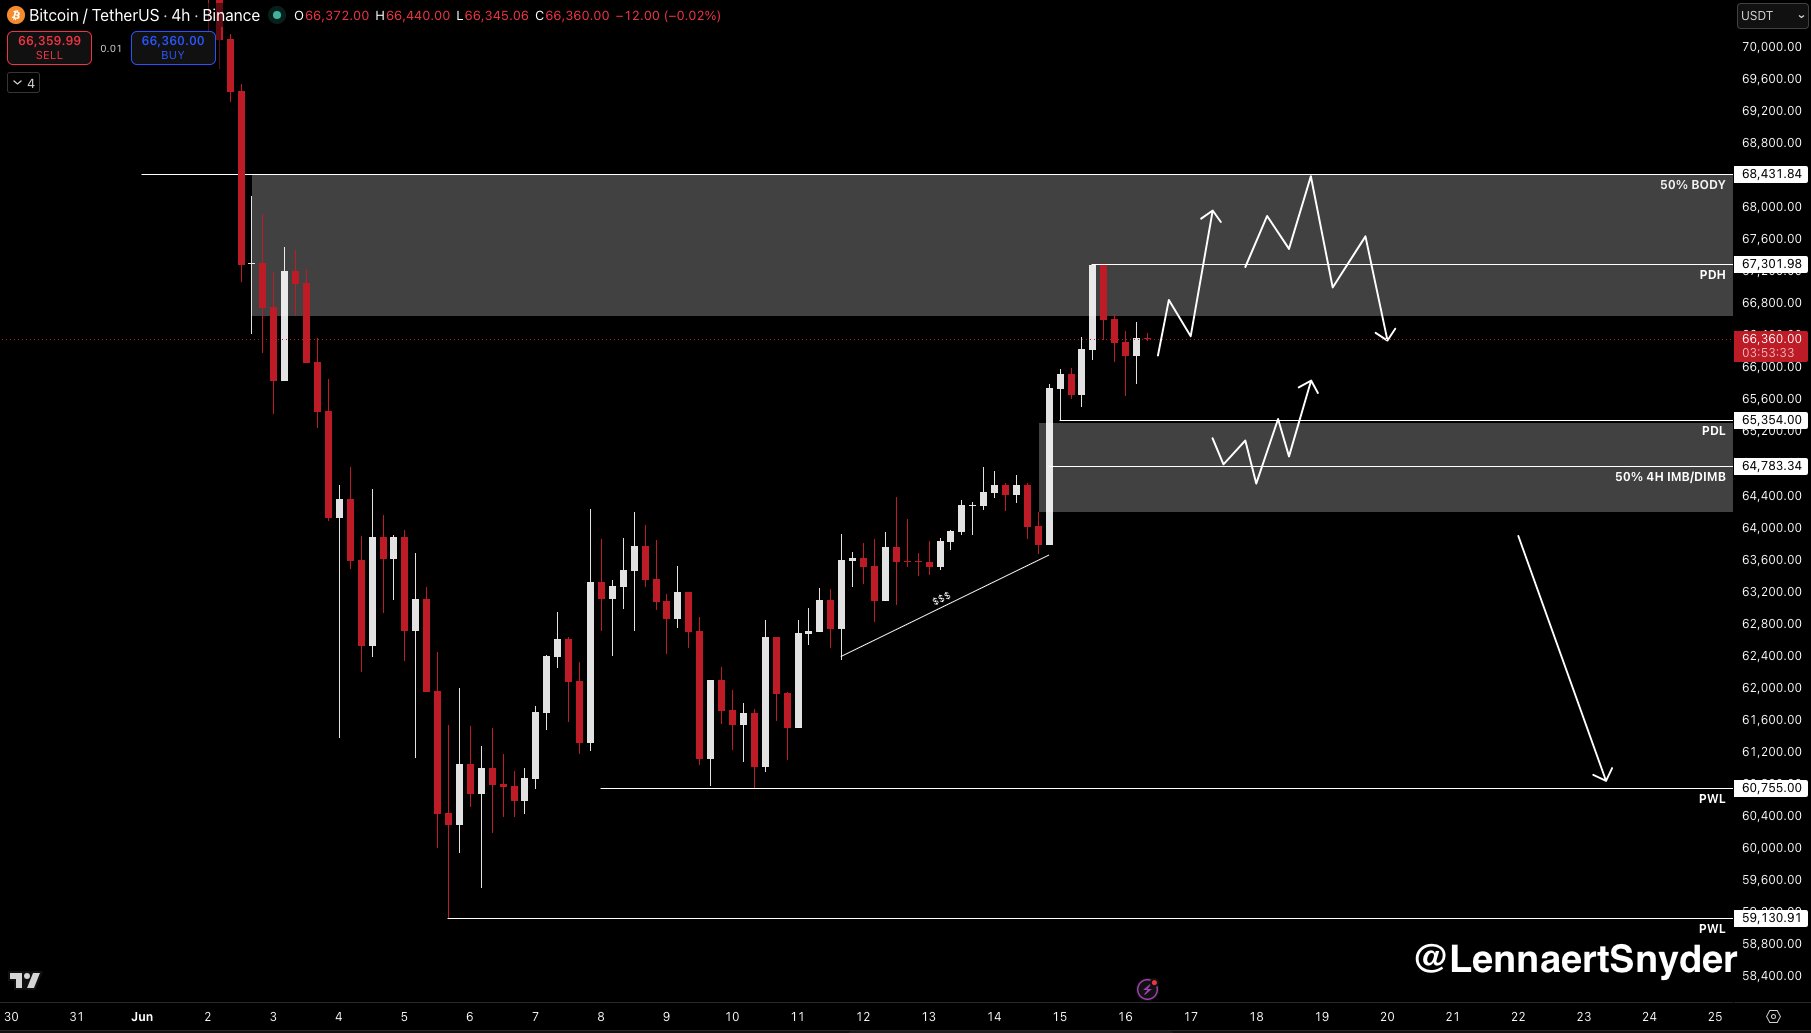
BTC/USDT four-hour chart. Source: Lennaert Snyder/X

Standard Chartered just reaffirmed its crypto prediction with 2030 bombastic targets. Bitcoin at $500,000, Ethereum at $40,000, and unexpectedly Uniswap at $100. ETH is currently trading near $1,800, while BTC sits above $66,000. Uniswap is at $3 after a 12% jump today.
Geoffrey Kendrick, Standard Chartered’s Global Head of Digital Assets Research, recently cut his 2026 targets. BTC to $100,000 from $150,000, ETH to $4,000 from $7,500, and flagged a credible path to $50,000 BTC and $1,400 ETH before any recovery materializes.
The Amazon analogy for ETH is pointed: in 2001, Amazon’s stock fell from $113 to $6 while every internal business metric kept improving. Kendrick’s argument is that ETH is in that same window right now. The bank separately frames 2026 as “the year of Ethereum,” expecting ETH to begin outperforming BTC as DeFi, stablecoins, and tokenization volumes compound.
The UNI call is the most aggressive: a $100 price target by 2030, with a graded ladder starting at $6.50 in 2026 and stepping up every year through the decade.
Discover: The Best Crypto to Diversify Your Portfolio
Can ETH, BTC, and UNI Reach Standard Chartered Crypto Prediction? Realistically
Start with the bear case, because Kendrick laid it out explicitly. BTC could re-test $50,000, and ETH could slide to $1,400 before any sustained recovery. The ETH/BTC ratio has already dropped 37% from August highs, and on that metric alone, the Amazon comparison carries weight: on-chain activity is at records even as price bleeds if we consider this year’s performance.

The 200-week SMA for ETH sits as a critical longer-term support reference; historically, breaches of that level have marked generational buy zones rather than structural breakdowns.
For BTC, $60,000 is still the psychological and technical line the bears need to hold. If macro headwinds ease, and outflow starts to go green again, BTC could run above $70,000 in the short term.

UNI’s ladder from $6.50, $20, $40, $65, to $100 implies 40x from the levels at initiation. That’s a high-beta DeFi bet contingent on DEX volume growth and potential fee-switch execution.
Standard Chartered, in its crypto prediction, argues UNI could outperform both BTC and ETH across the decade, which is a strong claim worth watching against on-chain DEX market share data quarter by quarter.
Discover: The Best Token Presales
Bitcoin Hyper Targets Early-Stage Upside While BTC Navigates Key Support
Here’s the practical tension: even if Standard Chartered’s 2030 targets prove correct, BTC at $66K and ETH at $1,800 with near-term downside flagged to $50K, and $1,400 means the asymmetry at these prices is compressed relative to the multi-year horizon.
Established large-caps with nine-figure daily liquidity don’t move 40x from current levels in a cycle. Early-stage infrastructure plays carry a different risk-reward profile entirely, which is where the Bitcoin Layer 2 sector is drawing capital right now.
Bitcoin Hyper ($HYPER) is positioning directly in front of that infrastructure narrative. It’s the first Bitcoin Layer 2 with Solana Virtual Machine (SVM) integration. The pitch is sub-second smart contract execution on top of Bitcoin’s security layer, outperforming Solana’s own throughput on transaction latency while preserving BTC’s trust model.
The presale has raised closer to $33 million at a current price of $0.01368, with staking live for presale participants. Features include a Decentralized Canonical Bridge for BTC transfers and high-speed, low-cost execution that directly addresses Bitcoin’s three structural limitations: slow finality, high fees, and no native programmability.
Research Bitcoin Hyper here before the presale closes.
The post Standard Chartered Crypto Prediction: $40K ETH, $500K BTC, and $100 UNI appeared first on Cryptonews.


Disclosure: This article does not represent investment advice. The content and materials featured on this page are for educational purposes only.
AI trading bots gain traction in 2026 as traders rely on automation to manage fast-moving stock and forex markets.
Summary
- AI trading bots gain traction in 2026 as traders use automation to manage volatility across stocks, forex, and crypto.
- Platforms like BulkQuant, MetaTrader 5, and QuantConnect offer no-code tools, signals, and algorithmic trading systems.
- Focus shifts from profit promises to disciplined, data-driven execution, reducing emotional decision-making in fast markets.
As global financial market volatility rises in 2026, the intraday rhythm of stock and forex trading has become harder for human traders to manage alone. Price shocks can appear within seconds, macroeconomic data can change currency direction quickly, and stock indexes may react sharply to earnings, rate expectations, sector rotation, or geopolitical headlines.
For day traders, swing traders, and more systematic market participants, the problem is no longer just finding information. The harder task is processing that information fast enough, applying a consistent strategy, and avoiding emotional mistakes when markets move against expectations.
That is why AI trading bots are gaining attention across stocks and forex.
Their core value is not the illusion of “guaranteed profits.” A serious AI trading bot should not be judged by bold promises. Its real value is process discipline: using rules, signals, data analysis, automation, and risk controls to reduce emotional decision-making and help traders identify probability-based opportunities in large volumes of market data.
This guide reviews nine AI trading bots and automated trading platforms for stocks and forex in 2026. Each platform serves a different type of user, from beginners who want a guided dashboard to active traders, forex users, no-code strategy builders, and advanced quant researchers.
9 AI trading bots for stocks and forex to watch in 2026
- BulkQuant — 9.3/10
A guided AI trading automation platform for users who want managed workflows across crypto, forex, and stock market scenarios without building a technical system from scratch. - Capitalise.ai — 9.0/10
A code-free automation platform for traders who want to turn plain-language stock or forex scenarios into testable automated workflows. - TrendSpider — 8.8/10
A technical analysis and strategy automation platform for traders who want AI-assisted charting, no-code strategy testing, alerts, and bots. - Trade Ideas — 8.7/10
A real-time AI stock market radar for active traders who need fast scanners, AI signals, paper trading, and backtesting. - MetaTrader 5 — 8.6/10
A widely used multi-asset trading platform for forex and stock market users who want Expert Advisors, signals, VPS hosting, and strategy testing. - cTrader Automate — 8.4/10
A forex-focused automation environment for traders who want cBots, cloud-based algos, and broker-connected execution. - SignalStack — 8.2/10
An alert-to-order automation bridge for traders who want to turn signals from charting platforms into live broker orders. - QuantConnect — 8.1/10
A research-grade algorithmic trading platform for users who want to backtest, refine, and deploy systematic stock and forex strategies. - Tickeron — 8.0/10
An AI stock robot and idea engine for users who want machine-learning-based signals, pattern recognition, and stock or ETF trade ideas.
What makes an AI trading bot useful for stocks and forex?
A useful AI trading bot is not simply a piece of software that places orders.
In stock and forex trading, automation can serve several different roles. Some platforms scan markets and generate signals. Some allow users to build rules without code. Some execute alerts through brokers. Some offer research, backtesting, and paper trading. Others provide a more managed dashboard for users who do not want to build their own system.
The right choice depends on the trader’s workflow.
A stock trader may need real-time scanners, earnings alerts, AI stock signals, or technical pattern recognition. A forex trader may need currency-pair monitoring, macro-sensitive alerts, low-latency execution, and risk controls around leverage. A systematic trader may need historical testing, broker integration, and strategy development tools.
Before choosing any AI trading bot for stocks or forex, users should ask:
- Does the platform support stocks, forex, or both?
- Does it generate signals, execute orders, or only test strategies?
- Does it connect to a regulated broker?
- Are risk settings visible?
- Does it support paper trading or backtesting?
- Can users understand the strategy logic?
- Are fees and account rules clear?
- Does the platform avoid guaranteed-profit claims?
The strongest platforms are not always the most aggressive ones. They are the tools that make trading decisions easier to inspect.
1. BulkQuant — 9.3/10
BulkQuant earns the highest score in this list because it is built around a broader idea than a single-market trading bot. Instead of asking users to assemble every part of an automated trading system by themselves, BulkQuant presents a more guided AI trading environment that can support crypto, forex, and stock market workflows.
For users comparing AI trading bots for stocks and forex in 2026, this matters. Many platforms offer signals, scanners, APIs, or chart automation, but the user still has to connect the pieces. BulkQuant focuses on a managed workflow, giving beginners and less technical traders a clearer way to review automation before using it more seriously.
Its stronger appeal is accessibility. A user does not need to start by coding an algorithm, renting a server, building API connections, or manually testing every execution rule. The platform is more suitable for users who want dashboard-based access, expert-supported workflow guidance, and multi-market automation exposure.
BulkQuant may be especially relevant for users who want AI trading bots for stocks and forex but also want to understand how crypto market movement connects with broader risk sentiment. Since forex, stocks, and digital assets often react to the same macro forces, a multi-market platform can feel more practical than a tool locked into one narrow asset class.
Eligible new users may receive a $10 instant reward plus $50 in free trial credit. Users can compare plan information here:
review BulkQuant trading plans and trial access
The score reflects BulkQuant’s guided workflow, no-code accessibility, multi-asset positioning, and beginner-friendly structure. The main point users should understand is that BulkQuant is not a guaranteed-income product. It is better viewed as a structured AI trading workflow for users who want a more accessible way to explore automation.
2. Capitalise.ai — 9.0/10
Capitalise.ai scores highly because it solves one of the most common problems in trading automation: most traders can describe a strategy, but they cannot always code it.
Its platform is built around plain-language automation. Instead of forcing users to write scripts, Capitalise.ai lets traders create strategy conditions in natural language, test them, simulate them, and monitor them. For stock and forex traders who think in scenarios, this is a useful bridge between discretionary trading and rule-based execution.
For example, a forex trader may want to define a rule around EUR/USD after a central bank announcement. A stock trader may want to trigger an alert or action when a stock breaks a technical level after earnings. Capitalise.ai is designed for this type of conditional thinking.
The platform’s value is not just that it removes code. Its value is that it forces traders to express their ideas clearly. That can be useful because vague trading ideas often become inconsistent decisions in live markets.
Capitalise.ai fits users who want to keep control over their strategy logic but do not want to become developers. Its 9.0 score reflects its no-code structure, practical automation model, and usefulness for both stock and forex scenarios.
3. TrendSpider — 8.8/10
TrendSpider is one of the more useful platforms for traders who still rely heavily on charts but want fewer manual steps. It is less about replacing the trader and more about making technical analysis faster, more consistent, and easier to test.
The platform combines automated technical analysis, market scanners, alerts, strategy testing, chart pattern tools, and no-code trading bots. For stock traders, this can help identify setups faster. For forex traders, it can make technical condition monitoring more systematic across currency pairs.
TrendSpider’s advantage is that it helps convert chart habits into repeatable workflows. A trader who normally draws support and resistance manually, watches breakouts, or monitors moving-average conditions can use TrendSpider to reduce repetitive work and test whether those rules have historical value.
Its score reflects strong chart automation, no-code strategy testing, and broad usefulness for technically driven traders. It may be less ideal for users who do not use charts at all, but for active traders who rely on price action, it brings real workflow value.
4. Trade Ideas — 8.7/10
Trade Ideas is best understood as an AI-powered radar for active stock traders. It is not trying to be a full forex automation suite. Its strength is stock market discovery, especially when traders need to find movement quickly.
Active stock traders often need to monitor unusual volume, momentum shifts, intraday breakouts, earnings reactions, and sector rotation. Trade Ideas helps narrow that universe through real-time scanning, AI signals, paper trading, backtesting, and market alerts.
The platform’s value is speed plus filtering. It does not replace a trading plan, but it can reduce the time traders spend looking for candidates. This is why it remains relevant for users searching for AI stock trading bots in 2026.
Its 8.7 score reflects strong stock-market specialization, real-time scanning capability, and active-trader utility. The lower score compared with broader platforms comes from its narrower forex relevance.
5. MetaTrader 5 — 8.6/10
MetaTrader 5 remains important because it is one of the most familiar automation environments in forex trading. While newer AI platforms may look more modern, MT5 still has a large ecosystem of Expert Advisors, indicators, signals, VPS hosting, and broker-connected execution.
For forex traders, MT5’s appeal is its infrastructure. Users can test strategies, run trading robots, subscribe to signals, access market tools, and work with developers through the broader MQL5 ecosystem. It is also used across forex and some stock market environments, depending on broker support.
The platform is flexible, but that flexibility creates responsibility. Not every Expert Advisor is reliable. Not every signal provider is worth following. Users must evaluate robots, broker execution, spreads, leverage, slippage, and historical performance claims carefully.
MT5 receives an 8.6 because it remains a serious automation environment for forex and multi-asset traders. It is powerful, but less beginner-friendly than newer dashboard-first platforms.
6. cTrader Automate — 8.4/10
cTrader Automate is relevant for forex and CFD traders who want a broker-connected algorithmic trading environment. It is not as beginner-oriented as a simple AI trading app, but it offers a strong framework for users who understand automated execution.
The platform’s automation ecosystem is centered around cBots, indicators, and broker-connected execution. For forex users, this can be valuable because the platform is designed with trading infrastructure in mind rather than only signal discovery.
cTrader’s strength is that it gives more technical traders a clean route into automated forex strategies. Users can explore cBots, run algorithmic tools, and use broker-supported execution paths depending on availability.
Its 8.4 score reflects solid forex automation relevance, broker connectivity, and algorithmic flexibility. It scores slightly lower because it requires more technical understanding than beginner-focused AI trading bot platforms.
7. SignalStack — 8.2/10
SignalStack has a different role from most platforms on this list. It is not mainly a stock scanner, forex robot, or AI idea engine. It is an execution bridge.
Many traders already generate alerts from tools such as TradingView, TrendSpider, or other charting platforms. The problem is that an alert still needs to become an order. SignalStack helps automate that step by turning supported alerts into broker orders.
This makes it useful for traders who already have a tested signal system but want faster execution. A stock trader can use it to reduce manual order placement. A forex or CFD trader may use it to connect alerts to live execution depending on broker and instrument support.
SignalStack receives an 8.2 because it solves a specific automation problem well. Its limitation is that it depends heavily on the quality of the signal source. If the underlying alert logic is weak, faster execution will not fix the strategy.
8. QuantConnect — 8.1/10
QuantConnect is best described as a research lab for algorithmic traders. It is not a plug-and-play AI trading bot, and it is not designed for users who want a simple dashboard. Its value is in serious strategy development.
QuantConnect allows users to research, backtest, refine, and deploy systematic strategies across multiple asset classes, including equities and forex. For developers and quant researchers, this makes it one of the strongest environments for building deeper trading systems.
The platform is useful for users who want to ask more serious questions: How did this strategy behave across different regimes? What happens under different volatility conditions? Does the strategy survive costs, drawdowns, and parameter changes?
Its 8.1 score reflects strong research depth, free backtesting value, and multi-asset flexibility. It scores lower for general users because it requires coding ability, testing discipline, and patience.
9. Tickeron — 8.0/10
Tickeron is an AI stock idea engine built around AI Robots, AI signals, stock screeners, trend tools, and pattern recognition. It is more stock-focused than forex-focused, but it still deserves a place on this list because it directly targets the AI stock trading bot audience.
Tickeron is useful for traders who want machine-learning-generated stock and ETF ideas without manually scanning every chart. It can help users discover pattern-based setups, trend signals, and robot-generated trading ideas.
The platform’s strength is idea discovery. It can give traders a more structured way to review potential opportunities, especially in stocks and ETFs. Its limitation is that users still need to decide whether those ideas fit their time horizon, risk tolerance, and broader market view.
Tickeron receives an 8.0 because it is relevant for AI stock signals and robot-generated ideas, but it is less balanced for users who need serious forex automation.
What traders should check before using AI trading bots
Before using any AI trading bot for stocks or forex, users should review:
- supported markets;
- broker connections;
- account rules;
- fees and spreads;
- subscription costs;
- paper trading availability;
- backtesting quality;
- live execution rules;
- risk settings;
- leverage exposure;
- platform transparency;
- local regulatory requirements.
Users should also ask whether the platform actually fits their experience level. A beginner-friendly dashboard and a research-grade coding environment are very different tools.
Final thoughts
The best AI trading bots for stocks and forex in 2026 are not all solving the same problem.
BulkQuant focuses on guided, managed multi-market workflows. Capitalise.ai turns plain-language trading ideas into automated scenarios. TrendSpider helps chart-focused traders build technical automation. Trade Ideas gives active stock traders AI-powered market scanning. MetaTrader 5 and cTrader remain important for forex robots and broker-connected execution. SignalStack connects alerts to live orders. QuantConnect gives advanced users a research lab for systematic strategies. Tickeron helps stock traders explore AI-generated ideas and patterns.
For traders looking for smarter profits, the key is not to chase the loudest AI promise. It is to choose the platform that matches the trading workflow, test carefully, review risk, and understand what the tool can and cannot do.
Automation can improve structure. It can reduce manual workload. It can help traders follow rules more consistently.
But it cannot guarantee results.
FAQ
What are the best AI trading bots for stocks and forex in 2026?
Some of the most relevant platforms include BulkQuant, Capitalise.ai, TrendSpider, Trade Ideas, MetaTrader 5, cTrader, SignalStack, QuantConnect, and Tickeron. Each platform serves a different workflow, from guided automation and no-code trading to forex robots, alert execution, and quant research.
Which AI trading bot is best for beginners?
BulkQuant may fit beginners who want a guided AI trading workflow. Capitalise.ai may fit users who want plain-language automation. TrendSpider may fit chart-focused traders who prefer no-code strategy tools.
Which platform is best for forex automation?
MetaTrader 5 and cTrader are two major forex automation environments. MetaTrader 5 is widely used for Expert Advisors and forex signals, while cTrader supports cBots and broker-connected algorithmic trading.
Which platform is best for stock trading signals?
Trade Ideas and Tickeron are more stock-focused. Trade Ideas is useful for active traders who want scanners and AI signals, while Tickeron is useful for AI stock robots, pattern tools, and stock or ETF ideas.
Can AI trading bots guarantee profits?
No. AI trading bots cannot guarantee profits. They can help scan markets, automate workflows, test strategies, or execute signals, but stocks and forex remain risky and unpredictable.
What should users check before using automated trading platforms?
Users should check fees, broker connections, account rules, risk settings, leverage exposure, backtesting quality, paper trading access, market support, and whether the platform avoids unrealistic profit claims.
Risk disclosure
AI trading bots, automated trading platforms, forex robots, stock scanners, signal tools, and algorithmic trading systems involve substantial risk. Stocks, forex, CFDs, crypto assets, futures, options, and other financial instruments can move quickly and may result in significant losses.
Past performance, backtesting, paper trading, AI signals, strategy examples, marketplace rankings, copy trading results, or platform demonstrations do not guarantee future performance. Automated tools can execute losing strategies quickly, and market conditions may change without warning.
Users should review all platform terms, broker rules, account settings, fees, spreads, leverage exposure, risk controls, and local legal requirements before using any trading automation tool. Users should only trade with funds they can afford to lose and should consider independent financial advice where appropriate.
Disclosure: This content is provided by a third party. Neither crypto.news nor the author of this article endorses any product mentioned on this page. Users should conduct their own research before taking any action related to the company.

Quick Overview
- American Airlines achieved record first-quarter revenue of $13.9 billion yet incurred a $382 million net loss
- American’s total debt stands at $34.7 billion, the lowest since 2015 but remains elevated versus competitors
- United Airlines delivered Q1 diluted EPS of $2.14, representing an 85% year-over-year increase, alongside 10.6% revenue growth
- Analysts rate United as a Moderate Buy with 12.2% potential upside; American receives a Hold rating with minimal upside forecast
- United demonstrates operational excellence; American continues navigating a challenging turnaround with profitability concerns
American Airlines delivered unprecedented first-quarter revenue totaling $13.9 billion during 2026. However, this achievement was overshadowed by a GAAP net loss of $382 million and an adjusted net loss of $267 million.
The carrier concluded the quarter with $34.7 billion in total debt. While management highlighted this as the company’s lowest debt position since the middle of 2015, it continues to represent one of the most substantial debt burdens among domestic airlines.
American Airlines: An Incomplete Transformation
Market analysts remain skeptical about the proximity of a complete turnaround. The Wall Street consensus assigns American a Hold rating, with price targets suggesting merely 0.45% potential appreciation from present valuations. This reflects limited optimism regarding a near-term revaluation.
American Airlines Group Inc., AAL
Projections for second-quarter earnings have undergone significant downward revisions. This compounds the cautious outlook surrounding the stock as 2026 progresses.
American certainly possesses valuable assets. The carrier operates an extensive domestic route network anchored by strategic hub locations. The crucial question confronting investors is whether these advantages can consistently generate positive earnings and robust free cash flow.
Currently, the disconnect between unprecedented revenue figures and persistent net losses represents the fundamental challenge. Until this gap narrows substantially, the stock will likely remain within its established trading range.
United Airlines: Superior Performance, More Compelling Narrative
United Airlines presented a markedly different performance during the first quarter of 2026. The airline posted diluted earnings per share of $2.14, marking an impressive 85% year-over-year increase. Total operating revenue climbed 10.6%.
United Airlines Holdings, Inc., UAL
United additionally recorded total revenue per available seat mile expansion of 6.9%. The carrier achieved its strongest first-quarter on-time departure performance among America’s eight largest airlines.
The company has strategically allocated capital toward international route expansion, enhanced premium cabin experiences, and loyalty program improvements. This strategic combination appears to be translating demand into profitability more efficiently than American’s approach.
Analyst perspectives clearly illustrate this divergence. United commands a Moderate Buy consensus derived from 18 analyst evaluations, with 15 Buy recommendations. The consensus price target of $134.59 indicates approximately 12.2% upside potential from current trading levels.
This analyst positioning places United in an entirely different category compared to American at present. Investors seeking near-term earnings acceleration find a more compelling argument with United.
Both carriers naturally confront identical external challenges. Fuel price volatility, fluctuating travel demand patterns, and macroeconomic conditions impact the entire sector. Neither stock provides insulation from potential economic headwinds.
The critical distinction lies in each carrier’s current operational standing. American continues addressing debt reduction while striving to restore sustainable profitability. United is already executing and delivering tangible earnings results.
For investors evaluating these two alternatives, United presently provides stronger financial fundamentals, more favorable analyst backing, and a more transparent trajectory toward sustained performance gains.


The recently announced peace deal between Iran and the US, expected to be officially signed on June 19, has triggered a substantial upswing in the cryptocurrency market, with Ethereum (ETH) among the biggest winners.
However, some analysts believe the green wave might be only temporary, predicting a major correction in the coming weeks.
Going South Again?
Several hours ago, ETH climbed to approximately $1,850, and it is currently worth around $1,790 (according to CoinGecko), representing a 7% increase since last Tuesday.
And while some holders might cheer the sharp rise, others think the upswing has occurred in an unhealthy manner and could be followed by a short-term pullback. One person sharing this theory is the popular analyst Ted. He noted that the asset’s Relative Strength Index (RSI) on a 4-hour scale reached its most overbought territory for the past three months.
“Last time this happened, Ethereum dropped 15% in 2 weeks,” he reminded.
The whales’ activity is also worth observing. X user Max Crypto revealed that one large investor opened a $30.9 million short on ETH with 20x leverage when the price was trading near $1,820. With this risky bet, a mere $90 rise would have liquidated the trader.
Whales are known as experienced market participants, and many believe that their decisions rarely depend on their sixth sense but on inside information that they might have about upcoming events that could influence the price. Their behavior is often monitored by smaller players who may get scared and exit the ecosystem, thus negatively impacting ETH’s valuation.
‘Phenomenal Spot’ to Buy?
Other well-known industry participants presented highly optimistic predictions. X user Michael van de Poppe touched on the ETH/BTC ratio, arguing that the current price level is a “phenomenal spot” to invest in the second-largest cryptocurrency over the next 6-12 months.
“Next step = breaking 0.03250 and to be getting clearly into an uptrend again. Other than that, price usually starts, narrative will come up and accelerate the momentum, and I won’t be surprised to see the momentum pick up significantly in the coming period on Ethereum,” he added.
Poseidon also chipped in, claiming that people have 90 days left to buy ETH under $2,000 “for the last time.” Meanwhile, the massive outflow from exchanges supports the bullish scenario.
As CryptoPotato recently reported, nearly 500,000 tokens have been withdrawn from centralized platforms over the past week, resulting in reduced selling pressure and considered an early sign of accumulation.
The post Ethereum Warning: Here’s Why ETH’s Price Can Drop by 15% appeared first on CryptoPotato.
CoinDesk Indices presents its daily market update, highlighting the performance of leaders and laggards in the CoinDesk 20 Index.
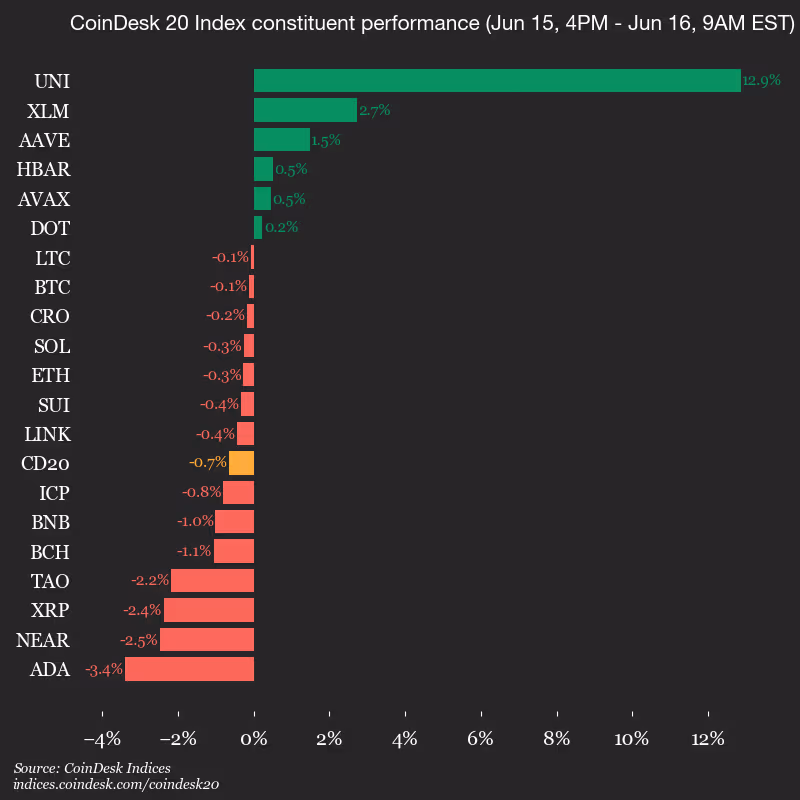
The CoinDesk 20 is currently trading at 1829.21, down 0.7% (-12.13) since 4 p.m. ET on Monday.
Six of 20 assets are trading higher.

Leaders: UNI (+12.9%) and XLM (+2.7%).
Laggards: ADA (-3.4%) and NEAR (-2.5%).
The CoinDesk 20 is a broad-based index traded on multiple platforms in several regions globally.

Key Highlights
- On June 10, 2026, Nebius Group finalized its purchase of AI inference specialist Eigen AI, keeping deal terms confidential.
- First-quarter revenue climbed to $399 million, marking a 684% surge from the prior year and exceeding Wall Street’s $375 million projection.
- The AI cloud provider posted a per-share loss of ($0.23), significantly outperforming analyst expectations of ($0.77).
- Shares of NBIS started trading Tuesday at $260.07, reflecting a gain of more than 415% over the trailing twelve-month period.
- Analyst sentiment remains positive with nine Buy recommendations, including Citigroup’s top price objective of $287.
The Amsterdam-headquartered Nebius Group (NBIS) successfully completed its takeover of Eigen AI on June 10, 2026, approximately six weeks following the initial May 1 announcement. The company verified the acquisition through a Tuesday press statement after securing necessary regulatory clearances. Specific financial details of the transaction remain undisclosed.
Eigen AI specializes in inference technology and model optimization—core competencies that integrate seamlessly with Nebius’s current cloud infrastructure designed for AI training and deployment workflows.
This acquisition arrives alongside remarkable financial performance from Nebius. During the first quarter of 2026, the company generated $399 million in revenue, representing a staggering 684% increase versus the comparable period in 2025. Revenue from the AI Cloud segment specifically totaled $389.7 million, accounting for 98% of overall company revenue.
The company’s quarterly per-share loss of ($0.23) substantially exceeded Street expectations, which had anticipated a loss of ($0.77) per share.
NBIS began Tuesday’s session at $260.07. Trading over the past 52 weeks has ranged from a low of $43.89 to a peak of $278.84, with shares posting gains exceeding 415% over the last twelve months. The 50-day moving average currently stands at $187.49, while the 200-day moving average registers at $129.09.
The company’s market capitalization has reached approximately $65.80 billion.
Wall Street Price Targets Climb Higher
Financial analysts have responded positively to recent developments. Following the strong Q1 performance, Citigroup elevated its price objective from $169 to $287 while reaffirming its Buy recommendation. Citizens JMP increased its target from $175 to $270, maintaining a Market Outperform stance. Morgan Stanley adopted a more conservative approach, raising its target from $126 to $144 alongside an Equal Weight rating.
Current analyst coverage includes nine Buy ratings and six Hold ratings. According to MarketBeat data, the consensus price target across all analysts sits at $203.25.
Compass Point previously adjusted its target upward from $150 to $260 while maintaining its Buy recommendation.
Institutional ownership has expanded notably. Millennium Management established a fresh position valued at approximately $11.5 million during Q1. UBS Asset Management Americas contributed around $9 million in new investment. Royal Bank of Canada similarly initiated a position worth $1.6 million. Combined, institutional investors and hedge funds currently control 21.90% of outstanding shares.
Notable Insider Transaction Activity
Regarding insider activity, Chief Technology Officer Danila Shtan divested 15,678 shares on June 4 at an average sale price of $238.96, decreasing his holdings by 5.1%. This transaction occurred through a previously established Rule 10b5-1 trading arrangement.
Insider Andrey Korolenko sold 500,000 shares on May 13 at $203.24 each, reducing his ownership position by 46.07%. Throughout the most recent three-month period, company insiders have collectively sold 700,710 shares totaling more than $132 million.
Nebius has also recently unveiled a 22-megawatt, ten-year contract with Kao Data for infrastructure development at a United Kingdom data center facility, representing part of a broader £1.7 billion commitment to British operations. Additionally, the company revealed a 328 MW fuel cell collaboration with Bloom Energy.
Situational Awareness, an investment firm headed by former OpenAI researcher Leopold Aschenbrenner, has acquired a 5.6% ownership stake in the company.
Venture Visionary Partners LLC expanded its holdings by 13% during the fourth quarter, purchasing an additional 5,922 shares to bring its total position to 51,462 shares, currently valued at approximately $4.3 million.
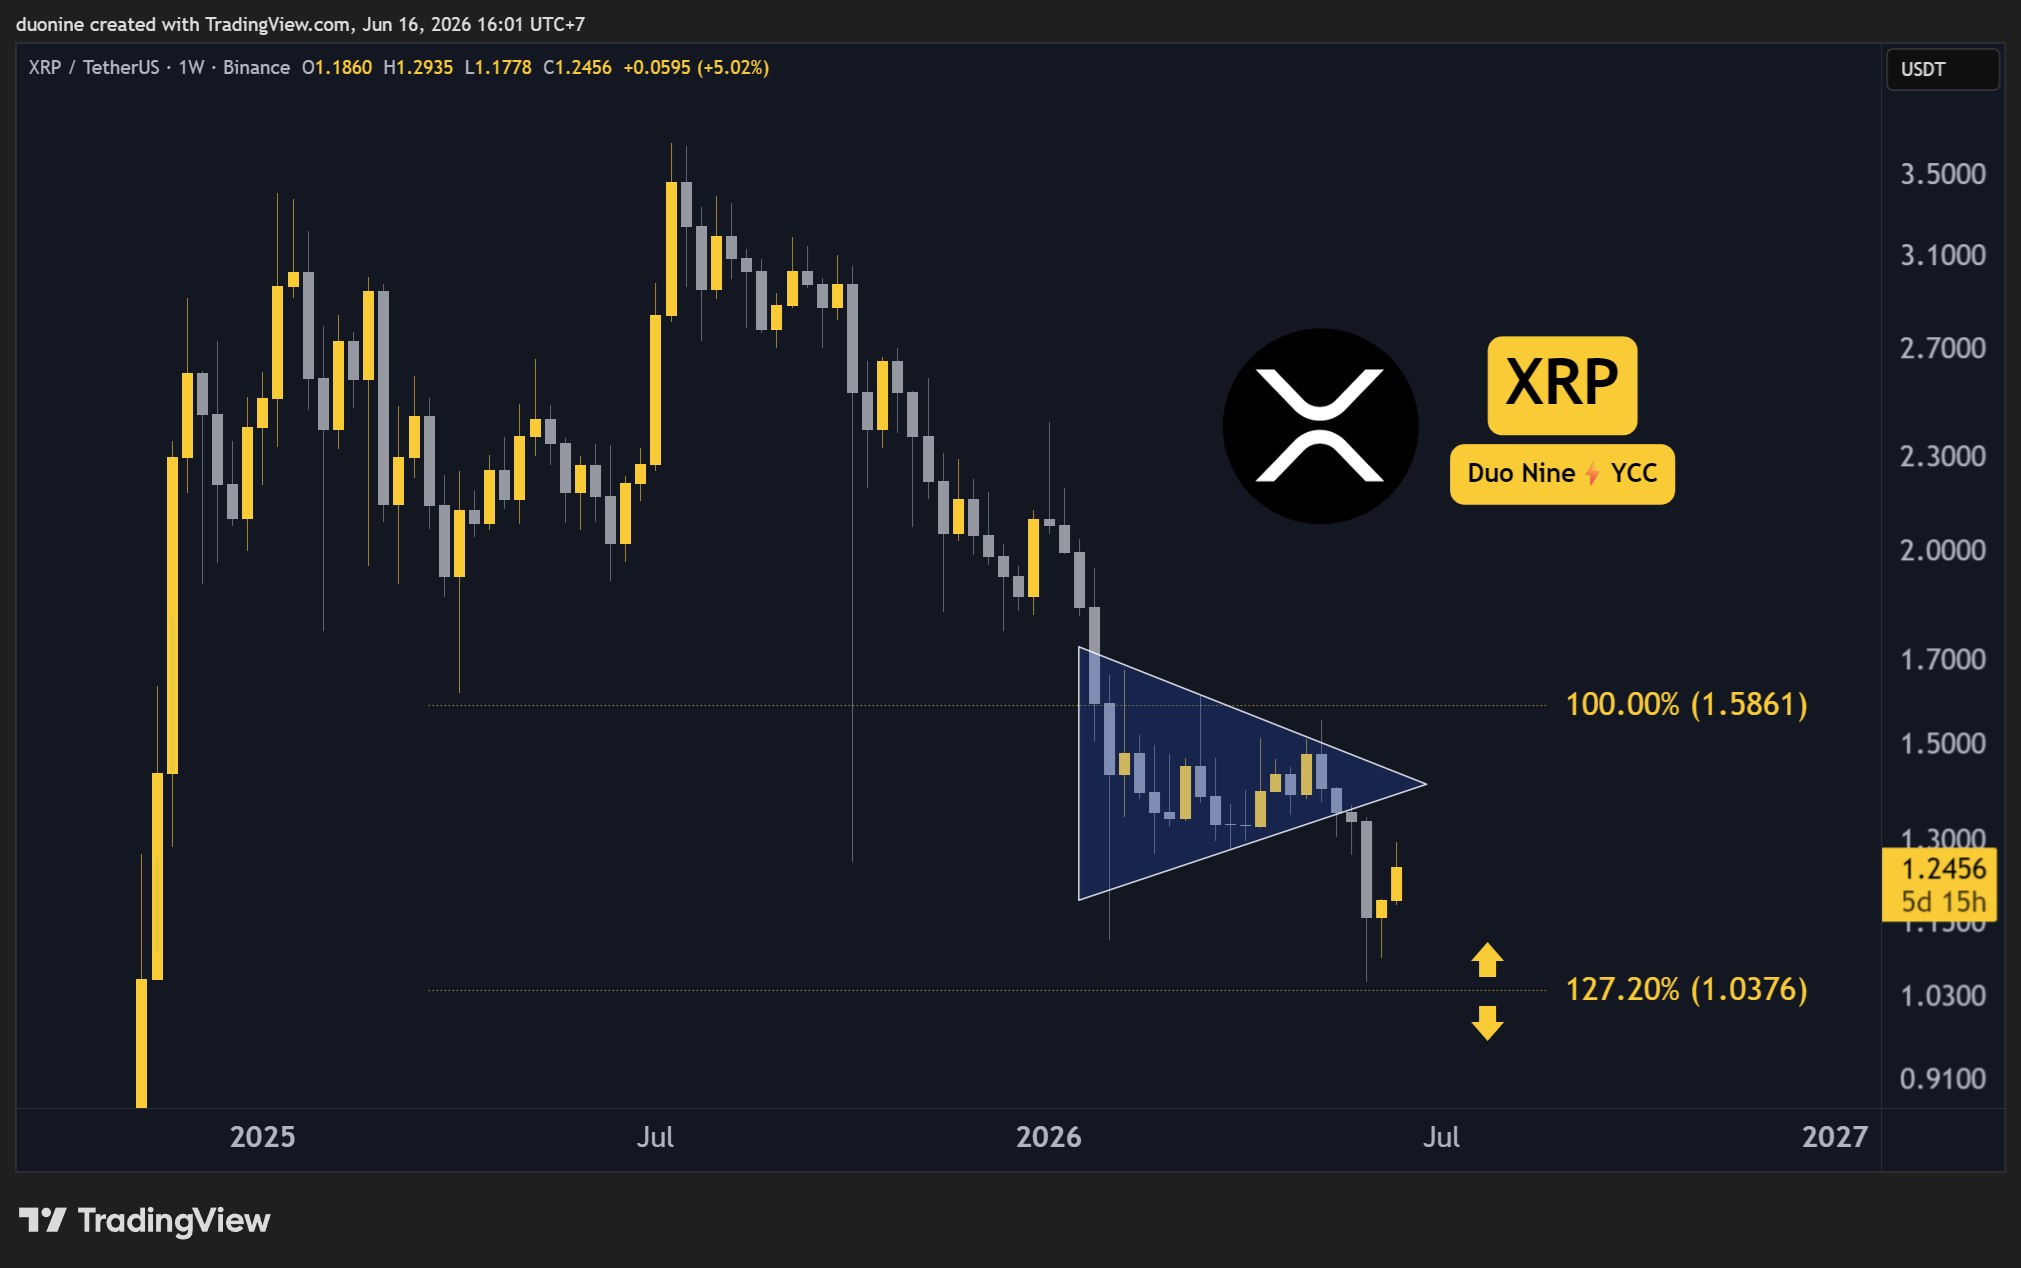
XRP is found in a relief rally with $1.3 as a key target to reclaim. The asset challenged it yesterday, but it was stopped. Can it break through this week?
Ripple (XRP) Price Predictions: Analysis
Key support levels: $1.2, $1
Key resistance levels: $1.3, $1.6, $2
Buyers Push XRP into a Relief Rally
After the price dropped to near $1, buyers returned to XRP, sending it into a relief rally that is still ongoing as of this post. So far, buyers managed to send the price close to the resistance at $1.3.
If XRP can reclaim $1.3 as support, the cryptocurrency has a real chance of reaching higher levels in the future, with key targets at $1.6 and $2. That is the optimistic scenario. The bearish take is a rejection at $1.3, which would likely send the price back to $1.
Momentum Indicators Turning Bullish
With the buy volume spiking most recently, the momentum indicators, such as the MACD on the daily timeframe, have turned bullish. This is an encouraging sign that the downtrend may be coming to an end.
However, the resistance at $1.3 needs to be broken to confirm a reversal; anything less would be premature and likely turn into a bull trap. Thus, the next few days are critical for determining whether XRP has what it takes to reverse its most recent losses.

Daily RSI Moves Above 50
Another positive development is evident in the daily RSI, which has been above 50 since yesterday. This is a significant change that shows sellers no longer have control over the price.
Now, buyers will need to do their best to keep the RSI above 50, as a drop back below this midpoint could be interpreted as bearish. Since the recent rally was quite sudden, a pullback could be expected and normal before new highs.

The post Ripple (XRP) Price Predictions for This Week (June 16) appeared first on CryptoPotato.

Quick Overview
-
STI stock recovers following announcement of innovative BEEP battery platform
-
New architecture designed for electric aircraft, unmanned systems, AI facilities, and orbital applications
-
Bipolar design promises significant reductions in weight, volume, and manufacturing steps
-
Technology eliminates traditional modular construction in favor of integrated stacking approach
-
Pre-market session shows recovery momentum after previous session’s substantial decline
The Dallas-based energy storage developer revealed its proprietary BEEP battery architecture as shares experienced a pre-market recovery following the prior day’s significant downturn. The innovative solid-state platform specifically addresses power requirements for electric vertical takeoff and landing vehicles, autonomous aerial systems, robotic platforms, artificial intelligence computing facilities, orbital infrastructure, and similar demanding applications.
Revolutionary Battery Architecture Debuts
Solidion Technology announced that its bipolar electrode-to-pack architecture fundamentally reimagines solid-state battery construction methodology. According to the company, this approach eliminates conventional multi-stage assembly that involves creating individual cells before integrating them into modules and complete packs. The BEEP system instead employs direct stacking of bipolar electrode configurations with solid electrolyte materials.
This integrated construction method establishes both series and parallel electrical pathways within a unified enclosure, the company explained. The resulting configuration delivers enhanced volumetric and gravimetric energy metrics while substantially minimizing internal wiring infrastructure and component housing requirements.
The technology specifically targets emerging markets including electric aviation platforms, autonomous flying vehicles, mobile robotics, data center backup systems, and extraterrestrial power solutions. These application areas demand energy storage solutions with superior mass efficiency, compact footprints, and exceptional safety characteristics. The company presents BEEP as an enabling technology for next-generation mobility and stationary storage deployments.
Industry Obstacles Continue to Shape Market
The solid-state battery sector has attracted significant interest due to potential improvements in thermal stability, rapid charging capabilities, and extended operational range for electrified vehicles and aircraft. Despite these advantages, manufacturing economics have prevented widespread market penetration.
Physical dimensions of complete battery assemblies present another significant challenge for transportation applications. Conventional architectures incorporate substantial protective enclosures, extensive connector networks, and thermal management systems. These elements consume valuable space and contribute mass across electrified ground vehicles, aerial platforms, maritime vessels, and spacecraft.
Solidion positions BEEP as a solution to these industry-wide challenges through architectural simplification. The company indicates that the technology requires only a single external enclosure and dramatically fewer interconnection points. This streamlined design could deliver measurable improvements in specific energy, packaging efficiency, and production economics.
Share Price Shows Morning Recovery Pattern
STI shares closed regular trading at $20.90, representing a 17.29% decline from the previous session. During pre-market activity, however, the stock demonstrated recovery momentum, advancing to $21.85. This represented a 4.55% increase ahead of the opening bell, following a period of significant price volatility.
The pre-market uptick coincided with the company’s disclosure of its BEEP technology platform. Management positioned the innovation as particularly relevant for industries requiring lightweight, high-performance energy solutions. Key target markets encompass electric vertical aircraft, aerospace applications, autonomous systems, and emergency power infrastructure supporting artificial intelligence computing centers.
Solidion Technology maintains headquarters in Dallas while operating pilot manufacturing operations in Dayton, Ohio. The enterprise focuses on next-generation battery materials, components, and performance-optimized energy storage architectures. Its intellectual property portfolio encompasses more than 385 patents spanning silicon-based anodes, advanced graphite formulations, lithium-sulfur chemistry, and lithium-metal technologies.

Police investigate alleged fraud at Crathorne Hall Hotel

Red’s All Natural adds frozen snack line

Bitcoin Stock Performance Diverges as BTC Falls to $66K, Oil Slips Below $78


-

 Business2 days ago
No Jackpot Winner as $257 Million Prize Rolls Over to $269 Million Monday Draw
-

 Crypto World5 days ago
Oppenheimer backs SpaceX as $70 billion retail frenzy builds
-

 Fashion4 days ago
Weekend Open Thread: Tuckernuck – Corporette.com
-

 Crypto World5 days ago
Markets Rally as SpaceX IPO Looms Amid Iran Tensions and Inflation Surge
-
Crypto World2 days ago
Zimbabwe Requires Crypto Businesses to Register Annually Under New FIU Regulations
-

 Tech4 days ago
NanoClaw integrates JFrog registries to secure AI agent downloads
-
 Sports7 days ago
Bangladesh beat Australia after 20 years in ODIs, register only their second win over six-time world champions | Cricket News
-

 Tech4 days ago
This Week In Security: Microsoft On Microsoft, Register Your Domains, Linux On ARM, And FreeBSD Joins The File Cache Club
-

 Crypto World3 days ago
Bitget enters Argentina’s regulated crypto market through PSAV registration
-

 Business6 days ago
Thailand Ranks Second Worldwide for AI Adoption Growth, Microsoft Reports
-
 Tech5 days ago
Dutton Ranch star claims they ‘didn’t see any disruption’ on set following Chad Feehan’s exit from Yellowstone spinoff fueled by Taylor Sheridan clash rumors
-

 NewsBeat5 days ago
El Nino has formed in the Pacific and could set records, forecasters say
-

 Tech6 days ago
‘This is Seattle’s position on AI’: City Council votes unanimously to pause big new data centers
-

 Politics5 days ago
Politics Home | Healey Resignation Is “Colossal Failure Of Government”, Says Former Labour Defence Secretary
-
 Entertainment5 days ago
Donnie Wahlberg & More Heat Up Las Vegas at Circa’s Barry’s Downtown Prime
-

 Sports5 days ago
First Time Since 1971: Australia Register Historic Low In ODI Cricket
-
 Tech5 days ago
Opendoor Ends India Operations, Fueling a Bigger Conversation About AI and Outsourcing
-

 Politics5 days ago
Belfast burns, while Met chief points finger at Iran and Russia
-

 NewsBeat4 days ago
FBI searches office of Ohio voter registration group
-

 Business5 days ago
AT&T: Verizon's 27% Outperformance Sets Up A Solid Entry Point
You must be logged in to post a comment Login