
Crypto World
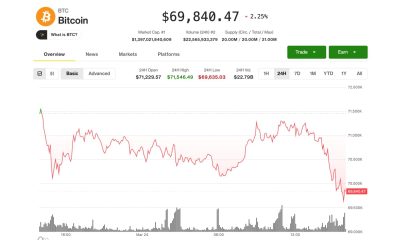
Bitcoin Plunges in One of Its Fastest Crashes Ever

Bitcoin (CRYPTO: BTC) trading action suggests a rebound is becoming increasingly likely, even as the asset tests downside extremes. Data show BTC is about 2.88 standard deviations below its 200-day moving average—the kind of deviation that has not occurred in a decade of data, according to Martin Leinweber of MarketVector Indexes. A dip below $60,000 intensified the narrative that this is macro-driven rather than a breakdown of the technology or the network’s fundamentals, with analysts framing the move as a potential prelude to mean reversion. While official bottoms remain uncertain, the long-term thesis for Bitcoin’s role in diversified portfolios remains intact, keeping attention on what happens next as liquidity and risk sentiment evolve.
Key takeaways
- Bitcoin (BTC) sits about 2.88σ below its 200-day moving average, an extreme not seen in roughly ten years of data.
- BTC plunged more than 22% in a single week, placing the move among the fastest drawn‑down episodes in its history.
- Analysts describe the current bear market as macro-driven rather than a tech failure, with the long‑term thesis for BTC still intact.
- Ethereum (ETH) and Solana (SOL) have underperformed BTC during this episode, underscoring broad risk-off conditions across major crypto assets.
- Despite the drawdown, some observers see signs of mean reversion ahead, though a definitive bottom remains elusive.
Tickers mentioned: $BTC, $ETH, $SOL
Sentiment: Bearish
Price impact: Negative. A steep weekly loss reinforces risk-off sentiment and pressures near-term liquidity dynamics.
Market context: The move aligns with broader risk-off environments where macro factors drive volatility in crypto markets, shaping trading ranges and participant behavior rather than signaling a systemic breakdown of the asset class.
Why it matters
Bitcoin’s recent performance has spotlighted the fragility and resilience of crypto markets at the intersection of macro stress and digital asset hedging. On one hand, the unprecedented distance from the 200-day SMA underscores how stretched sentiment and liquidity can become during risk-off phases. On the other hand, the fact that the long-term investment narrative remains intact—often cited by researchers and institutions—suggests that the drawdown may eventually be absorbed as traders reprice risk rather than reallocate away from the asset class entirely.
Analysts point to the speed and magnitude of the move as a catalyst for renewed interest among long-term holders and “cash-heavy” buyers prepared to accumulate during volatility. In the near term, the market is watching whether the price reverts toward trend lines and whether any technical floor emerges around historically meaningful levels. The divergence between BTC and altcoins like Ethereum (CRYPTO: ETH) and Solana (CRYPTO: SOL) during this period also matters: a widening dispersion could indicate selective risk appetite among institutional players or hedged traders recalibrating exposure across chains.
Macro factors continue to loom large. When bear markets crest on macro-driven dynamics, the consensus often shifts between “this is a pause before a recovery” and “this is the start of a longer review of risk premia across digital assets.” The sentiment readings have been grim at moments, such as the episode’s rapid liquidation cycles and the perception of liquidity shortages in stressed markets. Yet within this volatility, the potential for mean reversion persists because the observed distances from trend lines are statistically extreme. In the view of Leinweber and others, the dataset suggests that outsized deviations can produce sharp, corrective rebounds when liquidity and risk tolerance normalize.
Historical context remains a persistent theme. The drawdown scenario recalls prior stress events but stokes caution against assuming a bottom has formed. While the macro narrative dominates near-term moves, participants continue to scrutinize on-chain signals, exchange flows, and the behavior of large holders to gauge whether capacity is forming for a technical bounce or if further declines could unfold before any stabilization.
What to watch next
- Monitor Bitcoin’s proximity to the 200-day SMA and any early signs of mean reversion, including turnover in liquidity metrics and order-book dynamics.
- Track hedging and accumulation patterns among large traders and institutions, particularly any shifts in funding rates and open interest on BTC-denominated derivatives.
- Assess sentiment indicators, such as the Crypto Fear & Greed Index, for any uptick from extreme readings as prices stabilize or bounce.
- Compare performance across BTC, ETH, and SOL to determine whether the macro backdrop is driving broad risk-off or if assets begin to decouple in a stabilization phase.
Sources & verification
- Martin Leinweber’s X thread detailing BTC’s distance from the 200-day SMA and the sub-$60,000 dip (via New analysis).
- BTC’s weekly drawdown exceeding 22% and its ranking among the fastest declines in history.
- Crypto Fear & Greed Index reading at 9/100, signaling extreme market pessimism (via Alternative.me).
- Reported dip-buying activity and commentary from traders discussing potential opportunities for cash-rich buyers (via buying the dip).
- On-chain and market observations cited in discussions around BTC’s move and altcoin relative performance (via linked analyses and price pages for ETH and SOL).
Market reaction and key details
Bitcoin (CRYPTO: BTC) has moved into a territory that market technicians label as extraordinarily rare: a sustained deviation from the 200-day moving average that has not appeared in roughly ten years of data. The data show BTC trading below the 200-day SMA by about 2.88 standard deviations, a statistic that Leinweber describes as a once-in-a-decade event. The price fragment below the $60,000 level has arrived amid a weekly slide of more than 22%, a pace that places the move among the most rapid drawdowns in the currency’s history. In practical terms, the slide has undertaken both the breadth of a market-wide risk-off mood and the depth associated with cascading liquidations across leveraged positions.
Despite the severity of the move, the analyst notes that Bitcoin’s long-term investment thesis remains intact. He stresses that the bear market at hand appears macro-driven rather than a sign of systemic weakness in the protocol or in its underlying economic model. In his perspective, the combined signals—distance from the 200-day SMA, an outsized daily drawdown, and the persistence of macro headwinds—point toward a high probability of mean reversion as liquidity conditions normalize and market participants recalibrate risk appetites. This framing resonates with the broader interpretation that the current episode is more about macro dynamics than a fundamental failure of Bitcoin’s supply-demand mechanics.
The broader market also reveals differentiated performance among major crypto assets. Ethereum (CRYPTO: ETH) and Solana (CRYPTO: SOL) have not kept pace with Bitcoin’s decline, reinforcing the narrative that capital follows risk-off trends with selective dispersions across chains. The distances from trend lines for these assets underscore how volatility has affected the sector as a whole, even as some observers argue that BTC’s unique status as a market anchor can drive sharper moves in its wake. The juxtaposition between BTC’s outsized deviation and altcoins’ responses provides a window into how market participants are weighing potential rebounds versus the risk of renewed downside momentum.
Market participants have also been watching the buy-and-dump cycles that have characterized recent weeks. Several commentators described how large‑volume liquidations have created pockets of opportunity for those with dry powder, especially among hedge funds and major exchange ecosystems. One trader emphasized that the “middle” of 2024’s range could offer attractive entry points for those prepared to accumulate while volatility remains elevated. Yet even as accumulation narratives gain traction, the scale of the current decline and the magnitude of the deviation suggest that any reprieve could be inherited with caution rather than enthusiasm, as investors assess where the next catalyst might come from and whether a longer-term stabilizing phase can emerge from the micro- and macro- forces at play.
As observers parse the data, the emphasis remains on risk management and disciplined positioning. While the macro backdrop remains unsettled—characterized by inflation dynamics, central bank policy expectations, and liquidity considerations—the consensus among several researchers is that Bitcoin’s core narrative persists. The asset’s scarcity, its history of resilience, and the belief that it still acts as a portfolio hedge for some traders anchor a case for eventual recovery, even if the near term remains volatile and uncertain. In short, the market is braced for a potential rebound, but the path there will be shaped by evolving macro signals and the behavior of market participants navigating a complex risk environment.
https://platform.twitter.com/widgets.js


Disclosure: This article does not represent investment advice. The content and materials featured on this page are for educational purposes only.
Exolix gains traction in 2026 as developers seek fast, reliable crypto exchange API solutions.

As the crypto ecosystem grows, infrastructure is now an essential part of every product, from crypto wallets and exchanges to fintech applications and web3 projects. Most products rely on APIs to support key functionalities such as price feeds, access to liquidity, and transaction execution. As such, finding the best crypto API is no longer a choice but a necessity.
However, the best crypto API remains a concern for many projects and teams. The best crypto API depends on a few key factors: ease of integration, reliability, and the speed at which the product can be deployed without having to build complex infrastructure from scratch.
Exolix is emerging as one of the best crypto exchange API providers in the market in 2026 by addressing the key requirements of the crypto ecosystem. It offers the best crypto API due to its fast deployment capabilities, which provide developers with the best way to integrate crypto swap functionalities into their products. As such, the Exolix crypto exchange API is the best choice for teams seeking the best crypto API for startups.
What Is Exolix API?
Exolix API is a crypto infrastructure product that enables developers to add instant exchange capabilities to their applications. Instead of developing complicated exchange systems or dealing with the intricacies of working with multiple liquidity providers, developers can integrate with Exolix and allow users to exchange cryptocurrencies within the interface.
This makes Exolix API one of the best crypto exchange APIs, especially for projects that wish to add crypto-to-crypto exchange capabilities to their applications.
The API is also lightweight and easy to implement. Some of the key functionalities that can be integrated using the API are as follows:
- execution of crypto swaps across various assets
- real-time calculation of the rate
- tracking of the status of transactions
- cross exchange support
This simplicity also makes Exolix one of the best crypto APIs for startups, as the teams involved in the development of the startups need to launch the projects as soon as possible without having to spend much time and resources on the development of the back end.
Another significant factor related to the API is the non-custodial nature of the API. This means that the users are in full control of the money during the exchange process, which is also in line with the current trend of moving towards more decentralized and user-friendly financial tools.
Why Exolix Is One of the Best Crypto API Providers in 2026
As the number of crypto infrastructure providers grows, the line between an excellent API and the best crypto API comes down to usability, reliability, and performance in the real world. Exolix, in 2026, stands out as an API that focuses on the practical needs of developers, ease of integration, execution, and support.
While some APIs are difficult to set up or require significant technical expertise, Exolix has been created to be simple to use, and this is just one reason it is often considered to be among the best crypto APIs, especially for startups and growing web3 products.
Easy API integration
One of the key advantages of Exolix is the ability of the developers to get started as quickly as possible. This is because the API is quite straightforward.
Developers can explore integration on the developers page.
The key advantages of integrating with Exolix are:
- Simple request and response structure
- Quick onboarding process
- No need to build exchange infrastructure
- Ability to integrate with xisting apps and wallets
This makes Exolix a strong contender for the best crypto exchange API, especially for development purposes.
24/7 Technical Support
Another key aspect in selecting the top API for crypto is reliable support. This is because, in the event of any problems related to swaps, rates, or integration, user experience is affected.
Exolix offers technical support around the clock, enabling teams to quickly address any problems, ensuring optimal performance.
This is especially useful for:
- Startups with small engineering teams
- Platforms with users in different time zones
- Platforms that need to be available 24/7
Integration and Revenue Opportunities
Exolix is constantly improving its API infrastructure to ensure ease of integration for wallets, apps, and crypto platforms to include non-custodial cross-chain swaps in their products. This API is flexible and simple to implement to ensure ease of integration for our partners.
Revenue Share Model
One of the main advantages of integrating with Exolix is our revenue share model. This model ensures our partners receive a share of revenue from swaps done on their platforms. This creates an additional revenue source for our partners.
This means our partners can:
- Monetize their current user base
- Create an additional revenue source
- Improve their products without adding operational overhead
Integration assistance for Developers
Apart from that, Exolix is also offering assistance during the integration process itself. This is going to help teams that may not have the best knowledge of the underlying crypto infrastructure.
The assistance that is going to be available during the integration process is as follows:
- Guidance on implementing the API
- Troubleshooting during the setup process
- Optimization hints for the best performance
- Assistance with edge cases during transactions
This is going to help Exolix become one of the best crypto APIs around.
Key use cases for Exolix API
The flexibility of Exolix makes it perfect for various crypto products. Whether it is developing a crypto wallet, exchange, or any other related application, the right crypto API can help to achieve new heights without adding complexity to the development process.
Exolix is all about simplicity and compatibility, and this is why it is used in various applications that demand timely development and user experience. This is why it is considered one of the best crypto APIs for startups.
Wallet Integration
Crypto wallets are one of the most common applications of the Exolix API. The swap feature is integrated into the user interface of the wallet, allowing the user to swap assets without exiting the application. This is a great way to retain the user and provide a richer experience.
Exchange and trading platforms
For projects that need instant swaps without the hassle of building their own trading engine, Exolix is available as a backend solution. This is the reason Exolix is considered one of the best crypto exchange APIs available today.
Web3 and DeFi applications
Decentralized applications may utilize Exolix, which offers the possibility of cross-chain swaps as well as the moving of assets between different chains.
Startup products and MVPs
For early-stage teams, the key is speed, and Exolix helps teams launch their products quickly by not requiring them to develop from scratch.
This makes Exolix an excellent choice among the best crypto APIs for startups, especially when developing:
- MVPs
- Early product tests
- Quick iteration cycles
With the ability to accommodate multiple use cases with a single integration, Exolix offers a scalable base for various types of crypto products at different stages of development.
FAQ
What is Exolix API?
Exolix API is a product that serves as a solution for building a cryptocurrency infrastructure that can facilitate instant cryptocurrency exchange. The API can be used by developers to add instant cryptocurrency exchange capabilities to their platforms.
Why is Exolix considered one of the best crypto APIs?
Exolix API is regarded as one of the best free crypto APIs because it is simple, has a quick onboarding process, and is reliable. The API has a feature that allows users to make cross-chain swaps, has clear documentation, and is available 24/7. These features make it a feasible choice for both new and old cryptocurrency products.
Is Exolix suitable for startups?
Yes, Exolix is an excellent choice in the list of the top-rated APIs in the cryptocurrency industry. It is an excellent choice for startups that want to launch their project without the need to build their exchange infrastructure. This way, the startup can save time and money while still providing the feature of cryptocurrency swaps.
Does Exolix API require complex integration?
No, one of the biggest advantages of using Exolix is that it is easy to integrate. The API is easy to use and has a simple structure. Moreover, there is support available during the integration process. A developer can easily start using the API with the documentation provided on the official website.
What can you build with Exolix API?
The Exolix API is an excellent choice for developers who want to create different cryptocurrency-related products such as wallets, exchange interfaces, and Web 3 applications. It is also used to add instant swap functionality, which makes it one of the top-rated cryptocurrency exchange API solutions.
Disclosure: This content is provided by a third party. Neither crypto.news nor the author of this article endorses any product mentioned on this page. Users should conduct their own research before taking any action related to the company.
The crypto market will welcome tokens worth more than $643 million in the first week of April 2025. Major projects, including Hyperliquid (HYPE), Sui (SUI), and Ethena (ENA) will release significant new token supplies.
These unlocks could introduce market volatility and influence short-term price movements. So, here’s a breakdown of what to watch.
1. Hyperliquid (HYPE)
- Unlock Date: April 6
- Number of Tokens to be Unlocked: 9.92 million HYPE
- Released Supply: 415.33 million HYPE
- Total Supply: 1 billion HYPE
Hyperliquid is a leading decentralized perpetual futures exchange built on its own Layer-1 blockchain. It offers high-performance trading with low latency, on-chain order books, and sub-second transaction finality.
On April 6, the team will unlock 9.92 million HYPE worth $375.84 million. The tokens account for 2.66% of the released supply.
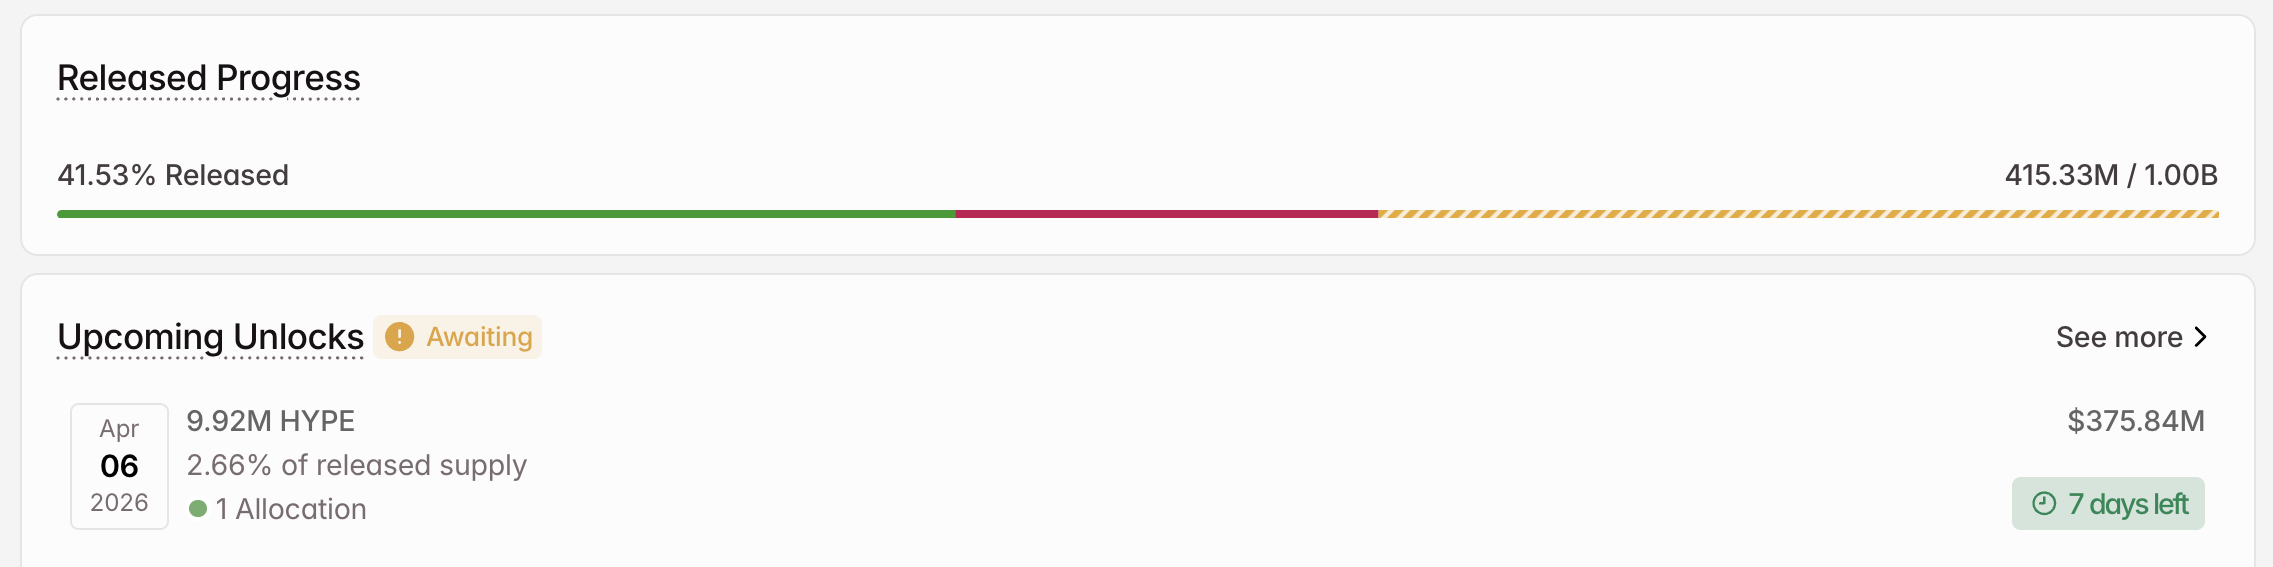
Hyperliquid will direct all unlocked altcoins to core contributors. However, Tokenomist pointed out that HYPE has historically claimed far fewer tokens than its projected unlock amounts.
2. Sui (SUI)
- Unlock Date: April 1
- Number of Tokens to be Unlocked: 42.94 million SUI
- Released Supply: 3.9 billion SUI
- Total Supply: 10 billion SUI
Sui is a high-performance Layer-1 blockchain. It utilizes the Move programming language to enable scalable, secure, and efficient decentralized applications (dApps).
Moreover, the network focuses on parallel execution for high throughput, making it suitable for gaming, decentralized finance (DeFi), and Web3 ecosystems.
On April 1, Sui will unlock 42.94 million altcoins as part of its monthly schedule. This stack represents 1.10% of the released supply. Furthermore, it is worth approximately $36.36 million.
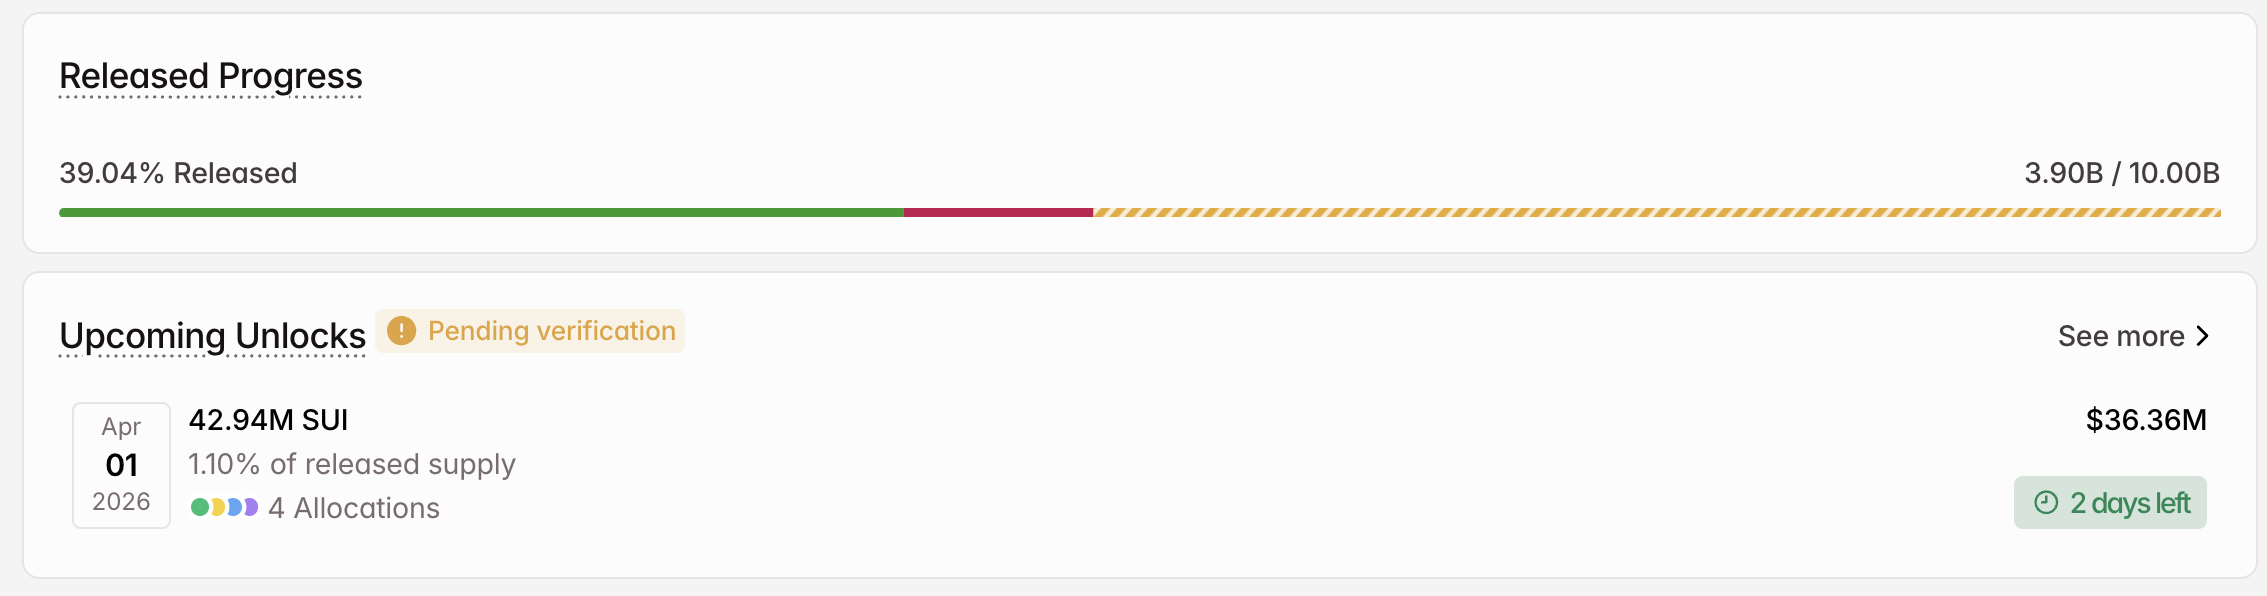
Of the unlocked supply, 19.32 million SUI will go to Series B investors. Community reserve and early contributors will get 12.63 million and 8.93 million SUI, respectively. Lastly, Mysten Labs will receive 2.07 million altcoins.
3. Ethena (ENA)
- Unlock Date: April 2
- Number of Tokens to be Unlocked: 40.63 million ENA
- Released Supply: 7.84 billion ENA
- Total Supply: 15 billion ENA
Ethena is a synthetic dollar protocol built on Ethereum (ETH). The protocol’s flagship product is USDe, a synthetic dollar stablecoin. Furthermore, ENA is the protocol’s governance token.
The team will release 40.63 million ENA tokens on April 2. The tokens, worth $3.64 million, account for 0.52% of the released supply.
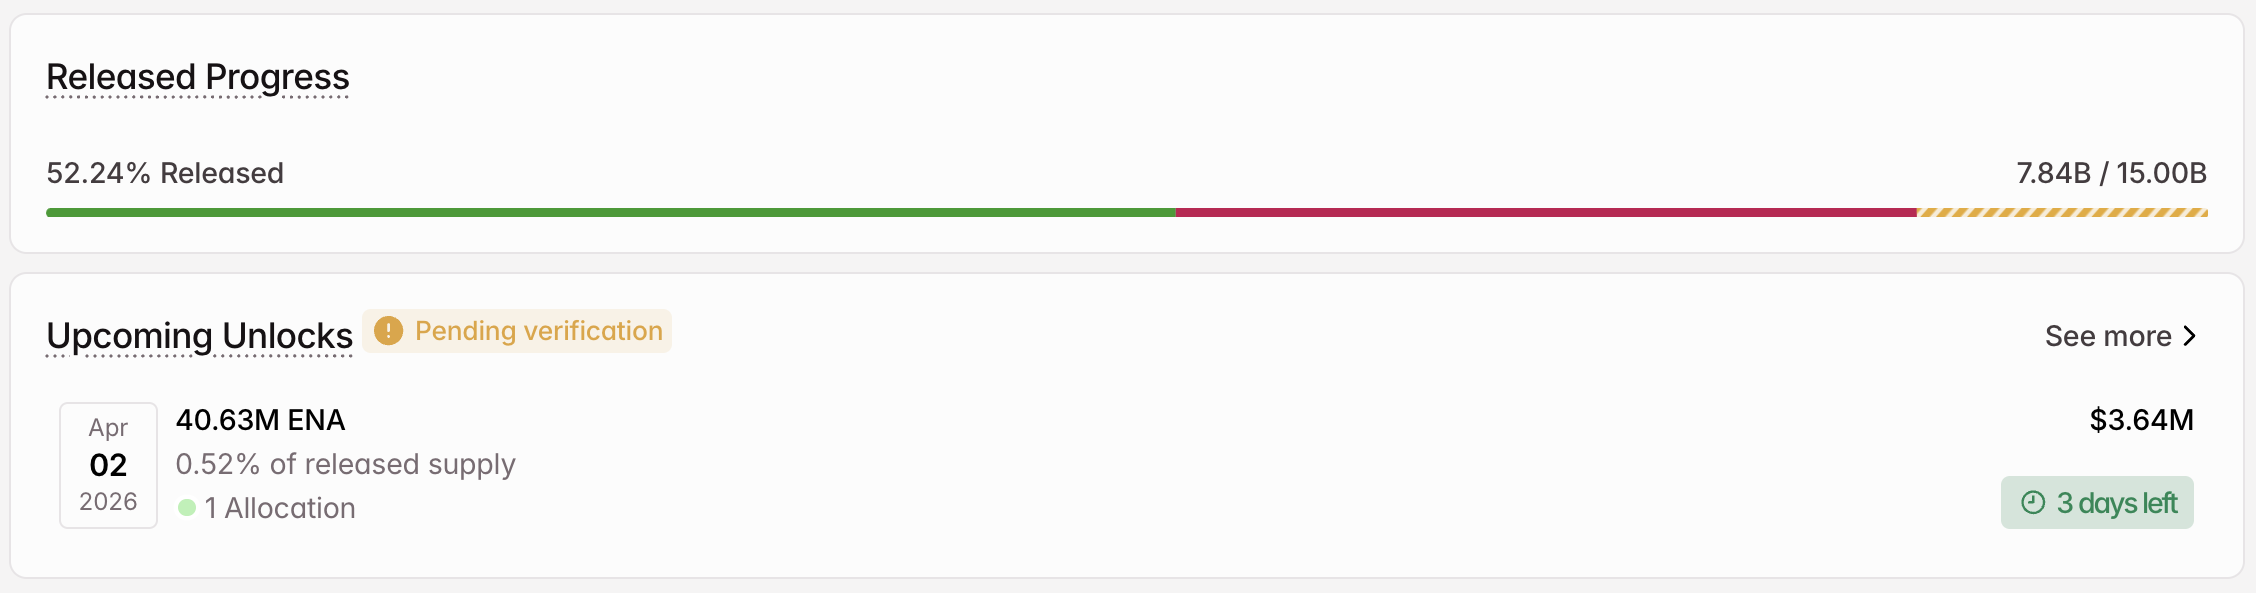
Ethena will award the entire unlocked supply to the Foundation. In addition to these three, Gunz (GUN), EigenCloud (EIGEN), and Opinion (OPN) will also experience new supply entering the market in the first week of April.
The post 3 Token Unlocks to Watch in the First Week of April 2026 appeared first on BeInCrypto.
Crypto World
Nearly half of all circulating bitcoin is underwater as long-term holders sell at a loss


Nearly half of all bitcoin in circulation is now worth less than it was bought for, according to data from the Bitcoin Impact Index, which jumped sharply last week as stress returned across all segments of the market.
The index, which measures financial stress for bitcoin user cohorts based on onchain behavior, ETF and derivatives activity and liquidity flows, surged 13 points to 57.4 during the week ended March 28, its steepest climb since January, CEX.IO noted in a recent report.
That level, from a range of up to 100, lands it squarely in what’s seen as the “high impact” zone that historically signals the kinds of broad selloffs that led to double-digit price drops in 2018, 2022 and earlier this year.
Long-term holders, wallets that have held BTC for more than six months, were selling at a profit just a week ago, when the cryptocurrency was trading above $70,000. Now, over 4.6 million BTC from these wallets, or roughly 30% of their total holdings, are underwater, the report notes. Their realized losses last week were the worst since 2023.
“This kind of divergence between price action and on-chain conviction has historically been a warning sign,” the firm wrote. “For instance, similar moves occurred in mid-2018 and mid-2022 before price drops by over 25%.”
Short-term holders aren’t faring any better. The report found that 47% of the total bitcoin supply is currently held at a loss, levels not seen since the market’s most stressed stretch in February.
At the same time, capital flows that had supported the market earlier this month have pulled back. Daily stablecoin net flows, which had averaged inflows of $250 million, flipped to outflows of $292 million. ETFs and miners also moved from accumulation to selling, the firm wrote.
So far, one key support remains intact: Onchain data shows holders are not rushing to deposit BTC on exchanges en masse, a behavior often seen in full capitulations.
The US-Israeli war on Iran has rattled energy markets, with many countries taking measures to conserve fuel.
Amid this, a March 2026 study by Energy World Mag examined 75 countries across seven factors to determine which nations would struggle most during global energy disruptions.
The study scored each country on a 0-100 scale, with higher scores indicating greater risk if energy supplies are disrupted. The factors included fossil fuel dependency, energy self-sufficiency, reliance on fuel imports, and more.
Singapore Leads Energy Vulnerability Ranking
Singapore topped the list. The city-state earned the highest vulnerability score of 85.2. Nearly 98% of its energy comes from fossil fuels.
Moreover, Singapore imports 100% of its natural gas. Its energy imports exceed domestic production by 243%.
Turkmenistan placed second with a score of 80.7. The country derives 100% of its power from fossil fuels, with zero alternative capacity. Average incomes of roughly $9,000 also limit the population’s ability to absorb price spikes.
Follow us on X to get the latest news as it happens
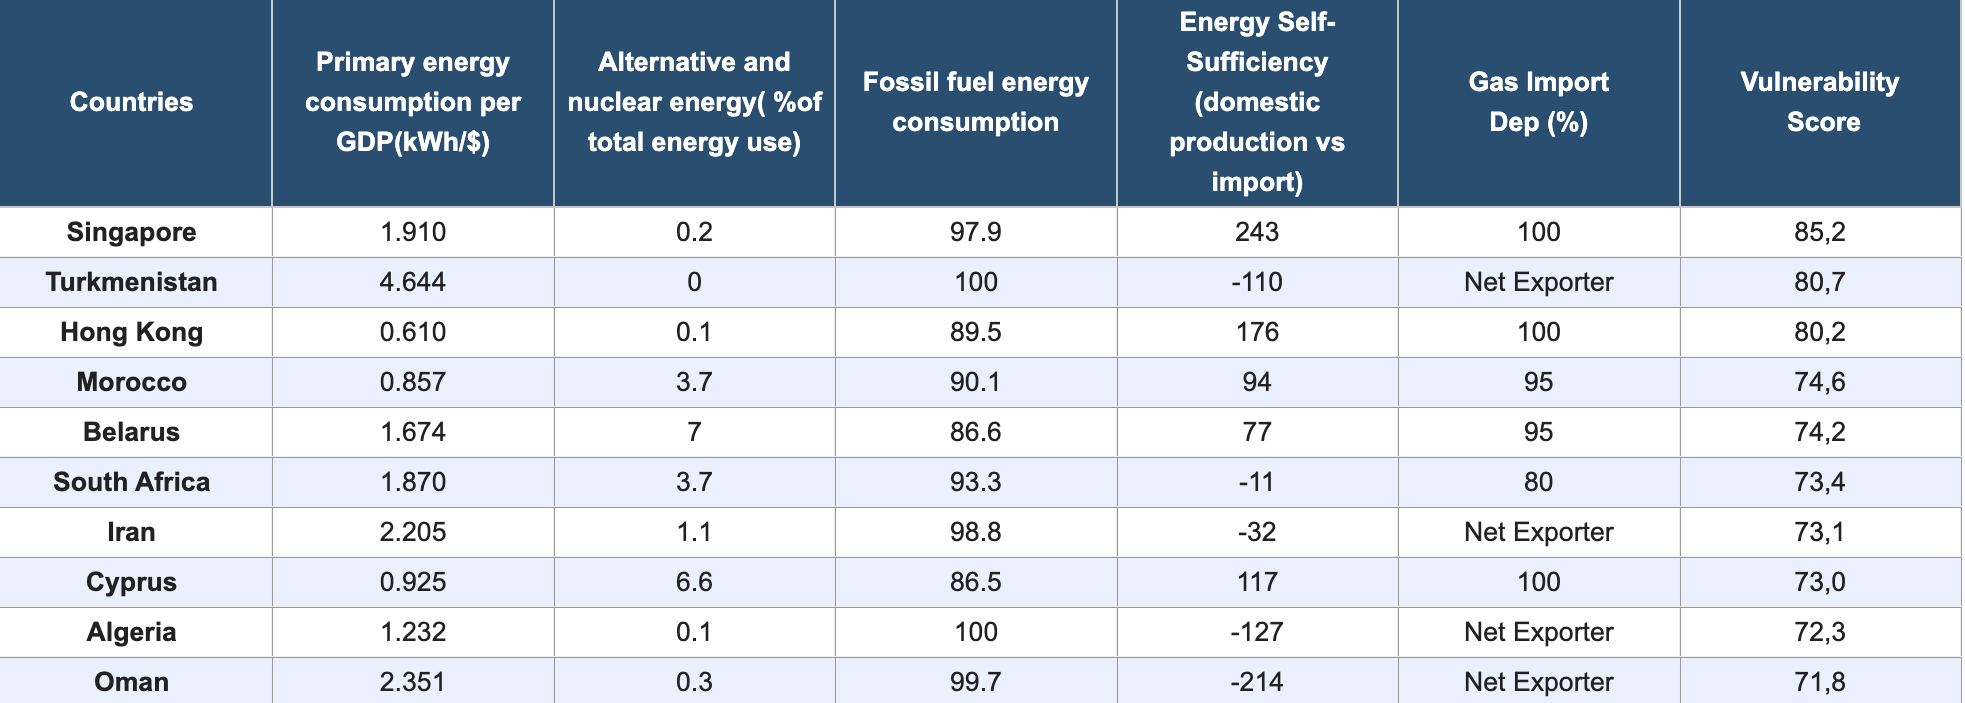
Hong Kong followed at 80.2. The city imports 176% more energy than it produces and relies on overseas sources for all of its natural gas.
Morocco (74.6) and Belarus (74.2) round out the top five, both importing the vast majority of their energy. At the same time, low average incomes ($4,000 and $8,000, respectively) leave their populations with limited capacity to handle price shocks.
An energy market analyst from World Energy Mag warned that even wealthy economies like Germany and Italy faced energy rationing during the 2022 crisis. Smaller import-dependent markets like Singapore and Hong Kong have even less capacity to cope with disruptions.
“Germany and Italy had to ration energy despite being among the world’s largest economies. The difference is that places like Singapore or Hong Kong have even less room to maneuver because they produce almost no domestic energy. When supplies get disrupted, they can’t just switch to local coal or increase their own gas production,” the analyst said.
Nonetheless, Singapore’s Minister for Manpower Tan See Leng noted that about half of the country’s gas arrives via piped natural gas, unaffected by the Middle East conflict. The government also maintains a fuel stockpile.
Still, with Brent crude exceeding $116 per barrel and supply disruptions expected to continue, concerns are rising. Whether current emergency reserves can absorb a prolonged disruption remains an open question for policymakers and markets alike.
Subscribe to our YouTube channel to watch leaders and journalists provide expert insights
The post Which Countries Would Suffer Most in a Global Energy Shutdown? This Study Has Answers appeared first on BeInCrypto.
Crypto World
Will XRP price drop to $1.12 as it remains capped under a descending trendline resistance?

XRP price fell 15% over the past two weeks as its price action remained below a descending trendline that has been acting as key dynamic resistance.
Summary
- XRP price has dropped over 15% in two weeks and remains capped below a long-term descending trendline acting as key resistance.
- Macro pressures, including geopolitical tensions and reduced rate-cut expectations, have weighed on sentiment, contributing to over 40% decline from yearly highs.
- Bearish indicators signal further downside risk toward $1.12 and potentially $1.00, while a breakout above $1.40 could trigger a short-term recovery.
According to data from crypto.news, XRP (XRP) price has fallen 15.6% from its monthly high of $1.60 reached on March 17 to $1.35 at press time. Zooming out the charts, the losses mount up to over 40% from its year-to-date high of $2.39.
XRP price fell amid geopolitical and macroeconomic concerns that have plagued the entire crypto market since the beginning of this year. These include U.S. tariff hikes on the EU and Canada and the subsequent war between the U.S. and Iran in the Middle East that has led crude oil prices to soar to multi-year highs, sparking concerns of rising inflation and driving investors away from risk assets.
Lower expectations of any interest rate cuts from the Federal Reserve have also dampened the mood for speculative assets.
Now, XRP price stands at risk of more downside, especially as the broader crypto market remains under pressure.
On the weekly chart, XRP price has respected a descending trendline that had been acting as a key dynamic resistance since mid July 2025. Every time the bulls managed to push XRP price towards the resistance level, it experienced a sharp drop as bears regained control of the market.
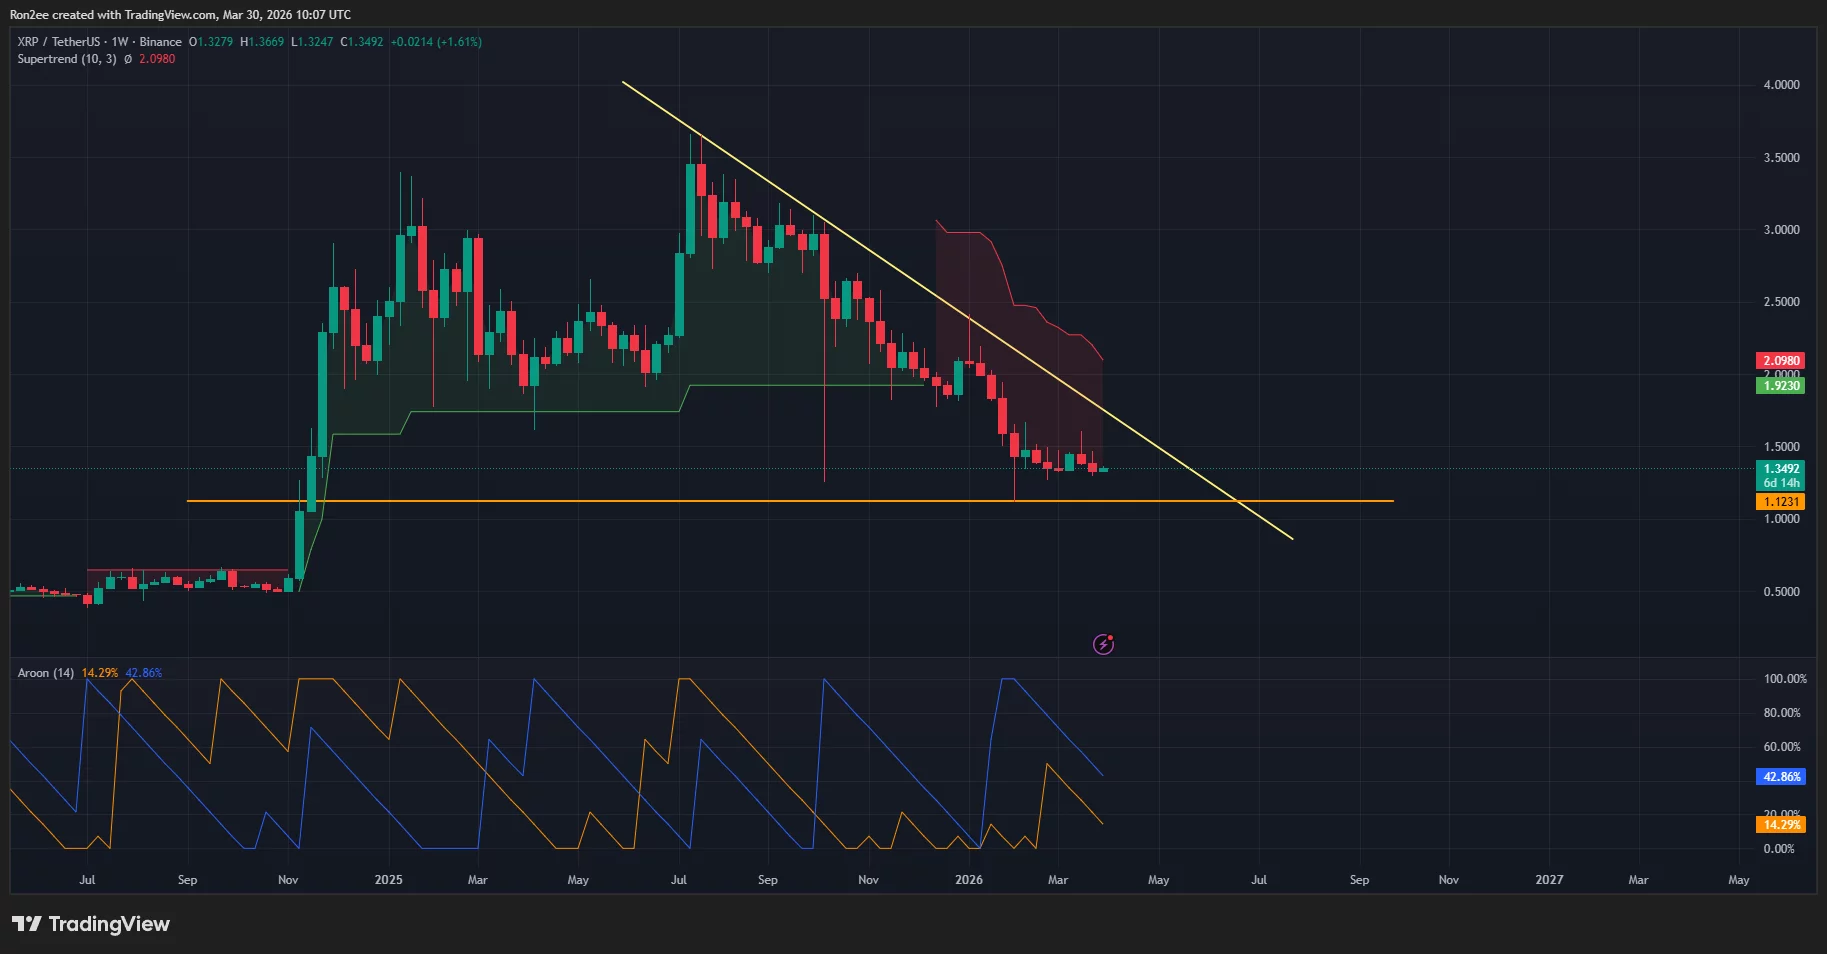
A look at technical indicators also seems to suggest a similar bearish outlook for its price. Notably, the Supertrend has flipped red while the Aroon Down at 42.86% remains far above the Aroon Up at 14.29%. Both indicators point toward a continuation of the current downward trend.
Hence, XRP price may visit the February 2 low of $1.12, a sharp drop below which could extend losses to the $1 mark. On the contrary, if XRP price manages a breakout above $1.40, it could pave the way for a recovery toward $1.50.
Disclosure: This article does not represent investment advice. The content and materials featured on this page are for educational purposes only.
Crypto World
Bitcoin price outlook as Bernstein signals potential bottom for crypto stocks this quarter
Bitcoin price has fallen over 30% from its yearly high, largely impacted by geopolitical and economic concerns that deteriorated investor appetite for risk assets.
Summary
- Bitcoin price has dropped over 30% from its yearly high amid geopolitical tensions and persistent macroeconomic pressure weighing on risk assets.
- Bernstein analysts expect market weakness to persist until Q1 earnings, with crypto-linked stocks down sharply but potentially nearing a bottom.
- Bearish technical indicators point to further downside risk toward $60,000, while a move above $69,000 could signal a shift in momentum.
After rallying nearly 12% to a yearly high of $97,538 on Jan. 15, the bellwether crypto has fallen by nearly 31% to $67,525 at the time of writing. This came amid several geopolitical and macroeconomic concerns that have largely risen due to U.S. President Donald Trump’s tariff drama that has extended into the beginning of this year, followed by the start of a war in the Middle East against Iran that has led to repercussions in energy and financial markets across the globe.
The hawkish stance the Federal Reserve has maintained as a result has also not helped the situation.
According to analysts at Bernstein, the resulting volatility has left stocks tied to crypto markets, including exchanges, brokerages, and tokenization platforms such as Coinbase, Robinhood, and Figure, down nearly 60% from their recent highs. This represents a big discount considering that these businesses have continued to expand their operations despite the turbulence.
In their Monday note to clients, they predicted that the current market weakness will extend until the release of first-quarter earnings reports, at which point a market bottom could potentially form. Such a prediction suggests that Bitcoin could likely continue to see more downside at least until April ends.
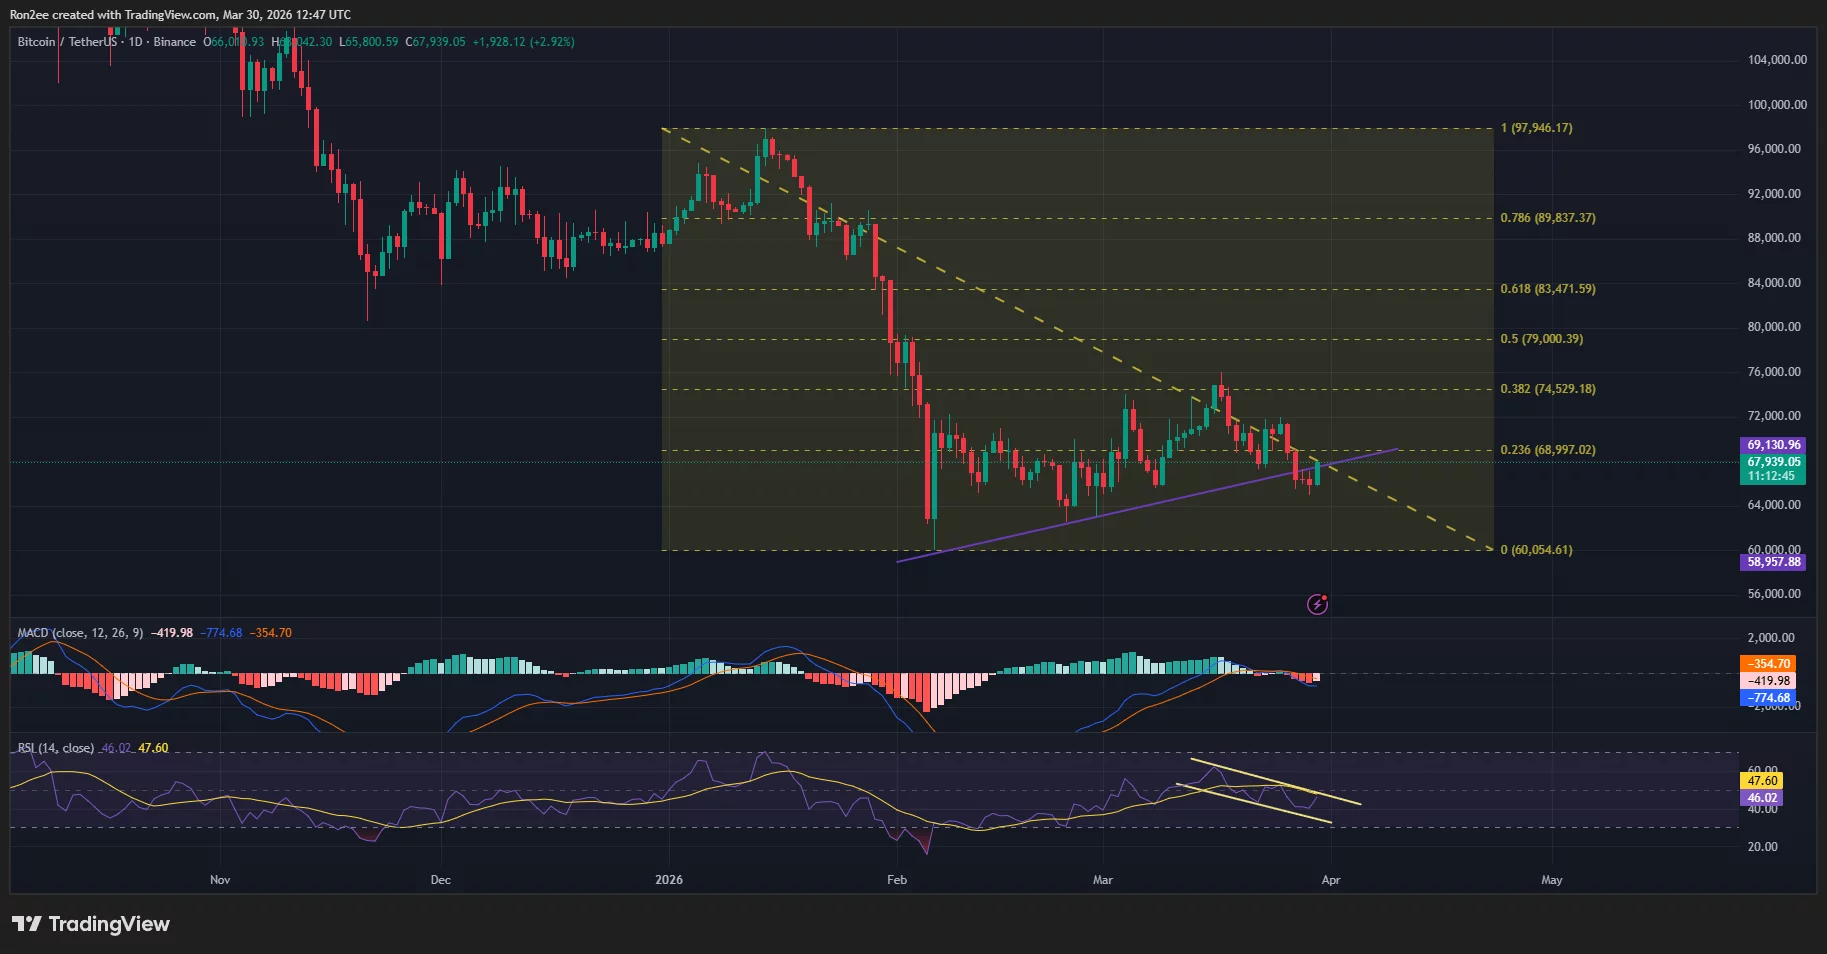
On the daily chart, Bitcoin (BTC) price has lost the support of a key descending trendline where bulls have often previously found footing.

Technical indicators such as the MACD and RSI show that bears still have the advantage in the current setup. The MACD lines have formed a bearish crossover and were trending downwards while the RSI line was moving within a descending channel, both signs that selling pressure remains dominant.
For now, $65,000 could serve as the key psychological support which bulls would seek to defend. If Bitcoin falls sharply below this key level, bears could aim to drag it all the way down to its yearly low around $60,000 once again.
On the contrary, if BTC price rebounds above $69,000, which aligns with the 23.6% Fibonacci retracement level, it could signal a shift in momentum.
Bullish outlook on crypto-linked stocks despite downturn
While the recent report projected trimmed price targets for crypto-linked stocks, Bernstein analysts maintained “outperform” ratings for Coinbase, Robinhood, and Figure as they attributed the recent weakness to macro pressure and deteriorating market sentiment rather than fundamental business failures.
This means that following the expected weak quarter, they expect these companies to come out stronger in the long term, likely as Bitcoin retraces back to its former highs once all the drama from the ongoing U.S.-Iran war settles down.
Disclosure: This article does not represent investment advice. The content and materials featured on this page are for educational purposes only.
Stripe’s billion-dollar stablecoin subsidiary Bridge Ventures Inc. has apparently been listed on documents as having sold 12 Mitsubishi trucks to a company in Venezuela with ties to the family of former president Hugo Chávez.
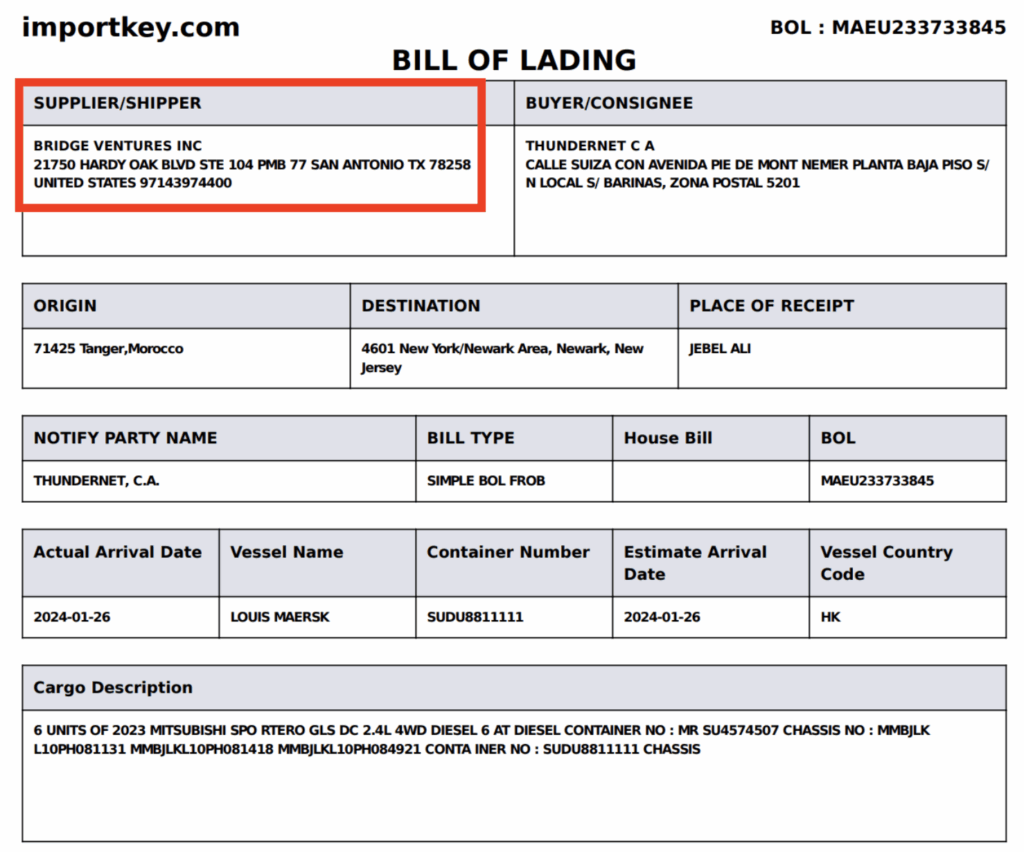
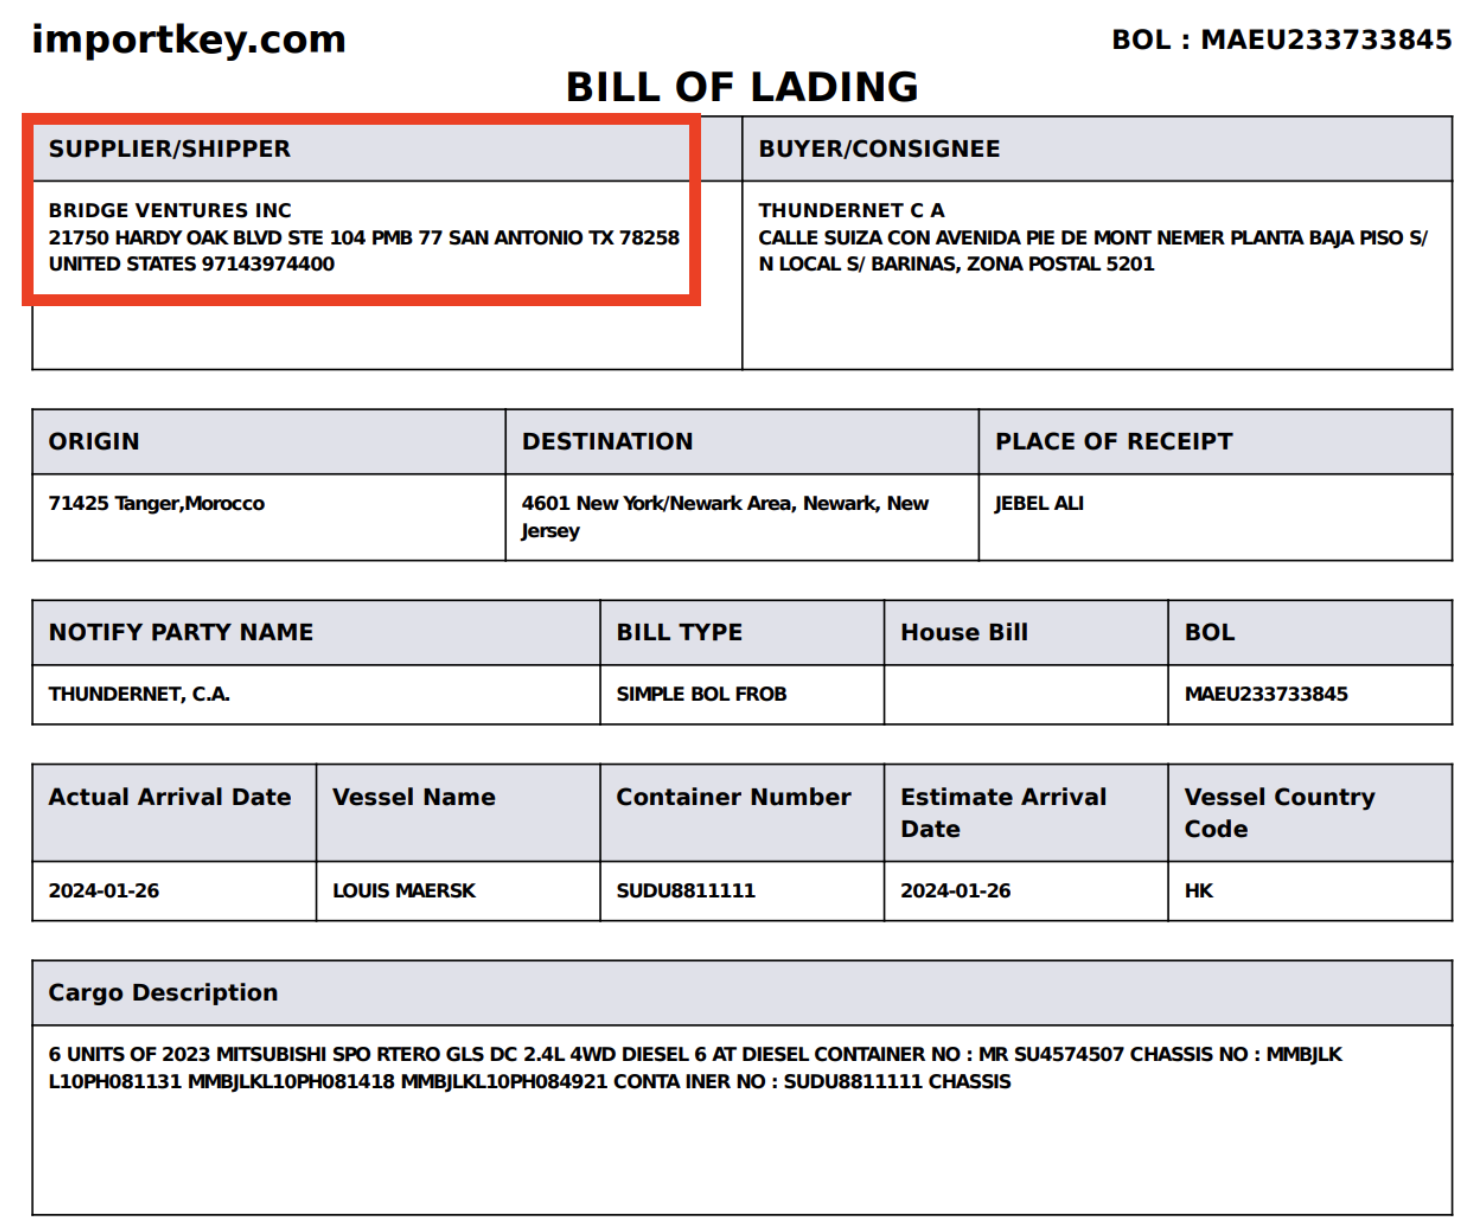
The stablecoin company, which Stripe acquired for $1.1 billion, appears, along with its exact street address, suite number, city, state, and zip code, on a shipment slip that sent trucks through a New Jersey port to a company in Venezuela.
At the time of the shipment, Venezuela was under broad US sanctions that covered many companies connected to the Chávez regime’s state-owned oil company PdVSA, and entities acting on its behalf.
Bridge categorically denies any involvement with the shipment. “Whatever this is about, it has nothing to do with us: Bridge had no involvement in this shipment or any associated payment activity,” a spokesperson told reporter Jason Mikula.
“The only explanation we can think of is some clerical error or confusion around a common name like Bridge.”
However, the platform’s character-by-character name isn’t particularly common, while the address on both bills of lading match US Patent and Trademark Office filings and third-party business registries like Bloomberg.
Mikula tweeted and published an article about his skepticism that a third party used Bridge’s name without its authorization.
Thundernet, a Hugo Chávez family connection
The buyer on both truck shipments from “Bridge Ventures Inc.” was Thundernet, C.A., an internet provider based in Barinas, Venezuela.
Thundernet belongs to Grupo Nemer, a conglomerate of dozens of companies across Venezuela, Panama, and the US with close ties to Chávez’s regime.
For example, Hugo Chávez’s youngest brother, Adelis, previously owned the Barinas-based Zamora Futbol Club. The club is now run by Omar Jose Nemer Irched, the eldest son of Grupo Nemer head, Syrian-born Atef Salami Nemer Hirchedd.
That soccer club’s sponsor switched from PdVSA to Thundernet.
In addition, investigative outlet Armando.info reported in 2021 that Nemer Hirchedd maintained a close relationship with another Chávez sibling, Adan Chávez Frías.
Adan served as governor of Barinas and Venezuela’s ambassador to Cuba, a relationship that allegedly helped Grupo Nemer take over operations of a bankrupt state agriculture company.
An exact name match and a denial from Bridge
According to Mikula, the shipping documents compound an already dubious compliance record.
In January 2026, he revealed Stripe’s connection via the Bridge stablecoin platform to Venezuelan crypto exchange Kontigo, rumored to have links to ousted President Nicolas Maduro’s son.
Maduro served as president of Venezuela since 2013, succeeding Chávez.
Moreover, as recently as November 2025, Bridge and Stripe executives were praising Venezuela as a stablecoin showcase.
Bridge subsequently reclassified Venezuela from “controlled” to “prohibited” in its sanctions compliance document.
The timing aligned neatly with the Kontigo fallout and Bridge’s pursuit of a national trust bank charter from the US Office of the Comptroller of the Currency, which conditionally approved its application, after Bridge’s downward revision of Venezuela, in February 2026.
Read more: Venezuela had crypto for buying jet fuel, now its president has lost his plane
The entities on the bills of lading don’t appear on OFAC’s Specially Designated Nationals list. However, Venezuela’s broad program-level sanctions arguably cover persons acting on behalf of the government.
Grupo Nemer’s opaque, multi-jurisdictional corporate structure makes verifying beneficial ownership extraordinarily difficult.
Both shipments originated from Jebel Ali port in Dubai, transited Morocco, and passed through Newark, New Jersey. The same Gmail address appeared for both seller/shipper and buyer/consignee on the documents.
Got a tip? Send us an email securely via Protos Leaks. For more informed news, follow us on X, Bluesky, and Google News, or subscribe to our YouTube channel.
Crypto World
Lido DAO proposes $20 million LDO buyback as token trades at 70% discount to two-year median


Lido DAO proposed spending up to 10,000 stETH to buy its own governance token at what it calls a historically depressed valuation. That works out to roughly $20 million at current ether prices near $2,000.
The problem is where to spend it.
Onchain LDO liquidity sits at about $90,000 of depth at plus-or-minus 2%, according to the proposal posted by the Lido Ecosystem Operations team over the weekend. The market depth measure means a transaction of that value could move the token’s price by as much as 2%.
A single 1,000 stETH batch executed onchain would blow through available liquidity multiple times over, meaning Ethereum’s largest liquid staking protocol has to go offchain to buy its own token at scale.
The proposal authorizes the Lido Growth Committee to route trades through centralized exchanges including Binance, OKX, Bybit, Gate and Bitget, each of which currently offers more than $100,000 in depth. It also permits the committee to engage market-maker partners on behalf of the Lido Ecosystem Foundation to facilitate execution.
Valuing governance
LDO hit an all-time low of $0.27 on March 7 and currently trades near $0.30, according to CoinGecko data, with a market capitalization of roughly $258 million.
The token is down more than 95% from its 2021 peak of $7.30. At current prices, the proposed buyback could use up roughly 65 million tokens, or about 8% of the circulating supply.
The DAO’s case rests on a gap between token performance and protocol fundamentals. The LDO-to-ETH ratio sits at approximately 0.00016, a 70% discount to levels that held for most of the past two years.
Net protocol rewards, in contrast, have dropped only about 20% over the same period, while costs improved 13% year-over-year and the protocol’s effective take rate rose to 6.11% from 5%. Lido still holds the largest share of staked ether at around 23%, per DefiLlama.
“This is not a routine fluctuation,” the proposal states. “It represents one of the most significant dislocations between LDO’s market price and its underlying protocol fundamentals in the token’s history.”
Execution would proceed in 1,000 stETH batches, each requiring a separate Easy Track motion — a governance mechanism for routine or approved operations — with a three-day objection period. The Growth Committee retains discretion over timing and pace to avoid signaling exact moves to the market, a necessary precaution given that the proposal is public. Slippage is capped at 3% below the reference price.
The deeper question the proposal surfaces is one facing DeFi governance tokens broadly. LDO’s 95% drawdown from peak is extreme, but it is not an outlier in the category. A protocol that dominates its sector, generates consistent fees, and holds billions in TVL is trading at a $258 million market cap because the market has broadly repriced what a governance token is worth when it controls a fee switch but distributes nothing.
Lido’s answer is to treat the dislocation as a buying opportunity. Whether that works depends on whether the market ever decides governance tokens deserve to trade on fundamentals at all.


Opinion by: Ashna Vaghela, chief customer officer at Mercuryo, and Vi Powils, CEO at World of Women.
For decades, the financial industry has treated creativity as a high-risk hobby. If you’re a woman building a global brand from a laptop, there is a risk that your bank doesn’t see a CEO. Rather, it sees someone with a non-standard income stream, without collateral, who might have to stop or pause working, to have children. Our global economy champions the middleman while the actual source of value can be treated as an afterthought.
For many women, particularly in emerging markets, creating online is not supplemental income; it is primary income and often the most borderless economic opportunity available to them.
That barrier runs deeper in emerging markets. A creator in Lagos can build a following of millions, only to find that the banking systems turn cross-border payments into a months-long exercise in fees and delays. When you control the flow of capital, you control who gets to stay in business. Women have spent years asking for a seat at the table where the legs were already broken.
The intersection of the creator economy and crypto payment infrastructure offers the first genuine path to financial freedom that doesn’t require anyone’s permission. As we move toward a world where code does the work that banks used to gatekeep, and that shift matters more for women than almost anyone else.
The invisible tax on identity
Legacy finance has failed women and creators in tandem. Venture capital still directs a tiny fraction of its capital to female founders with only 2.3% of venture capital funding having gone to female-founded companies in 2024. Credit scoring still penalizes uneven income, which is the reality for most independent artists. These systems were designed for a 9-to-5 world that is no longer the default way of being.
Layered on top of that is the platform toll. Some take up to 50 percent of earnings before a single cent reaches a creator’s wallet. You’re renting your audience from a landlord who can evict you whenever the terms do not suit them.
Programmable revenue and the end of Net-90
In the old world, a creator sells their work and can wait months to get paid. Smart contracts change this entirely. Revenue splits happen at the point of sale. If an artist collaborates with a developer, the payment doesn’t pool in a corporate account, it moves directly to their respective wallets the moment a transaction clears.
Related: Blockchain restores women’s power in AI
The code becomes the escrow. There’s no chasing invoices, no waiting on platforms to release what you’ve already earned. Hardcoded royalties mean creators benefit from the long-term value of their work regardless of where it’s resold.
While an imperfect system, the structure of onchain royalties is intended to help artists capture value over time, rather than relying solely on single transactions. OpenSea made royalty enforcement optional, which most marketplaces have now followed. This is what we mean by participatory capitalism: a model where the growth of the whole, lifts the people who actually built it. For many artists, especially women building global audiences, this shift is more than technical, it enables consistent revenue without depending on a platform’s schedule or policies.
Infrastructure as the foundation of family
Infrastructure sounds dry until you realise it’s the difference between asking for permission and having power. Community is a multiplier, but infrastructure is the engine. For the millions of women entering the creator economy, crypto rails offer a global passport that doesn’t check for borders or bias.
The community talks a lot about community in Web3, but what is really being described is something closer to family. A community is a group you associate with. A family shows up when things get hard. Stablecoins have become that bridge for creators in regions with volatile currencies, letting them hold the value of their work without needing a bank’s approval.
When you lower friction at both ends of a transaction, the creativity in the middle takes off. There is already seeing a generation of entrepreneurs who don’t need an invitation to the boardroom because they own the system it sits on. Reliable payment rails make the difference between being able to monetize globally and being restricted to local, slow, or costly banking systems, a gap that disproportionately affects women creators in emerging markets.
Moving toward ownership
Inclusion is not a gift. Ownership is holding the deed, not being handed a seat. The shift to Web3 payment infrastructure moves us toward that deed. This moment is about refusing to let legacy systems set the value of creative communities. The infrastructure is ready. The only thing left is for the creators to lead.
Let us stop waiting for the system to change. Let us continue to the payment rails that replace it.
Opinion by: Ashna Vaghela, chief customer officer at Mercuryo, and Vi Powils, CEO of World of Women.
This opinion article presents the author’s expert view, and it may not reflect the views of Cointelegraph.com. This content has undergone editorial review to ensure clarity and relevance. Cointelegraph remains committed to transparent reporting and upholding the highest standards of journalism. Readers are encouraged to conduct their own research before taking any actions related to the company.


Dozens of Kash Patel-themed tokens appeared on memecoin launchpad Pump Fun this weekend, after Iranian hackers leaked his personal email along with a burner username that some believe has been used to comment on pornographic videos.
The Iranian government-linked collective published over 300 emails, personal photos, and a resume from Patel’s Gmail account on Friday.
Among the leaked details was an alias, “spiderkash,” that Patel used with a burner email. Researchers searched for exact matches for that handle across the internet and found a profile on XVideos, a pornography website.
Spiderkash created its porn account on January 5, 2020 to review and leave comments on adult videos.
While it’s not been confirmed that the account actually belongs to Patel, crypto promoters believed they had enough evidence with the exact character match.
No official statement has confirmed or denied the connection, and there’s little reason for Patel to clarify.
Nevertheless, screenshots spread across X within hours, racking up millions of views and the profile soon became restricted.
Read more: Research finds less than 0.002% of Pump.fun memecoins succeed
Dozens of Kash Patel porn memecoins, one outcome
Within hours of Patel’s email leak, dozens of promoters created memecoins bearing the Spiderkash username appeared on Pump Fun.
One token named after Patel’s actual leaked email address, [email protected], peaked within one minute of launch before crashing 87% five minutes later and never recovering.
The largest by market cap spiked to a $104,000 value within hours of launch. However, one hour after its peak, it had collapsed 70%.
Within 12 hours it was 87% off its peak and by Saturday night, peak-to-trough losses exceeded 90%.
A third Spiderkash-inspired memecoin called Mayhem reached $5,500 before falling 85% to just $818 within seconds. it never recovered.
One Pump Fun wallet deployed four Spiderkash tokens in the same hour. Each remained at Pump Fun’s starting market cap and, despite illiquid wicks to high prices, never attracted any meaningful trading.
Dozens were trading 90% below their momentary all-time highs.
Iranian hackers previously targeted Patel in December 2024, before his confirmation as FBI director, claiming that the breach was retaliation for the DOJ seizing several of its websites on March 19.
Got a tip? Send us an email securely via Protos Leaks. For more informed news, follow us on X, Bluesky, and Google News, or subscribe to our YouTube channel.

A platform making crypto integration simple

Israel’s plan to get steel for weapons via India thwarted

Jocelyn Peterman to join Team Einarson as lead


-
 NewsBeat5 days ago
Manchester United reach agreement with Casemiro over contract clause amid transfer speculation
-

 News Videos5 days ago
Parliament publishes latest register of MPs’ financial interests
-

 NewsBeat3 days ago
The Story hosts event on Durham’s historic registers
-

 Business4 days ago
Instagram, YouTube Found Responsible for Teen’s Mental Health Struggle in Historic Ruling
-
 NewsBeat5 days ago
Tesco is selling new Cadbury Dairy Milk bar and people can’t wait to try it
-

 Tech7 days ago
Samsung will soon let you control smart home devices from your car’s dashboard
-
 Entertainment2 days ago
Lana Del Rey Celebrates Her Husband’s 51st Birthday In New Post
-

 Fashion6 days ago
Does It Matter What You Wear When You’re Laid Off and Looking?
-

 Business6 days ago
More women enter wealth management, but few in advisory roles: study
-
 NewsBeat7 days ago
Colombian military plane with 110 soldiers onboard crashes following takeoff
-

 Politics7 days ago
How Media Platforms Balance Performance and Accessibility in Image Delivery
-

 NewsBeat6 days ago
Entrepreneurs Forum survey reveals optimism in North East
-
 NewsBeat6 days ago
NASA Artemis II Astronauts enter 14-Day quarantine as moon rocket reaches launchpad
-

 Business6 days ago
Late-paying firms face multimillion-pound fines under new crackdown
-
 Tech4 days ago
Intercom’s new post-trained Fin Apex 1.0 beats GPT-5.4 and Claude Sonnet 4.6 at customer service resolutions
-
 Crypto World6 days ago
BTC gives up $70,000 level as markets mull higher interest rates
-

 Sports5 days ago
Fantasy Baseball Week 1 Preview: Top sleeper hitters for both five- and 12-day period led by Munetaka Murakami
-

 Tech5 days ago
US FCC Prohibits Approval Of New Foreign-Made Consumer Routers
-

 Fashion6 days ago
Coffee Break: Korean Skincare Set
-

 Fashion6 days ago
Althea Mink: Patrice Taylor’s Atlanta Couture Brand Built on Legacy, Resilience, and Architectural Glamour
You must be logged in to post a comment Login