
Crypto World
Bitcoin price falls to $64,300 after $65K rejection, will support hold?

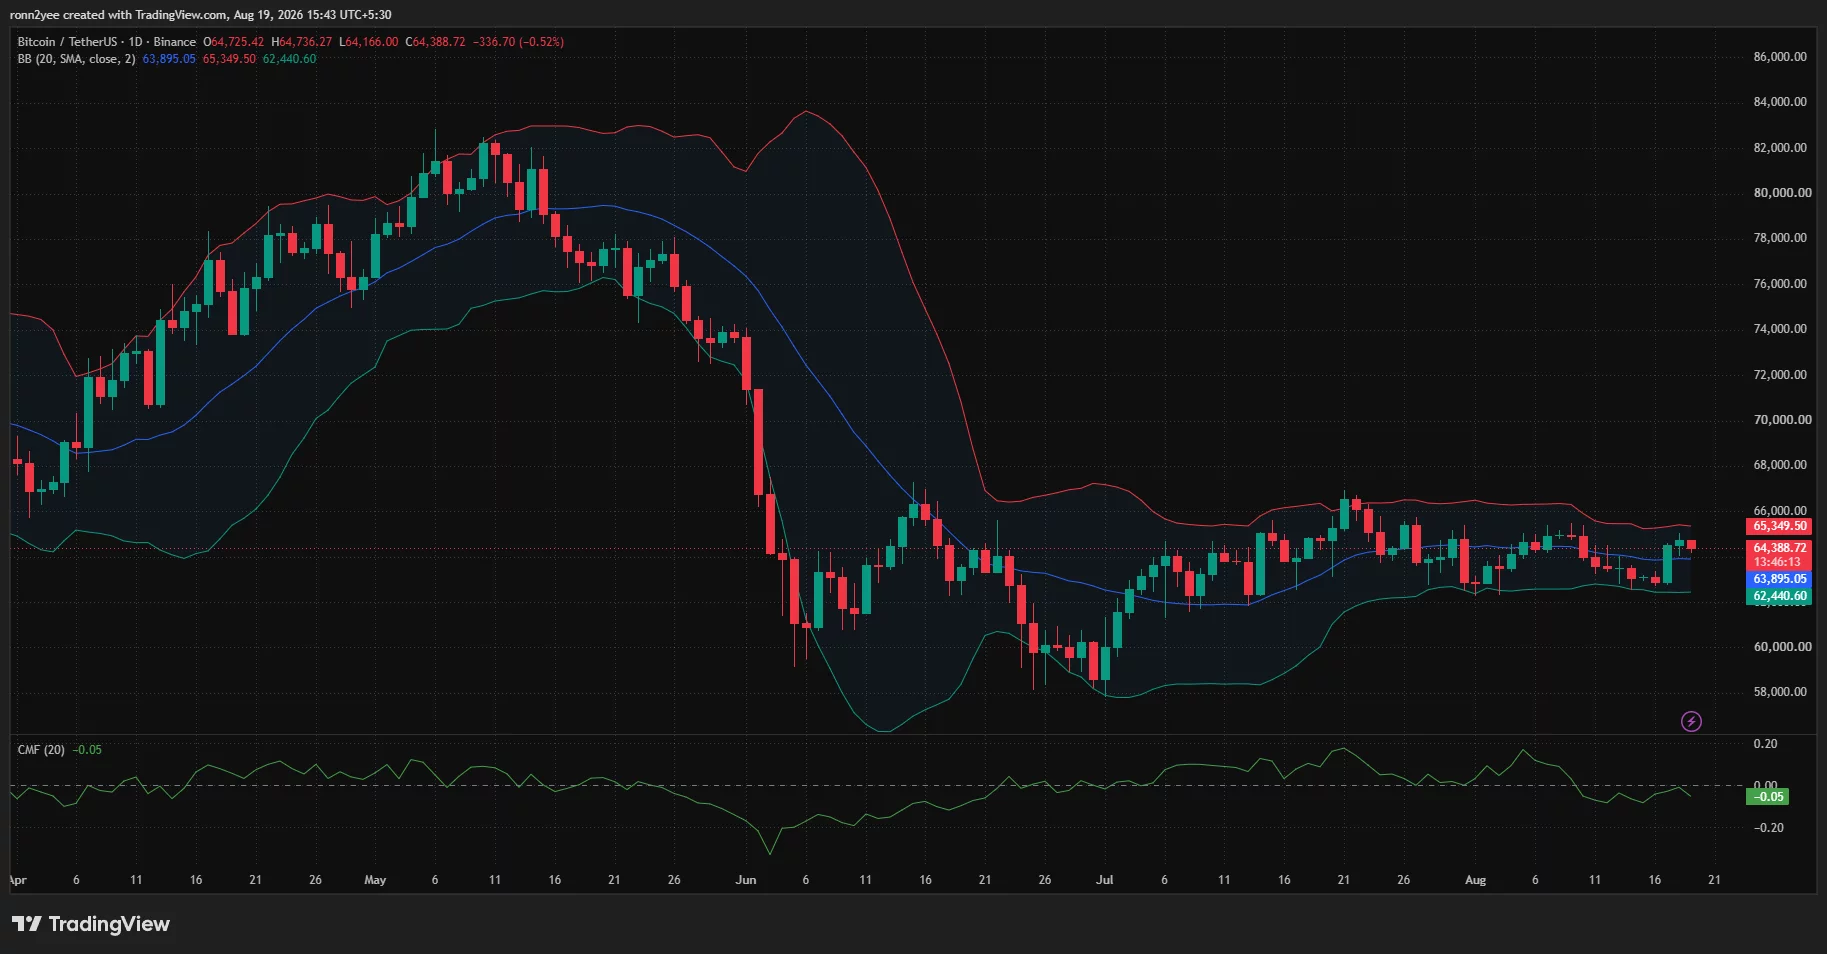
Bitcoin price pulled back to about $64,300 on Aug. 19 after failing to hold above $65,000, as weak spot demand, rising bond yields, and resistance near $65,400 limited the rebound.
Summary
- Bitcoin price retreated to $64,300 after briefly approaching $65,000 during the latest recovery.
- Bollinger Bands place resistance at $65,350 and near-term support around $63,900.
- CoinGlass data shows liquidation clusters near $65,400, $66,000, and $62,200.
- Traders are awaiting the Federal Reserve’s July meeting minutes for interest-rate signals.
Bitcoin price stalls below $65,000
According to data from crypto.news, Bitcoin (BTC) price was trading at about $64,390 on Binance on Wednesday afternoon in Asia, down roughly 0.5% on the daily candle. The price had reached an intraday high of $64,736 before sellers pushed it lower.
The retreat followed a rebound from the $62,700 area earlier in the week. Bitcoin moved through $64,000 and approached $65,000 on Aug. 18, but the rally did not attract enough buying pressure to clear the upper end of its recent range.
Trader Lennaert Snyder said Bitcoin had again been rejected from the high of its compression range. He identified $65,400 as the level keeping the asset inside the range and said a loss of the $64,000 previous-day low could send the price back toward the lower boundary.
Snyder said he was maintaining a short position opened near $65,000 but planned to move it to breakeven if possible. His downside scenario depends on Bitcoin losing $64,000, while another defense of the $62,500 range low would leave the market increasingly compressed.
Bitcoin has traded mostly between $62,500 and $65,400 since late July, aside from brief moves outside the range. Repeated reversals have reduced the value of entries near the middle, where neither buyers nor sellers have established control.
Low trading volume limits the Bitcoin rebound
Thin spot activity remains one of the main obstacles to a sustained breakout. Analyst Gerla said Binance spot volume had declined for years, even as Bitcoin continued to hold around $64,000.
Gerla interpreted the decline as possible seller exhaustion rather than an immediate bearish signal. However, lower volume also means that the recovery has received limited confirmation from buyers.
Binance data published earlier in August showed how activity has shifted toward leveraged products. Bitcoin futures volume on the exchange reached about $57.82 billion in one session, compared with $6.08 billion in spot volume.
The resulting futures-to-spot ratio reached 7.82, according to CryptoQuant data. Futures therefore accounted for almost eight times as much activity as spot trading, leaving short-term price moves more exposed to leveraged positioning and liquidation-driven volatility.
Institutional demand has also weakened. U.S. spot Bitcoin exchange-traded funds recorded about $385.2 million in net withdrawals during the week through Aug. 14. The outflows followed $853.5 million in inflows in the previous five trading sessions.
Lower ETF demand and weak exchange volume have reduced the buying pressure available near resistance. Both measures would need to improve for a breakout above $65,400 to receive stronger market confirmation.
Bitcoin charts identify $65,350 as resistance
The daily chart shows Bitcoin trading just above the middle Bollinger Band at $63,895. The upper band stands at $65,350, closely matching the resistance that stopped the latest recovery.
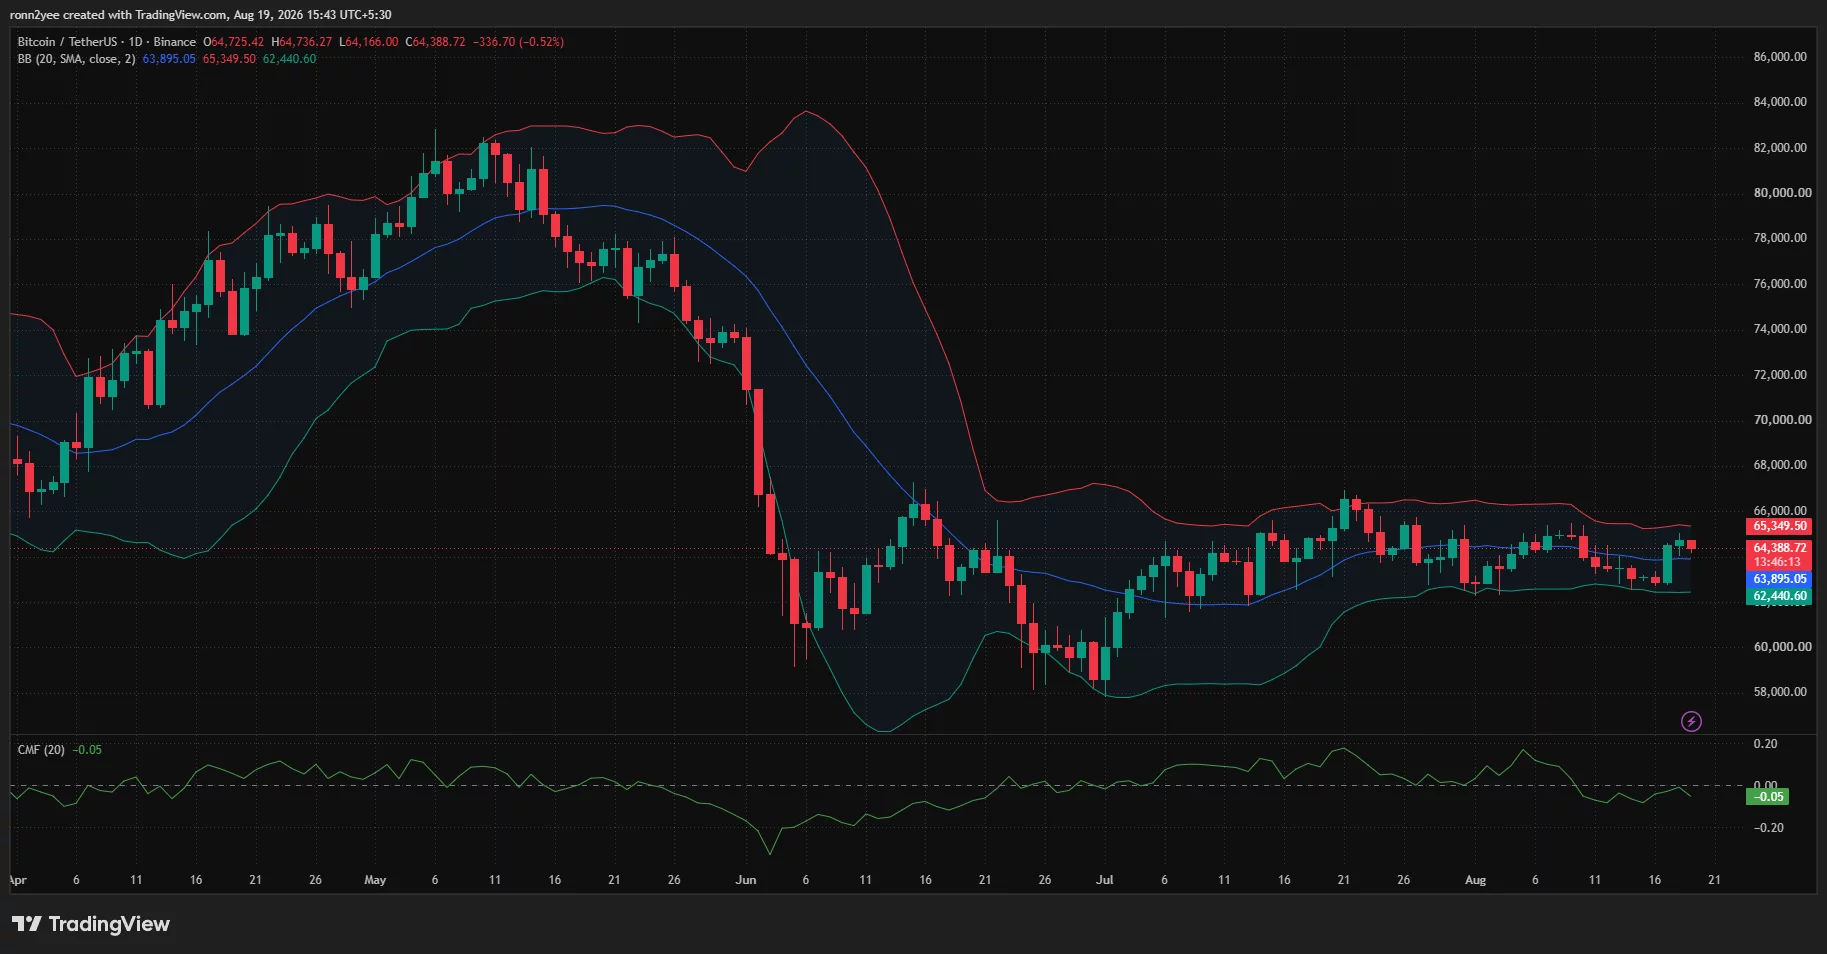
A daily close above $65,350 would place Bitcoin outside the upper edge of its recent volatility range. Such a move could open a path toward $66,000, followed by the late-July swing area near $67,000.
The lower Bollinger Band sits at $62,440, creating a broader support zone between $62,400 and $62,700. A daily close below that area would weaken the range structure and expose $61,000, followed by the June and July lows near $58,000.
Chaikin Money Flow was at minus 0.05 on the daily chart. The reading indicates that capital flows remain slightly negative and offers little evidence of sustained accumulation despite Bitcoin’s rebound.
The 4-hour chart presents a firmer short-term setup. Bitcoin remains above the Supertrend support at $63,466, while the Awesome Oscillator is positive at 951.
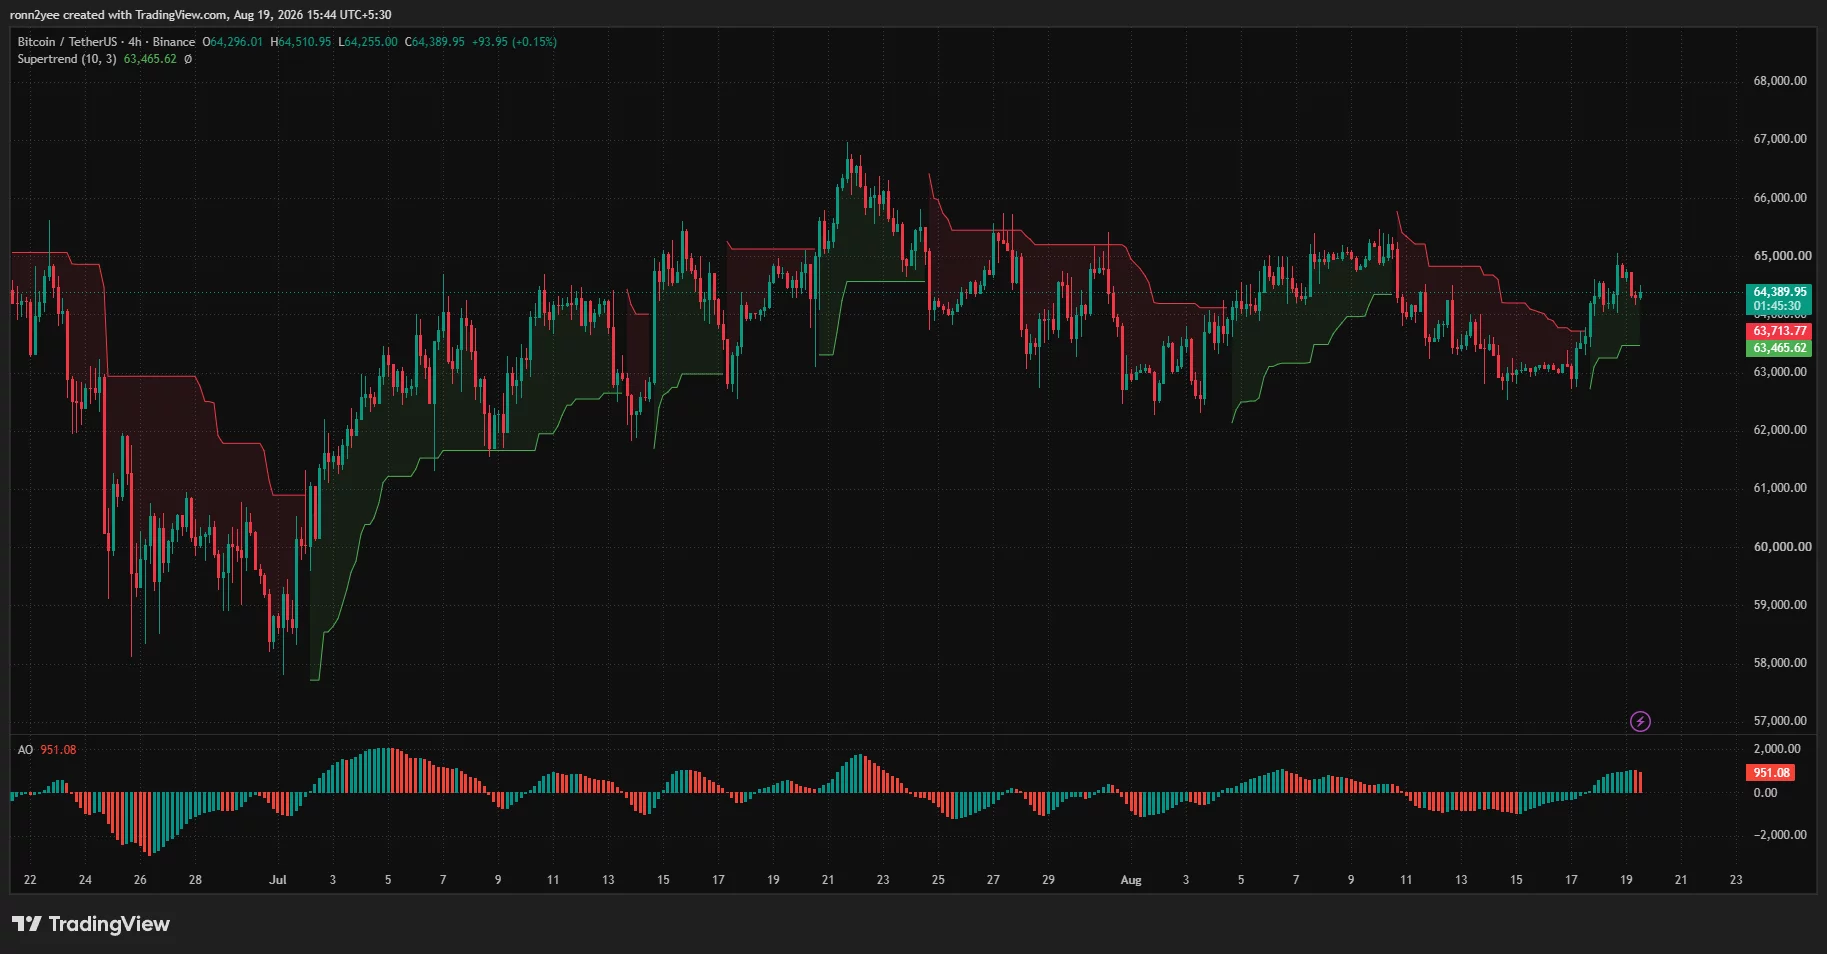
Recent red bars on the Awesome Oscillator show that bullish momentum is slowing after the advance from $62,700. Buyers would need to defend the $63,450–$64,000 region to preserve the short-term recovery.
Liquidation levels could determine the next move
CoinGlass’ one-week liquidation heatmap shows several concentrations of leveraged positions surrounding Bitcoin’s current price.
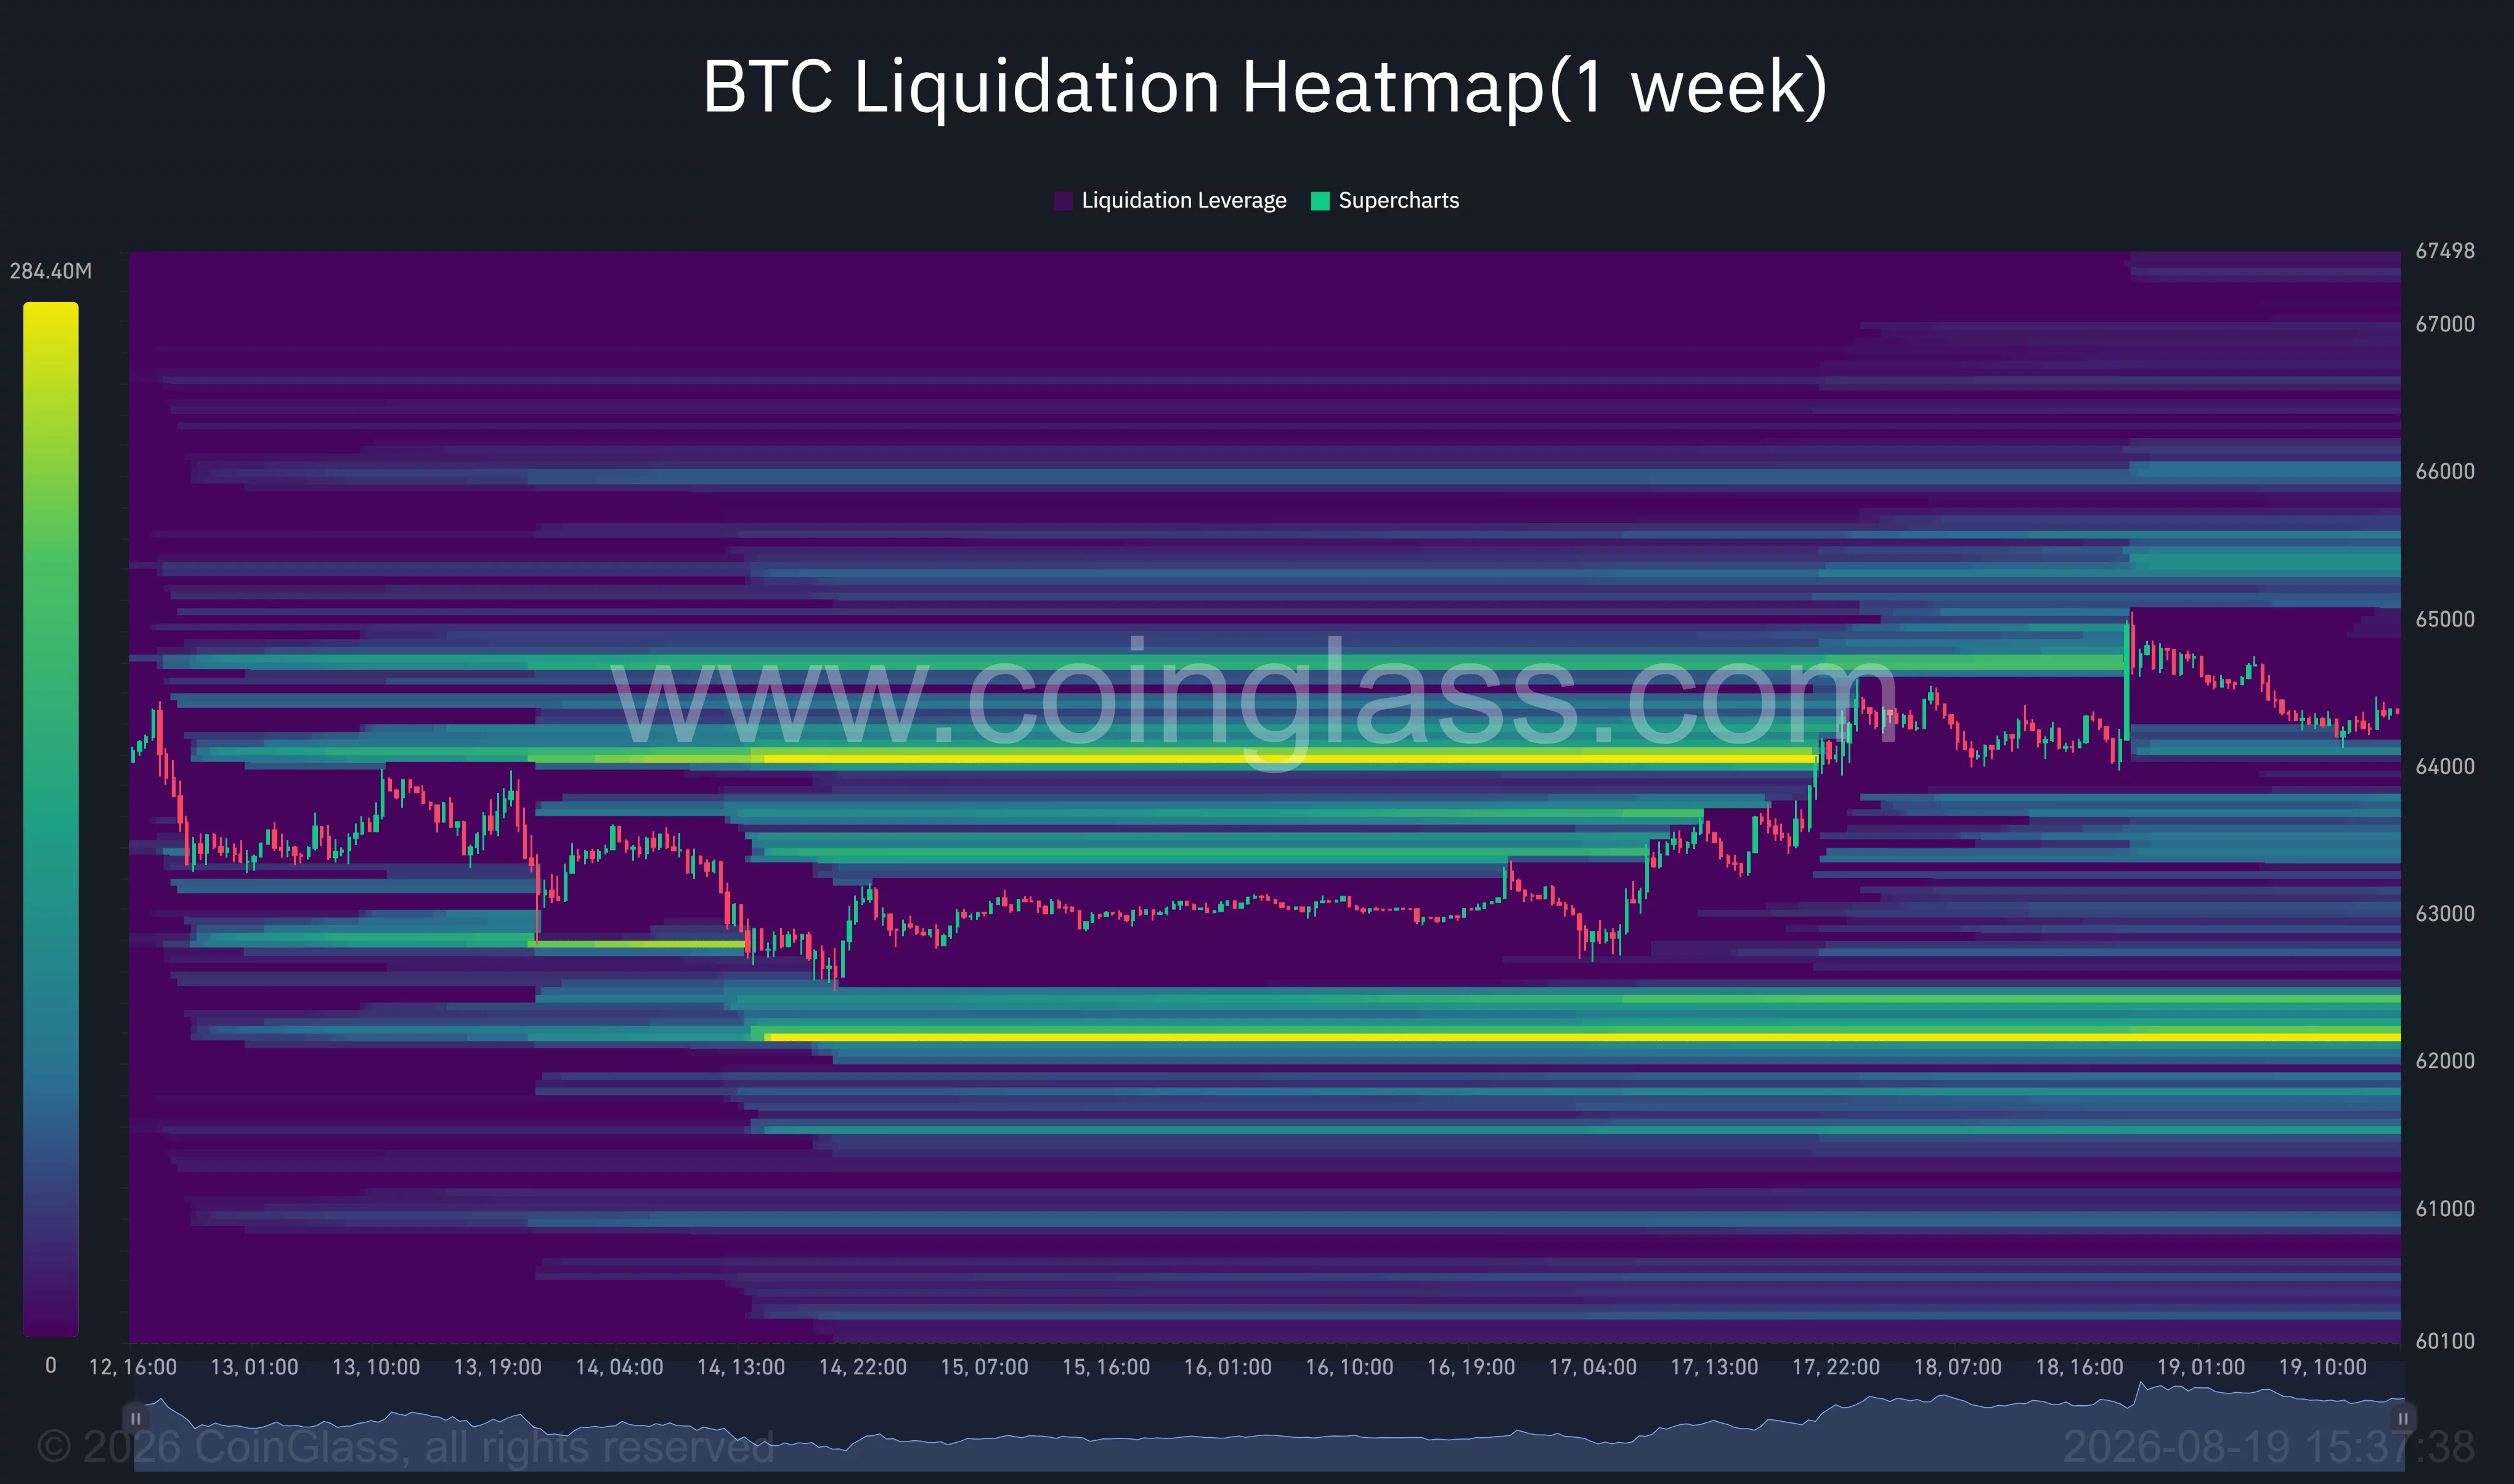
The closest overhead liquidity appears between approximately $65,300 and $65,600, with another cluster around $66,000. A move through $65,400 could trigger short liquidations and accelerate the price toward the second cluster.
The strongest nearby downside concentration sits around $62,200. Additional liquidity is visible between $63,400 and $64,000, making that region a possible target if Bitcoin loses its current 4-hour support.
Liquidation heatmaps identify areas where leveraged positions may be closed, but they do not determine which price level will be reached first. Bitcoin’s position between large clusters on both sides supports Snyder’s view that the market remains compressed.
Fed minutes remain the next US market catalyst
Bitcoin’s retreat also followed a broader pullback in U.S. risk assets. LSEG data cited by Barron’s placed BTC near $64,306 as rising global bond yields and Middle East tensions weighed on markets.
Treasury yields eased on Wednesday after the previous session’s global bond selloff, with the U.S. 10-year yield around 4.686%. Brent crude remained above $91 as renewed U.S.-Iran tensions maintained concerns about energy-driven inflation.
U.S. investors are now waiting for minutes from the Federal Reserve’s July meeting. The release could provide more information on how officials view inflation and the path of interest rates.
A softer policy signal, improving ETF flows, and a close above $65,400 would strengthen Bitcoin’s breakout case. Renewed pressure on bonds and a loss of $64,000 would instead shift attention toward $62,500 and the large liquidation cluster near $62,200.
Disclosure: This article does not represent investment advice. The content and materials featured on this page are for educational purposes only.

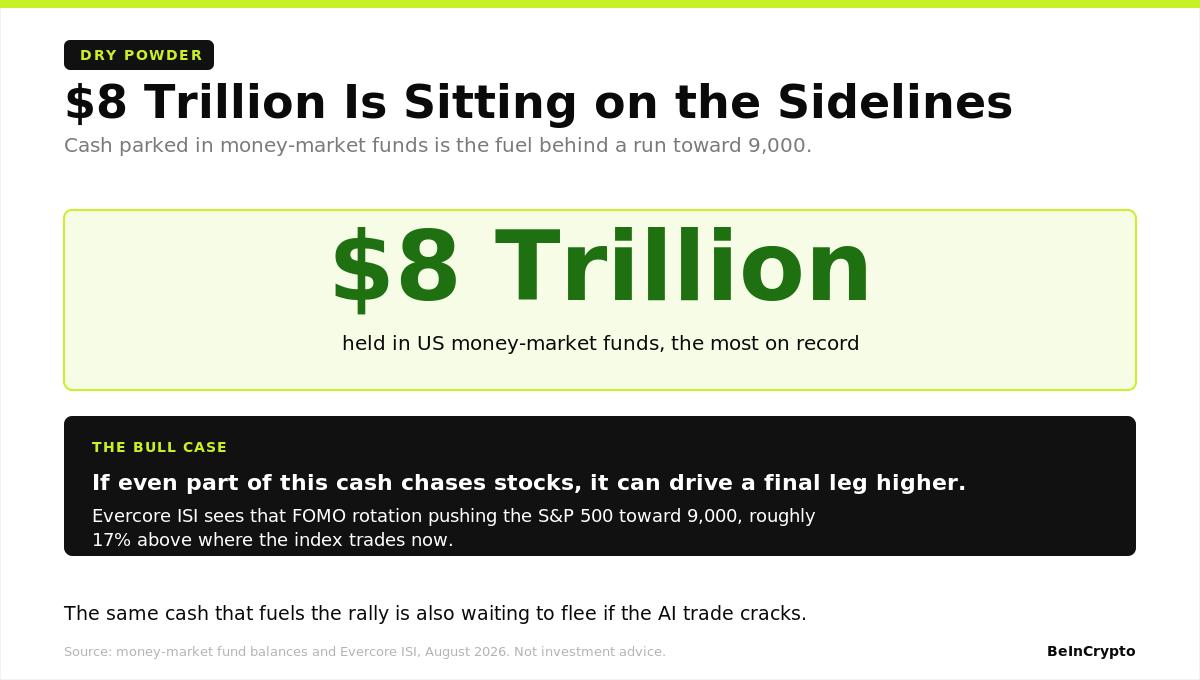
The boldest S&P 500 forecast on Wall Street sees 9,000 by year-end, roughly 17% above where the index trades now. The fuel is the AI boom and a wall of idle cash.
The warning is that the same AI trade turns into the market’s biggest risk in 2027.
Can the S&P 500 Really Hit 9,000 This Year?
One of the Street’s sharpest bulls thinks so. Evercore ISI’s Julian Emanuel puts 9,000 on the table as his upside case, about 15% above his base call, helped by $8 trillion parked in money-market funds. If that cash starts chasing stocks, it becomes the fuel for a final push higher.
The number sits far above the Street’s average year-end target near 7,555, so it is a stretch call, not the consensus. Its best hope is that idle $8 trillion, because if even part of it rotates into stocks, the run toward 9,000 gets real fuel.

The whole case still rests on one engine, and that engine is AI.
Why Is AI Driving the Forecast Higher?
That engine runs on a handful of names. The AI boom flows to the megacaps that build and sell it, the Magnificent 7, meaning Nvidia, Microsoft, Apple, Alphabet, Amazon, Meta, and Tesla. Their chips, cloud platforms, and models are the record AI earnings carrying the market.
Those same seven make up about 34% of the S&P 500, up from roughly 12% eight years ago.

So when AI lifts them, it lifts the whole index, and that concentration is the crack in the floor.
What Could Break the S&P 500 Forecast in 2027?
The crack shows up first in the spending. Combined hyperscaler capex has jumped from about $226 billion in 2024 to roughly $725 billion in 2026, and analysts see it topping $1 trillion in 2027. Revenue has not kept pace, and free cash flow has turned negative for the first time in decades.

That trillion-dollar mark is why 2027, and not 2028, is the year to watch. It is when the spending crosses a trillion dollars (for the first time), and the pressure to prove the revenue behind it runs highest.
The threat is not only cost, but it is also competition, because chips are the backbone of AI. Chinese chip demand is skyrocketing, with the country’s integrated-circuit revenue jumping 22% in 2025 to a record $245 billion and nearly doubling since 2020. That is a direct challenge to the US chipmakers that the rally leans on.
Still, the shift takes time. China holds only about 6% of the global semiconductor market against North America’s 53%, so it chips away at US dominance slowly rather than all at once.

Even so, European Central Bank economists have already warned the AI rally is setting up a correction.
Is This a Bubble?
That risk raises the obvious question. White House economic adviser Kevin Hassett says markets are not in an AI bubble, pointing to the real earnings behind the spending.
Investment firm GMO counters that this could be the largest capital investment bubble on record, with valuations stretched to levels rarely seen.
Both can be right in sequence. The buildout can carry stocks through 2026 and still overshoot, which is exactly what the chart is now testing.
What Are the Key S&P 500 Levels to Watch?
Right now, that test is playing out on the tape. Since June 9, the S&P 500 has climbed inside a rising channel, the steady uptrend the bull case needs, but the price slipped after a high around August 13 as the AI and chip names that carry the index cooled, with the semiconductor index down about 5% into mid-August.

The levels decide the next leg. A reclaim of 7,807 and then 7,881 puts 8,000 back in play, the biggest hurdle on the way up. Clear it and the chart’s own extension points toward 8,506, and a breakout above the channel opens the 9,011 zone that matches Wall Street’s 9,000 call.
Analyst’s View: This is where the two ends of the story meet. The same AI strength that could carry the S&P 500 to 9,000 in 2026 is the force that fades in 2027, so the rally and the warning share one root. The next few quarters settle which wins. Watch whether Nvidia’s guidance and hyperscaler capex hold, whether that $8 trillion in cash rotates into stocks, and whether Chinese chips keep eating US demand.
If spending stays high and demand scales, the bullish S&P 500 forecast holds. If the money sits still and capex slows first, 2027 is where the slowing signs emerge.
The post Why the S&P 500’s Path to 9,000 Runs Into Trouble in 2027 appeared first on BeInCrypto.

Centrifuge has expanded its tokenized-fund liquidity options by adding Symbiotic’s Liquid Lane to three of its offerings, enabling eligible holders to exchange fund positions for USDC. The upgrade is aimed at making redemptions more immediate for users, while the funds’ standard redemption process can occur separately.
The integration covers Janus Henderson’s JAAA, an AAA-rated collateralized loan obligation (CLO) strategy; Janus Henderson’s JTRSY, a short-duration US Treasury strategy; and New York Life Investment Management’s HYB, a US high-yield corporate bond strategy. Together, these funds represent about $1.6 billion in assets under management, according to the announcement.
Key takeaways
- Centrifuge added Symbiotic’s Liquid Lane to three tokenized funds to provide another path for eligible holders to receive USDC.
- Liquid Lane uses an onchain request-for-quote (RFQ) marketplace, allowing market makers to source liquidity from vaults to meet redemption demand.
- Investors can receive USDC immediately, while the underlying tokenized fund redemption can be processed separately through the issuer or via RFQ.
- Centrifuge already offered instant redemptions through partnerships such as Wintermute and other liquidity arrangements, and Liquid Lane focuses on the transaction capital structure.
- The project’s broader thesis is that aggregating redemption flow across issuers and asset classes could improve liquidity economics as tokenized assets see wider onchain use.
How Symbiotic’s Liquid Lane changes the redemption workflow
Symbiotic’s Liquid Lane is built around an onchain RFQ marketplace. When redemption requests are placed, market makers can access liquidity from Symbiotic vaults to fill those requests. After acquiring the fund tokens through the RFQ interaction, market makers may then redeem the tokens with the issuer or transfer/sell them via another RFQ transaction.
This design matters because it decouples the user’s immediate liquidity outcome from the slower mechanics of traditional redemption cycles. In the Centrifuge setup described, eligible investors are able to receive USDC right away while the funds’ normal redemption process proceeds on its own schedule.
Symbiotic did not position Liquid Lane as the only redemption route; instead, it’s presented as an additional liquidity pathway designed to increase participation and improve execution for tokenized-fund holders.
Why Centrifuge and these specific funds
Centrifuge is an asset tokenization and vault platform where asset managers issue and manage tokenized funds. The three products now integrated with Liquid Lane represent a meaningful slice of Centrifuge’s institutional coverage, spanning structured credit, short-duration Treasuries, and high-yield corporate exposure.
Janus Henderson has been a significant contributor to Centrifuge’s growth, particularly through its JAAA and JTRSY products—an expansion that earlier coverage tied to Centrifuge’s progress in attracting institutional demand, including milestones reported by Cointelegraph (see Centrifuge surpasses $1B TVL in institutional demand).
By December 2025, Token Terminal estimated Centrifuge had attracted around $1.3 billion in new inflows, driven primarily by Janus Henderson’s two funds. Token Terminal also reported that JAAA alone accounted for roughly $1 billion in total value locked and was among the largest tokenized funds in the market.
Liquid Lane alongside existing instant-liquidity routes
Liquid Lane is not the first liquidity solution connected to Centrifuge’s tokenized funds. Felix Lutsch, head of Symbiotic ecosystem, told Cointelegraph that the network is not attempting to replace earlier approaches, emphasizing instead that multiple liquidity routes can coexist.
According to Centrifuge’s own disclosures, a partnership with Wintermute announced in February 2025 supported 24/7 instant redemptions for JTRSY. Separately, HYB launched in June under a different arrangement targeting near-instant redemptions.
Lutsch said the differentiation of Liquid Lane is not primarily about speed, but about the capital structure used to execute redemption demand. In his description, Liquid Lane’s RFQ marketplace can involve multiple market makers and curators without requiring every market maker to pre-fund and carry inventory for specific assets.
That distinction connects to a broader market constraint Lutsch highlighted: while tokenized asset markets can offer settlement benefits, historical low trading volumes have reduced market makers’ incentives to commit capital. He argued that routing and aggregating redemption demand across issuers and asset classes could improve liquidity economics as tokenized funds increasingly function as collateral and financing assets in onchain markets.
From an investor perspective, the practical implication is that users may have more execution options as liquidity providers face less inventory burden and can scale their participation across assets—potentially reducing friction when demand for redemptions rises.
What to watch next
As Centrifuge extends Symbiotic’s Liquid Lane to more fund products and as tokenized-fund liquidity competes across multiple RFQ and instant-redemption mechanisms, investors should watch whether trading and redemption volumes grow enough to attract and sustain market-maker participation—since Liquid Lane’s thesis depends on improving flow-driven liquidity economics.

For centuries, lending has depended on one fundamental question: Can I trust the borrower to repay me?
Traditional financial institutions answer that question through credit scores, collateral requirements, employment records, legal contracts, identity verification, and centralized intermediaries. These systems can work, but they are expensive, slow, geographically limited, and often exclude people who lack conventional financial histories.
Decentralized finance (DeFi) introduces a different approach: trustless lending.
Instead of relying primarily on a bank or lending company to determine who can borrow, trustless lending uses blockchain infrastructure, smart contracts, collateral, transparent rules, and automated liquidation mechanisms. The goal is not to eliminate trust, but to replace dependence on trusted intermediaries with verifiable rules and economic incentives.
That shift creates a completely different economic model for lending.
What Does “Trustless” Lending Actually Mean?
The term trustless can be misleading.
A DeFi lending protocol still requires users to trust that the underlying smart contracts work as intended, the blockchain remains secure, and external data such as price feeds is accurate.
What changes is where trust is placed.
In traditional lending, participants may trust:
- Banks
- Credit bureaus
- Loan officers
- Legal enforcement
- Centralized databases
- Custodians
In a trustless lending system, much of that trust is moved toward:
- Smart contracts
- Cryptographic verification
- On-chain collateral
- Transparent protocol rules
- Decentralized networks
- Economic incentives
The important innovation is therefore not “zero trust.”
It is minimizing the amount of human discretion required to execute financial agreements.
The Basic Economics of DeFi Lending
A typical decentralized lending market connects two sides:
Lenders provide capital → borrowers provide collateral → smart contracts manage the loan.
Suppose a borrower deposits $150,000 worth of ETH into a lending protocol and borrows $75,000 in stablecoins.
The borrower has a 50% loan-to-value ratio.
If ETH falls substantially and the collateral ratio crosses the protocol’s liquidation threshold, the smart contract can automatically liquidate part or all of the collateral.
No loan officer is deciding whether to call the borrower.
There is no collections department.
There is no negotiation over whether the collateral should be sold.
The protocol follows predetermined rules.
This automation dramatically changes the cost structure of lending.
Collateral Replaces Much of the Traditional Credit Infrastructure
One of the biggest economic differences between traditional finance and DeFi is the role of collateral.
Traditional lending can be credit-based.
A bank may lend because it believes a borrower has sufficient income, assets, credit history, and repayment capacity.
DeFi lending is generally much more collateral-based.
The borrower demonstrates financial credibility by locking assets into a smart contract.
This creates an important trade-off.
The advantage
Collateral can make lending accessible without requiring:
- Credit scores
- Employment verification
- Banking relationships
- Geographic approval
- Extensive paperwork
The disadvantage
Borrowers often need to provide more assets than they receive.
This is known as overcollateralization.
If someone wants to borrow $10,000, they might need to deposit $15,000 or $20,000 worth of crypto.
That may seem inefficient, but economically it serves an important purpose: the collateral absorbs credit risk.
Why Overcollateralization Exists
Imagine a lending protocol that allows users to borrow $1 for every $1 of collateral.
If the collateral suddenly loses 30% of its value, the protocol could become undercollateralized.
That creates losses for lenders.
Overcollateralization provides a buffer.
For example:
$20,000 collateral → $10,000 loan
The protocol begins with a 200% collateralization ratio.
If the collateral falls by 30%, it is still worth approximately $14,000 against a $10,000 loan.
The system therefore has additional room to absorb volatility.
This is one reason DeFi lending is particularly suited to volatile digital assets—but also one reason why crypto lending has not completely replaced traditional unsecured credit.
Interest Rates Become a Market Signal
Another major economic feature of trustless lending is algorithmic or market-driven interest rates.
In traditional finance, banks typically determine lending and deposit rates based on monetary policy, funding costs, risk models, competition, and other factors.
In DeFi, interest rates can respond directly to supply and demand for liquidity.
When demand for borrowing rises:
More borrowers → greater demand for liquidity → borrowing rates tend to increase.
When liquidity becomes abundant:
More lenders → greater available capital → borrowing rates tend to decrease.
This creates a continuously adjusting market.
Interest rates therefore become more than simply a price for borrowing.
They become a real-time signal of capital demand within a specific on-chain market.
The Economics of Liquidity
Liquidity is the engine of lending.
Without available capital, borrowers cannot borrow.
Without attractive returns, lenders have little reason to supply capital.
This creates a feedback loop:
More lenders → deeper liquidity
→ better borrowing conditions → more borrowers → more interest paid → stronger incentives for lenders.
But the opposite can also happen.
Lower liquidity → higher borrowing costs → fewer borrowers → lower lender returns → declining liquidity.
This makes liquidity management one of the most important economic challenges for lending protocols.
A protocol isn’t successful simply because it has billions of dollars deposited.
It needs productive liquidity.
Capital that sits idle provides little economic value.
Capital Efficiency Is the Bigger Challenge
Traditional finance can offer unsecured and undercollateralized loans because institutions have access to extensive information about borrowers.
DeFi has historically struggled with this.
The blockchain can tell a protocol what assets a wallet owns.
It can track transactions.
It can verify collateral.
But determining whether a real-world individual will repay a loan is much harder.
This creates an important economic problem:
How can DeFi move from overcollateralized lending toward more capital-efficient credit?
Several approaches are emerging, including:
-
- On-chain credit scoring
- Reputation systems
- Decentralized identity
- Real-world asset collateral
- Institutional credit markets
- Under-collateralized lending
- Credit delegation
- Zero-knowledge identity and financial credentials
Liquidation Is an Economic Feature, Not Just a Safety Mechanism
Liquidations are one of the most important components of DeFi lending.
When collateral falls below a required threshold, the protocol needs a mechanism to protect lenders.
Liquidators step in by purchasing or taking control of collateral, often at a discount.
This creates an economic incentive:
Protocol needs risk protection → liquidators receive an opportunity → unhealthy loans are removed.
The system effectively creates a decentralized risk-management workforce.
However, liquidations also introduce risks.
During extreme market volatility, collateral prices can fall faster than positions can be liquidated. Blockchain congestion, oracle failures, and sudden liquidity shortages can make the process more difficult.
So while automation reduces dependence on human intervention, it does not eliminate market risk.
Oracles Become Part of the Trust Equation
Here’s the uncomfortable truth about trustless lending:
Smart contracts cannot know the real-world price of an asset by themselves.
They need oracles.
If ETH is trading at $3,000 but a lending protocol receives an incorrect price of $2,000, collateral calculations can become distorted.
A faulty price feed could potentially trigger unnecessary liquidations or allow borrowers to take excessive loans.
This means the economics of DeFi lending depend not only on smart contracts but also on reliable information infrastructure.
In many ways, oracles are the sensory system of decentralized finance.
The Cost Advantage of Automation
One of the strongest economic arguments for trustless lending is reduced operational overhead.
Traditional lending involves high costs:
- Loan processing
- Compliance
- Administration
- Credit analysis
- Custody
- Settlement
- Collections
- Legal enforcement
Smart contracts can automate many of these functions.
Once deployed, the same lending logic can potentially serve thousands or millions of users without requiring a proportional increase in administrative staff.
This creates the possibility of software-driven financial scale.
The marginal cost of executing another transaction can be dramatically lower than the cost of manually processing another traditional loan.
But Smart Contracts Introduce New Costs
Automation doesn’t mean lending becomes free.
The cost structure simply changes.
DeFi participants must account for:
- Smart-contract risk
- Oracle risk
- Blockchain transaction fees
- Governance risk
- Liquidity risk
- Market volatility
- Economic attacks
- Bridge or infrastructure risk
A bank might spend money maintaining compliance teams and branches.
A DeFi protocol may instead spend resources on audits, security infrastructure, oracle systems, bug bounties, governance, and monitoring.
The economic question is therefore not:
“Is DeFi cheaper?”
It is:
“Which costs are removed, and which new risks and costs replace them?”
Governance Has an Economic Value
Many lending protocols are governed by decentralized organizations or token holders.
Governance can influence parameters such as:
- Interest-rate models
- Collateral factors
- Supported assets
- Liquidation thresholds
- Risk parameters
- Treasury allocation
- Protocol upgrades
This creates another economic layer.
A lending protocol is not merely a collection of smart contracts.
It is also a risk-management institution encoded in software and governance mechanisms.
Poor governance can create enormous losses.
Good governance can improve capital efficiency while maintaining system stability.
That makes governance quality an economic asset.
The Network Effect of Lending Markets
Lending protocols can also benefit from powerful network effects.
More assets supported → more borrowing opportunities.
More borrowers → greater demand for liquidity.
More liquidity → better execution.
Better execution → more users.
More users → stronger incentives for developers and liquidity providers.
This can create a reinforcing cycle.
However, network effects can also create concentration risk.
If too much liquidity becomes dependent on one protocol, one blockchain, one stablecoin, or one oracle infrastructure provider, a failure could have consequences across the broader ecosystem.
Decentralization therefore needs to be evaluated at the system level, not simply by looking at the number of smart contracts involved.
Stablecoins Are Critical to Lending Economics
Stablecoins have become especially important to DeFi lending because they provide a relatively stable unit of account.
A borrower can deposit volatile crypto collateral while borrowing a stablecoin.
For example:
ETH collateral → stablecoin loan → stablecoin repayment
This lets users access liquidity without necessarily selling their underlying assets.
Stablecoins also allow lending markets to express interest rates in units that are easier to understand than volatile crypto-denominated returns.
As stablecoin adoption grows, their role in decentralized credit markets could become increasingly important.
Trustless Lending Could Expand Global Access to Credit
Perhaps the most significant long-term economic implication is accessibility.
A person does not necessarily need to live in a major financial center to interact with a blockchain-based lending market.
They may only need:
- An internet connection
- A compatible wallet
- Digital assets
- Access to the relevant blockchain
This does not solve every problem.
People without crypto assets may still struggle to access overcollateralized loans. Regulatory restrictions can also affect availability.
But the architecture creates an important possibility:
Financial infrastructure can become globally accessible rather than geographically dependent.
That is a profound economic shift.
The Future: From Trustless Lending to Programmable Credit
The next evolution of DeFi lending may not simply be about borrowing more money.
It could be about making credit programmable.
Imagine loans that automatically adjust according to:
- Collateral quality
- Market volatility
- Reputation
- Cash-flow data
- On-chain activity
- Real-world assets
- Risk scores
- Liquidity conditions
Instead of one-size-fits-all lending, decentralized credit markets could eventually offer dynamically priced financial products.
That would move DeFi closer to a financial operating system.
Final Thoughts
The economics of trustless lending are built around a simple but powerful idea:
Replace institutional trust with transparent rules, collateral, incentives, and cryptographic verification wherever possible.
This can reduce intermediaries, automate risk management, improve accessibility, and create global markets for capital.
But trustless lending is not riskless lending.
Smart-contract vulnerabilities, oracle failures, volatile collateral, liquidity shocks, governance mistakes, and market manipulation remain serious challenges.
The real breakthrough will come when decentralized lending becomes not only trust-minimized, but also capital-efficient, resilient, secure, and accessible.
If that happens, DeFi could evolve from an alternative financial experiment into a fundamental layer of the global credit economy.
The future of lending may not be about asking, “Who do I trust?”
It may increasingly be about asking:
“What rules can everyone verify?” 🔐
REQUEST AN ARTICLE
Crypto World
Beyond crypto funding rates: Ethena diversifies USDe backing with $1 billion FalconX facility


The warehouse facility gives Ethena another source of returns for the assets backing USDe while channeling onchain capital into overcollateralized institutional loans.


The American Bankers Association seeks to strengthen the Clarity Act, not kill it, argues Rob Nichols, president and CEO of the ABA.
A new batch of GTA VI leaks are being used by an X user to pump their crypto as part of a “secret project.”
The user, who goes by the name “CyberLeek,” shared GTA VI gameplay footage alongside the ticker for a crypto called $CYBERLEEK yesterday.
It included details about GTA VI’s map and footage of free-roam gameplay that, at the time of writing, are no longer viewable on X following a copyright strike from the game’s creator, Rockstar Games.
CyberLeek is raising funds for ‘secret project’
CyberLeek created their token to raise funds for a “secret project” that they claim cannot be revealed, as “showing the cards to the big corporations would only give them time to build their defenses.”
Read more: Bitcoin spikes after GTA VI trailer leak says ‘Buy $BTC’
They said, “Let it be absolutely clear: this is not a cash grab. Funding is directed toward the infrastructure needed to strike, as well as the security and protection required to withstand the inevitable corporate counterattacks.”
Their posts pushed the token’s market cap up almost 5,800% within an hour to $3.46 million. Its market cap is $1.5 million at the time of writing.
What are CyberLeek’s motives?
According to CyberLeek’s website, the leaks stem from their grievances with anti-consumer practices within the video game industry.
CyberLeek claims they will target any gaming company that sells digital pre-orders, locks single-player content behind a paywall, and doesn’t strive to preserve long-term offline access to single-player content.
For instance, they claim pre-orders “were created because physical discs had manufacturing limits. In digital distribution, there is no inventory. There is no stock shortage. A digital copy cannot sell out. Yet publishers kept the preorder system and stripped away its only consumer benefit.”
CyberLeek has threatened to leak more footage unless Rockstar Games meets their demands.
GTA VI’s no-disc descision has rocked the boat
GTA VI will be the first major game to release without a disc. Its digital pre-orders will be, like CyberLeek noted, in infinite supply while Rockstar’s “physical” release will take the form of a redeemable code packaged in a game box.
Read more: NFT game studio boss says not paying staff ‘works for company cash flow’
The announcement of GTA VI’s release plan, alongside Sony’s decision to no longer produce game discs, has led to lawsuits and uproar from gamers who advocate for physical media and game preservation.
Got a tip? Send us an email securely via Protos Leaks. For more informed news and investigations, follow us on X, Bluesky, and Google News, or subscribe to our YouTube channel.
Crypto World
Bitcoin Just Hit 8 of 12 Capitulation Signals; VanEck Thinks the Pain May Be Nearing Its End

Bitcoin posted a modest recovery on Wednesday, which helped it climb above $64,000. The cryptocurrency is still almost 50% down from its all-time high, but VanEck’s latest analysis revealed that 8 of 12 tracked signals in its “Bitcoin Capitulation Check” are now firing.
This suggests that the market may be nearing the end of its correction phase.
Shallower Trough
VanEck said that all 12 signals entered their capitulation zones at some point over the past three months, while BTC itself has spent the past month stabilizing after recovering from its June summer low and may have bottomed near $58,500 on June 30.
Meanwhile, US spot Bitcoin ETFs have recorded more than $950 million in net inflows so far in August, which points to some renewed institutional demand even as the crypto asset remains below its record high.
VanEck expects a shallower trough this cycle compared with previous Bitcoin downturns. Earlier bottoms saw drawdowns of 94%, 85%, 84%, and 78%. Those periods also came before the current spot ETF market and when institutional ownership was much smaller. More importantly, each of those cycles saw major failures across the market. This time, there has been no Celsius, Three Arrows Capital, or FTX collapse.
According to its findings, Bitcoin appears to have gone through price capitulation, and the market is nearing or currently in an accumulation phase.
That accumulation phase could gain further momentum if more capital begins moving back into crypto, which Bitfinex identifies as the major missing piece for Bitcoin’s next rally. In its latest Alpha report, the exchange said two of the three conditions for a BTC rally are already in place: lower expected rates and already-loose financial conditions.
The third – capital flowing from equities, technology, and AI markets into crypto – has yet to materialize. For instance, corporate Bitcoin treasury activity has turned negative, and stablecoin supply remains below its May record. Bitfinex warned that in such a thin market, even relatively small changes in flows could produce an outsized move.
Bigger Move Ahead
Some investors are, however, already looking much further ahead.
SkyBridge Capital founder Anthony Scaramucci recently told CNBC that he expects Bitcoin to climb back above $100,000, a level the cryptocurrency has not closed above since November 2025. He believes the six-digit price territory will come around the halving, scheduled to take place in less than two years.
The post Bitcoin Just Hit 8 of 12 Capitulation Signals; VanEck Thinks the Pain May Be Nearing Its End appeared first on CryptoPotato.
Crypto World
Stock Market Today: Dow Rises Ahead Of Fed Minutes; Nvidia Supplier SK Hynix Jumps On Buyback
Futures for the Dow Jones Industrial Average and the other major stock indexes traded mixed Wednesday, as Wall Street awaited the minutes from the Federal Reserve’s latest policy meeting. Meanwhile, Nvidia (NVDA) supplier SK Hynix (SKHY) and Moderna (MRNA) surged on the stock market today. Ahead of Wednesday’s open, Dow futures rose 0.1%, while S&P 500 futures inched higher. Nasdaq-100…
Copyright ©2026 Investor’s Business Daily, LLC. All rights reserved. 87990cbe856818d5eddac44c7b1cdeb8
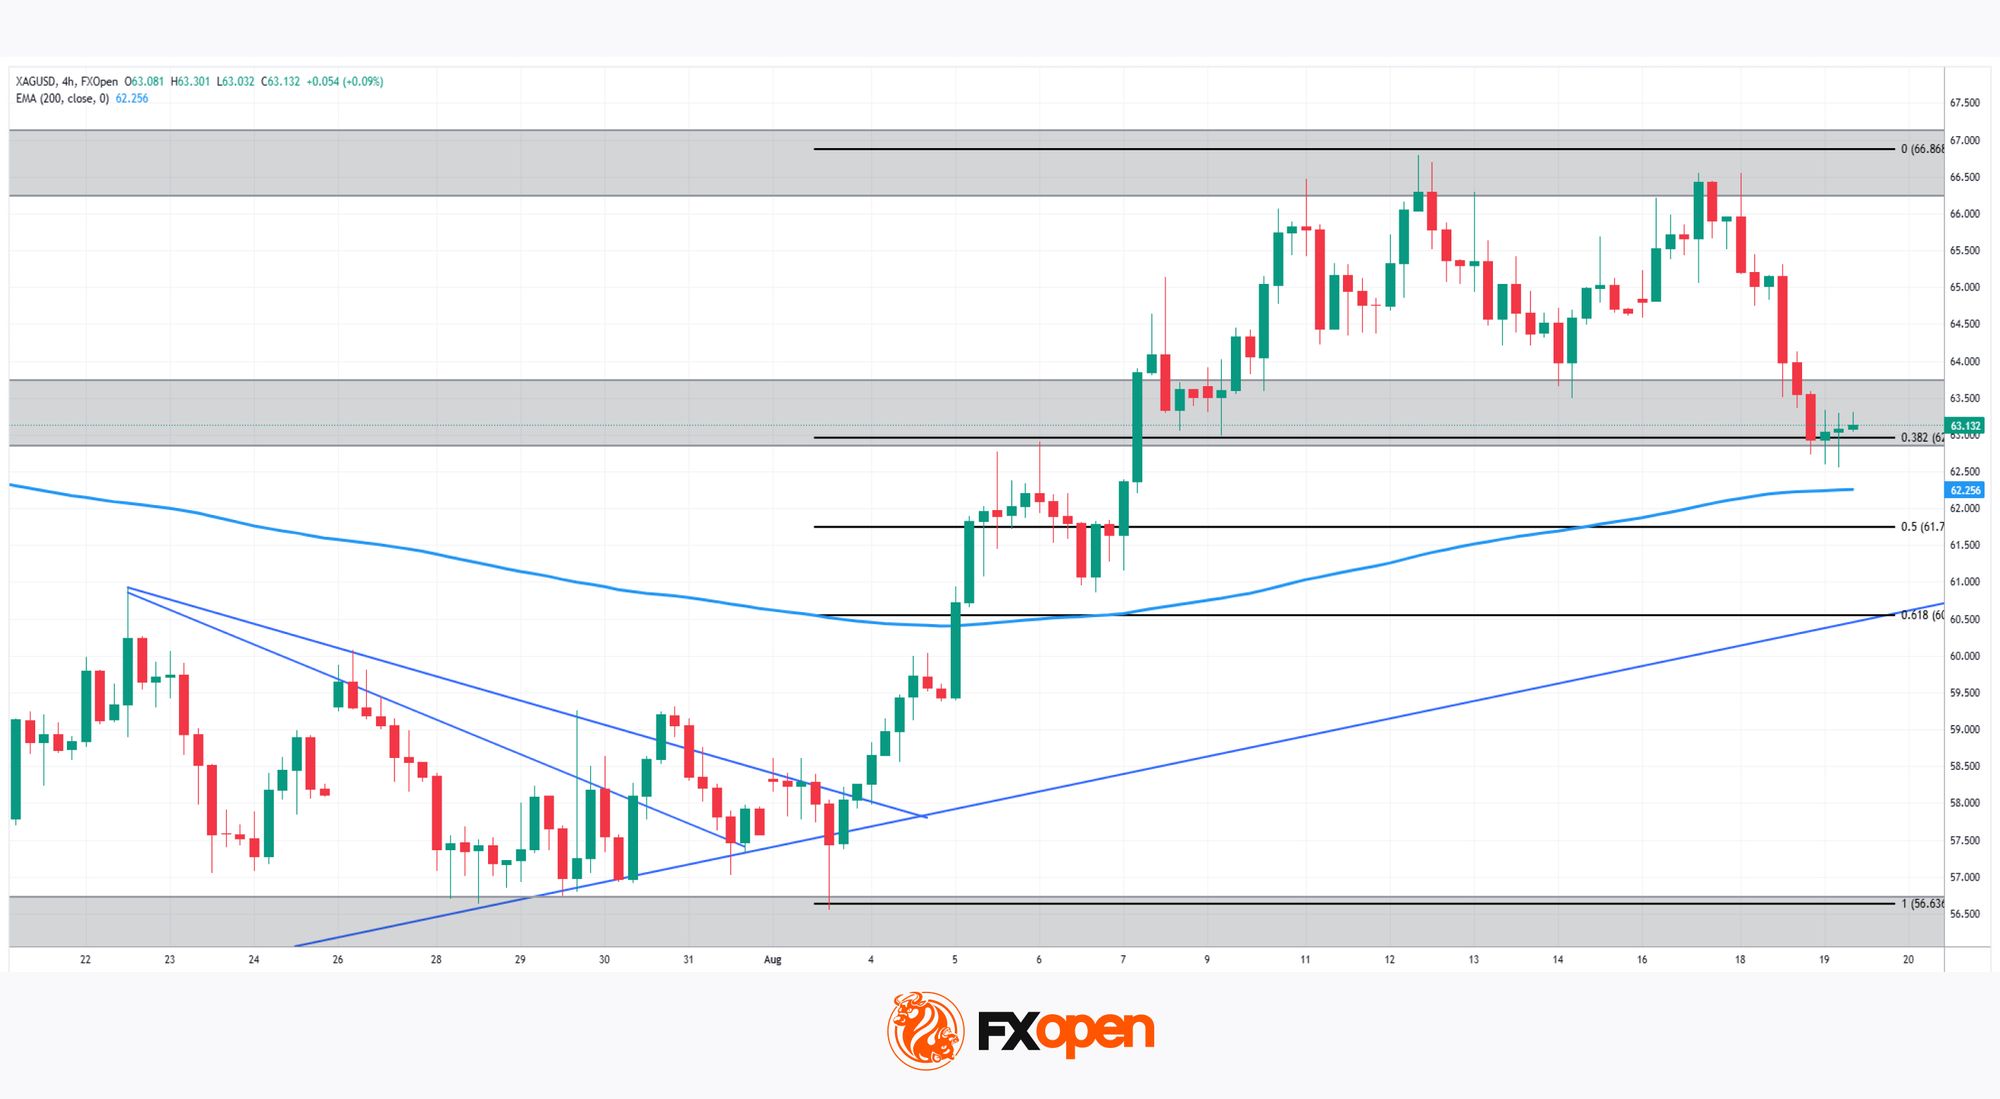
Silver has had one of its strongest months in years, but this week’s price action shows just how fragile precious metals rallies can be when bond markets get nervous. The metal surged nearly 10% last week after July’s Non-Farm Payrolls badly missed expectations, printing a loss of 23,000 jobs, prompting markets to price out any chance of a September Fed hike and reviving safe-haven demand.
That momentum reversed on Tuesday, however, with silver dropping toward $64 as global bond yields spiked to multi-year highs on mounting concerns over government spending and persistent inflationary pressures. Rising oil prices added to the unease, keeping inflation risks firmly in focus even as rate-hike expectations continue to fade.
Beneath the volatility, the structural picture remains supportive: silver continues to draw solid demand from the green energy transition, solar panels, electric vehicles, and AI data centre infrastructure, all keeping a floor under prices. All eyes now turn to the Fed’s July meeting minutes and Chair Kevin Warsh’s remarks at Jackson Hole, both expected to offer fresh clues on the path ahead for rates.
Technical Analysis of XAG/USD
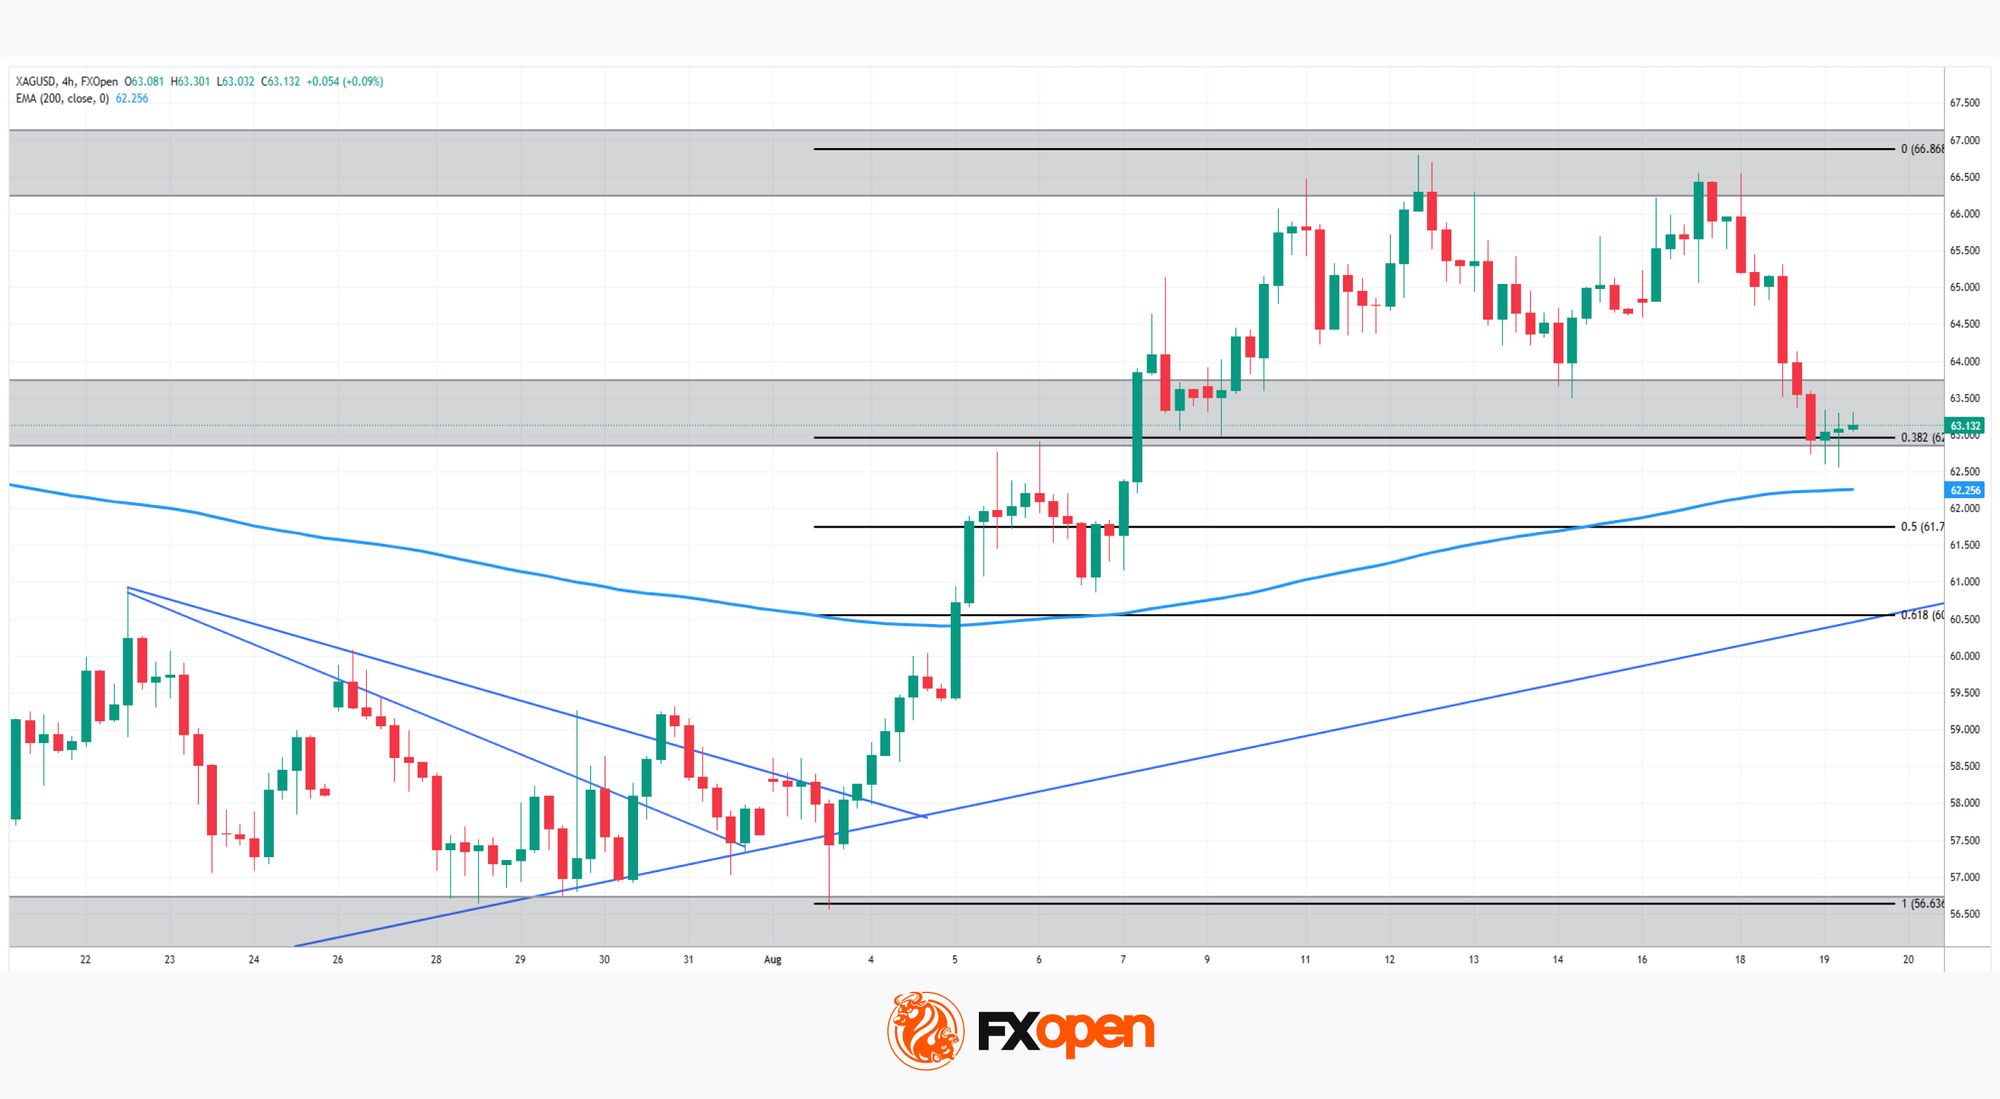
As XAG/USD chart shows, silver broke above its descending trendline from June’s highs in early August, a genuine shift after weeks of decline, and has since been holding above the 0.382 Fibonacci retracement near 62.88, right where the 200-period EMA also sits nearby at 62.27. The broader recovery has been building on an ascending trendline off the mid-July lows.
Bullish Scenario
Should buyers defend this 0.382-EMA confluence and push higher, the path would open toward a retest of the 66.73 highs, the 0 Fibonacci level marking the origin of the entire decline. A confirmed break above that zone would signal the correction is fully over.
Bearish Scenario
Conversely, a break below the 0.382 retracement and the ascending trendline would expose the 0.5 level near 61.69, with a deeper slide risking a retest of the 0.618 retracement around 60.49, or even the triangle apex near 56.64 if selling pressure accelerates.
With price sitting right at the intersection of a reclaimed trendline, the 200-period EMA, and a key Fibonacci level, silver looks poised for a decisive move, will this recovery extend toward fresh monthly highs, or does the recent bond market turmoil drag the metal back into its prior range?
Start trading commodity CFDs with tight spreads (additional fees may apply). Open your trading account now or learn more about trading commodity CFDs with FXOpen.
This article represents the opinion of the Companies operating under the FXOpen brand only. It is not to be construed as an offer, solicitation, or recommendation with respect to products and services provided by the Companies operating under the FXOpen brand, nor is it to be considered financial advice.
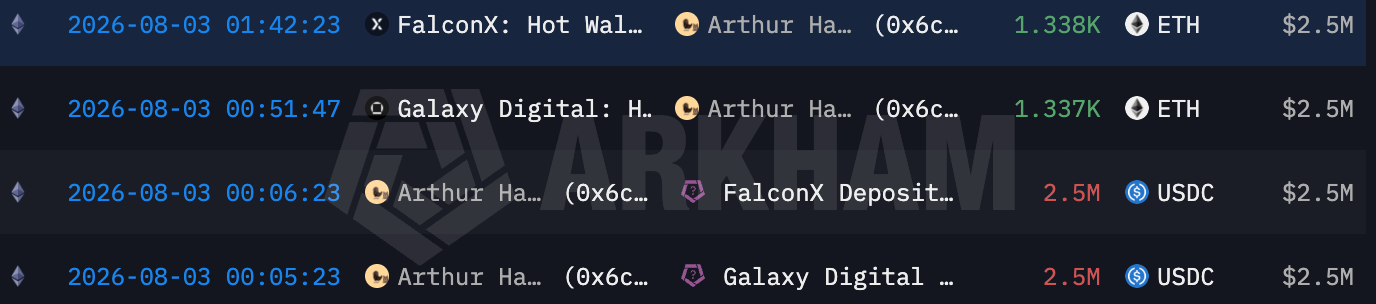
On the last Friday of July, an Ethereum wallet linked by on-chain analysts to Arthur Hayes suddenly started selling.
Within minutes, 2,364 ETH was sent to Cumberland and Galaxy Digital, two major crypto trading firms. The wallet sold at around $1,821 per ETH, crystallizing a loss of roughly $241,000 on coins it had bought only weeks earlier.
Then came the strange part.
Two days later, the same wallet started buying Ethereum again at roughly $1,869. By Monday evening, on August 3, 2026, it had accumulated around 2,676 ETH — leaving it with more ETH than it held before the sell-off.
Whatever prompted the wallet to exit on Friday appeared to have changed over the weekend.
Why would an experienced crypto investor like Arthur Hayes sell at a loss, only to buy back even more days later?

Lookonchain caught the transactions within hours and posted the line that has followed the BitMEX co-founder for years:
“Arthur Hayes bought high and sold low again!”
That word, “again,” carries a serious accusation. It implies a pattern. It implies that crypto’s most quoted macro commentator, a man whose essays can move markets, is also its most reliable inverse indicator.
The Jim Cramer of crypto, as the meme goes.
But jokes are cheap. Receipts are not. So BeInCrypto pulled every transaction from the three wallets attributed to Hayes for the past two years and eight months, priced every trade, matched every sell against the buys that came before it, and added it all up.
The answer: the meme is half true. The half that is true cost him about $2.47 million. And the most interesting finding is not where he loses. It is the one place he wins.
The Scoreboard: One Winner, Six Losers
The wallets lost roughly $2.47 million overall. ENA — where Hayes is an adviser and token holder — was the only profitable token, offsetting about $5.5 million in losses elsewhere.
Meanwhile, if you consider just the closed reconstructed trades, the result is a loss of $2.24 million.
Include the open positions our model tracks, roughly 8,165 ETH purchased inside the window at an average of $1,884 and 25.3 million ENA at an average of $0.091, both currently underwater, and the total reaches minus $2.47 million on roughly $92 million put to work.
Note that the wallets hold more than the model tracks, about 10,800 ETH and 28.45 million ENA per Arkham. The gaps are pre-window coins, and 3.1 million ENA received from an Ethena multisig on August 10, none of which has a purchase price in our window, so none enters the profit math.
The trade record: 15 wins, 25 losses.
Token by token, the picture is stark.
- ETH lost a reconstructed $2.04 million.
- SYN lost $1.41 million.
- LDO lost $1.26 million.
- ETHFI lost $474,000.
- PEPE lost $152,000.
- PENDLE lost $124,000.
One token made money: ENA, up $3.23 million.

ENA is the governance token of Ethena. It is a project Hayes formally advises, holds vested tokens in, and promotes relentlessly.
On the six tokens where he is just another trader with a strong opinion, the wallets lost about $5.5 million. On the one token where he has an insider’s seat, he made $3 million.
The ETH Pattern: Sell Low, Rebuy High
Ethereum is where the meme earns its keep because of the repeated pattern of buying high and selling low. Our findings show that Hayes-linked wallets sold into short-term fear, then bought back after prices recovered, sometimes at a steep premium.
The wallets traded ETH 34 times in our window, and the choreography repeats: sell into fear, watch the market steady, buy back at a worse price.
The clearest example ran through August 2025.
On August 1, with Hayes publicly cautious on the macro picture, the wallet deposited 2,373 ETH to two trading desks, a sale Lookonchain tracked at about $3,507 per coin. Ethereum ignored the fear and ran almost straight up.
On August 10, the same wallet bought 1,500 ETH back at around $4,252. Same asset, roughly $745 per coin more expensive. On the rebought coins alone, the exit and re-entry cost roughly $1.1 million.
The July 2026 episode that opened this article follows the identical script, compressed into a weekend. Sell 2,364 ETH at a $241,000 realized loss on Friday.
Rebuy more than that by Monday. The loss purchased nothing: no protection, no dry powder, no changed thesis. Both transactions sit on the chain for anyone to verify, including the 1,167 ETH transfer to Cumberland.
Each individual sale had a reason. A scary macro print, a tariff headline, a liquidity worry, all articulated in Hayes’s essays. The problem is not any single decision.
It is that his fear operates on a weekend timescale while Ethereum’s moves operate on a monthly one. The wallets kept selling dips and rebuying recoveries, and the running total of ETH trading only found new lows.

The Counterexample: He Traded ENA Brilliantly, Once
Fairness demands the ENA chapter, because it was a clear exception.
Hayes-linked wallets timed the token far better than other trades, generating millions in profit — though the latest ENA position is already underwater.
In late November 2024, the wallets spent about $11.2 million, accumulating 16.79 million ENA at around $0.67 through Binance, Wintermute, and Flowdesk.
Then, unusually, Hayes waited. Three weeks later, on December 21, two hours after tweeting praise of Ethena, the wallet moved $8.4 million of ENA to Binance and sold near $1.19, roughly 78% above his $0.67 entry a month earlier. Our reconstruction credits about $3.7 million of realized profit on that day’s sale.
The criticism that followed concerned ethics: promoting a token publicly and selling into the pump within two hours. Nobody called the trade dumb.
Across our full window, his ENA buys were followed by an average 30% outperformance within a month, and his ENA sells preceded 22% underperformance. Both sides of the trade, timed well, repeatedly.
Why is Arthur Hayes Good With ENA Trades?
Two structural reasons. First, proximity. Maelstrom advises Ethena. Second, patience, but only here.
He held the November position for weeks, while his ETH conviction has a shelf life of days.
The 2026 sequel is going worse. Lookonchain data shows he bought 15.8 million ENA at $0.23 in February and sold 3.6 million at $0.14.
And in the few days before publication, the wallets went back in hard. They made a run of market purchases between August 1 and August 6 through Binance, Wintermute, Flowdesk, and Galaxy Digital, totaling roughly 25 million ENA at $0.08 to $0.09, timed directly into Ethena’s August 5 unlock of 172 million new tokens.

A further 3.1 million ENA arrived on August 10 from an Ethena multisig, consistent with a vesting distribution, which we exclude from his buys. ENA trades at $0.082 as we publish, 94% below its 2024 peak, and the purchased tranche is already underwater.

The Tuition Bills
The smaller trades show the same problem: Hayes-linked wallets repeatedly bought narratives too late or exited too early, turning strong convictions into heavy losses.
The worst single entry in the file is SYN. The wallets put $2 million into Synapse, watched it lose more than half its value against the market within a month, and finally flushed the position on August 1, 2026, selling 6.16 million SYN for $658,000. 33 cents back on every dollar in.

The most Cramer-shaped moment belongs to PENDLE. On September 12, 2024, Hayes tweeted that he was betting PENDLE would reach $10.
Nine days later, the wallets sold 1.2 million PENDLE, about 61% of the position, at around $3.52, including one tranche dumped at a 36% loss. After the sale, PENDLE rallied 24% almost immediately.
The Verdict: Not Cramer, Something More Specific
Here is a twist. Hayes appears to have a real edge when entering trades; his buys outperform over the next month, but poor exits and weak long-term holds repeatedly erase that advantage.
For every purchase in the dataset, we asked one question. What did that token do over the next 30 days, compared with what it usually does?
The comparison matters. Every token has a typical 30-day move across our period, its drift.
Against that bar, Hayes, the buyer, is genuinely good. The tokens he bought went on to beat their own drift by about 10% over the following month, weighted by how much money he put in.
His nose for what is about to run is real. It is also why blindly doing the opposite of Hayes, the strategy Crypto Twitter jokes about, would have worked worse than the joke assumes.
The catch is that the 10% is what his entries were worth if held for a month. He almost never held for a month. The Friday-night sale, the PENDLE dump nine days after his own price target, and the ETH buyback at $4,252. Each of those exits cashed in the edge early or converted it into a realized loss.
And when he did hold on, the market eventually came for him anyway. Stretch the same measurement to 90 days, and it inverts. His buys trailed their drift by 20.5% within a quarter. The strength he buys is real but old. It pays for about a month after he arrives, then dies.
Put those numbers side by side, and you have the whole trader. His instincts run on a 30-day clock. But his nerves run on a 3-day clock. His losses live in the gap between the two.

That gap is the scoreboard. The one-month edge makes every individual entry defensible, which is why no single Hayes trade ever looks stupid in isolation. The three-day nerves mean he keeps interrupting his own best ideas.
Is Arthur Hayes Crypto’s Jim Cramer?
So is he a profitable trader? On the evidence of the visible wallets, no.
Is he crypto’s Jim Cramer? Also, no, and the difference matters.
Cramer’s joke is that he is simply wrong. Hayes is not wrong. He is early on a one-month clock and gone either too soon or too late.
One final point of fairness. Whatever his trading record says, Hayes remains structurally long Ethereum.
Beyond the ETH the wallets hold outright, Arkham shows roughly 3,176 eETH and 1,167 weETH in staked positions, taking his total exposure to about 15,200 ETH equivalent, worth around $28.5 million.
He trades around the position badly, but he has never abandoned it. And a $2.47 million trading loss is a rounding error against a net worth Arkham estimates at $200 million to $350 million, most of it built at BitMEX, the exchange he co-founded, which announced on July 23 that it will shut down permanently on September 23 after 11 years.
The wallets we examined hold $33 million as of writing. Hayes never bets enough to get hurt, and nothing here speaks to how Maelstrom’s fund, which we cannot see, performs.
His trades are not uniquely bad. They are ordinarily bad, narrated in extraordinary essays, and permanently on display.

How we Read Arthur Hayes On-Chain Trades
Everything on a blockchain is public and permanent. We analyzed three Ethereum wallets tagged to Arthur Hayes by Arkham Intelligence, and trackers such as Lookonchain have reported on them as his for over two years:
- 1. 0x534a0076fb7c2b1f83fa21497429ad7ad3bd7587
- 2. 0xa86e3d1c80a750a310b484fb9bdc470753a7506f
- 3. 0x6cd66DbdFe289ab83d7311B668ADA83A12447e21
Hayes has replied to posts about these wallets. He has never said they are not his. He has also never formally confirmed ownership, which is why the article describes the “wallets attributed to Hayes” rather than asserting ownership.
We downloaded the complete history of all three wallets, roughly 17,000 transfers, and then cleaned it. Out went thousands of scam deposits from address-poisoning attackers, including 624 fake versions of “USDC” built with lookalike characters.
Out went staking transactions, which move tokens without selling them. Also, out went roughly $35 million of tokens that arrived from vesting contracts, because Hayes advises projects including Ethena and Ether.fi through his fund Maelstrom, and receiving a token salary is not the same as buying with conviction.
What survived were 124 real trades between December 2023 and August 14, 2026. 82 buys worth $92 million. 42 sells worth $73 million, and seven tokens: ETH, ENA, PENDLE, ETHFI, SYN, LDO, and PEPE.
For every sell, we matched the coins against the earliest unsold purchases before it, the standard first-in-first-out method, and asked a simple question. Did this trade make money?
One honest note. We price trades at daily closing prices, and actual fills differ slightly.
Every figure here is a careful reconstruction, not an audit. The direction of the numbers is robust.
BeInCrypto has contacted Hayes and the Maelstrom fund for comment and will update this article with any response.
Disclaimer: This article is based on public blockchain data and third-party attribution. It is provided for informational purposes and is not investment advice.
The post Is Arthur Hayes Crypto’s Jim Cramer? 124 Trades Show a Clear Pattern appeared first on BeInCrypto.

Roskam Foods centralizes cereal, granola manufacturing

Why the S&P 500’s Path to 9,000 Runs Into Trouble in 2027

Reading Rainbow’s Mychal Threets Says He’s ‘Not Okay’





-

 Fashion5 days ago
Weekend Open Thread: Ann Taylor
-
 Sports6 days ago
This U.S. Amateur is a glimpse into golf’s future in more ways than you think
-
 NewsBeat4 days ago
Myanmar says over 300,000 Rohingya refugees verified for repatriation as exodus enters ninth year
-
 Tech5 days ago
11 Ways to Rank Your Videos
-

 Sports4 days ago
Birmingham 2026: Day 6 Timetable for Irish Athletes
-

 Politics4 days ago
SEQ Code: The Three Letter Boarding Pass Code That Could Give You The Worst Seat
-

 Sports7 days ago
DeQuan Jones in ‘high spirits’ after successful leg surgery
-

 Tech6 days ago
DeepSeek Harness launches as open source rival to Claude Code, alongside V4-Pro on API with higher prices
-
 Crypto World7 days ago
Perplexity AI Predicts an XRP Scenario Few Analysts Are Discussing
-

 Crypto World2 days ago
OCC Greenlights Trump Family Crypto Firm for Trust Charter
-
 Entertainment7 days ago
2026’s Most Ambitious Fantasy Movie Officially Scores Sequel Update
-
 Entertainment7 days ago
All 10 Hayao Miyazaki Fantasy Movies, Ranked
-
 Entertainment7 days ago
Travis Kelce Breaks Silence On ‘Crazy’ Taylor Swift Wedding
-
 Entertainment5 days ago
10 Netflix Shows That Quietly Became Modern Classics
-

 Fashion5 days ago
Weekly News Update, 8.14.26 – Corporette.com
-

 Tech1 day ago
Qwen3.8-27B runs frontier-class coding agents and reasoning locally, no cloud API required
-

 Fashion6 days ago
The Details Do the Dressing
-
 Entertainment4 days ago
Marvel Studios Reveals New X-Men Cast Including Adam Driver and Sadie Sink
-
 Tech4 days ago
Every fusion startup that has raised over $100M
-
 Business7 days ago
Nebius shares soar 22% as AI demand powers revenue beat
You must be logged in to post a comment Login